massmutual premier core bond · pdf filemassmutual premier core bond fund barings llc i: mczzx...
TRANSCRIPT
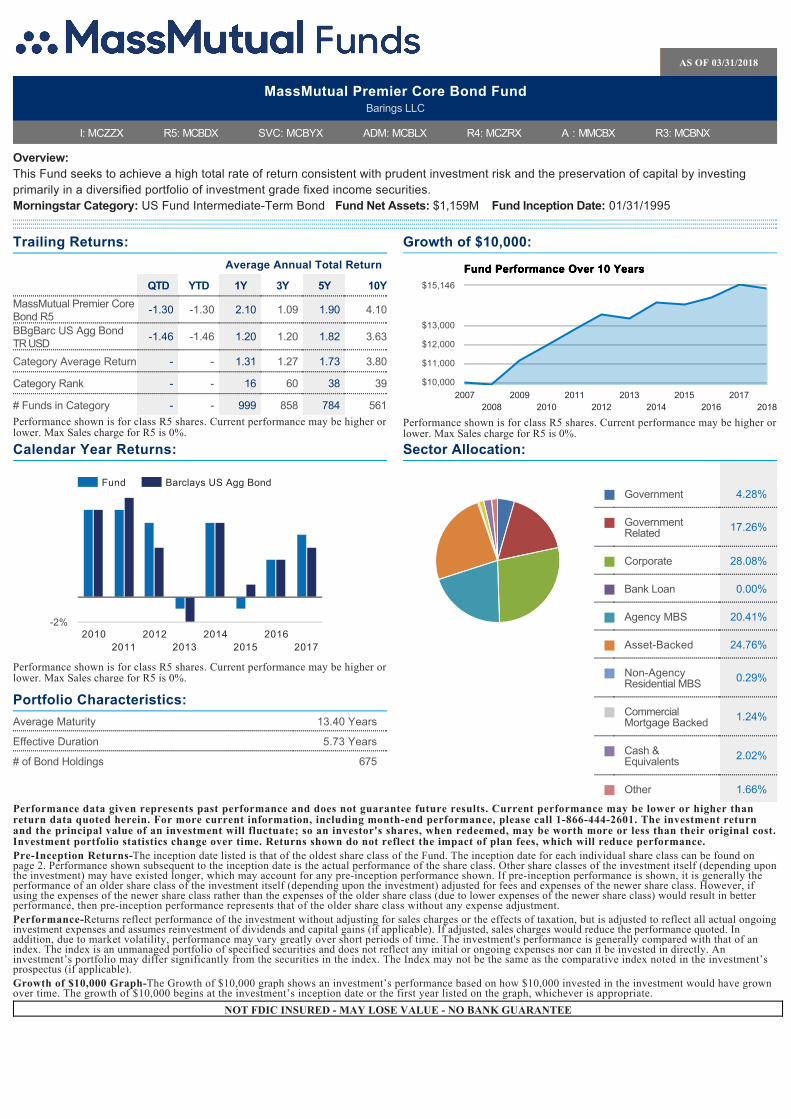
Trailing Returns:
Average Annual Total Return
QTD YTD 1Y 3Y 5Y 10Y
MassMutual Premier CoreBond R5
-1.30 -1.30 2.10 1.09 1.90 4.10
BBgBarc US Agg BondTR USD
-1.46 -1.46 1.20 1.20 1.82 3.63
Category Average Return - - 1.31 1.27 1.73 3.80
Category Rank - - 16 60 38 39
# Funds in Category - - 999 858 784 561
Performance shown is for class R5 shares. Current performance may be higher orlower. Max Sales charge for R5 is 0%.
Growth of $10,000:
Performance shown is for class R5 shares. Current performance may be higher orlower. Max Sales charge for R5 is 0%.
Government 4.28%
GovernmentRelated 17.26%
Corporate 28.08%
Bank Loan 0.00%
Agency MBS 20.41%
Asset-Backed 24.76%
Non-AgencyResidential MBS 0.29%
CommercialMortgage Backed 1.24%
Cash &Equivalents 2.02%
Other 1.66%
Sector Allocation:Calendar Year Returns:
Performance shown is for class R5 shares. Current performance may be higher orlower. Max Sales charge for R5 is 0%.
Portfolio Characteristics:
Average Maturity 13.40 Years
Effective Duration 5.73 Years
# of Bond Holdings 675
Overview:This Fund seeks to achieve a high total rate of return consistent with prudent investment risk and the preservation of capital by investingprimarily in a diversified portfolio of investment grade fixed income securities.Morningstar Category: US Fund Intermediate-Term Bond Fund Net Assets: $1,159M Fund Inception Date: 01/31/1995
Performance data given represents past performance and does not guarantee future results. Current performance may be lower or higher thanreturn data quoted herein. For more current information, including month-end performance, please call 1-866-444-2601. The investment returnand the principal value of an investment will fluctuate; so an investor's shares, when redeemed, may be worth more or less than their original cost.Investment portfolio statistics change over time. Returns shown do not reflect the impact of plan fees, which will reduce performance.Pre-Inception Returns-The inception date listed is that of the oldest share class of the Fund. The inception date for each individual share class can be found onpage 2. Performance shown subsequent to the inception date is the actual performance of the share class. Other share classes of the investment itself (depending uponthe investment) may have existed longer, which may account for any pre-inception performance shown. If pre-inception performance is shown, it is generally theperformance of an older share class of the investment itself (depending upon the investment) adjusted for fees and expenses of the newer share class. However, ifusing the expenses of the newer share class rather than the expenses of the older share class (due to lower expenses of the newer share class) would result in betterperformance, then pre-inception performance represents that of the older share class without any expense adjustment.Performance-Returns reflect performance of the investment without adjusting for sales charges or the effects of taxation, but is adjusted to reflect all actual ongoinginvestment expenses and assumes reinvestment of dividends and capital gains (if applicable). If adjusted, sales charges would reduce the performance quoted. Inaddition, due to market volatility, performance may vary greatly over short periods of time. The investment's performance is generally compared with that of anindex. The index is an unmanaged portfolio of specified securities and does not reflect any initial or ongoing expenses nor can it be invested in directly. Aninvestment’s portfolio may differ significantly from the securities in the index. The Index may not be the same as the comparative index noted in the investment’sprospectus (if applicable).Growth of $10,000 Graph-The Growth of $10,000 graph shows an investment’s performance based on how $10,000 invested in the investment would have grownover time. The growth of $10,000 begins at the investment’s inception date or the first year listed on the graph, whichever is appropriate.
NOT FDIC INSURED - MAY LOSE VALUE - NO BANK GUARANTEE
MassMutual Premier Core Bond FundBarings LLC
I: MCZZX R5: MCBDX SVC: MCBYX ADM: MCBLX R4: MCZRX A : MMCBX R3: MCBNX
AS OF 03/31/2018
Fund Performance Over 10 YearsFund Performance Over 10 Years
20072008
20092010
20112012
20132014
20152016
20172018
$10,000
$11,000
$12,000
$13,000
$15,146
Fund Barclays US Agg Bond
20102011
20122013
20142015
20162017
-2%

Credit Quality:
AAA% 47.20%
AA% 4.61%
A% 14.59%
BBB% 27.87%
BB% 5.73%
B% 0.00%
Below B% 0.00%
Not Rated / Other 0.00%
Risk Statistics:
FUND BENCHMARK
Standard Deviation 2.94 2.93
Alpha 0.13 0.00
Beta 0.96 1.00
R2 92.24 1.00
Tracking Error 0.83 0.00
Sharpe Ratio 0.56 0.54
Upside Capture 101.85 100.00
Downside Capture 100.66 100.00
Batting Average 65.00 -
Expense Ratios:
INCEPTION DATE GROSS EXPENSE NET EXPENSE
I 12/03/2010 0.42% 0.42%
R5 09/30/1994 0.52% 0.52%
Svc 01/02/1998 0.62% 0.62%
Admin 05/03/1999 0.72% 0.72%
A 04/01/2014 0.87% 0.87%
R4 01/02/1998 0.97% 0.97%
R3 12/31/2002 1.12% 1.12%
Portfolio Managers:
Managed Since
William M. Awad, IIIBarings LLC Apr. 2005
David L. NagleBarings LLC Sep. 1994
Charles S. SanfordBarings LLC Jun. 2006
Douglas M. Trevallion, IIBarings LLC Oct. 2008
Fund Rankings:
Overall Rating 3 Year 5 Year 10 Year
MorningstarRatingTM
Share Class R5 R5 R5 R5
Funds InCategory 999 858 784 561
Morningstar Rating™ Category-Intermediate Term Bond. For each investment with at least a three-year history, Morningstar calculates aMorningstar Rating™ based on how an investment ranks on a Morningstar Risk-Adjusted Return measure against other investments in thecategory. This measure takes into account variations in an investment’s monthly performance after adjusting for sales loads (except for load-waived A shares),redemption fees, and the risk-free rate, placing more emphasis on downward variations and rewarding consistent performance. The top 10% of investments in eachcategory receive 5 stars, the next 22.5% receive 4 stars, the next 35% receive 3 stars, the next 22.5% receive 2 stars and the bottom 10% receive 1 star. The OverallMorningstar Rating for an investment is derived from a weighted average of the ratings for the three-, five- and ten-year (if applicable) time periods. TheMorningstar percentile ranking is based on the fund’s total-return percentile rank relative to all funds that have the same category for the same time period. Thehighest (or most favorable) percentile rank is 1%, and the lowest (or least favorable) percentile rank is 100%. Morningstar total return includes both income andcapital gains or losses and is not adjusted for sales charges. © 2018 Morningstar, Inc. All Rights Reserved. The information contained herein: (1) is proprietary toMorningstar and/or its content providers; (2) may not be copied or distributed; and (3) is not warranted to be accurate, complete or timely. Neither Morningstar norits content providers are responsible for any damages or losses arising from any use of this informationCredit Quality-Does not include cash and equivalents and represents the grading of a debt security with respect to the issuer's ability to meet interest and principalrequirements in a timely manner. Ratings are measured on a scale that generally ranges from AAA (highest) to D (lowest). Issues rated AAA, AA, A and BBB areconsidered investment grade. Bonds, including government and government-related, not rated by a NRSRO are included in the Not Rated category. Higher-rated bondsgenerally provide lower returns and greater safety.Investment Risks-The Fund’s Principal Risks include- Bank Loans Risk, Below Investment Grade Fixed Income Securities Risk, Cash Position Risk, ConvertibleSecurities Risk, Credit Risk, Derivatives Risk, Dollar Roll and Reverse Repurchase Agreement Transaction Risk, Fixed Income Securities Risk, Foreign Investment;Emerging Markets; Currency Risk, Frequent Trading/Portfolio Turnover Risk, Inflation Risk, Leveraging Risk, Liquidity Risk, Management Risk, Market Risk,Mortgage-and Asset-Backed Securities Risk, Repurchase Agreement Risk, U.S. Government Securities Risk, Valuation Risk, When-Issued, Delayed Delivery, TBA andForward Commitment Transaction Risk. Please refer to the summary prospectus ((a copy can be obtained by sending an email to [email protected])) formore information on the specific risks.Risk Statistics-Alpha is a measure of the difference between a fund’s actual returns and its expected performance, given its level of risk as measured by beta. Apositive alpha figure indicates the fund has performed better than its beta would predict. In contrast, a negative alpha indicates the fund’s underperformance, giventhe expectations established by the fund’s beta. Beta is a measure of sensitivity to market movements. The beta of the market is 1.00. A beta of 1.10 shows that thefund’s excess return is expected to be 10% better than the market’s excess return in an up market or 10% worse in a down market. A beta of .85 indicates that thefund’s excess return is expected to perform 15% less than the market’s excess return during up markets and 15% greater during down markets. Standard Deviation isa statistical measurement, which for a mutual fund depicts how widely the returns varied over a certain period of time. When a fund has a high standard deviation,performance is wide, implying greater volatility. R-squared (R2) measures the degree of relationship between the performance of the fund and that of the index. Thehigher the R- squared, the more related the fund’s performance is to its index.Tracking Error is also known as active risk and is the degree to which the strategydiffered from its index or benchmark. The higher the Tracking Error, the more the fund deviated from its index. Sharpe Ratio measures risk adjusted performance; itis calculated as the real total return of the fund (total return-risk free rate) divided by the risk of the fund (standard deviation). Upside/downside capture showswhether a given fund has outperformed--gained more or lost less than--a broad market benchmark during periods of market strength and weakness, and if so, by howmuch. An upside capture ratio over 100 indicates a fund has generally outperformed the benchmark during periods of positive returns for the benchmark. A downsidecapture ratio of less than 100 indicates that a fund has lost less than its benchmark in periods when the benchmark has been in the red. Batting Average is a measureof a manager’s ability to consistently beat its benchmark over the trailing five-year period.Fixed Income Characteristics-Average Duration represents the interest rate sensitivity of a fixed income fund. For example, if a fund's duration is five years, a 1%increase in interest rates would result in a 5% decline in the fund's price. Similarly, a 1% decline in interest rates would result in a 5% gain in the fund’s price. Maturityis the dollar-weighted average of all the current maturities of the bonds in a portfolio. The longer the average maturity, the more sensitive the portfolio will be tochanges in interest rates. Average Coupon is the dollar-weighted average of all the stated interest rates of the bonds in a portfolio. Credit Quality represents thegrading of a debt security with respect to the issuer's ability to meet interest and principal requirements in a timely manner. Issues rated AAA, AA, A and BBB areconsidered investment grade. Bonds not rated by a NRSRO are included in the Not Rated category. Higher-rated bonds generally provide lower returns and greatersafety.© 2018 Massachusetts Mutual Life Insurance Company (MassMutual), Springfield, MA. All rights reserved. www.massmutual.com Principal Underwriter: MMLDistributors, LLC. (MMLD) Member FINRA and SIPC (www.FINRA.org and www.SIPC.org) MMLD is a subsidiary of Massachusetts Mutual Life Insurance Company,100 Bright Meadow Blvd., Enfield, CT 06082. Investment advisory services provided to the Funds by MML Investment Advisers, LLC.Investors should consider an investment option’s objectives, risks, fees, and expenses carefully before investing. This and other information can befound in the applicable prospectuses or summary prospectuses, which are available from MassMutual by calling 1-866-444-2601. Please read themcarefully before investing.RS-37877-02
NOT FDIC INSURED - MAY LOSE VALUE - NO BANK GUARANTEE
MassMutual Premier Core Bond Fund AS OF 03/31/2018

Past performance does not guarantee future results. You can lose money, including loss of principal, by investing in this fund. Investors should carefully consider investment objectives, risks, charges and expenses. This and other important information is contained in the fund prospectuses and summary prospectuses, which can be obtained from www.massmutualfunds.com and should be read carefully before investing. A list of the Fund’s holdings can also be obtained from www.massmutualfunds.com. Ratings are measured on a scale that generally ranges from AAA (highest) to D (lowest). Issues rated AAA, AA, A and BBB are considered investment grade. These materials and the platform of investments made available by MassMutual are offered without regard to the individualized needs of any plan, its participants, or beneficiaries. These materials are not intended as impartial investment advice or to give advice in a fiduciary capacity to any plan. © 2018 Massachusetts Mutual Life Insurance Company (MassMutual), Springfield, MA. All rights reserved. www.massmutual.com. Principal Underwriter: MML Distributors, LLC (MMLD). Member FINRA and SIPC (www.FINRA.org and www.SIPC.org). MMLD is a subsidiary of Massachusetts Mutual Life Insurance Company, 100 Bright Meadow Blvd., Enfield, CT 06082. Investment advisory services provided to the Funds by MML Investment Advisers, LLC.
RS-41596-05
Quarterly Due Diligence Investment Commentary
AS OF 03/31/2018
MassMutual Premier Core Bond Fund Barings LLC
NOT FDIC INSURED - MAY LOSE VALUE - NO BANK GUARANTEE
Fund Overview
Premier Core Bond seeks a high total rate of return consistent with prudent investment risk and capital preservation from a diversified portfolio of primarily investment-grade bonds. The portfolio includes, but is not limited to, corporate, government and agency, mortgage-backed securities (MBS), and asset-backed securities (ABS). Barings, LLC (Barings) generates excess return from security selection and sector positioning while generally matching (within 10%) the benchmark’s duration exposure.
There was a pickup in bond volatility as the Bloomberg Barclays U.S. Aggregate Bond Index lost 1.46% in the quarter.
The U.S. Treasury 10-year note yield rose 0.33%, while the 2-year note yield rose 0.39%.
U.S. Treasury and government-related sectors of the benchmark outperformed comparable-maturity credit sectors.
Investment-grade corporate bonds underperformed the most, while non-benchmark high-yield issues fared better.
The Fund benefited from relative strength displayed by its ABS holdings and underweight to Agency MBS.
Quarterly Market Commentary
Rising bond yields during the quarter resulted from investor concerns over a higher U.S. fiscal deficit and inflation expectations. Inflation sentiment tempered in March, with a modest core Consumer Price Index (CPI) report leading longer-maturity yields to retreat modestly. Headline trade tensions between the U.S. and China also had an impact. The Federal Reserve Board (the Fed) implemented another 0.25% federal funds rate hike, bringing the Fed target rate to 1.50%-1.75%. U.S. Treasury and government-related issues outperformed other credit sectors, while corporate investment-grade bonds underperformed the most. Non-benchmark corporate high-yield bonds fared better. U.S. Agency MBS, which are sensitive to rising rates, were the next-weakest benchmark sector, followed by ABS and commercial MBS.
Performance Drivers
The Fund delivered relatively favorable performance with the pickup in volatility and declining bond values. As noted above, ABS issues outperformed other credit sectors – such as corporate bonds and Agency MBS – as the shorter-maturity profile of these issues afforded more stability amid both rising interest rates and rising yield spread levels. The Fund’s selective holdings within the asset class – which include a higher weight of issues not contained in the benchmark, such as student loans and industrial/commercial-oriented issues – generated value-added performance. The Fund’s ongoing underweight to the Agency MBS sector also contributed favorably to performance for the quarter. Barings has maintained the underweighted position as a defensive stance, given potentially negative impacts from added supply as the Fed progresses on its program to reduce its bond holdings. For the quarter, the sector reacted negatively to higher rates and the Fund’s positioning was a benefit.
Underperformance of the investment-grade corporate sector detracted because of the Fund’s higher-than-benchmark exposure to this sector. Even so, the Fund’s recent positioning to be slightly more defensive to the sector proved beneficial. Additionally, the Fund holds about 4% exposure to below-investment-grade corporate bonds (high-yield) and the relative benefit from these issues during the quarter offset weakness from other investment-grade holdings. The Fund’s underweight to the U.S. Treasury and government sector also detracted for the quarter, as non-government sectors underperformed.

[This page intentionally left blank]