mass.migration - massinc is a 501(c) 3, tax exempt, charitable organization that accepts...
TRANSCRIPT

MASS.migration
MassINCTHE MASSACHUSETTS INSTITUTE FOR A NEW COMMONWEALTH
A Project of the Economic Prosperity Initiative
Publisher of CommonWealth magazine
A JOINT PROJECT OF: SPONSORED BY:
DONAHUE INSTITUTE
CA
AZ
TX
NC
FL
GA
NY
NH
CT
NJ

MassINC wishes to express its thanks to those individuals and organizations whose financial support makes our work possible.Your generosity is deeply appreciated.
MASSINC’S MISSIONThe mission of MassINC is to develop a public agenda for Massachusetts that promotes the growth and vitality of the middle class.We envision a growing, dynamic middle class as the cornerstone of a new commonwealth in which every citizen can live the American Dream. Our governing philosophy is rooted in the ideals embodied by the AmericanDream: equality of opportunity, personal responsibility and a strong commonwealth.
MassINC is a non-partisan, evidence-based organization.We reject rigid ideologies that are out of touch with the timesand we deplore the too-common practice of partisanship for its own sake.We follow the facts wherever they lead us.Thecomplex challenges of a new century require a new approach that transcends the traditional political boundaries.
MassINC is a different kind of organization, combining the intellectual rigor of a think tank with the vigorous civicactivism of an advocacy campaign. Our work is organized within four Initiatives that use research, journalism and publiceducation to address the most important forces shaping the lives of middle-class citizens:
• Economic Prosperity—Expanding economic growth and opportunity• Lifelong Learning—Building a ladder of opportunity through the continuum of learning• Safe Neighborhoods—Creating crime-free communities for all• Civic Renewal—Restoring a sense of “commonwealth”
MassINC’s work is published for educational purposes.Views expressed in the Institute’s publications are those of theauthors and not necessarily those of MassINC’s directors, staff, sponsors, or other advisors.The work should not be con-strued as an attempt to influence any election or legislative action.
MassINC is a 501(c) 3, tax exempt, charitable organization that accepts contributions from individuals, corporations,other organizations, and foundations.
ABOUT MASSINC’S ECONOMIC PROSPERITY INITIATIVE Through the Economic Prosperity Initiative MassINC works to improve the overall economic well being of Massachusetts citizens by pursuing answers to a range of economic questions. Among them: How hard are people working and for whatkinds of rewards? How secure are their futures? How healthy are our families? What are the strengths and limitations ofstate government in promoting economic activity? What is the role of the private sector? And, what are the keys to ourfuture economic success?
MassINC has a long history of work within this initiative. Past research projects include: The State of the American Dream inMassachusetts, 2002 (2002), The Changing Workforce: Immigrants and the New Economy in Massachusetts (1999), The Road Ahead:Emerging Threats to Workers, Families, and the Massachusetts Economy (1998), and Lessons Learned: 25 Years of State Economic Policy(1998). Recent articles in CommonWealth magazine include: “Mass. Production” (Summer 2003), “The Sprawl Doctor”(Spring 2003), “Life After Lucent: A region tries to adjust” (Winter 2002), and “Heritage Road, Five Years Later:TheAmerican Dream, Still Elusive in Suburbia” (Spring 2001).
All of MassINC’s research and CommonWealth articles are available free-of-charge through our website, www.massinc.org.

Robert Nakosteen, Isenberg School of Management, UMass Amherst
Michael Goodman, UMass Donahue Institute
Dana Ansel, MassINC
WITH:
Robert LaceyRebecca LovelandJames PalmaAlexandra ProshinaRachel Deyette Werkema
DECEMBER 2003
MASS.migration
MassINCTHE MASSACHUSETTS INSTITUTE FOR A NEW COMMONWEALTH
A Project of the Economic Prosperity Initiative
Publisher of CommonWealth magazine
A JOINT PROJECT OF: SPONSORED BY:
DONAHUE INSTITUTE

December 2003
Dear Friend:
MassINC is proud to present Mass.Migration, a report produced in partnership with the UMass Donahue Institute and made possible by the generous support of MassHousing.
MassINC has been interested in who is leaving Massachusetts and what it means that they are since we published The Road Ahead in 1998. After a detailed analysis of IRS migration data and Census 2000, we believe we are in a position to answer these questions definitively.The answers may surprise you.
Over the last twelve years, Massachusetts lost, on net, 213,000 residents to other states. It is important to keep in mind that this loss took place in the context of a decade of extraordinary economic expansion.This tells us that a strong job market alone is not enough to attract and keep workers.
Still, the story is not a simple one. Rather, two factors seem to be at work. Massachusetts is actually winning thecompetition for highly educated professionals with our key economic competitor states, but only narrowly. At thesame time, we are losing our middle class to other New England states, and at an accelerating rate.
Our findings on the “brain exchange” deepen and extend a discussion already underway in our civic and politicalcommunity.We should take pride in the Bay State’s ability to draw talent from around the country. But we will need to maintain and expand our narrow edge in attracting—and especially retaining—this talent if our knowledgeeconomy is to grow and thrive.
At the same time, the fact that so many middle-class families have fled—and are continuing to flee—to neighboringstates is worrisome. Middle-class families are the bedrocks of community life.The ones who are leaving areMassachusetts born and educated and have deep ties here.We let these vital contributors to our communities andour economy slip away at the Commonwealth’s peril.
In presenting these findings, we owe a debt of gratitude to our partners: Bob Nakosteen of UMass Amherst,Mike Goodman of UMass Donahue Institute, and their colleagues, who conducted the research.We would also like to thank the many reviewers whose critical insights have strengthened the final report. Lastly, we owe specialthanks to Dana Ansel, MassINC’s Research Director, for shepherding this project to such a successful conclusion.Finally, we would like to thank our sponsors at MassHousing, who have been generous and enthusiastic partners,encouraging the authors to go where the data led them.
We hope you find Mass.Migration an informative and timely resource.We welcome your feedback and invite you tobecome more involved in MassINC.
Sincerely,
Ian Bowles Gloria Cordes Larson Peter MeadeExecutive Director Co-Chair Co-Chair
2 MASS.MIGRATION
EXECUTIVE SUMMARY . . . . . . . . . . . . . . . . . . . . . . . . . . . . . . . . . . . . . 4
Key Facts . . . . . . . . . . . . . . . . . . . . . . . . . . . . . . . . . . . . . . . . . . . . . . . . . . . . . . . 4
Key Definitions . . . . . . . . . . . . . . . . . . . . . . . . . . . . . . . . . . . . . . . . . . . . . . . . . . . . 5
MIGRATION IN MASSACHUSETTS: THE CONTEXT . . . . . . . . . . . . . . . . . . 12
MIGRATION: ABOUT THE PEOPLE AND THE PLACES . . . . . . . . . . . . . . . . 14
A PROFILE OF MIGRANTS: WHO MOVES IN AND WHO MOVES OUT . . . . . . . 15
Demographics . . . . . . . . . . . . . . . . . . . . . . . . . . . . . . . . . . . . . . . . . . . . . . . . . . . 15
Massachusetts: A Higher Education Magnet . . . . . . . . . . . . . . . . . . . . . . . . . . . . . . . 17
Economic Status . . . . . . . . . . . . . . . . . . . . . . . . . . . . . . . . . . . . . . . . . . . . . . . . . . 18
DESTINATIONS AND ORIGINS . . . . . . . . . . . . . . . . . . . . . . . . . . . . . . . 19
Migration to and from the New England States . . . . . . . . . . . . . . . . . . . . . . . . . . . . . 20
Migration to and from our Economic Competitor States . . . . . . . . . . . . . . . . . . . . . . . 23
DISCUSSION . . . . . . . . . . . . . . . . . . . . . . . . . . . . . . . . . . . . . . . . . . . 26
THE MASSACHUSETTS INSTITUTE FOR A NEW COMMONWEALTH 3
table of contents

EXECUTIVE SUMMARYExamining the flow of people moving into and out ofMassachusetts over the last decade reveals a state in tran-sition. Our analysis of the Census 2000 data shows thatnative-born middle-class families are migrating in increas-ing numbers to other New England states, while smallernumbers of highly educated, highly mobile professionalsare arriving in Massachusetts. But, with many choices aboutwhere to work and live, there is no guarantee that theseworkers will make the Bay State their permanent home.
In this respect, Massachusetts is no different fromother states with knowledge economies. It is increasinglydependent upon a supply of skilled workers whose ties tothe state are tenuous, especially during tough economictimes. What makes the situation more acute for Massa-chusetts is the state’s slow labor force growth and agingpopulation. Massachusetts can ill afford to lose these newmigrant workers whose jobs epitomize the present andfuture Bay State economy.
This research analyzes recent migration patterns inMassachusetts. It examines both the magnitude of migra-tion over the last twelve years and the characteristics ofmigrants. We also analyze where the people leaving theBay State are going, and where our new arrivals are com-
ing from.While the new arrivals are striking in their sim-ilar demographic and economic characteristics, the pro-files of those moving out vary according to their destina-tions.We identify two different types of out-migrants: theNew England migrant, primarily middle-class families;and the Economic Competitor migrant, young, highlyeducated managers and professionals. In addition, severalSouthern and Western states appear as new destinationsfor Massachusetts workers, uncovering additional compe-tition for this colder, more expensive climate.
In looking toward solutions, it is important to keepin mind that these changes took place in the context of anextraordinary economic expansion, illustrating that a strongjob market alone is not enough to attract and keep work-ers. Policy-makers and business leaders must grapple witha new reality: Worker mobility is now a long-term char-acteristic of the state’s economy.As more and more regionsacross the country seek to develop knowledge-basedeconomies, Massachusetts faces fierce competition in thecontest for skilled workers. But, there are encouragingsigns: Our research shows that Massachusetts is narrowlywinning the fight to attract young, highly educated talentfrom its economic competitors—offering the state afoundation on which to build a new strategy.
4 MASS.MIGRATION
• In every single year over the last
12 years, Mass. lost more people
than it attracted (excluding inter-
national immigrants). Mass. has
suffered a net loss of 213,191
domestic out-migrants.
• Mass. is exporting a substantial
number of residents to the rest of
New England (CT, ME, NH, RI, VT).
The rate of loss over the last 5
years has accelerated, despite a
strong economy for much of that
period. Over the last 12 years, on
net, Mass. lost 79,031 people to
other NE states.
• The vast majority of people who
migrate to another New England
state (80%) do not continue to
work in Massachusetts.
• Native-born, middle-class families
are migrating in increasing num-
bers to other New England States,
most notably to New Hampshire.
• Mass. is narrowly winning its fight
to attract young highly educated
talent from its economic competi-
tor states (CA, CO, CT, MN, NC,
NJ, NY), gaining 14,428 people
over the last 12 years.
• Mass. attracts a very specific type
of person. No matter where they
are coming from, they tend to be
young, unmarried, highly educated
professionals and managers who
work in the knowledge economy.
• Those leaving for our economic
competitor states share similar
traits with in-migrants but in
even higher percentages.
• There is also a substantial loss
of people to Florida, Georgia, and
Arizona. These states are top des-
tinations for young, educated peo-
ple across the country.
• The availability of high-quality jobs
does not guarantee that there will
be enough skilled workers to fill
them. Even at our economy’s peak,
Massachusetts, on net, was not
able to attract workers to our state.
KEY FACTS:

BackgroundOver the last twelve years, Massachusetts has been losingin the competition for people. Between 1990 and 2002,not counting international immigrants, about 1.23 mil-lion people moved into Massachusetts from other statesand about 1.44 million moved from Massachusetts to otherstates. That meant a net loss to Massachusetts of morethan 213,000 domestic out-migrants.1 This is quite a sig-nificant figure. It roughly approximates the total employ-ment in the financial services sector in 2001 and is morethan seven times the state’s total employment in thebiotech industry.The fact that our labor force grew at allwas a result of international immigrants who have con-tributed substantially to our economy.
The patterns of domestic migration to and fromMassachusetts vary loosely with the Massachusetts businesscycle. Just as a hot economy will attract workers, a strug-gling economy will spur people to seek better job oppor-tunities elsewhere. If we consider the net-migration year-by-year over the last twelve years, however, we find thatin every single year, Massachusetts lost more people thanit attracted—including those years of extraordinary eco-nomic expansion. During the boom economy of the late1990s, our unemployment rate was at a historic low,while an estimated one in twelve jobs at technology-intensive firms remained vacant.2 Even at our economy’s
Figure ES1Net Domestic Migration in Massachusetts, 1990-2002
Source: Author’s calculations of IRS data
EXPANSIONRECESSION RECESSION
Num
ber
of P
eopl
e
10,000
0
-10,000
-20,000
-30,000
-40,000
-50,000
-60,000
-70,000
1990
-91
1991
-92
1992
-93
1993
-94
1994
-95
1995
-96
1996
-97
1997
-98
1998
-99
1999
-00
2000
-01
2001
-02
KEY DEFINITIONS:
IN-MIGRANT —a person who moved into
Massachusetts from any of the forty-nine states,
the District of Columbia, or a U.S. territory.
OUT-MIGRANT —a person who moved from
Massachusetts to any of the forty-nine states,
the District of Columbia, or a U.S. territory.
ECONOMIC COMPETITOR OUT-MIGRANT —
a person who moved from Massachusetts to any of
the seven economic competitor states (CA, CO, CT,
MN, NC, NJ, NY).
NEW ENGLAND OUT-MIGRANT —a person
who moved from Massachusetts to another New
England state (CT, ME, NH, RI, VT).
NET MIGRATION — the difference between in-
migration and out-migration. Positive net migration
indicates that more people moved to Massachusetts
from a particular state than moved from Massachu-
setts to that same state. Negative net migration
indicates that more people moved from Massachu-
setts to a particular state than moved from that
state to Massachusetts.
NON-MIGRANT —a person who, according to
the 2000 Census, lived in Massachusetts in both
1995 and in 2000.
THE MASSACHUSETTS INSTITUTE FOR A NEW COMMONWEALTH 5

peak, Massachusetts was not able, on net, to attract people to our state.
The General Profile of a MigrantOne of the principal findings of this study is that the new migrant population is not like everybody else.Migrants tend to be young, well-educated managers andprofessionals who work in the knowledge economy.3
There are a handful of other characteristics that help to predict whether or not a person is a likely mover, suchas family or other emotional ties to a region; marital status and children, especially school-age children; andthe migration history of the individual. A person who has moved before is more likely to move again.Thus, thesame characteristics that bring migrants into our statealso increase the likelihood that they will leave at somepoint. The key challenge, then, is for policy-makers tomake it as easy as possible for migrants to lay down rootsin our state, which will help deter subsequent moves. Byhelping families establish roots in Massachusetts, policy-
makers will enhance the state’s overall economic com-petitiveness.
When we examine the characteristics of in-migrants,they are remarkably similar.4 Massachusetts attracts a veryspecific type of person. No matter where they are comingfrom, they tend to be young, unmarried, highly educatedprofessionals and managers who work in knowledge sec-tors of the economy. The story with the out-migrants isnot so simple.While there are general similarities amongthe out-migrants, there are also important differencesbased on their destinations. Out-migrants going to oureconomic competitor states are an extreme version of thetypical out-migrant, while out-migrants going to theother New England states are much more likely to benative-born Massachusetts families with children.
The New England Out-Migrant:Middle-Class FlightMigration to and from the other New England statesaccounts for about one-quarter of all migration. In this
6 MASS.MIGRATION
Figure ES2Net Migration Between Massachusetts and Other New England States, 1990-2002
Source: Author’s calculations of IRS data
EXPANSIONRECESSION RECESSION
Num
ber
of P
eopl
e
3,000
2,000
1,000
0
-1,000
-2,000
-3,000
-4,000
-5,000
-6,000
-7,000
-8,000
-9,000
-10,000
1990
-91
1991
-92
1992
-93
1993
-94
1994
-95
1995
-96
1996
-97
1997
-98
1998
-99
1999
-00
2000
-01
2001
-02
Connecticut
Maine
New Hampshire
Rhode Island
Vermont
CT
VT
ME
RI
NH

exchange, Massachusetts is clearly on the losing side,exporting more residents than it is attracting. More troubling, though, is that the rate of loss has been accelerating over the last five years. Contrary to popularbelief, the vast majority of the people who migrate toanother New England state (80%) do not continue towork in Massachusetts. Over the last 12 years, Massa-chusetts, on net, lost 79,031 people to the other NewEngland states.
The majority of that loss is to New Hampshire, towhich 78,201 former Massachusetts residents, on net,fled between 1990 and 2002. The fact that Massachu-setts is losing people to New Hampshire is not new,although the size of the loss has been increasing over the last five years. What is new, however, is the shift in the patterns of exchange with Connecticut and RhodeIsland. In the early years of the 1990s, Massachusetts was a big net-gainer from these two neighbors. Recently,the gain from Connecticut has been steadily decreasing in size, and in 2001-02 Massachusetts actually lost forty-seven people to the Nutmeg State. The change in the exchange with Rhode Island is even more dramatic.Instead of gaining people, Massachusetts lost 6,323 people to Rhode Island over the last four years. Perhapseven more telling is that these downward trends actuallystarted when the Massachusetts economy was strong—times when we should have had few problems attracting people to the Bay State. If the current trendscontinue, Massachusetts can expect to lose even more residents to its New England neighbors over the coming years.
Table ES1Characteristics of Working-Age New England Out-Migrants
Compared to Other Out-Migrants (numbers in percent unless
otherwise noted)
NEW ENGLAND ALL OTHERCHARACTERISTIC OUT-MIGRANTS OUT-MIGRANTS
Bachelor’s Degree or Higher 38.2 53.6
Professional/Managerial Occupation 41.2 47.9
Knowledge Sector 43.3 48.6
Median Age (years) 33 31
Married 52.6 44.5
Children in Household 31.9 26.5
Born in Massachusetts 52.8 35.8
Source: U.S. Census Bureau, 2000 Census 1% Public Use Microdata Sample
When looking at the profile of the New England out-migrants, a disturbing pattern emerges: It appears thatnative-born, middle-class families are fleeing the Bay State.Over half of New England out-migrants were born inMassachusetts (53%), compared with only 36 percent ofall other migrants; they are more likely to be marriedwith children; and while they are well-educated, they are,on average, less so than migrants to other states (38%with a bachelor’s degree vs. 54%). Furthermore, com-pared with other migrants, they are less likely to be man-agers or professionals, and they are less likely to work inthe knowledge economy.
What is driving these families across the border? Arecent MassINC survey offers some insights. One-quarterof Massachusetts residents polled said they would moveout of the state if they had the opportunity, with 49 per-cent rating the state’s quality of life as either “fair” or“poor”. Personal finances and the high cost of living weredominant concerns for these people. In fact, the numberone reason for wanting to move was “to go somewherewith a lower cost of living or lower taxes.” 5
The Economic Competitor Out-Migrant:Winning the Brain ExchangeThe other significant migration exchange for Massachu-setts is with a group of states with high-tech, knowledge-intensive economies. Massachusetts competes with theseeconomic competitors for skilled workers.To understandhow well Massachusetts does in this competition, wemeasure the migrations flows to and from seven econom-ic competitor states: California, Colorado, Connecticut,Minnesota, New Jersey, New York, and North Carolina.6
From 1990 through 2002, there was considerableexchange of individuals between Massachusetts and theseother high-tech states. Approximately 28 percent of allthe people entering Massachusetts came from one ofthese seven states, while 23 percent of all the people leav-ing Massachusetts moved to one of these high-tech states.
The good news is that Massachusetts has been nar-rowly winning in the brain exchange contest. Even withthe past two years of shaky economic conditions, Massa-chusetts has been net-positive compared with our econom-ic competitors. Overall, Massachusetts gained 14,428 peo-ple from our economic competitors since 1990.While thisgain is not huge, the fact that we are net-positive clearly
THE MASSACHUSETTS INSTITUTE FOR A NEW COMMONWEALTH 7

shows that Massachusetts is an attractive destination forthese highly skilled workers.The Bay State’s positive trackrecord offers the state a solid foundation to build upon inthe ongoing competition for these highly skilled workers.
A closer look reveals considerable variation in thesemigration patterns.While Massachusetts has been gainingpeople from our regional competitors (CT, NY, NJ), wehave also been losing people to our long-distance com-petitors (CA, CO, MN, NC). We gained 53,339 peoplefrom our regional competitor states during the last twelveyears but lost a total of 38,911 people to our long-dis-tance competitors. California, the most populous state,dominates the migration flows among these four states;23,978 more people fled the Bay State for California thanmade the reverse move. The bottom line is that we arelosing more people to our competitor states outside theNortheast than we are attracting. Furthermore, the trendhas changed recently with Connecticut, showing that patterns of exchange with our economic competitors canand do change—a warning sign for policy-makers andbusiness leaders.With more and more states entering thiscompetition, the Bay State cannot be complacent in itsefforts to attract and retain these workers.7
Beyond just raw numbers, the contrast between the
profile of these migrants and other migrants is striking.Three out of five Economic Competitor out-migrants(61%) have at least a baccalaureate degree.The extraordi-narily high level of education of these migrants is muchhigher than that for all other migrants, where only 43 per-cent have a baccalaureate degree or higher.
In addition, 54 percent of Economic Competitormigrants are managers or professionals, and 56 percentwork in the knowledge economy. This compares with 42percent and 43 percent, respectively, for all other migrants.
8 MASS.MIGRATION
Figure ES3Net Migration Between Massachusetts and its Economic Competitors, 1990-2002
Source: Author’s calculations of IRS data
EXPANSIONRECESSION RECESSION
Num
ber
of P
eopl
e
8,000
6,000
4,000
2,000
0
-2,000
-4,000
-6,000
-8,000
-10,000
-20,000
1990
-91
1991
-92
1992
-93
1993
-94
1994
-95
1995
-96
1996
-97
1997
-98
1998
-99
1999
-00
2000
-01
2001
-02
Regional Competitors (Connecticut, New Jersey, New York)
Distant Competitors (California, Colorado, Minnesota, North Carolina)
Net Migration
Table ES2Characteristics of Working-Age Economic Competitor Out-Migrants
Compared to Other Out-Migrants (numbers in percent unless
otherwise noted)
ECONOMICCOMPETITOR ALL OTHER
CHARACTERISTIC OUT-MIGRANTS OUT-MIGRANTS
Bachelor’s Degree or Higher 61.2 43.0
Professional/Managerial Occupation 54.2 41.7
Knowledge Sector 55.5 42.8
Median Age (years) 30 33
Married 41.9 49.3
Children in Household 24.2 30.0
Born in Massachusetts 33.2 44.7
Source: U.S. Census, 2000 Census 1% Public Use Microdata Sample

Thus, the “brain exchange” with other high-technologystates not only represents a significant portion of themigration flows for Massachusetts, it also demonstratesthat the Economic Competitor migrants are very special-ized, highly educated workers concentrated in jobs thatepitomize the future of the Massachusetts economy.
Places to Watch: Florida, Arizona, and GeorgiaUnderstanding the dynamics of the New England andEconomic Competitor migration flows helps to explainmuch but not all of the Massachusetts migration patterns.In particular, three states do not neatly fit in these cate-gories but still represent a significant amount of migrationflow from Massachusetts: Florida, Arizona, and Georgia.Florida actually tops the list of all the states in terms of anet-loss of residents. Over the last twelve years, Massa-chusetts lost 99,082 more residents to Florida than itgained. Of these residents, about 42,000 (42%) are 55years and older, which means that the majority of out-migrants to Florida are not retirees or pre-retirees. Rather,the majority are younger than 55 years old. In addition toFlorida, Massachusetts has lost a significant number ofpeople to Arizona and Georgia, roughly losing 11,000residents, on net, to each of those states between 1990and 2002.
Although our analysis cannot pinpoint the reasons forthe large out-migration to these specific states, all three ofthese states rank as top destinations for people across thecountry. Other analyses of Census data find that Orlando,Florida, and Atlanta, Georgia, were two of the top cities inattracting young single people who had a college diploma.Phoenix, Arizona, also appeared as a magnet for youngadults.8 While policy-makers are unable to replicate the
warmer climates of these states, there may be other quality-of-life and affordability concerns that can be addressed.
Concluding ThoughtsThe characteristics of migrants are different from those of the rest of the state’s population. Migrants are younger,better educated, and are more likely to work in the knowl-edge sectors of the economy than are the non-migrantpopulation. These highly mobile individuals are attractedto areas of the country that can best utilize their educationand skills. Thus, Massachusetts not only must competewith other high-technology regions of the country forjobs, it also must compete for qualified workers to fillthose jobs.
Over the past twelve years, Massachusetts’ perform-ance in this competition is a mixed story. Overall, duringthis period, Massachusetts has lost significantly more peo-ple than it has attracted—leaving the state with a deficitof 213,000 domestic migrants. (The state’s populationand labor force grew slightly during this period becauseof international immigration.) That overall number, how-ever, masks important differences among the differentpopulations of out-migrants. In the case of the NewEngland out-migrants, Massachusetts appears to be losingmany native-born, middle-class families to the rest of theregion. Over the last twelve years, Massachusetts has lostnearly 80,000 people to the other New England states.Moreover, the loss of these families has accelerated overthe last five years. Significantly, the vast majority of thepeople who migrate to another New England state (80%)
THE MASSACHUSETTS INSTITUTE FOR A NEW COMMONWEALTH 9
Figure ES4Net Migration with Other New England States and Economic
Competitor States, 1990-2002
Source: Author’s Calculations of IRS data
20,000
0
-20,000
-40,000
-60,000
-80,000
New England Economic Competitors
Net
Mig
rati
on
-79,031
14,428
Table ES3Top Net Migration Losses for Massachusetts, 1990-2002
RANK/STATE NET MIGRATION, 1990-2002
1 Florida -99,082
2 New Hampshire -78,201
3 California -23,978
4 Maine -15,708
5 Georgia -11,331
6 Arizona -11,033
7 North Carolina -8,983
Source: Author’s calculations of IRS data
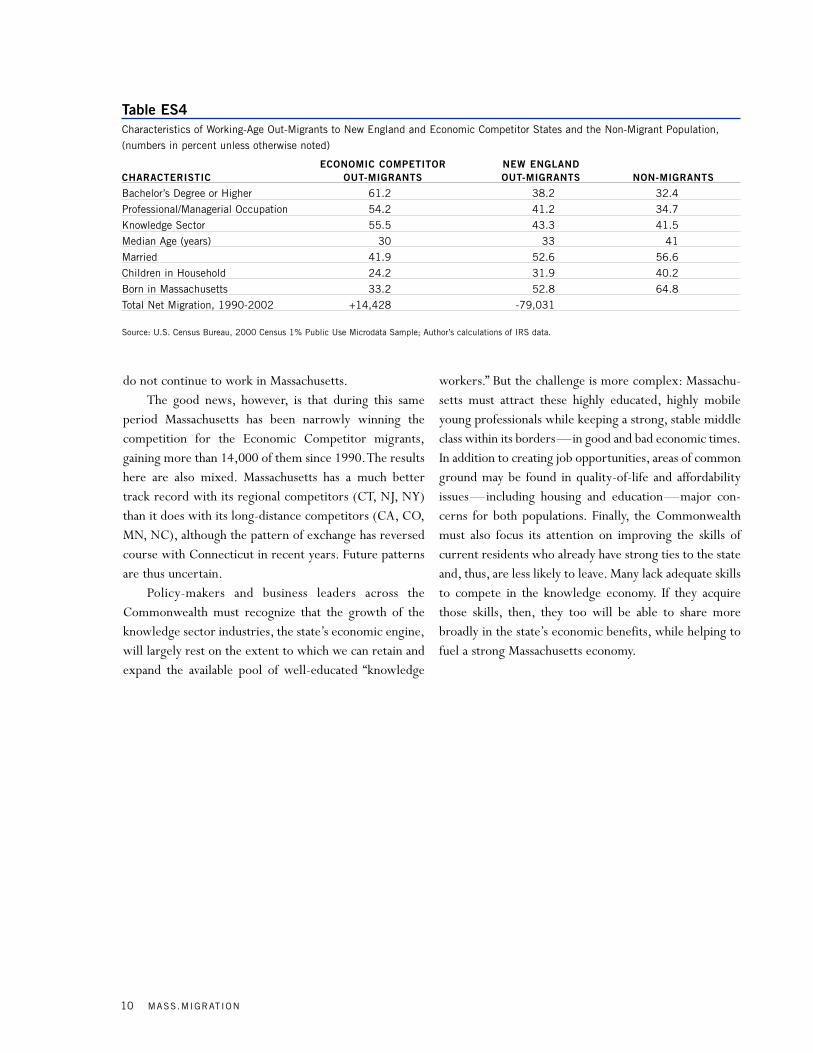
do not continue to work in Massachusetts.The good news, however, is that during this same
period Massachusetts has been narrowly winning thecompetition for the Economic Competitor migrants,gaining more than 14,000 of them since 1990.The resultshere are also mixed. Massachusetts has a much bettertrack record with its regional competitors (CT, NJ, NY)than it does with its long-distance competitors (CA, CO,MN, NC), although the pattern of exchange has reversedcourse with Connecticut in recent years. Future patternsare thus uncertain.
Policy-makers and business leaders across theCommonwealth must recognize that the growth of theknowledge sector industries, the state’s economic engine,will largely rest on the extent to which we can retain andexpand the available pool of well-educated “knowledge
workers.” But the challenge is more complex: Massachu-setts must attract these highly educated, highly mobileyoung professionals while keeping a strong, stable middleclass within its borders—in good and bad economic times.In addition to creating job opportunities, areas of commonground may be found in quality-of-life and affordabilityissues—including housing and education—major con-cerns for both populations. Finally, the Commonwealthmust also focus its attention on improving the skills ofcurrent residents who already have strong ties to the stateand, thus, are less likely to leave. Many lack adequate skillsto compete in the knowledge economy. If they acquirethose skills, then, they too will be able to share morebroadly in the state’s economic benefits, while helping tofuel a strong Massachusetts economy.
10 MASS.MIGRATION
Table ES4Characteristics of Working-Age Out-Migrants to New England and Economic Competitor States and the Non-Migrant Population,
(numbers in percent unless otherwise noted)
ECONOMIC COMPETITOR NEW ENGLAND CHARACTERISTIC OUT-MIGRANTS OUT-MIGRANTS NON-MIGRANTS
Bachelor’s Degree or Higher 61.2 38.2 32.4
Professional/Managerial Occupation 54.2 41.2 34.7
Knowledge Sector 55.5 43.3 41.5
Median Age (years) 30 33 41
Married 41.9 52.6 56.6
Children in Household 24.2 31.9 40.2
Born in Massachusetts 33.2 52.8 64.8
Total Net Migration, 1990-2002 +14,428 -79,031
Source: U.S. Census Bureau, 2000 Census 1% Public Use Microdata Sample; Author’s calculations of IRS data.

THE MASSACHUSETTS INSTITUTE FOR A NEW COMMONWEALTH 11
Endnotes1 Migration flow data are estimated from IRS tax records.The Internal Revenue Service compiles tax return data in order to esti-
mate annual state migration flows. A migration is recorded whenever the state of filing is different from one year to the next.
By using the exemptions data (which approximate household size), we were able to estimate the number of individuals.While
some of the migration measured by the IRS is related to retirement, using the 2000 Census data to estimate the magnitude of
retirement migration, we find that approximately 95 percent of all people migrating into Massachusetts were between 18 and
64 years old, and about 91 percent of the out-migrants were of working age. Clearly, almost all of the migration is labor-force
related.We also use the 2000 Census data in this report to analyze individual characteristics of in-migrants and out-migrants.
2 See Harrington, P. and Fogg, N. 1997. Is There a Labor Shortage? A Review of the Evidence for Massachusetts and New England, Center
for Labor Market Studies, Northeastern University.
3 The knowledge sector includes the following industries, as defined by the North American Industry Classification system:
Information Technology; Finance, Insurance, and Real Estate; Professional, Scientific,Administrative, and Management Services;
and Education, Health, and Social Services.
4 Characteristics of migrants and non-migrants are derived from the 1% Public Use Microdata Sample (PUMS) of the 2000
Census of Population and Housing.These files contain records for a sample of households with information on the characteristics
of each unit and each person in it, while preserving confidentiality (by removing identifiers).These microdata files permit users
to analyze the demographic/socioeconomic characteristics of 1% of the respondents to the Census long-form questionnaire,
administered to one in six housing units/households. Migrants and non-migrants are identified based on responses to the “five-
year residence question.” The long form which is used to construct the Public Use Sample of the 2000 Census contained a ques-
tion on the state of residence of the respondent in 1995. By comparing the state of residence in 1995 with the state of residence
in 2000, migrants can be identified. Note that if an individual migrates more than once between 1995 and 2000, only one of the
moves will be recorded. In addition, if a person leaves a state after 1995 and returns to the same state prior to the Census date
in 2000, this migration will go unrecorded.
5 Princeton Survey Research Associates. 2003. The Pursuit of Happiness:A Survey on the Quality of Life in Massachusetts. MassINC.
6 For this analysis we use the Massachusetts Technology Collaborative’s six “Leading Technology States” and North Carolina, a state
long seen as a competitor because of the presence of the Research Triangle.
7 Florida, Richard. 2002. The Rise of the Creative Class and How It is Transforming Work, Leisure, Community, and Everyday Life. New York:
Basic Books.
8 U.S. Census Bureau. 2003. Migration of the Young, Single, and College-Educated: 1995 to 2000. Census 2000 Special Reports,
November.

Many people have an image of Massachusetts as a popula-tion magnet, attracting thousands of students with its universities and drawing other people to its technologyeconomy and high quality of life. However, as this studydemonstrates, the reality is far more complicated: Withits own labor force growth stagnant, the Massachusettseconomy is increasingly dependent upon a supply ofskilled workers whose ties to the state are tenuous, espe-cially during tough economic times. Massachusetts can illafford to lose this pool of workers, many of them in occu-pations and industries that epitomize the present andfuture Massachusetts economy.
The Bay State’s singular competitive advantage is theskill level of its workforce. But that advantage and growthin Massachusetts are in jeopardy if we simultaneously failto properly train our own population in the 21st-centuryskills increasingly demanded by today’s employers whiledepending upon in-migrants who have such skills—butwho also have a tendency to move.
This research explores recent migration patterns inMassachusetts. It first examines the magnitude of migra-tion over the last decade or so and then examines thesocioeconomic and demographic characteristics ofmigrants both into and out of Massachusetts.These char-acteristics include a set of indicators that can be used tomeasure the importance of migrants to the Massachusettseconomy. Finally, we analyze where the people who leavethe Bay State are going, and from where our new arrivalscome. In particular, we look at two significant migrationexchanges: the flow of people to and from the other New England states and to and from our economic com-petitor states.
MIGRATION IN MASSACHUSETTS: THE CONTEXT
During the last 20 years, the Massachusetts economy haschanged dramatically, shifting away from manufacturingjobs toward service sector jobs and introducing into oureconomy the characteristic of worker mobility. The newMassachusetts economy, with its emphasis on technology-
oriented and knowledge-intensive industries, requires(and attracts) highly educated workers.These workers bytheir very nature tend to have many choices about whereto locate and, as a consequence, are highly mobile. Massa-chusetts is not the only state that depends upon a pool ofhighly mobile workers. Other states with similar economiesthat are heavily reliant on highly educated workers alsoface such worker mobility and compete with Massachu-setts for this desirable segment of the labor force.
While other states contend with this issue, workermobility is especially salient for the Massachusetts econo-my because of our state’s slow labor force growth andaging population. The ability to sustain a healthy andgrowing economy over the long run fundamentally restson a growing labor force that can expand economic activity. Massachusetts, however, has long faced the prob-lem of a slowly growing labor force. Over the entire1990s, our labor force grew by less than 2 percent, whilethe nation’s labor force grew by nearly 14 percent.Indeed, during the 1990s, Massachusetts had the fourthlowest rate of labor force growth in the nation.1 This is the disturbing prospect now facing policy-makers: Ourlabor force is barely growing; not enough Massachusettsworkers have the skills and educational attainmentrequired by the state’s key industries; and many of theworkers who do have such training are likely to leave thestate, especially in difficult times.
Between 1990 and 2002, excluding internationalimmigrants, about 1.23 million people moved into Massa-chusetts from other states and about 1.44 million movedfrom Massachusetts to other states.2 That meant a net lossto Massachusetts of more than 213,000 domestic out-migrants.3 This is quite a significant figure. It equals about82 percent of all labor force growth in Massachusetts during the same period. The fact that our labor force grew at all was a result of international immigrants whohave contributed substantially to our economy.4 The focusof this research, however, is domestic migrants, who, aswe shall see, play a critical role in sustaining key industries
12 MASS.MIGRATION
MASS.migration

in the Massachusetts economy. The number of domesticout-migrants roughly approximates the total employmentin the financial services sector in 20015 and is more thanseven times the state’s total employment in the biotechindustry.6
The patterns of domestic migration to and fromMassachusetts vary loosely with the Massachusetts busi-ness cycle on a year-by-year basis (Figure 1). Just as a hoteconomy will attract workers, a struggling economy willspur people to seek better job opportunities elsewhere.Consider the early 1990s, when the Massachusetts econ-omy was deep in a recession. From 1990 to 1991, the “netmigration” (in-migration minus out-migration) was -60,718; that’s how many more people left the state thanentered it during that year. Over the last twelve years, thiswas the single largest number of people lost in a givenyear. Because the economic conditions in Massachusettsin the late 1980s and early 1990s were significantly worsethan in other parts of the country, potential migrants hadbetter economic prospects elsewhere. As the Massachu-setts economy began to recover, the magnitude of in-
migration rose steadily, from 83,291 in 1990 to 119,024in 2001. But between 2001 and 2002—the first full yearof the recession in Massachusetts—the number of in-migrants fell to 110,127.
In contrast, out-migration patterns were not nearlyso linear and did not correspond as closely to the businesscycle. From 1990-1991, at the height of the recession,144,009 people left Massachusetts. The following year,the number of people who left the state dropped to114,928. The number of out-migrants then fluctuatedover the next several years. But since 1995-1996, despitethe state’s strong economy, domestic out-migration hasbeen steadily increasing, reaching 129,946 by 2001-2002.Clearly, the business cycle alone cannot fully explain out-migration behavior in Massachusetts.
Looking at net-migration year-by-year over the lasttwelve years, we find that in every single year, Massa-chusetts lost more people than it attracted (Table 1).Given the extraordinary economic expansion duringmuch of this time, our state’s inability to attract morepeople than it lost is especially noteworthy. The year
THE MASSACHUSETTS INSTITUTE FOR A NEW COMMONWEALTH 13
Figure 1In-Migration and Out-Migration in Massachusetts, 1990-2002
Source: Author’s calculations of IRS data
Num
ber
of P
eopl
e
EXPANSIONRECESSION RECESSION160,000
140,000
120,000
100,000
80,000
60,000
40,000
20,000
0
-20,000
-40,000
-60,000
-80,000
1990
-91
1991
-92
1992
-93
1993
-94
1994
-95
1995
-96
1996
-97
1997
-98
1998
-99
1999
-00
2000
-01
2001
-02
In-migration
Out-migration
Net-migration

2000-2001 was our best year in terms of losing the fewestpeople, on net, and in that year, we lost 3,818 people.During the other years of the economic boom, we lostanywhere from 5,768 to 7,183 people.Thus, even at oureconomy’s peak, Massachusetts was not able, on net, toattract people to our state.
Table 1Net Domestic Migration in Massachusetts, 1990-2002
YEAR NET MIGRATION
1990-91 -60,718
1991-92 -30,013
1992-93 -26,630
1993-94 -17,766
1994-95 -17,538
1995-96 -11,343
1996-97 -7,183
1997-98 -6,519
1998-99 -5,768
1999-00 -6,076
2000-01 -3,818
2001-02 -19,819
Source: Author’s calculations of IRS data.
That both in- and out-migration were rising duringmuch of the expansion in the 1990s is consistent withother migration studies. Previous research finds that oncea region starts receiving an increased flow of in-migrants,it eventually triggers an increased flow of out-migrants.As we will examine below, part of this phenomenon isdue to the characteristics of migrants, which make themmuch more prone to move, and move on, than the popu-lation as a whole.The fact that both in-and out-migrationcan be high and even growing during a period of tremen-dous economic expansion, low unemployment, and re-ported labor shortages in certain science, technology, andengineering fields7 suggests that Massachusetts cannotrely on economic growth alone to solve its chronic laborforce shortage through the attraction of in-migrants.
MIGRATION: ABOUT THE PEOPLE AND THE PLACES
Migration can be seen as the outcome of the inter-action between the “Characteristics of Places” and the“Characteristics of People.”8 People tend to move intoplaces that are thriving economically, while adverse eco-nomic conditions tend to push people out. In short, jobgrowth attracts movers. But the other characteristics of
place can interact in an important way with the charac-teristics of people, leading to some counter-intuitivemigration streams.
The academic literature reports a strong and con-sistent profile of someone most likely to migrate domes-tically.9 The most important factor is age.Younger work-ers are much more likely to change their state of resi-dence. The probability that a worker will migrate withina year begins to increase dramatically at age 18 andremains high throughout the 20s and into the 30s, thendeclines slowly from the mid- 30s into the early 40s, anddrops sharply thereafter. The probability of migrationrises again as people reach their 60s and retire, often toother states. This pattern of the age-selectivity of migra-tion is resilient across societies, cultures, countries, andtime periods. It is one of the most striking findings in thestudy of migration behavior.
Another important factor in predicting an individ-ual’s migration behavior is the extent of that person’s family ties in the region. Emotional ties to the regionwhere one has family tend to deter an individual’s will-ingness to relocate. Family ties can have an economicaspect as well. For example, a family network can providechild-care for free or at below-market rates. Having one’sfamily close by also provides a source of location-specificcapital for the individual that can be virtually impossibleto duplicate elsewhere. And extended family networks,family friends, or even simple name recognition can opendoors to economic and other opportunities.10 This socialcapital loses its value for individuals who relocate far fromtheir original homes.
The family status of an individual can also affectmigration behavior. Unmarried individuals are more like-ly to move, as are married people whose spouses do nothave jobs. The presence of children in the household,especially those of school age (5 to 18 years of age) signif-icantly reduces the likelihood of migration; once childrenenter school, parents are less likely to uproot the family.
Another factor is the migration history of the individ-ual. People who have never moved before are less likely tomove now or later, whereas those who have moved in thepast are less likely to stay put. In essence, migration behav-ior begets more migration behavior.As a result, areas suchas Massachusetts that are populated by migrants experiencechronically high volumes of out-migration, regardless of
14 MASS.MIGRATION

their economic conditions.A number of other characteristics help identify likely
migrants. Migrants tend to be more highly educated thannon-migrants, and the impact of education often interactswith the related characteristic of occupation. More highlyeducated individuals, especially those in specialized occu-pations, seek jobs in more national (or even internation-al) job markets, as opposed to local job markets. Forexample, a clerical worker may find it relatively easy tofind a new job locally, but a biotechnology professional’seffective job market is national or global. In short, thesehighly skilled people must look broadly because there areoften limited job opportunities in a given geographicarea, making them more mobile. At the same time, theyare also likely to have a range of choices of geographiclocations.
The characteristics of the place attract the type ofperson who is quite likely to move in good times, andeven more likely to move in bad times, especially when aregion’s economic conditions worsen relative to otherregions or the nation as a whole. Under these circum-stances, out-migration flows enlarge, as people leave inpursuit of opportunities in more prosperous locations.Simultaneously, in-migration slows, as limited opportuni-ties draw fewer people. This can result in a draining of astate’s labor force. Because of the significant economicexpansion during much of the 1990s, the Commonwealthattracted a substantial number of in-migrants. Whatremains is a pool of “hair-trigger” potential migrants,labor force members who by their previous behavior haveself-identified as likely movers. If the current economicrecovery goes slowly, and especially if our regional econ-
omy underperforms the national economy, the Common-wealth is at risk of losing many from this pool of previousin-migrants, plus others who are prone to move. Such anexodus could drain the state of a significant number ofhighly educated young workers. This could, in turn, fur-ther hamper the economy’s ability to recover.
A PROFILE OF MIGRANTS:
WHO MOVES IN AND WHO MOVES OUT
In this study, we identify and examine the characteristicsof those people who moved into Massachusetts at theheight of the expansion, from 1995 to 2000—the in-migrants. In addition, we compare their characteristicswith those who left the state during the same period—the out-migrants. Finally, we compare both groups withthe non-migrants—those who lived in Massachusetts atboth the beginning and the end of this time period. Fromthis analysis, we build a profile of “movers” and “stayers.”Given our focus on the impact of out-migration on thestate’s labor force, in this section we restrict our analysisof the Census data to individuals between 18 and 64 yearsof age.11
DemographicsRace and EthnicityIn-migrants are changing the demographic compositionof the state, albeit slowly (Figure 2). Non-migrants inMassachusetts are nearly 85 percent white, about 6 per-cent Hispanic, just under 5 percent black and 3 percentare Asian. For in-migrants from other states, only about78 percent are white, just over 7 percent are Hispanic,just under 5 percent are Black, and just over 7 percent are
THE MASSACHUSETTS INSTITUTE FOR A NEW COMMONWEALTH 15
Figure 2Racial/Ethnic Composition of the Massachusetts Working-Age Population, by Migration Status (percent)
In-migrant Out-migrant Non-migrant
Source: U.S. Census Bureau, 2000 Census 1% Public Use Microdata Sample
Hispanic 5.7Black 4.7Asian 3.0Other 2.2
Hispanic 7.1Black 4.8Asian 7.2Other 3.1
Hispanic 5.6Black 5.3Asian 5.3Other 3.3
White 77.8 White 80.6 White 84.9

of Asian descent. While the magnitude of in-migrationwill not suddenly change the demographic composition ofthe state, the in-migrant population represents a demo-graphic shift at the cutting edge of change in the state.
In-migrants are demographically different from non-migrants, but out-migrants more closely resemble the non-migrant population. Nearly 81 percent of out-migrantsare white, compared to 85 percent of the non-migrantpopulation. Over five percent of out-migrants areHispanic; just over 5 percent are black, and just over fivepercent are of Asian descent.
AgeBoth in- and out-migrants are considerably younger thanthe non-migrant population (Figure 3).The median age ofin-migrants is 29, of out-migrants is 32, and of non-migrants is 41. In-migrants may be slightly younger thanout-migrants because of the many college-aged studentswho enter the state to go to college or graduate school,while those leaving after graduation would tend to beolder. Given the relationship between age and mobility, itis not surprising that two-thirds of in-migrants werebetween 18 and 34 years old, the most migration-proneage group. Among out-migrants, nearly three-fifths arebetween 18 through 34 years old, while only one-third ofthe non-migrant population falls into that category.Thus,the majority of the migrants (both in- and out-migrants)are between the ages of 18 and 34, which is not the casefor non-migrants.
Figure 3Median Age of the Massachusetts Working-Age Population, byMigration Status
Source: U.S. Census Bureau, 2000 Census 1% Public Use Microdata Sample
Family Status While over 56 percent of the non-migrant population ismarried, this number drops to under 40 percent for in-migrants (Table 2). Out-migrants, who are slightly olderthan in-migrants, occupy the middle ground with justunder 47 percent married. A higher percentage of thenon-migrant population (40 percent) has children in thehousehold than either the in-migrants (slightly under 28percent) or the out-migrants (just over 28 percent).Thisgreater likelihood of parenthood for the non-migrants canbe explained by the difference in ages between the migrantand non-migrant populations.
Table 2Family Status of Massachusetts Working-Age Population, byMigration Status (numbers in percent)
IN- OUT- NON-MIGRANT MIGRANT MIGRANT
Married 39.4 46.8 56.6
Children in the Household 27.6 28.1 40.2
Source: U.S. Census Bureau, 2000 Census 1% Public Use Microdata Sample
Place of Birth People not born in their current state of residence or withfew local family connections have weaker ties to the state.This is especially true in difficult economic times, when afamily network can provide important economic and non-economic support. When no such network exists,moving becomes a much more appealing alternative.While nearly 65 percent of the non-migrant populationwas born in Massachusetts, just under 20 percent of in-migrants were born in Massachusetts (Table 3).12 Becauseso few in-migrants were born in the Bay State, the poten-tial for significant subsequent out-migration exists.
Table 3Place of Birth of Massachusetts Working-Age Population, byMigration Status (numbers in percent)
IN- OUT- NON-MIGRANT MIGRANT MIGRANT
Born in Massachusetts 19.7 40.8 64.8
Born outside of Massachusetts 80.3 59.2 35.2
Source: U.S. Census Bureau, 2000 Census 1% Public Use Microdata Sample
16 MASS.MIGRATION
50
40
30
20
10
0
In-migrant Out-migrant Non-migrant
Year
s
2932
41

What is perhaps more interesting, however, is thatmore than 40 percent of out-migrants were born inMassachusetts.13 This figure is lower than for the non-migrant population (nearly 65 percent), but it is muchhigher than for in-migrants (just under 20 percent). Thehigh percentage of out-migrants born within the stateraises the possibility of a later “counter stream” of returnmigrants to the state from among this group. Quite often,when people who have migrated decide to move again,they choose to move back to the state in which they wereborn, which allows them access to the many advantages ofhaving family nearby.
Educational StatusThe educational attainment of both in-migrants and out-migrants is significantly higher than that of the non-migrant population. Nearly 52 percent of the in-migrantshave at least a baccalaureate degree. At the same time,Massachusetts is also “exporting” a group of highly educated people. Nearly half (49%) of out-migrants have a baccalaureate degree or higher (Figure 4).The edu-cational attainment of the in-migrants and out-migrantscontrasts sharply with that of the non-migrants, only 32percent of whom hold at least a baccalaureate degree.Theeducation level of the non-migrants resembles that of theMassachusetts adult population over 25 years old.A muchhigher portion of both the in- and the out-migrants holdat least a college degree.The migrants play a critical rolein helping to grow and attract the types of knowledge-intensive jobs that are the economic engine of our state.
Figure 4Percent of Massachusetts Working-Age Population with aBachelor’s Degree or Higher, by Migration Status
Source: U.S. Census Bureau, 2000 Census 1% Public Use Microdata Sample
Massachusetts: A Higher Education MagnetOne of the Commonwealth’s leading industries, highereducation, draws people from other states and countriesnot only to work in its colleges and universities but alsoto attend them. How much are the higher education insti-tutions pulling people into the Bay State? Although pre-cise data measuring the numbers of individuals whomigrate domestically into the Commonwealth in order toattend college are not available, it is possible to make areasonable estimate of the magnitude of college-relatedin-migration.
Not surprisingly, Massachusetts attracts significantnumbers of in-migrants to its many world-class educa-tional institutions. The U.S. Department of Education(DOE) estimated that almost 30,000 people migrated toMassachusetts in 2000 to become “first-time, first-yeardegree/certificate seeking students enrolled in Title IVinstitutions.”14 This means that roughly 41 percent of allfirst-year students in Massachusetts come from out ofstate. Of course, at the same time that students migrateinto the state to attend college, some Massachusetts resi-dents migrate out of the state to attend a higher educationinstitution. During 2000, of the 57,000 Massachusettsresidents that attended a Title IV institution, about 73percent attended college in-state and 27 percent wentout-of-state.With approximately 15,000 individuals leav-ing the state to attend college, Massachusetts had a netgain of slightly more than 14,000 students in 2000.Theseestimates, however, include both interstate and interna-tional in-migrants, which, strictly speaking, make the dataincomparable to either the Census Public Use Microdataor the Internal Revenue Service data used in this study.Nonetheless, it is still useful to consider the studentmigration data to gain a general sense of the significanceof undergraduate student migration to overall migrationpatterns in Massachusetts.15
Another way of gauging the contribution of the stu-dent population to migration flows is to estimate the student share of total in-migration into Massachusetts.Over the five years from 1995 to 2000, the Census PublicUse Microdata Sample indicates that 370,046 individualsbetween the ages of 18 and 64 migrated into Massachu-setts from other states. Using this information, it is possi-ble to estimate an upper-bound estimate of domestic in-migration to the state for the purpose of attending col-
THE MASSACHUSETTS INSTITUTE FOR A NEW COMMONWEALTH 17
In-migrant Out-migrant Non-migrant
Per
cent
60
50
40
30
20
10
0
51.749.1
32.4

lege. To do so, we identified those in-migrant individualswho were 18 through 22 years of age and identified themselves as students in 2000.16 These individuals wereof the traditional age for entering college at some pointbetween 1995 and 2000, and since they were students in2000, they may have migrated from another state toattend college. According to the US Census, 63,650 in-migrants met this description between 1995 and 2000,compared with the total of 370,046 interstate in-migrantstracked by the Census over the same period.17 Thus, thestudents represent about 17 percent of total estimated in-migration over the five-year period. This demonstratesthat higher education is a powerful force in attracting col-lege-age in-migrants, but it does not fully explain migra-tion patterns in Massachusetts.18
Economic StatusEmployment The employment status of migrants and non-migrants issimilar. Over 71 percent of in-migrants, just under 70percent of out-migrants and 76 percent of the non-migrant population reported being employed (Table 4).In- and out-migrants report nearly identical unemploy-ment rates, 4.9 percent and 4.8 percent respectively.(The Census question refers to employment status for thecensus week in April 2000.) These rates are considerablyhigher than the 3.3 percent reported by the non-migrantpopulation. The difference in these figures may be theresult of some migrants (or their spouses) arriving herewithout jobs, and subsequently launching a job search.About 23 percent of both in-and out-migrants were not inthe labor force, compared to just over 20 percent for thenon-migrant population.
Table 4Employment Status of Massachusetts Working-Age Population,by Migration Status (numbers in percent)
IN- OUT- NON-MIGRANT MIGRANT MIGRANT
Employed 71.2 69.7 76.2
Unemployed 4.9 4.8 3.3
Armed Forces 0.8 2.6 0.1
Not in the labor force 23.1 23.0 20.5
Source: U.S. Census Bureau, 2000 Census 1% Public Use Microdata Sample
Occupation and IndustryAlong with educational attainment, a person’s occupationis one of the best measures of the skill-level of the state’slabor force and the quality of jobs. The contrast betweenthe occupational profile of migrants and that of non-migrants is significant for understanding the importanceof migration to the state’s economy.This contrast is great-est for the occupational category representing what arearguably the best paying jobs in the economy: professionaland managerial occupations.While just under 35 percentof the non-migrant population falls into this occupationalcategory, nearly half (47%) of in-migrants and out-migrants (46%) report working in professional and man-agerial occupations (Table 5).
Table 5Occupational Status and Industry of Employment of MassachusettsWorking-Age Population, by Migration Status (numbers in percent)
IN- OUT- NON-MIGRANT MIGRANT MIGRANT
Managerial &
Professional Occupation 47.3 45.9 34.7
Knowledge Sector 51.9 47.1 41.5
Source: U.S. Census Bureau, 2000 Census 1% Public Use Microdata Sample
Understanding what industries migrants work in alsooffers insight into how the migration process “feeds” theMassachusetts economy—which, especially in the east-ern part of the state, emphasizes information technology,financial services, technical and management consulting,and educational and health services.These industries rough-ly approximate what have been termed the KnowledgeSectors.19 Just over 41 percent of the non-migrant popu-lation works in this broadly defined sector, compared withjust under 52 percent for the in-migrant population and47 percent for the out-migrants.20 In other words, thepeople moving into and out of our state disproportionate-ly fill jobs in industries that represent the future of theMassachusetts economy.
These differences between migrants and non-migrants highlight the potential for migration streams toeither improve the quality of our labor force by drawingskilled people to the state or to threaten it by removingthose young workers with the greatest levels of skill toother states.
18 MASS.MIGRATION

DESTINATIONS AND ORIGINS
Where do people from Massachusetts go? And from whichstates do the newcomers in Massachusetts come?21 NewHampshire was the number one destination state of thoseleaving Massachusetts during the 1990s. On the top tendestination list, Florida ranked second and was followedby California, New York, and all other New England stateswith the exception of Vermont (Table 6). It turns out thatthe states that migrants from Massachusetts move to arethe same states that new migrants to Massachusetts come from (Table 7). The top ten list of states of origin of in-migrants include: New York, New Hampshire,
Connecticut, California, Rhode Island.The overlap of thestates where in-migrants come from and where out-migrants go suggests that Massachusetts is engaged in agood deal of population exchange with a specific set ofstates.
Looking only at the origins and destinations ofmigrants, however, does not tell us the whole story;specifically it does not reveal the net total of exchangewith an individual state. In some instances, in net total,Massachusetts gained more people than we lost, while inother instances we lost more people than we gained. If werank the forty-nine states plus the District of Columbia in terms of net-migration, some interesting patternsemerge (Figure 5). First, it is clear that we are net-nega-tive (31 states) with far more states than we are net-positive (17 states) (Table 8, see page 22).22 Florida topsthe residential trade deficit list; on balance over the lasttwelve years, Massachusetts lost 99,082 residents to theSunshine State. Florida, of course, is an unusual statebecause of the substantial retirement migration flow. Ofall the out-migrants to Florida, about 42,000 (42%), are55 years and older. While this is a significant number, itstill means that 57,071 out-migrants to Florida, the major-ity, are neither retirees nor pre-retirees. Rather, they areyounger than 55 years old. Florida is followed by NewHampshire, where Massachusetts suffered a net loss of78,201 people. California ranks third on the list with aloss of 23,978 Bay Staters to the Golden state. AnotherNew England state, Maine, ranks fourth, with Massachu-setts losing 15,708 people.
After Maine come two unexpected states: Georgiaand Arizona. The Commonwealth lost roughly 11,000residents to each of these two states. Although our analy-sis cannot pinpoint the reasons for this large out-migra-tion, the pattern is consistent with a larger national trend.Both of these states rank as top destinations for peopleacross the country. Other analyses of Census data find that Atlanta, Georgia; Orlando, Florida; and Phoenix,Arizona, were three of the top cities in attracting youngsingle people who had a college diploma.23 Other stateswhere the loss of people exceeded 5,000 people include:North Carolina,Texas,Virginia, and Colorado.The remain-ing states with whom our migration exchange was net-negative represent all regions of the country. Clearly, inthe competition for people, state by state, Massachusetts
THE MASSACHUSETTS INSTITUTE FOR A NEW COMMONWEALTH 19
Table 6Top 10 Destinations of Out-Migrants from Massachusetts,
1990-2002
TOTAL OUT-MIGRANTSSTATE FROM MASSACHUSETTS
NEW HAMPSHIRE 183,509
FLORIDA 167,805
CALIFORNIA 98,630
NEW YORK* 89,289
CONNECTICUT* 77,777
RHODE ISLAND* 70,104
MAINE 39,502
NEW JERSEY* 29,367
TEXAS 28,395
VIRGINIA 25,851
*Massachusetts, on net, attracted more people from the indicated states thanit lost over this time period.
Source: Author’s calculations of IRS data.
Table 7Top 10 Origins of In-Migrants to Massachusetts, 1990-2002
TOTAL IN-MIGRANTS STATE TO MASSACHUSETTS
NEW YORK* 117,959
NEW HAMPSHIRE 105,308
CONNECTICUT* 92,774
CALIFORNIA 74,652
RHODE ISLAND* 72,999
FLORIDA 68,723
NEW JERSEY* 39,039
PENNSYLVANIA* 26,962
MAINE 23,794
TEXAS 21,164
*Massachusetts, on net, attracted more people from the indicated states thanit lost over this time period.
Source: Author’s calculations of IRS data.

is typically on the losing side.There are only a handful of states from which Massa-
chusetts gains people in appreciable numbers. New Yorktops the list and is a leading “feeder state” for Massachu-setts. Over the last twelve years, on balance, Massachu-setts gained 28,670 people from the Empire State. Theonly other two states from which there was a sizeableinflux of people during this same period are Connecticut(+14,997) and New Jersey (+9,672). While these gainshelp to offset the losses, they are too concentrated in fartoo few states to counter the overall loss of over 200,000people. Moreover, as we shall see, the trend is changingwith some of the states where we have traditionally beennet-positive.
MIGRATION TO AND FROM THE NEW ENGLAND STATES
Perhaps not surprisingly, there is significant flow of peo-ple between Massachusetts and the other New Englandstates. One out of every four in-migrants (25%) camefrom a New England state, and of all out-migrants, 27
percent moved to a New England state. Except forVermont (the least populous state in the region), each ofthe other four New England states are on the top ten listof origins and destinations. When we examine the pat-terns of population exchange with our New Englandneighbors, a troubling pattern emerges. Not only are weexporting Massachusetts residents to the rest of NewEngland, but the rate of loss has been accelerating overthe last five years (Figure 6).The vast majority of the lossis to New Hampshire. Indeed, the out-migration ofMassachusetts residents to New Hampshire significantlyoutpaced the flow of in-migrants from the Granite Statebetween 1990 and 2002, with a net loss to the Common-wealth of 78,201 residents. The Commonwealth alsosteadily lost more residents than it gained to both Maineand Vermont in this same period. Overall, over the lasttwelve years, Massachusetts, on net, lost 79,031 peopleto the other New England states.
During this period, there were two New Englandstates—Connecticut and Rhode Island—where Massa-
20 MASS.MIGRATION
Figure 5Net Migration Flows Between Massachusetts and Selected States, 1990-2002
Source: Author’s calculations of IRS data
-50,000 or more
-49,999 to -20,000
-19,999 to -10,000
-9,999 to -5,000
+5,000 to 15,000
+15,000 or more
CA
TX
NY
FL
NJ
GA
NC
VA
AZ
ME
NH
CT

chusetts attracted more residents than it lost. On balance,Massachusetts gained 14,997 people from Connecticut and2,895 people from Rhode Island. However, during recentyears, the trend with both of these states has changed.Since 1996-97, the gain from Connecticut has been de-creasing in size, and, in the most recent year (2001-02),on net, Massachusetts actually lost forty-seven people tothe Nutmeg State.The change in the population exchangewith Rhode Island is even more dramatic. For the last fouryears, Massachusetts has been net-negative with RhodeIsland. In fact, over the last four years, on balance, Massa-chusetts has lost 6,323 people to Rhode Island.
It is important to realize that this recent downwardtrend started when the Massachusetts economy wasstrong. These were times when, because of many jobopportunities, our state should have been attracting, notlosing, people. Thus, the current losing trend does notsimply reflect the recent tough economic times butappears to be a problem with more complex roots. BothConnecticut and Rhode Island have been members of a
small subset of states from which Massachusetts attractsmore residents than it loses (Figure 7). If the current trendscontinue, Massachusetts will be even more net-negativeoverall in its loss of residents.
Given both the geography and the compact size ofthe Bay State, it is relatively easy to work in Massachusettsbut live in another state. (The same, for instance, is nottrue for people who work in California’s Silicon Valley orthe Research Triangle in North Carolina.) Lower housingcosts, more open space, and lower taxes are some of theattractions that draw people across the state’s borders. Ofcritical concern is the extent to which the out-migrantswho move to other New England states remain connect-ed to the Massachusetts labor market. Our analysis of the2000 Census data indicates that except for residents ofNew Hampshire and Rhode Island, the number of peoplewho sleep in another state but work in Massachusetts isnegligible. Even in New Hampshire and Rhode Island, asignificant majority of out-migrants both live and work in their new state of residence. In New Hampshire,
THE MASSACHUSETTS INSTITUTE FOR A NEW COMMONWEALTH 21
Figure 6Net Migration Between Massachusetts and Other New England States, 1990-2002
EXPANSIONRECESSION RECESSION
Num
ber
of P
eopl
e
3,000
2,000
1,000
0
-1,000
-2,000
-3,000
-4,000
-5,000
-6,000
-7,000
-8,000
-9,000
-10,000
1990
-91
1991
-92
1992
-93
1993
-94
1994
-95
1995
-96
1996
-97
1997
-98
1998
-99
1999
-00
2000
-01
2001
-02
Connecticut
Maine
New Hampshire
Rhode Island
Vermont
CT
VT
ME
RI
NH
Source: Author’s calculations of IRS data

slightly more than one-quarter of the out-migrants con-tinue to work in Massachusetts, and in Rhode Island,slightly less than one-quarter continue to work inMassachusetts. For those people who live in NewHampshire or Rhode Island and work in Massachusetts,other questions emerge about increased traffic, loss oflocal economic activity, and limited opportunities to participate in their local communities. But, again, thesepeople are the exception to the overall pattern of out-migrants. The overwhelming majority of people who leave the Bay State to live in another New Englandstate (80%) do not continue to work in Massachusetts.
When we examine the characteristics of in-migrants,they are remarkably similar. Massachusetts attracts a veryspecific type of person. No matter where they are comingfrom, they tend to be young, unmarried, highly educatedprofessionals and managers who work in knowledge sectors of the economy. But, the profile of New Englandout-migrants is especially noteworthy, because they lookdifferent from other out-migrants (Table 9). NewEngland migrants are slightly older than other migrants,and they are much more likely to have been born inMassachusetts. Over half (53%) of the New Englandmigrants were born in Massachusetts, compared with just under 36 percent of all other out-migrants.They arealso more likely to be married with children.While theyare well-educated, with 38.2 percent holding at least abachelor’s degree, not as many hold a college degree as do the rest of the migrant population, over 53 percent ofwhom hold at least a bachelor’s degree. Furthermore,compared to other out-migrants, they are less likely to
22 MASS.MIGRATION
Table 8Net Migration Between Massachusetts and the 50 States*
STATE NET MIGRATION, 1990-2002
Florida -99,082
New Hampshire -78,201
California -23,978
Maine -15,708
Georgia -11,331
Arizona -11,033
North Carolina -8,983
Texas -7,231
Virginia -7,220
Colorado -5,704
Washington -4,516
Maryland -4,354
Nevada -3,794
South Carolina -3,506
Vermont -3,014
District of Columbia -2,245
Oregon -1,483
Tennessee -1,117
New Mexico -954
Alabama -341
Minnesota -246
Hawaii -231
Kentucky -201
Alaska -148
Ohio -129
Delaware -95
Louisiana -74
Idaho -31
Montana -21
West Virginia -21
Mississippi -13
Oklahoma 11
Wisconsin 17
Wyoming 26
Missouri 30
Arkansas 65
Iowa 122
Kansas 174
Illinois 231
Indiana 236
Nebraska 292
Utah 326
Michigan 809
Pennsylvania 2,433
Rhode Island 2,895
New Jersey 9,672
Connecticut 14,997
New York 28,670
*Because of small migration flows that would violate disclosure rules, NorthDakota and South Dakota are excluded from the state migration data.
Source: Author’s calculations of IRS data.
Table 9Characteristics of Working-Age New England Out-Migrants
Compared to Other Out-Migrants (numbers in percent unless
otherwise noted)
NEW ENGLAND ALL OTHERCHARACTERISTIC OUT-MIGRANTS OUT-MIGRANTS
Bachelor’s Degree or Higher 38.2 53.6
Professional/Managerial Occupation 41.2 47.9
Knowledge Sector 43.3 48.6
Median Age (years) 33 31
Population 18-34 years old 56.0 60.4
Married 52.6 44.5
Children in Household 31.9 26.5
Born in Massachusetts 52.8 35.8
Source: U.S. Census, 2000 Census 1% Public Use Microdata Sample

work in the knowledge economy or occupy a profession-al or managerial position. If we add up all of these char-acteristics, it seems that Massachusetts is losing a signifi-cant number of native-born, middle-class families to therest of New England.
MIGRATION TO AND FROM OUR ECONOMIC
COMPETITOR STATES
As our demographic analysis has documented, migrantstend to be relatively young, well-educated, and morehighly concentrated in the knowledge sectors of the econ-omy. While Massachusetts is known for its high-tech,high-skilled industry mix, it is certainly not the only suchstate with this distinction. Accordingly, highly educated“knowledge workers” have many choices about where tolive and work. It is important to assess how well Massa-chusetts competes for these highly mobile and highlyvaluable workers. To do this, we study the migrationbetween Massachusetts and our economic competitorstates. For this analysis, we have identified a set of “high-
technology states” commonly recognized as EconomicCompetitors for Massachusetts. These states includeCalifornia, Colorado, Connecticut, Minnesota, New Jersey,and New York, which are the six “Leading TechnologyStates” identified by the Massachusetts Technology Colla-borative (MTC).24 We also include North Carolina, longseen as a competitor because of the presence of theResearch Triangle area adjacent to the University of NorthCarolina, Duke University, and North Carolina StateUniversity.
From 1990 through 2002, there was a considerableexchange of residents between Massachusetts and thesehigh-tech competitor states.Approximately 28 percent ofall the people entering Massachusetts since 1990 camefrom one of these seven states, while 23 percent of all thepeople leaving Massachusetts during the same periodmoved to one of these high-tech states. Overall, whencompared with our economic competitors, Massachusettshas been winning in the contest to attract people. Evenwith the past two years of shaky economic times, Massa-chusetts has been net-positive compared with our eco-nomic competitors. Overall, Massachusetts gained 14,428people from our economic competitors over the lasttwelve years (Figure 8).
A closer look, however, reveals considerable varia-tion in migration patterns between Massachusetts andindividual high-tech states (Figure 9). The distance of aprospective move appears to be an important considera-tion to a migrant (Figure 10). Since 1990, the largest ex-change of migrants occurred between Massachusetts andthe other Northeastern high-tech states—New York,New Jersey, and Connecticut. From 1990 through 2002,about one out of every five migrants (249,772 people)moved to Massachusetts from these three states. At thesame time, about 14 percent of migrants leaving Massa-chusetts (196,433 people) went to these three states.Even with the onset of the latest recession, Massachusettsgained 53,339 people from our regional competitorstates during the last twelve years.
The story changes when we examine migration pat-terns with more distant high-tech competitor states.Recall that the set of high-tech states outside theNortheast includes California, Colorado, Minnesota, andNorth Carolina. From 1990 through 2002, Massachusettsreceived 99,807 migrants from these states, representing
THE MASSACHUSETTS INSTITUTE FOR A NEW COMMONWEALTH 23
Figure 7Net Migration Flows Between Massachusetts and the other New
England States, 1990-2002
Source: Author’s calculations of IRS data
ME
VT
NH
CT RI

24 MASS.MIGRATION
8 percent of all migration into the state. In contrast,138,718 migrants left Massachusetts for one of these fourstates, representing nearly 10 percent of all out-migrants.Thus, we lost a total of 38,911 people to our long-dis-tance competitors. California, the most populous state,dominates the migration flows among these four states.From 1990 through 2002, 74,652 migrants moved from
California to Massachusetts, while 98,630 migrants leftthe state for California.That represents a total net loss of23,978 people to California. Over time, we are losingmore people to our competitor states outside theNortheast than we are attracting.
As has been noted, the profiles of the in-migrants areremarkable in their similarities (Table 10). Beyond just
Table 10 Characteristics of Different Working-Age In-Migrants Compared to the Non-Migrant Population
(numbers in percent unless otherwise noted)
ECONOMIC COMPETITOR NEW ENGLAND ALL OTHERCHARACTERISTIC IN-MIGRANTS IN-MIGRANTS IN-MIGRANTS NON-MIGRANTS
Bachelor’s Degree or Higher 50.1 49.2 54.1 32.4
Professional/Managerial Occupation 48.3 47.2 46.1 34.7
Knowledge Sector 52.2 51.0 52.0 41.5
Median Age (years) 28 29 30 41
Population 18-34 years old 67.2 65.3 65.3 32.9
Married 38.7 38.7 41.9 56.6
Children in Household 27.0 28.4 28.9 40.2
Born in Massachusetts 13.6 27.9 20.6 64.8
Source: U.S. Census, 2000 Census 1% Public Use Microdata Sample
Figure 8In-Migration and Out-Migration with Economic Competitor States, 1990-2002
EXPANSIONRECESSION RECESSION
Num
ber
of P
eopl
e
40,000
35,000
30,000
25,000
20,000
15,000
10,000
5,000
0
-5,000
-10,000
-15,000
-20,000
1990
-91
1991
-92
1992
-93
1993
-94
1994
-95
1995
-96
1996
-97
1997
-98
1998
-99
1999
-00
2000
-01
2001
-02
In-migration
Out-migration
Net-migration
Source: Author’s calculations of IRS data

THE MASSACHUSETTS INSTITUTE FOR A NEW COMMONWEALTH 25
raw numbers, the contrast between the profile ofEconomic Competitor out-migrants and all other out-migrants is striking, however (Table 11). Over 50 percentof migrants arriving in Massachusetts from our economiccompetitors have a baccalaureate degree or higher, as doover 61 percent of those leaving for these states. Theextraordinarily high level of education of these migrantsis quite different from that of the migrants who do notmove to these competitor states. For those out-migrants,a considerably smaller proportion—approximately 43percent—have a baccalaureate degree or higher.
In addition, more than 54 percent of migrants leav-ing Massachusetts for the Economic Competitor statesare managers and professionals, while over 48 percent ofthose arriving from the competitor states are in theseoccupations. That figure compares with just under 42 percent among the migrants leaving Massachusetts for all other states. Thus, the “brain exchange” with ourEconomic Competitors doesn’t only represent a signifi-cant portion of the total migration flows for Massachu-setts. Just as importantly, the Economic Competitormigrants are highly educated workers concentrated injobs that epitomize the future of the Massachusetts economy.
Table 11Characteristics of Working-Age Economic Competitor Out-
Migrants Compared to Other Out-Migrants (numbers in percent
unless otherwise noted)
ECONOMICCOMPETITOR ALL OTHER
CHARACTERISTIC OUT-MIGRANTS OUT-MIGRANTS
Bachelor’s Degree or Higher 61.2 43.0
Professional/Managerial Occupation 54.2 41.7
Knowledge Sector 55.5 42.8
Median Age (years) 30 33
Population 18-34 years old 67.8 54.7
Married 41.9 49.3
Children in Household 24.2 30.0
Born in Massachusetts 33.2 44.7
Source: U.S. Census, 2000 Census 1% Public Use Microdata Sample
Figure 9Net Migration with Regional and Distant Economic Competitor States, 1990-2002
Source: Author’s calculations of IRS data
EXPANSIONRECESSION RECESSION
Num
ber
of P
eopl
e
8,000
6,000
4,000
2,000
0
-2,000
-4,000
-6,000
-8,000
-10,000
1990
-91
1991
-92
1992
-93
1993
-94
1994
-95
1995
-96
1996
-97
1997
-98
1998
-99
1999
-00
2000
-01
2001
-02
Regional Competitors (Connecticut, New Jersey, New York)
Distant Competitors (California, Colorado, Minnesota, North Carolina)

26 MASS.MIGRATION
DISCUSSION
One of the principal findings of this study is that themigrant population is not like everybody else. Migrantsare younger, better educated, and more likely to work inthe knowledge economy than are the non-migrant popu-lation. These highly mobile individuals are attracted toregions of the country that can best utilize their educationand skills. Massachusetts, therefore, not only must com-pete with other high-technology regions of the countryfor jobs; it also must compete for qualified workers to fillthose jobs.25
Over the past twelve years Massachusetts’ perform-ance in this competition has been mixed. Overall, duringthis period, Massachusetts has lost significantly more peo-ple than it has attracted—leaving the state with a deficitof 213,000 domestic migrants. (The state’s populationand labor force grew slightly during this period becauseof a gain of international immigrants.) That aggregatenumber, however, masks important differences.While the
in-migrants that Massachusetts attracts are remarkablysimilar in their characteristics—young, unmarried, highlyeducated professionals and managers who work in theknowledge sectors of the economy—there are key dif-ferences among the out-migrants.
In the case of the New England out-migrant, Massa-chusetts appears to be losing many native-born, middle-class families to the other New England states. Between1990 and 2002, on net, Massachusetts lost almost 80,000people to the other New England states over the pasttwelve years. Moreover, the loss of these families hasaccelerated over the last five years. Significantly, the vastmajority of the people who migrate to another NewEngland state do not continue to work in Massachusetts.
In contrast, Massachusetts has been winning the com-petition for the Economic Competitor migrants, gaining,on net, over 14,000 of them over the last twelve years.Although we have been gaining residents from our region-al competitors, we have been losing residents to our long-
Figure 10Net Migration Flows Between Massachusetts and Economic Competitor States, 1990-2002
Source: Author’s calculations of IRS data
CA
TX
NY
FL
I L
PA
OH
MI
NJ
GA
NC
VA
I N
WA
TN
MO
WI
MD
AZ
MN
LA
AL
CO
KY
SCOK
OR
I A
MS
KS
AR
UT
NV
NM
WV
NE
I D
ME
NH
MT
SD
ND
WY
VT
RI
DE

distance competitors. It is uncertain what the futureexchange will look like, however, because the pattern ofexchange with Connecticut—a New England neighborand an Economic Competitor—has changed in recentyears. Historically, Connecticut has been an importantfeeder state for the Commonwealth, but if the currenttrend continues, Massachusetts will no longer be net-positive with Connecticut. This is clear evidence thatmigration patterns can and do change, suggesting that policy-makers cannot afford to be complacent in theirefforts to attract and retain knowledge workers and their families.
Although this study has focused on domestic migra-tion, it is important to note that another source of popu-lation inflow is international immigration. Immigrantshave become a key source of labor force growth inMassachusetts. A recent study by Andrew Sum and his colleagues documents the magnitude of internationalimmigration to New England and its importance to theMassachusetts labor market.26 It is clear that foreign immigrants to our state are playing a critical role in help-ing to keep our economy afloat. In a state with a steadyoutflow of workers, we have no workers to spare.
At the same time, it would be a mistake to think ofthese new immigrants as an economic substitute for themigrants who are leaving the state. Sum and his colleaguesdocument substantially lower levels of education amongthe new immigrants compared with the native-born.“About 25 percent of New England’s new immigrantslacked a high school diploma or GED, compared withonly 9 percent of the native born. At the same time, 31percent of the new immigrant workers held a bachelor’sdegree or higher, only slightly below the native-bornshare of 34 percent.”27 As this study documents, domesticmigrants have significantly higher levels of educationalattainment than either international immigrants or even the non-migrants. Furthermore, to the extent thatthe Commonwealth increasingly depends on internation-al immigrants to fuel its economy, it will have to be willing to bear the consequences if federal immigrationpolicies change, decreasing the number of visas availableto foreigners.
Policy-makers and business leaders across theCommonwealth should recognize that the growth of theknowledge sector industries in Massachusetts and all of its
regions—and the state’s economic recovery—willdepend in important ways on the degree to which we canretain and expand the available pool of well-educated“knowledge workers.” This includes both the EconomicCompetitor and New England migrants. Massachusettsfaces the ongoing challenge of making the Common-wealth the most attractive place for both highly mobileindividuals and native-born families to settle down and laydeep roots, in good and bad economic times.
A recent MassINC survey offers some insights aboutthis challenge. In this survey, one quarter of Massachusettsresidents said they would like to move out of the state ifthey had the opportunity. The people who would like tomove were clearly dissatisfied with the quality of life inMassachusetts, with 49 percent calling it either fair orpoor. The potential movers were also three times as likely as those who did not want move to believe that lifein Massachusetts is worse than in other parts of the coun-try. Personal finances and the high cost of living weredominant concerns for these people. In fact, their numberone reason for wanting to move was “to go somewherewith a lower cost of living or lower taxes.” In addition, thepotential movers cited other concerns such as the weath-er and congestion as reasons for their desire to leave.28
Overall, the survey demonstrates how issues around thequality of life must become a key part of the state’s eco-nomic strategy.
While leaders across the state must invest in bothattracting and retaining migrants, it would be a mistakefor the Commonwealth to depend entirely on in-migrantsfor its supply of knowledge workers. As this and otherstudies of migration have demonstrated, those thatmigrate to Massachusetts from other states are more like-ly to migrate from Massachusetts to other states in thefuture.While native residents of Massachusetts are gener-ally more reluctant to leave, the accelerating middle-classflight to New England suggests the need for strategies tohelp them stay as well. In addition, policy-makers shouldfurther support efforts to improve access to the educationand training programs—from basic skills and English language classes to improved access to higher education—needed by many native Massachusetts residents tothrive in the state’s 21st-century workplace.29 Previousanalysis of the employment and wage experiences ofworkers across the Commonwealth suggests that achiev-
THE MASSACHUSETTS INSTITUTE FOR A NEW COMMONWEALTH 27

ing this goal would assure and sustain future economicgrowth for the Commonwealth while providing new andbetter opportunities for a greater number of the state’sworking families.30
So there are multiple and simultaneous challenges:We must continue to attract—and do more to retain—skilled employees drawn to Massachusetts from otherstates.We must also work to enable native-born middle-
class families to make Massachusetts their home. And,finally, we must invest and extend opportunities to peo-ple who already live here, giving them access to the edu-cation and training they need to be able to command thebetter salaries provided by our leading industries. Then,they too will be able to share more broadly in the eco-nomic benefits, while helping to fuel a strong Massachu-setts economy.
28 MASS.MIGRATION

Endnotes1 Sum, Andrew M., Paul Harrington, Neeta Fogg, et al. 2002. The State of the American Dream in Massachusetts, 2002. MassINC.
2 Migration flow data are estimated from IRS tax records.The Internal Revenue Service compiles tax return data in order to esti-
mate annual state migration flows.This is done by comparing from year to year the states in which households file tax returns.
A migration is recorded whenever the state of filing is different from one year to the next. Each annual migration flow estimate
contains information on the aggregate number of exemptions. By using the exemptions data (which approximate household
size), we were able to estimate the number of individuals. As with all data, there are limitations to the IRS data. In the case of
the IRS data, only federal tax filers are included in the database. In addition, a person must appear in two consecutive years in
order to enter the database, which means the movements of some people may be missed by the IRS. Certain populations, par-
ticularly students, will not be tracked well by this data. Because of privacy concerns for individual families, there must be at least
10 observations in a given year for that state to be identified. If there are fewer than 10 observations, the migration is still record-
ed but not attached to the state.
As an alternative source of migration data, the Census Bureau calculates annual net migration estimates by state. It bases its esti-
mate on the IRS data but modifies these data to adjust for the over-65 population and for people who live in group quarters
(mental institutions, prisons, residential military bases, and student dormitories).There are limitations to the Census estimates,
in particular because of the difficulties of accurately estimating the student population. In addition, the Census data are net,
rather than gross migration. For each state, out-migration is subtracted from in-migration, leaving the net flow. Net migration
data make it impossible to chart origins or destinations of migrants, a key part of this study.We chose to use the IRS estimates
because they allow us to examine the destinations of those who leave Massachusetts and the origins of those who move to
Massachusetts. Despite its limitations, we are confident that the IRS data capture the pattern of migration related to labor force
movement as well as any other available data. We use Census data in this report to analyze individual characteristics of in-
migrants and out-migrants, something that the IRS data does not allow us to do.
3 Some of the migration measured by the IRS is related to retirement. Although the IRS data are not disaggregated by age, we use
the 2000 Census data to estimate the magnitude of retirement migration. Approximately 95 percent of all tax filers migrating
into Massachusetts were between 18 and 64 years old, and about 91 percent of the out-migrants were of working age. Clearly,
almost all of the migration is labor-force-related. However, there is one key exception: the state of Florida. Approximately 29
percent of the migrants departing Massachusetts for Florida are over 65 years old. Interestingly, 18 percent of the in-migrants
to Massachusetts from Florida are retirement age. Migration to the other New England states contains a slightly higher than aver-
age portion of people older than 65.
4 For more about the role of immigrants in the Massachusetts economy, see Sum, Andrew M., W. Neal Fogg, et al. 1999. The
Changing Workforce: Immigrants and the New Economy in Massachusetts, MassINC.
5 According to County Business Patterns, employment in the financial services industry (defined as banking, insurance, and asset
management) in Massachusetts in 2001 was 215,087. For more detail, see http://censtats.census.gov/cbpnaic/cbpnaic.shtml.
6 Massachusetts Biotechnology Council and the Boston Consulting Group. 2003. Mass Biotech 2010:Achieving Leadership in the Life
Sciences Economy.
7 See Harrington, P. and Fogg, N. 1997. Is There a Labor Shortage? A Review of the Evidence for Massachusetts and New England, Center
for Labor Market Studies, Northeastern University.
8 This analysis does not consider international immigration, although some of the people who migrate domestically are immigrants
who are already living in the United States.
THE MASSACHUSETTS INSTITUTE FOR A NEW COMMONWEALTH 29

9 The following discussion of the migration literature is informed by the work of J.L. Gallup and Michael Greenwood. See
Gallup, J.L. 1997.Theories of Migration. Development Discussion Paper No.569, Harvard Institute for International Development,
Harvard University; Greenwood, Michael. 1985. Human Migration:Theory, Models, and Empirical Studies. Journal of Regional
Science,Vol. 25, pp. 521-544; and Greenwood, Michael. 1996. Research on Internal Migration in the United States: A Survey.
In Regional Housing and Labor Markets, Manfred M. Fischer, Kenneth J. Button, and Peter Nijkamp, editors, pp. 397-433. Lyme,
NH: Elgar.
10 See Granovetter, M. 1973.The Strength of Weak Ties. American Journal of Sociology 78 (6), pp. 1360-1380; Granovetter, Mark
S. 1974. Getting a Job. Cambridge, MA: Harvard University Press.
11 Characteristics of migrants and non-migrants are derived from the 1% Public Use Microdata Sample (PUMS) of the 2000
Census of Population and Housing.These files contain records for a sample of households with information on the characteris-
tics of each unit and each person in it, while preserving confidentiality (by removing identifiers).These microdata files permit
users to analyze the demographic/socioeconomic characteristics of 1% of the respondents to the Census long-form question-
naire, administered to one in six housing units/households. Migrants and non-migrants are identified based on responses to the
“five-year residence question.” The long form which is used to construct the Public Use Sample of the 2000 Census contained
a question on the state of residence of the respondent in 1995. By comparing the state of residence in 1995 with the state of
residence in 2000, migrants can be identified. Note that if an individual migrates more than once between 1995 and 2000, only
one of the moves will be recorded. In addition, if a person leaves a state after 1995 and returns to the same state prior to the
Census date in 2000, this migration will go unrecorded.
12 Some of the in-migrants are immigrants from foreign countries. For the purpose of this study, if Massachusetts is not an inter-
national immigrant’s first stop in the United States, that person would be counted as a domestic migrant because he moves to
Massachusetts from another state. In fact, slightly more than 15 percent of in-migrants were not born in the United States.
13 Some of the out-migrants who leave Massachusetts for another state are international immigrants.We find that slightly more
than 13 percent of out-migrants were not born in the United States.
14 U.S. Department of Education, National Center for Education Statistics. 2001. Integrated Postsecondary Education Data System (IPEDS),
Spring 2001 (Table 19, page 37). Title IV Institutions include degree and certificate granting postsecondary institutions that
participate in the federal financial aid programs. This includes vocational and trade schools as well as more traditional higher
education institutions.
15 Estimating the migration patterns of students is a tricky enterprise because of their transient nature. Neither the Census nor
the IRS does a good job of capturing their movement. For the decennial Census, students are supposed to be counted at their
actual address at the time of the census, not as members of their parents’ household, but in reality the latter often occurs. In
addition, the Census has a difficult time counting students because their response rate is so low. Because of the problem of get-
ting an accurate count of the student population, it is difficult to follow their migration patterns.We know that some students
who come to Massachusetts for college decide to stay in Massachusetts after graduation, joining the Massachusetts labor force.
These students will not be picked up by the IRS as in-migrants unless they filed federal tax returns on their own listing a non-
Massachusetts address during their student years. The number who fit that description is likely small. Rather, it would seem
that the majority of undergraduates would be claimed as dependents by their parents and hence would not file their own tax
return during their college years. If their first tax return is filed in Massachusetts, then they will not be counted as an in-
migrant. On the flip side, we have the same “counting” problem in reverse with Massachusetts students who leave the state to
attend college and do not return after graduation.Thus, to some extent, the Massachusetts students who do not return to the
state offset the new out-of-state graduates who join the Massachusetts workforce. But the magnitude of this exchange is not
known. Given that we attract more students into the state than we lose, it seems likely that we are net-positive in the after-
graduation exchange. There is also the difficulty of how students affect the count of out-migrants. One advantage of the IRS
data is that we will not inadvertently count out-of-state students who leave Massachusetts after graduation as out-migrants.
While this research focuses on the migration patterns of workers, the student question deserves further investigation.
30 MASS.MIGRATION

16 We thank UMass Boston Professor Alan Clayton-Matthews for suggesting this procedure.
17 This figure does not take into account any of the state’s residents who initially came into the state to attend college and have
remained in the state after graduation.
18 For more information, see Kodrzycki, Yolanda. 2001. Migration of Recent College Graduates: Evidence from the National
Longitudinal Survey of Youth, New England Economic Review 1 (January-February).
19 Forrant, Robert, Phillip Moss, and Chris Tilly. 2001. Knowledge Sector Powerhouse:Reshaping Massachusetts Industries and Employment
during the 1980s and 1990s. Donahue Institute, University of Massachusetts.
20 The knowledge sector includes the following industries, as defined by the North American Industry Classification system:
Information Technology; Finance, Insurance, and Real Estate; Professional, Scientific,Administrative, and Management Services;
and Education, Health, and Social Services.
21 For this analysis, we rely on the IRS data and thus it is not limited to the working-age population, although recall that almost
all of migration consists of working-age people.
22 Because of privacy concerns, the IRS does not disclose the number of migrants in a given state in a given year if the number of
migrants is fewer than 10 people. Both North and South Dakota had fewer than 10 migrants every year between 1990 and 2002,
and therefore, neither state appears in the final rankings.
23 U.S. Census Bureau. 2003. Migration of the Young,Single,and College Educated:1995 to 2000. Census 2000 Special Reports, November.
24 Note that there is one state, Connecticut, that counts as both as an Economic Competitor and as a New England state.
25 Florida, Richard. 2002. The Rise of the Creative Class:And How It’s Transforming Work, Leisure, Community and Everyday Life. New York:
Basic Books.
26 Sum, Andrew, Mykhaylo Trubs’kyy, and Neeta P. Fogg. 2003. Imported Talent. Connection:The Journal of the New England Board
of Higher Education, Summer, pp. 16-18.
27 Ibid, page 18.
28 See Princeton Survey Research Associates. 2003. The Pursuit of Happiness:A Survey on the Quality of Life in Massachusetts. MassINC.
29 Comings, John, Andrew Sum, and Johan Uvin. 2000. New Skills for a New Economy:Adult Education’s Key Role in Sustaining Economic
Growth and Expanding Opportunity, MassINC.
30 Goodman, M. and Nakosteen R. 2002.The Massachusetts Knowledge Sector: A Regional Perspective. Massachusetts Benchmarks
5 (2).
THE MASSACHUSETTS INSTITUTE FOR A NEW COMMONWEALTH 31
MASSINC SPONSORS
Ronald M. Ansin Foundation
Associated Industries ofMassachusetts
The Beal Companies, LLP
Blue Cross Blue Shield ofMassachusetts
Boston Carmen’s Union
The Boston Foundation
Boston University
Citizens Bank
Commonwealth Corporation
Irene E. & George A. Davis Foundation
EMC Corporation
Fidelity Foundation
Fidelity Investments
The Paul & Phyllis Fireman Charitable Foundation
FleetBoston Financial Corporation
Fleet Charitable Trust Services
Foley Hoag LLP
Chris & Hilary Gabrieli
Gardiner Howland Shaw Foundation
The Gillette Company
Goodwin Procter LLP
Harvard University
Teresa and H. John Heinz IIIFoundation
Holland & Knight LLP
Home Builders Association ofMassachusetts
IBM
KeySpan Energy Delivery
Liberty Mutual Group
Massachusetts AFL-CIO
Massachusetts Building Trades Council
Massachusetts Foundation for theHumanities
Massachusetts TechnologyCollaborative
MassDevelopment
MassHousing
The McCourt Company, Inc.
Mellon New England
MENTOR Massachusetts
ML Strategies, LLC
Monitor Group
National Grid
Nellie Mae Education Foundation
New England Regional Council ofCarpenters
Newman Communications
Northeastern University
The Noyce Foundation
The Omni Parker House
O’Neill & Associates
Palmer & Dodge LLP
Partners HealthCare System, Inc.
PG&E National Energy Group
The Polaroid Fund
Recycled Paper Printing, Inc.
Fran & Charles Rodgers
RSA Security Inc.
Savings Bank Life Insurance
William E. & Bertha E. SchrafftCharitable Trust
Skadden, Arps, Slate, Meagher & Flom LLP
State House News Service
State Street Corporation
Trefler Foundation
Tufts Health Plan
Tufts University College of Citizenship& Public Service
Verizon Communications
32 MASS.MIGRATION
CITIZENS’ CIRCLE
Ronald M. Ansin
Joan & John Bok
Ian & Hannah Bowles
Andrew J. Calamare
Heather & Charles Campion
Marshall N. & Mary M. Carter
Celine McDonald & Vin Cipolla
Martha & Neil Chayet
Margaret J. Clowes
Dorothy & Edward Colbert
Michael F. Cronin
Thomas G. Davis
Edward & Paula DeMore
Tim Duncan
Philip J. Edmundson
Susan & William Elsbree
Helen Evans Febbo & Al Febbo
Marsha & David Feinberg
Robert B. Fraser
Chris & Hilary Gabrieli
Darius W. Gaskins, Jr.
Barbara & Steve Grossman
Harold Hestnes
Arnold Hiatt
Jon B. Hurst
Robin & Tripp Jones
Sara & Hugh Jones
Dennis M. Kelleher
Julie & Mitchell Kertzman
Stephen W. Kidder & Judith Malone
Gloria & Allen Larson
Paul & Judy Mattera
Peter & Rosanne Bacon Meade
James T. Morris
John E. Murphy, Jr.
Paul Nace & Sally Jackson
Fred Newman
Bill Nigreen
Paul C. O’Brien
Hilary Pennington & Brian Bosworth
Finley H. Perry, Jr.
Colette A. M. Phillips
Daniel A. Phillips
Michael Pill
Michael E. Porter
Fran & Charles Rodgers
Barbara & Stephen Roop
Ellen Roy & Bruce Herzfelder
John Sasso
Karen Schwartzman
Alan D. Solomont & Susan Lewis Solomont
Helen B. Spaulding
Patricia & David F. Squire
M. Joshua Tolkoff
Pamela & Alan Trefler
Ron Unz
Robert White
Leonard A. Wilson
Ellen M. Zane

BOARD OF DIRECTORS
Gloria Cordes Larson, Co-Chairman
Peter Meade, Co-Chairman
Joseph D. Alviani
Andrew J. Calamare
Heather P. Campion
Kathleen Casavant
Neil Chayet
Vincent Cipolla
Mark Erlich
David H. Feinberg
Robert B. Fraser
Chris Gabrieli
C. Jeffrey Grogan
Steve Grossman
Rev. Raymond Hammond
Bruce Herzfelder
Harold Hestnes
Joanne Jaxtimer
Jeffrey Jones
Tripp Jones
Elaine Kamarck
R.J. Lyman
Paul Mattera
Kristen McCormack
Melvin B. Miller
Hilary C. Pennington
Michael E. Porter
Mark E. Robinson
Charles Rodgers
Alan D. Solomont
Benaree P. Wiley
BOARD OF POLICY ADVISORS
ECONOMIC PROSPERITY INITIATIVE:
Wayne M. Ayers, FleetBoston Financial
Peter D. Enrich, Northeastern University
Rosabeth Moss Kanter, Harvard Business School
Edward Moscovitch, Cape Ann Economics
Andrew Sum, Northeastern University
David A. Tibbetts, Merrimack Valley Economic
Development Council
LIFELONG LEARNING INITIATIVE:
Harneen Chernow, AFL-CIO of Massachusetts
Carole A. Cowan, Middlesex Community College
William L. Dandridge, Lesley University
John D. Donahue, John F. Kennedy School of Government
Michael B. Gritton, City of Louisville
Sarah Kass, City on a Hill Charter School
Leonard A. Wilson, First Essex Bank
SAFE NEIGHBORHOODS INITIATIVE:
Jay Ashe, Hampden County House of Correction
William J. Bratton, The Bratton Group LLC
Mark A. R. Kleiman, UCLA School of Public Policy and
Social Research
Anne Morrison Piehl, John F. Kennedy School of Government
Eugene F. Rivers 3d, Ella J. Baker House
Donald K. Stern, Bingham Dana, LLP
CIVIC RENEWAL INITIATIVE:
Alan Khazei, City Year
Larry Overlan, Stonehill College
Jeffrey Leigh Sedgwick, University of Massachusetts Amherst
MASSINC STAFF
ADMINISTRATION
Ian Bowles, Executive Director
POLICY
Dana Ansel, Ph.D., Research Director
Jennifer Candon, Assistant Director, Center for Education Research
and Policy
Christopher Fox, Director of Policy Planning
S. Paul Reville, Director, Center for Education Research and Policy
John Schneider, Director of Programs and Operations
Rachel Deyette Werkema, Deputy Research Director
COMMONWEALTH MAGAZINE
Robert Keough, Editor
Michael Jonas, Associate Editor
Robert Sullivan, Associate Editor
DEVELOPMENT & COMMUNITY AFFAIRS
Lori Davis Febbo, Director
Ben Geffen, Deputy Director
COMMUNICATIONS
Jennifer Armini, Director
OUTREACH & OPERATIONS
John Donato, Outreach Director & New Media Manager
Emily Wood, Deputy Outreach Director
Heather Kramer Hartshorn, Graphic Designer
Colleen Lynch, Executive Assistant & Director of Operations
David N. Martin, Controller/IT Director
MassINCTHE MASSACHUSETTS INSTITUTE FOR A NEW COMMONWEALTH
Publisher of CommonWealth magazine
PRESORTEDSTANDARD
U.S. POSTAGEPAID
HOLLISTON, MAPERMIT NO. 72
$15.00
18 Tremont Street, Suite 1120Boston, Massachusetts 02108
www.massinc.org