massive multi-frequency eddy current method for clad ...pe.org.pl/articles/2016/4/15.pdf · for...
TRANSCRIPT

56 PRZEGLĄD ELEKTROTECHNICZNY, ISSN 0033-2097, R. 92 NR 4/2016
Paweł Karol FRANKOWSKI, Tomasz CHADY
Department of Electrical and Computer Engineering, West Pomeranian University of Technology, Szczecin
doi:10.15199/48.2016.04.15
Massive Multi-Frequency Eddy Current Method for Clad Material Inspection
Abstract. The aim of this paper is to present a massive multi-frequency method for detection of cracks in clad materials. A system excited by a voltage waveform obtained as a sum of many sinusoidal components is proposed for this purpose. Studies show that, the multi-frequency method can be successfully used for detection and assessment of the defects depth in such kind of materials. The experimental verification is done and selected results of measurements are presented.
Streszczenie. W artykule przedstawiono wykorzystanie wieloczęstotliwościowej metody wiroprądowej do wykrywania wad w materiałach wielowarstwowych. System zasilany był sygnałem będącym sumą wielu sinusoid o różnych częstotliwościach. Badania wykazały, że metoda może być zastosowana do wykrywania wad i identyfikacji ich głębokości w tego typu materiałach. Przeprowadzono weryfikację metody drogą eksperymentalną, a wybrane wyniki pomiarów przedstawiono w niniejszej pracy. Wykorzystanie wieloczęstotliwościowej metody wiroprądowej do wykrywania wad w materiałach wielowarstwowych
Keywords: non-destructive testing, clad material, multi-frequency method, eddy current inspection Słowa kluczowe: badania nieniszczące, materiały powlekane, metoda wieloczęstotliwościowa, badania wiroprądowe
Introduction Clad materials are manufactured by roll bonding a backing with a specialty metal to produce a metallurgically bonded clad. Many metals can be combined through this technique to achieve a structure with specific desired properties. The combination of two or more metals can be left in the form of a sandwich (single plate) or formed into a finished part ranging from chemical processing chambers, pressure vessels to simple clad pipes. Clad materials can be cut and formed by most of standard operations, which include a shearing, plasma cutting, drawing, bending, hot forming, machining, drilling and punching. The most important advantage of the clad materials is that the end product combines the superior properties of each metal component e.g.: strength, corrosion resistance, lightweight, lower cost, thermal or electric conductivity. Properties of the structure depend on components. Therefore, clad materials can be used in many demanding industries, including health, paper, food and of course petroleum processing and transmission. Especially, important for this paper is the fact, the this kind of materials are being used in critical equipment for deep-water oil and gas exploration. However, even such high performance materials have some limitations and during the exploitation can be damaged. Therefore, periodical inspections are required [1]. Ideally, such testing should be done without damaging of structures and stopping exploitation. In many cases (especially in the case of the pipelines) it is also extremely important to precisely control produced materials after manufacturing and before starting an exploitation. The purpose of this paper is to present application of multi-frequency eddy current method for inspections of such materials. Method The method based on the fact that low frequencies electromagnetic fields have a large skin depth and hence give clear signals from structures that are located away from the coil (e.g. deeply located inhomogeneity). Because of the different skin depths at different frequencies, the relationship between signals caused by the defects and layers changes with the frequency significantly. Consequently, it is possible to combine the signals from many different frequencies. Tests prove that the multi-frequency excitation and spectrogram (MFES) method [2] allows to observe changes of the structures as changes of the signals’ spectrograms. The frequencies where the amplitude of sinusoidal signal is highest changes together
with a depth of changes in the tested structure. That can be useful in applications such as measuring the thickness of conductive coatings on conductive base metal, detection and identification flaws in the material surface, differentiating between flaws in various layers of built-up structure. The additional advantages is that utilization of numerous frequency components in the excitation signal allow to fully test the structure as every single frequency consists independent information. Therefore, impact of noise can be reduced. Moreover presented method is much faster than Swept Frequency Methods and can be used complementary or as a substitute for the standard ECT.
System One of the most important things is to correctly select a transducer size [3]. To put it simple, small transducers have a good spatial resolution and when the distance between transducer and discontinuity in a sample is low, then the accuracy is high. The larger transducers have a good sensitivity, therefore are used when the distance is higher (e.g. deeply located inhomogeneity).
Fig.1. View of the ECT probe sensitive to a flaw orientation.
The utilized electromagnetic system consists of presented in Fig. 1 a small eddy current transducer (ECT) with a pick-up coil and four exciting coils (all mounted on a ferromagnetic core) and four subsystems: a XYZ scanner, an excitation subsystem, a data acquisition subsystem and a controlling computer. The changes of magnetic field caused by the defects are monitored by the pick-up coil. The AC voltage from the pick-up coil is fed to a control computer, where the received signal is decomposed by the FFT (Fast Fourier Transform) algorithm. The block diagram of the system [2]is presented in Fig. 2.
Exciting coils 25 turns, 0.14mm
Pickup coil 100 turns, 0.02mm
Ferrite core
6 mm
8 m
m
E1 E2
E3 E4
PRZEGLĄD ELEKTROTECHNICZNY, ISSN 0033-2097, R. 92 NR 4/2016 57
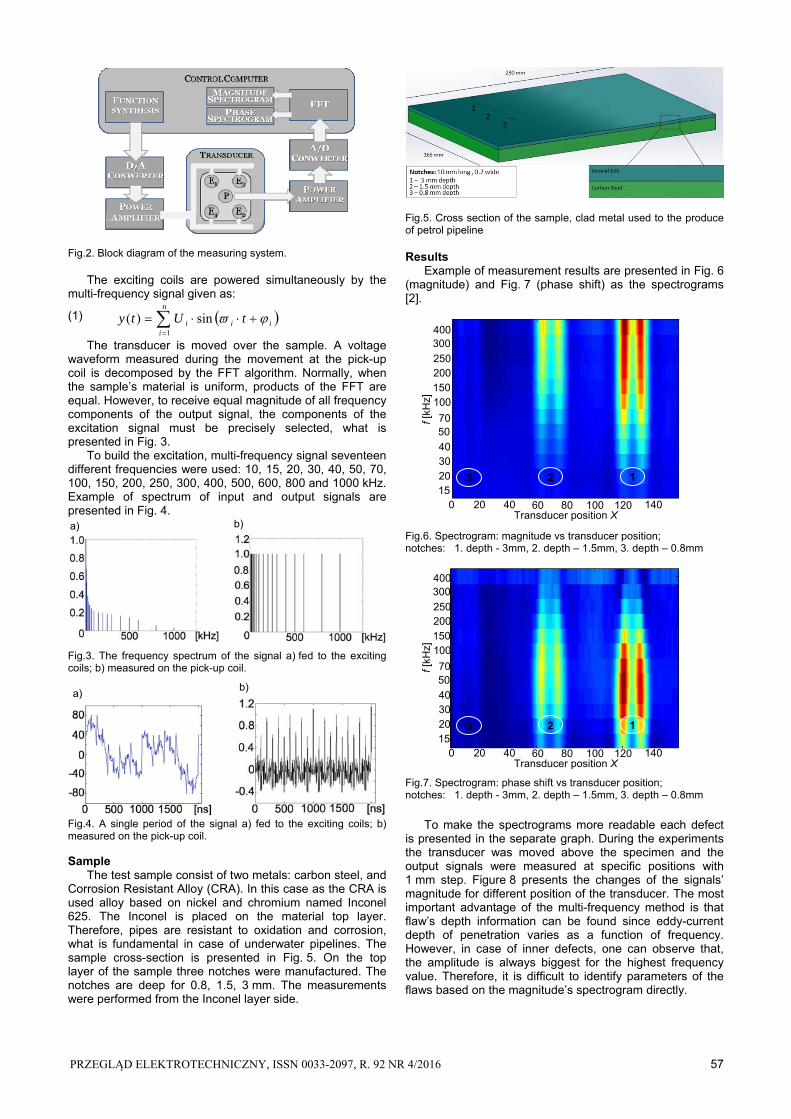
Fig.2. Block diagram of the measuring system. The exciting coils are powered simultaneously by the multi-frequency signal given as:
(1)
n
iiii tUty
1
sin)(
The transducer is moved over the sample. A voltage waveform measured during the movement at the pick-up coil is decomposed by the FFT algorithm. Normally, when the sample’s material is uniform, products of the FFT are equal. However, to receive equal magnitude of all frequency components of the output signal, the components of the excitation signal must be precisely selected, what is presented in Fig. 3. To build the excitation, multi-frequency signal seventeen different frequencies were used: 10, 15, 20, 30, 40, 50, 70, 100, 150, 200, 250, 300, 400, 500, 600, 800 and 1000 kHz. Example of spectrum of input and output signals are presented in Fig. 4.
Fig.3. The frequency spectrum of the signal a) fed to the exciting coils; b) measured on the pick-up coil.
Fig.4. A single period of the signal a) fed to the exciting coils; b) measured on the pick-up coil. Sample The test sample consist of two metals: carbon steel, and Corrosion Resistant Alloy (CRA). In this case as the CRA is used alloy based on nickel and chromium named Inconel 625. The Inconel is placed on the material top layer. Therefore, pipes are resistant to oxidation and corrosion, what is fundamental in case of underwater pipelines. The sample cross-section is presented in Fig. 5. On the top layer of the sample three notches were manufactured. The notches are deep for 0.8, 1.5, 3 mm. The measurements were performed from the Inconel layer side.
Fig.5. Cross section of the sample, clad metal used to the produce of petrol pipeline Results Example of measurement results are presented in Fig. 6 (magnitude) and Fig. 7 (phase shift) as the spectrograms [2].
Fig.6. Spectrogram: magnitude vs transducer position; notches: 1. depth - 3mm, 2. depth – 1.5mm, 3. depth – 0.8mm
Fig.7. Spectrogram: phase shift vs transducer position; notches: 1. depth - 3mm, 2. depth – 1.5mm, 3. depth – 0.8mm
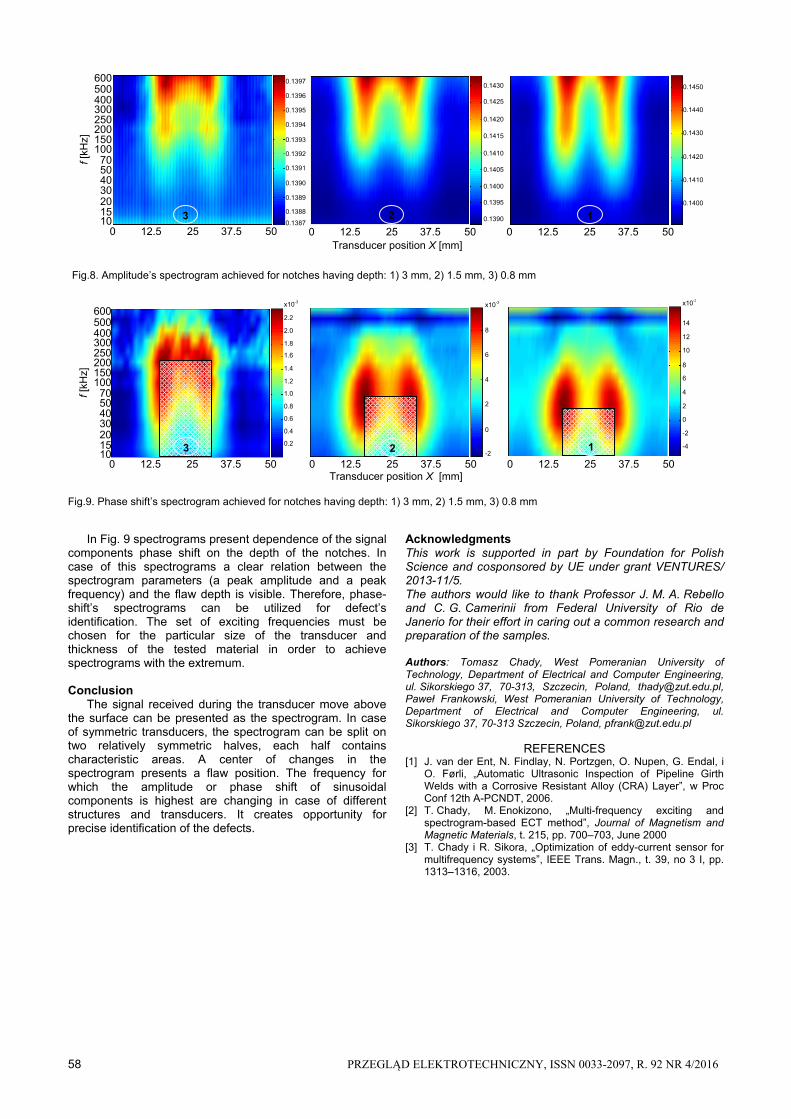
To make the spectrograms more readable each defect is presented in the separate graph. During the experiments the transducer was moved above the specimen and the output signals were measured at specific positions with 1 mm step. Figure 8 presents the changes of the signals’ magnitude for different position of the transducer. The most important advantage of the multi-frequency method is that flaw’s depth information can be found since eddy-current depth of penetration varies as a function of frequency. However, in case of inner defects, one can observe that, the amplitude is always biggest for the highest frequency value. Therefore, it is difficult to identify parameters of the flaws based on the magnitude’s spectrogram directly.
3 2 1
250
300400
100150200
40
5070
152030
0 20 40 60 80 100 120 140
f [kH
z]
Transducer position X [ ]
a)
f [kH
z]
Transducer position X [ ]
3 2 1
250
300400
100150200
40
5070
152030
0 20 40 60 80 100 120 140
b)
a) b)
58 PRZEGLĄD ELEKTROTECHNICZNY, ISSN 0033-2097, R. 92 NR 4/2016
Fig.8. Amplitude’s spectrogram achieved for notches having depth: 1) 3 mm, 2) 1.5 mm, 3) 0.8 mm
Fig.9. Phase shift’s spectrogram achieved for notches having depth: 1) 3 mm, 2) 1.5 mm, 3) 0.8 mm In Fig. 9 spectrograms present dependence of the signal components phase shift on the depth of the notches. In case of this spectrograms a clear relation between the spectrogram parameters (a peak amplitude and a peak frequency) and the flaw depth is visible. Therefore, phase-shift’s spectrograms can be utilized for defect’s identification. The set of exciting frequencies must be chosen for the particular size of the transducer and thickness of the tested material in order to achieve spectrograms with the extremum. Conclusion The signal received during the transducer move above the surface can be presented as the spectrogram. In case of symmetric transducers, the spectrogram can be split on two relatively symmetric halves, each half contains characteristic areas. A center of changes in the spectrogram presents a flaw position. The frequency for which the amplitude or phase shift of sinusoidal components is highest are changing in case of different structures and transducers. It creates opportunity for precise identification of the defects.
Acknowledgments This work is supported in part by Foundation for Polish Science and cosponsored by UE under grant VENTURES/ 2013-11/5. The authors would like to thank Professor J. M. A. Rebello and C. G. Camerinii from Federal University of Rio de Janerio for their effort in caring out a common research and preparation of the samples.
Authors: Tomasz Chady, West Pomeranian University of Technology, Department of Electrical and Computer Engineering, ul. Sikorskiego 37, 70-313, Szczecin, Poland, [email protected], Paweł Frankowski, West Pomeranian University of Technology, Department of Electrical and Computer Engineering, ul. Sikorskiego 37, 70-313 Szczecin, Poland, [email protected]
REFERENCES [1] J. van der Ent, N. Findlay, N. Portzgen, O. Nupen, G. Endal, i
O. Førli, „Automatic Ultrasonic Inspection of Pipeline Girth Welds with a Corrosive Resistant Alloy (CRA) Layer”, w Proc Conf 12th A-PCNDT, 2006.
[2] T. Chady, M. Enokizono, „Multi-frequency exciting and spectrogram-based ECT method”, Journal of Magnetism and Magnetic Materials, t. 215, pp. 700–703, June 2000
[3] T. Chady i R. Sikora, „Optimization of eddy-current sensor for multifrequency systems”, IEEE Trans. Magn., t. 39, no 3 I, pp. 1313–1316, 2003.
f [kH
z]
600
10
40
70
150
250
400
0 50 25 37.512.5 0 5025 37.512.5 0 5025 37.5 12.5
0 50 25 37.512.5 0 5025 37.512.5 0 5025 37.5 12.5
500
300
200
100
50
30
15 20
f [kH
z]
600
10
40
70
150
250
400 500
300
200
100
50
30
15 20
Transducer position X [mm]
Transducer position X [mm]
0.1387
0.1389
0.1388
0.1390
0.1391
0.1392
0.1394
0.1393
0.1395
0.1396
0.1397
0.1395
0.1390
0.1400
0.1405
0.1410
0.1420
0.1415
0.1425
0.1430
0.1400
0.1410
0.1420
0.1430
0.1440
0.1450
0.4
0.8
0.6
1.0
1.2
1.4
1.8
1.6
2.0
2.2
x10-3
0.2
0
2
4
8
6
x10-3
-2
-2
2
0
4
6
8
12
10
14
x10-3
-4
3 2 1
1 23