mass.gov - meeting of the market oversight and ......2019/10/02 · analyze the total number and...
TRANSCRIPT

Meeting of the Market Oversight and Transparency Committee
October 2, 2019

Call to Order
Approval of Minutes from June 5, 2019 Meeting
Prescription Drug Coupon Study: Preliminary Results
Primary Care Workforce: Nurse Practitioners
Reducing Administrative Complexity
Schedule of Next Meeting (November 20, 2019)
AGENDA

Call to Order
Approval of Minutes from June 5, 2019 Meeting
Prescription Drug Coupon Study: Preliminary Results
Primary Care Workforce: Nurse Practitioners
Reducing Administrative Complexity
Schedule of Next Meeting (November 20, 2019)
AGENDA

VOTE: Approving Minutes
5
MOTION: That the Commission hereby approves the minutes of the Commission meeting held on June 5, 2019 as presented.

5
Agenda
Day One • Remarks: Governor Baker & Speaker
DeLeo • Expert Presentation: Health Care Cost
Trends • Panel 1: Confronting Complexity in the
Health Care System • Panel 2: Pharmaceutical Market Trends
and Cost Drivers • Public Testimony Day Two • Remarks: Attorney General Healey and
Senate President Spilka • Expert Presentation: State Policies to
Enhance Primary Care • Panel 3: Strengthening Primary and
Behavioral Health Care • Panel 4: Provider Market Trends and
Cost Drivers
REGISTER TODAY! Health Care Cost Trends Hearing VII, Oct 22-23

Call to Order
Approval of Minutes from June 5, 2019 Meeting
Prescription Drug Coupon Study: Preliminary Results
– Market Landscape: Trends in Value, Type, and Use of Coupons – Impact on Adherence – Impact on Spending
Primary Care Workforce: Nurse Practitioners
Reducing Administrative Complexity
Schedule of Next Meeting (November 20, 2019)
AGENDA

7
Background: Authorization of Drug Coupons in the Commonwealth
Chapter 139 of the Acts of 2012 authorizes drug manufacturers to provide consumers with drug coupons and vouchers. Continues ban on drug coupons for AB rated generic equivalents. Sunsets the authorization of drug coupons (January 2015).
In 2014 and 2016, the Legislature delayed the sunset on drug coupon authorization.
Chapter 363 of the Acts of 2018 delays the sunsets until January 1, 2020,
and directs the HPC to conduct a study on the matter.
Legislative History

8
Statutory Language Directing the HPC to Complete a Study on Use of Prescription Drug Coupons in the Commonwealth
Chapter 363 of the 2018 Session Laws, An Act Extending the Authorization for the Use of Certain Discount Vouchers for Prescription Drugs, was signed into law on January 2, 2019. It charges the HPC with conducting an analysis and issuing a report evaluating the effect of drug coupons and product vouchers for prescription drugs on pharmaceutical spending and health care costs in Massachusetts.
Analyze the total number and value of coupons redeemed in the Commonwealth, and the types of drugs for which coupons were most frequently redeemed. Compare any change in utilization of generic versus brand name prescription drugs and any change in utilization among therapeutically-equivalent brand name drugs. Analyze effects on patient adherence and access to innovative therapies. Study the availability of coupons or discounts upon renewals and the cost impact on consumers upon expiration of coupons. Analyze the impact of drug coupons on health care cost containment goals adopted by the Commonwealth and commercial and GIC health insurance premiums and drug costs.
1
2
3
4
5

9
Defining Drug Coupons for HPC Analysis
Prescription drug coupons offered by manufacturers reduce the amount of a patient’s cost-sharing, as established by the patient’s insurance plan. Common terms: coupon, voucher, copay card Distinct from:
Patient assistance programs offered by manufacturers, states, or charities for patients who cannot afford their medication.
Cards or offers that reduce prices for patients without insurance. Public payers (e.g., Medicare, Medicaid, VA) do not allow the use of coupons.

10
Flow of Drug Coupons in Patient Out-of-Pocket Spending
Source: Adapted from Memorial Sloan Kettering Cancer Center: Copay Assistance Programs. Available at: https://comm.ncsl.org/productfiles/119423533/DrugPricing-ChenPowerPoint.pdf
Manufacturer PBM/Plan
Patient
1. Patient downloads coupon
2. Patient gives $300 coupon and $310 cash
3. Pharmacy reports to plan that patient paid $610 (actually paid $310)
4. Plan records $610 in patient out-of-pocket spending
Pharmacy
Example: Patient is responsible for cost-sharing of $610, based on insurance plan
11
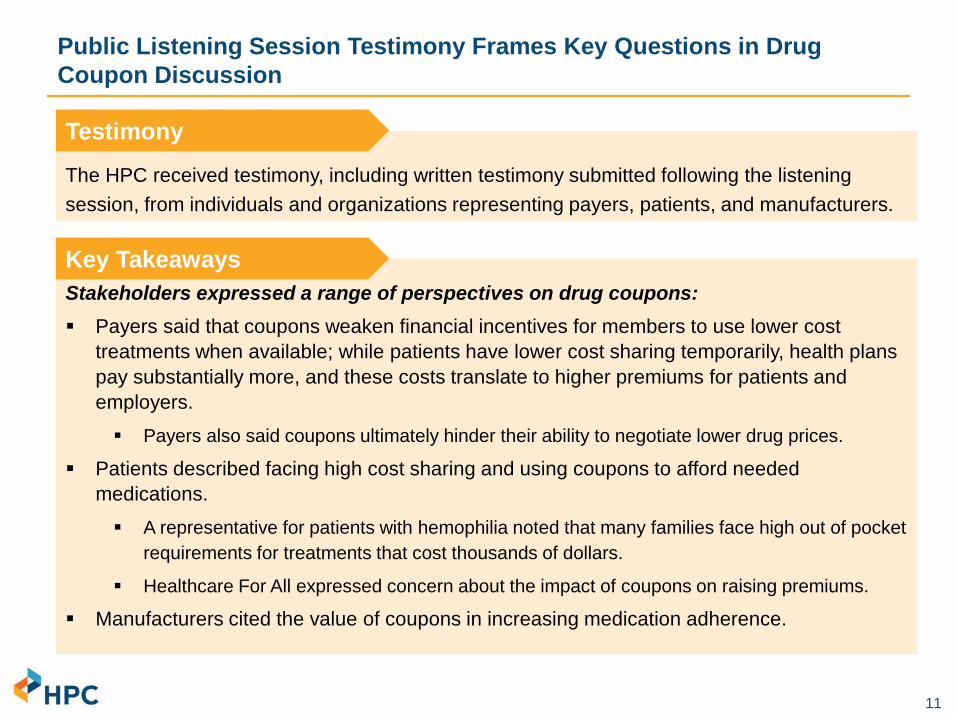
Public Listening Session Testimony Frames Key Questions in Drug Coupon Discussion
The HPC received testimony, including written testimony submitted following the listening session, from individuals and organizations representing payers, patients, and manufacturers.
Testimony
Stakeholders expressed a range of perspectives on drug coupons: Payers said that coupons weaken financial incentives for members to use lower cost
treatments when available; while patients have lower cost sharing temporarily, health plans pay substantially more, and these costs translate to higher premiums for patients and employers.
Payers also said coupons ultimately hinder their ability to negotiate lower drug prices.
Patients described facing high cost sharing and using coupons to afford needed medications.
A representative for patients with hemophilia noted that many families face high out of pocket requirements for treatments that cost thousands of dollars.
Healthcare For All expressed concern about the impact of coupons on raising premiums.
Manufacturers cited the value of coupons in increasing medication adherence.
Key Takeaways

12
Data Sources Used for HPC Drug Coupon Research
Academic literature
Public testimony
All Payer Claims Database
Vendor data: Symphony Health
All commercially available Symphony pharmacy claims across multiple payers in Massachusetts, 2011-2018.
Plan payments, patient out of pocket payments, and coupon use.
Database has pharmacy claims for 1.1 million unique commercial patients in 2018. Based on HPC analysis of CHIA data, an estimated 2.9 million unique commercial
members had at least one pharmacy claim.
Symphony Health is a national data services vendor. Symphony’s Integrated Dataverse (IDV)® database contains pharmacy transaction data including:

Call to Order
Approval of Minutes from June 5, 2019 Meeting
Prescription Drug Coupon Study: Preliminary Results
– Market Landscape: Trends in Value, Type, and Use of Coupons – Impact on Adherence – Impact on Spending
Primary Care Workforce: Nurse Practitioners
Reducing Administrative Complexity
Schedule of Next Meeting (November 20, 2019)
AGENDA

14
Drug coupon values vary widely, with an average value of $229 and a median value of $55 in 2018.
Notes: Analysis restricted to commercial patients and claims with coupons used for branded drugs. Source: Symphony Health IDV® database
For drugs where coupons were used, patient out-of-pocket exposure was 21% of total spending; but using coupons, patients only paid 3% of total spending out-of-pocket.

15
Coupon programs and their uptake have expanded in Massachusetts since 2012, and average coupon values continue to rise.
Notes: Analysis restricted to commercial patients and claims with coupons used for branded drugs. Source: HPC analysis of Symphony Health IDV® database
Average coupon value per claim using a drug coupon, 2012 - 2018

16
As patient out-of-pocket exposure continues to rise, coupons have the largest benefit for patients with high out-of-pocket exposure.
Notes: Analysis restricted to commercial patients and claims for branded drugs. Analysis includes claims with and without coupons. Source: Symphony Health IDV® database
Average patient out of pocket exposure per branded drug claim and patient spending net of coupons, 2012 - 2018
$96 $96
$119
$186
$91 $81 $84
$105
$29 $25 $30
$42
$28 $23 $24 $28
2012 2013 2014 2015 2016 2017 2018
High OOPexposure drugs (>$50 per claim)Initial OOPexposureHigh OOPexposure drugs (>$50 per claim)Actual OOPspendingAll brandsInitial OOPexposure
All brandsActual OOPspending
-44%
Differences between OOP exposure and actual spending are driven by a small number of claims
using coupons*
17
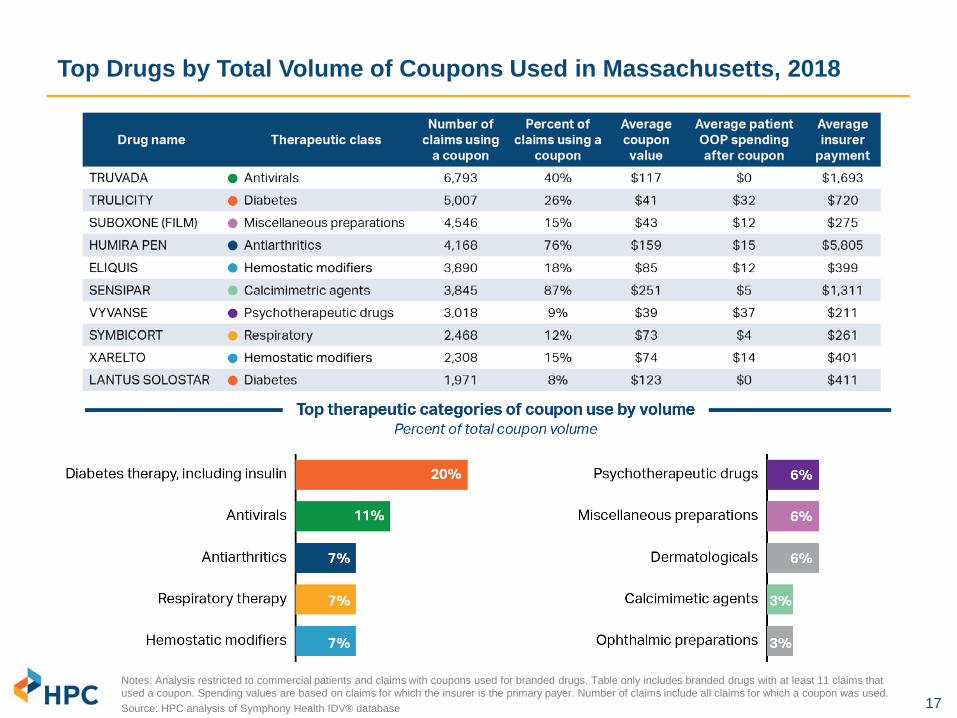
Top Drugs by Total Volume of Coupons Used in Massachusetts, 2018
Notes: Analysis restricted to commercial patients and claims with coupons used for branded drugs. Table only includes branded drugs with at least 11 claims that used a coupon. Spending values are based on claims for which the insurer is the primary payer. Number of claims include all claims for which a coupon was used. Source: HPC analysis of Symphony Health IDV® database

18
Top therapeutic categories of coupon use by volume have changed over time, reflecting changing market dynamics.
• Entry of new branded products • Loss of exclusivity (generic
entry) • Policy changes
(implementation of ACA) • Changes in prescribing trends • Changes in plan benefit design
(patient cost sharing) • Changes in drug prices
Factors in rank change may include:
Source: HPC analysis of Symphony Health IDV® database
Top therapeutic categories of coupon use by volume
Therapeutic class 2013 Rank
2013 % of total
2018 Rank
2018 % of total
Antiarthritics 1 15% 3 7%
Antihyperlipidemic agents 2 14% 18 1%
Miscellaneous preparations 3 13% 7 6%
Gastrointestinal 4 7% 16 1%
Psychotherapeutic drugs 5 5% 6 6%
Respiratory therapy 6 5% 4 7%
Diabetes therapy 7 4% 1 20%
Analgesics 8 3% 28 0%
Ophthalmic preparations 9 3% 10 3%
Cardiac agents 10 3% 27 0%
Contraceptives 11 3% 26 1%
Neurological / neuromuscular disorders 12 3% 11 3%
Anti-obesity 13 3% 15 2%
Vascular agents 14 3% 20 1%
Antivirals 15 2% 2 11%
Hormones 16 2% 13 2%
Dermatologicals 18 2% 8 6%
Hemostatic modifiers 19 2% 5 7%
Immunologic agents 22 1% 12 3%
Calcimimetic agents 24 1% 9 3%
Laxatives 25 0% 14 2%

19
Since 2013, coupon availability and use for diabetes therapy has grown significantly; at the same time, spending per person more than doubled.
Therapeutic category of coupon use by volume
Therapeutic class 2013 Rank
2013 Percent of total
2018 Rank
2018 Percent of total
Diabetes therapy 7 4% 1 20%
Market entry, more brands offering coupons, higher
coupon use
Diabetes therapy 2013 2018 Number of brands in class 62 91
Number of brands that offered coupons 28 66
Percent of brands that offered coupons 45% 73%
Coupon use (among eligible brands) 3% 14%
Source: HPC analysis of Symphony Health IDV® database
Factors driving higher patient coupon use may include: • Average spending per branded drug claim increased
93% from 2013 to 2018 ($312 to $601) • Spending per person for branded drugs more than
doubled, from $1,891 in 2013 to $3,838 in 2018
Increases in spending for diabetes therapy
• Average patient OOP exposure per claim for branded products in the diabetes therapy class grew from $38 in 2013 to $57 in 2018, an increase of 50%
Increases in patient out-of- pocket exposure

Call to Order
Approval of Minutes from June 5, 2019 Meeting
Prescription Drug Coupon Study: Preliminary Results
– Market Landscape: Trends in Value, Type, and Use of Coupons – Impact on Adherence – Impact on Spending
Primary Care Workforce: Nurse Practitioners
Reducing Administrative Complexity
Schedule of Next Meeting (November 20, 2019)
AGENDA

21
Literature suggests a modest positive impact of coupons on adherence, with larger effects for high cost drugs with high coupon value.
• Well-documented relationship between patient drug cost and adherence - Studies find an abandonment threshold of $125 – $250 per claim
- Increasing medication adherence can reduce ED visits, hospitalizations, and total health care costs, particularly for patients managing chronic conditions
• When the out-of-pocket cost of the drug and the value of the coupon are small, coupons are likely to increase adherence modestly
- Example: Among statins, studies found an association between coupons and product refill rate, but the improvement was too small to likely impact clinical outcomes
• Studies suggest larger adherence effects from coupon use for high cost drugs - In a large U.S. study, coupons reduced the proportion of specialty prescriptions for
which patient cost-sharing was more than $250 from 12% to 1%, a point at which patients were far less likely to abandon prescriptions
- Patients with copay assistance had 88% lower risk of non-initiation and 24% lower risk of discontinuation for ALK inhibitors (for treatment of non-small cell lung cancers)
Sources: Daubresse M, Andersen M, Riggs KR et al. Effect of Prescription Drug Coupons on Statin Utilization and Expenditures: A Retrospective Cohort Study. Pharmacotherapy. 2017. 37(1):12-24. Daugherty JB, Maciejewski ML, Farley JF. The Impact Of Manufacturer Coupon Use In The Statin Market. J Manag Care Pharm. 2013. 19(9):765-72. Eaddy MT, Cook CL, O’Day K et al. How Patient Cost-Sharing Trends Affect Adherence and Outcomes. P T. 2012. 37(1): 45–55. Starner CI, Alexander GC, Bowen K et al. Specialty Drug Coupons Lower Out-Of-Pocket Costs And May Improve Adherence At The Risk Of Increasing Premiums. Health Affairs. 2014. 33(10). Seetasith A, Wong W, Tse J et al. The impact of copay assistance on patient out-of-pocket costs and treatment rates with ALK inhibitors. J Med Econ. 2019. 22(5):414-420. Devane K, Harris K, Kelly K. Patient Affordability Part Two: Implications for Patient Behavior & Therapy Consumption. IQVIA. May 18, 2018.

Call to Order
Approval of Minutes from June 5, 2019 Meeting
Prescription Drug Coupon Study: Preliminary Results
– Market Landscape: Trends in Value, Type, and Use of Coupons – Impact on Adherence – Impact on Spending
Primary Care Workforce: Nurse Practitioners
Reducing Administrative Complexity
Schedule of Next Meeting (November 20, 2019)
AGENDA

23
Coupon availability may impact overall health care spending by increasing drug use or shifting product choice to higher cost branded drugs.
Patient fills prescriptions more often: Could result in higher adherence to medications
Patient fills new prescriptions: Use of new medications that patient did not previously use due to cost
Coupon availability may result in use of low value drugs or reduce incentives to try lower cost alternatives first (e.g. over the counter acne treatments versus prescription)
Shift use to higher cost branded products where there are lower cost therapeutic alternatives

24
Framework for Analysis of Prescription Drugs that Offer Coupons
Category 1 Category 2 Category 3 Category 4
Study target: Branded drug that offers coupon Generic
equivalent
Close therapeutic substitute:
Generic
Close therapeutic substitute: Branded
No close therapeutic substitute
Example Drug with coupon Lipitor
(statin; AB generic available)
Lyrica (nerve pain;
no AB generic available)
Repatha (PCSK9; no AB
generic available)
Kalydeco (cystic fibrosis; no
AB generic available)
Comparator Atorvastatin
(generic Lipitor) Gabapentin
(generic Neurontin) Praluent None
Notes Not eligible in MA Comparators may also offer coupons
Estimated distribution of drugs with coupons Based on USC publication that examined the 200 highest U.S. expenditure drugs in 2014 and identified 90 of these drugs that offered coupons
21% 28% 39% 12%
Source: Van Nuys, Joyce, Ribero and Goldman. University of Southern California Leonard D. Schaeffer Center for Health Policy & Economics. 2018. A Perspective on Prescription Drug Copayment Coupon. Available at: https://healthpolicy.usc.edu/research/prescription-drug-copayment-coupon-landscape/

25
Impact of Coupons on Utilization of Direct Generic Equivalent Drugs
• Previous research has found that coupons were associated with lower generic utilization, higher price growth, and higher total spending1
- 3.4 percentage point reduction in generic utilization rate (from 95% to 92% on average) - Price growth for drugs without coupons of 7-8% per year, versus price growth for drugs
with coupons of 12-13% per year - Coupons were associated with $6-$24 million higher spending per drug per year - 1.2% to 4.6% higher total drug spending over five years
• Massachusetts law prohibits use of coupons for branded drugs when a direct generic equivalent is available
• In circumstances where a direct generic equivalent is introduced at a high price, a select group of patients with high co-pays or deductibles may lose the benefit of the coupon
Example: Generic Gleevec (used in treatment for leukemia) entered the market in 2016
Average price in 2016 for generic Gleevec2 = $8,075
Sources: HPC analysis of Symphony Health IDV® database. 1. Dafny L, Ody C and Schmitt M. 2017. "When Discounts Raise Costs: The Effect of Copay Coupons on Generic Utilization." American Economic Journal: Economic Policy, 9 (2): 91-123. 2. HPC DataPoints. “Cracking Open the Black Box of Pharmacy Benefit Managers.” June 05, 2019.
Average price in 2015 for branded Gleevec Payer paid: $9,157 Coupon value: $871 Patient OOP: $11 Total $10,039
Category 1: Direct Generic equivalents

26
Impact of Coupons on Utilization of Alternative Branded Drugs
HPC determined that analyzing the impact of coupons on use of alternative branded drugs was not currently feasible.
• Branded competitors also often offer coupons. • Rebate data are necessary to understand insurer and pharmacy benefit manager
(PBM) tiering practices and perform subsequent analysis of overall cost impact – but this data is unavailable.
SGLT2 inhibitors (used to control high blood sugar for people with Type 2 diabetes)
Drug name Insurer payment Patient OOP exposure
Coupon value
Patient net OOP
FARXIGA $467 $122 $87 $36 INVOKANA $485 $89 $84 $5 JARDIANCE $526 $85 $69 $16
In this example, patients appear to have the highest out of pocket exposure for the lowest cost drug. However, the price for insurers/PBMs net of rebates is unknown.
Notes: OOP = out-of-pocket Source: HPC analysis of Symphony Health IDV® database, 2018
EXAMPLE
Category 3: Branded close therapeutic substitutes

27
Impact of Coupons on Utilization of Close Generic Alternatives: Background
• HPC analyzed impact of drug coupons on use of branded drugs versus close generic alternatives (generic close therapeutic substitutes)
• No literature could be identified on the impact of coupons on use of close generic alternatives
Study target: Branded drug that offers coupon
Close therapeutic substitute: Generic
Drug with coupon Lyrica (nerve pain; no AB generic available)
Comparator Gabapentin (generic Neurontin)
EXAMPLE
Category 2: Generic close therapeutic substitutes

28
Impact of Coupons on Utilization of Close Generic Alternatives: HPC Case Study Approach
• To examine the potential impact of coupons in this category of drugs, the HPC analyzed the use trends of these drugs for commercial patients compared to Medicare patients in Massachusetts. Medicare prohibits coupon use
• The HPC’s approach to selecting drugs for the case study:
o Based on national research and the number of drugs with coupons in Massachusetts, there could be as many as 247 branded drugs which offer coupons that have a close generic alternative1
o The HPC focused on those drugs with the highest expenditures, narrowing the analysis to 29 drugs. Based on consultation with a pharmacist advisor, the HPC further excluded drugs where population differences (e.g. age) could affect prescribing choices between the two patient populations
o Also excluded drugs considered first-line or preferential treatment over close generic alternatives, based on clinical guidelines
o This conservative criteria resulted in 14 target drugs for the case study analysis
• For each drug, utilization trends were averaged for the two most recent applicable years of data
1. Van Nuys, Joyce, Ribero and Goldman. University of Southern California Leonard D. Schaeffer Center for Health Policy & Economics. 2018. A Perspective on Prescription Drug Copayment Coupon. Available at: https://healthpolicy.usc.edu/research/prescription-drug-copayment-coupon-landscape/ Data sources for analysis: Symphony Health IDV® database (commercial use and prices), CMS Part D Prescriber Use Files (Medicare use), and the Center for Health information and Analysis, All-Payer Claims Database, 2016
Category 2: Generic close therapeutic substitutes

29
Impact of Coupons on Utilization of Close Generic Alternatives: Example of Utilization Analysis
Source: HPC analysis of Symphony Health IDV® database and CMS Part D Prescriber Public Use Files
21
41
100 100
0
20
40
60
80
100
120
Medicare Commercial
Eliquis
WarfarinRatio: 0.21 Ratio: 0.41
Relative utilization of Eliquis and Warfarin by population in Massachusetts, 2016 and 2017
Num
ber o
f Eliq
uis
pres
crip
tions
per
100
War
farin
pr
escr
iptio
ns (3
0-da
y pr
escr
iptio
ns)
Category 2: Generic close therapeutic substitutes

30
Higher use of branded drugs over close generic alternatives in commercial populations suggests coupon availability may increase brand use.
-
0.10
0.20
0.30
0.40
0.50
0.60
Medicare
Commercial
Use of branded drugs versus close generic alternatives was higher in the commercial population for 10 of 14 case study drugs. For 4 case study drugs, use was similar in
commercial and Medicare populations. On average, the percent of patients using coupons was higher for the 10 drugs with higher commercial use.
Notes: For each case study drug, use trends are averaged for two most recent years of available data. Similar use defined as within 25 percent. Source: HPC analysis of Symphony Health IDV® database and CMS Part D Prescriber Public Use Files
Rat
io o
f bra
nded
pre
scrip
tions
to g
ener
ic
alte
rnat
ive
pres
crip
tions
Relative utilization of branded drug versus generic close alternatives in commercial and Medicare populations
Category 2: Generic close therapeutic substitutes
31
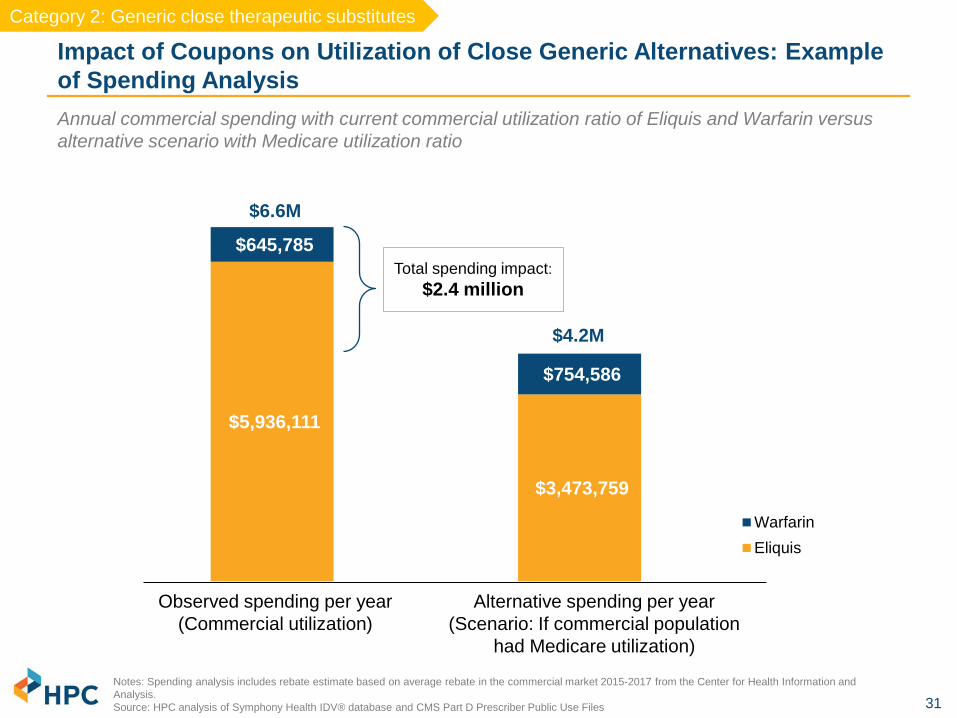
$5,936,111
$3,473,759
$645,785
$754,586
WarfarinEliquis
Impact of Coupons on Utilization of Close Generic Alternatives: Example of Spending Analysis
Notes: Spending analysis includes rebate estimate based on average rebate in the commercial market 2015-2017 from the Center for Health Information and Analysis. Source: HPC analysis of Symphony Health IDV® database and CMS Part D Prescriber Public Use Files
Total spending impact: $2.4 million
Annual commercial spending with current commercial utilization ratio of Eliquis and Warfarin versus alternative scenario with Medicare utilization ratio
Observed spending per year (Commercial utilization)
Alternative spending per year (Scenario: If commercial population
had Medicare utilization)
$6.6M
$4.2M
Category 2: Generic close therapeutic substitutes

32
Higher brand utilization in the commercial population results in 18% higher spending per case study drug, totaling $45 million per year.
Key Spending Impact Findings: • Across 14 case study examples, spending was 18% ($1.4 million) higher on average per
drug than it would have been if commercial members used the close generic alterative as often as the Medicare population did.
• Extrapolated to the entire commercial market, the dollar amount per drug would be $3
million. For 14 case study examples, spending would be $44.8 million higher per year.
Case Study Considerations: • While there could be as many as 247 branded drugs that offer coupons in Massachusetts
and that have close generic alternatives, it is unclear if the 14 case studies are representative of all of these.1
• While the selection of drugs for the case study was intended to isolate the impact of coupon availability on drug use rates, other factors may also contribute to higher brand use in the commercial population.
1. Van Nuys, Joyce, Ribero and Goldman. University of Southern California Leonard D. Schaeffer Center for Health Policy & Economics. 2018. A Perspective on Prescription Drug Copayment Coupon. Notes: Spending analysis includes rebate estimate based on average rebate in the commercial market 2015-2017 from the Center for Health Information and Analysis. Source: HPC analysis of Symphony Health IDV® database and CMS Part D Prescriber Public Use Files
Category 2: Generic close therapeutic substitutes

33
Final Written Report on Prescription Drug Coupons to be Released this Fall
SUMMARY OF PRELIMINARY RESULTS
• Coupon values vary widely: the average coupon value was $229 in 2018, but for the majority of people who used a coupon, the value was smaller
• Coupon programs and their uptake have expanded in Massachusetts since 2012
• For drugs where coupons were used, patient out-of-pocket exposure was 21% of total spending; but using coupons, patients only paid 3% of total spending out-of-pocket
• As drug prices and patient deductibles continue to increase, coupons have the largest benefit for patients with high out-of-pocket exposure
• Coupons are broadly associated with increased medication adherence, but the impact is largest for patients with high out of pocket costs
• For branded drugs with close generic alternatives, coupons availability is associated with moderately lower generic use and higher total spending
• While coupons for some drugs may result in potentially unnecessary higher spending, many patients do not have alternatives and may depend on coupons to improve drug affordability, especially if they have high co-pays or deductibles

Call to Order
Approval of Minutes from June 5, 2019 Meeting
Prescription Drug Coupon Study: Preliminary Results
Primary Care Workforce: Nurse Practitioners
Reducing Administrative Complexity
Schedule of Next Meeting (November 20, 2019)
AGENDA

35
There is an emerging consensus that a more primary care-orientated health care system will improve access, improve outcomes, and reduce costs.
Sources: 1) Friedberg, Mark W., Peter S. Hussey, and Eric C. Schneider. "Primary care: a critical review of the evidence on quality and costs of health care." Health Affairs 29.5 (2010): 766-772.; 2) Robert Graham Center, “Investing in Primary Care: A State-level analysis”, June, 2019; 3) Baicker, Katherine, and Amitabh Chandra. "Medicare Spending, The Physician Workforce, And Beneficiaries' Quality Of Care: Areas with a high concentration of specialists also show higher spending and less use of high-quality, effective care." Health Affairs 23.Suppl1 (2004): W4-184.; 4) Patient-centered primary care collaborative, “Investing in primary care a state-level analysis.” June, 2019; 5) Baum, Aaron, et al. "Health Care Spending Slowed After Rhode Island Applied Affordability Standards To Commercial Insurers." Health Affairs 38.2 (2019): 237-245.
Background • There is evidence that states and countries with health systems more
oriented toward primary care have better outcomes and lower spending.1-3
• Massachusetts has a below-average proportion of commercial spending on primary care compared to other states.4
• A number of states have implemented policies directly encouraging an emphasis on primary care.
• For example, Rhode Island required payers to increase the proportion of spend on primary care by one percentage point per year from 2010 to 2014.
• Total health spending declined over this period, though the decline can not be traced definitively to the primary care initiative.5
• In May 2019, both Colorado and Vermont passed legislation with the goal of significantly increasing investments in primary care.

36
1.7% growth since 2015
Since 2015, the number of primary care physicians in Massachusetts increased only 1.7% compared to a 7.7% increase in specialist physicians.
Massachusetts primary care and specialist physicians, 2015 -2018
Source: 2015, 2017, and 2018 Registration of Provider Organizations data. Notes: Data represents roughly 85% of physicians in Massachusetts. Physicians in some smaller organizations are omitted.
-
2,000
4,000
6,000
8,000
10,000
12,000
14,000
16,000
18,000
20,000
2015 2017 2018
Specialists Physician PCPs Both
7.7% growth since 2015
Background

37
The number of primary care physicians per resident also varies considerably across the state, with the highest ratio in Metro Boston.
Sources: HPC analysis of 2018 Registry of Provider Organizations, American Community Survey 5-year population estimates, 2017. Notes: For this graphic, physicians who self-identify as “Both” have been included as primary care physicians.
Primary care physicians per 10,000 residents by HPC region, 2018
12.8
7.9 7.2 6.8
6.0 5.7 5.5 5.4
-
2.0
4.0
6.0
8.0
10.0
12.0
14.0
Metro Boston CentralMassachusetts
NortheasternMassachusetts
WesternMassachusetts
Metro South Metro West Southcoast Cape andIslands
Background

38
The national supply of nurse practitioners is growing much more quickly than the supply of physicians.
Auerbach, David I., Douglas O. Straiger, and Peter I. Buerhaus. "Growing ranks of advanced practice clinicians-implications for the physician workforce." The New England journal of medicine 378.25 (2018): 2358-2360.
153% growth projected from
2016
0
200,000
400,000
600,000
800,000
1,000,000
1,200,000
2001 2010 2016 2030 (projected)
Physicians Nurse practitioners
National supply of physicians and nurse practitioners, observed and projected
17% growth projected from
2016
Background

39
Researchers generally find similar quality of care for primary care patients managed by NPs or physicians; a recent study finds lower costs for those managed by NPs.7,8
Primary care access would likely be enhanced if nurse practitioner scope of practice restrictions were removed.
The supply of NPs is larger and grows more rapidly in states where NPs have full practice authority.2-4 Also, more NPs have Buprenorphine prescribing waivers.5
States that have changed their regulations to allow full practice authority saw increases in primary care utilization and decreases in ED use.6
Roughly 50% of NPs work in primary care.1
$
50%
Sources: (1) https://bhw.hrsa.gov/sites/default/files/bhw/nchwa/npsurveyhighlights.pdf (2)Ying Xue et al., “Full Scope-of-Practice Regulation Is Associated with Higher Supply of Nurse Practitioners in Rural and Primary Care Health Professional Shortage Counties,” Journal of Nursing Regulation 8, no. 4 (2018): 5–13. (3) P. B. Reagan and P. J. Salsberry, “The Effects of State-Level Scope-of-Practice Regulations on the Number and Growth of Nurse Practitioners,” Nursing Outlook 6, no. 1 (2013): 392–99. (4) Hilary Barnes et al., “Effects of Regulation and Payment Policies on Nurse Practitioners’ Clinical Practices,” Medical Care Research and Review 74, no. 4 (2016): 431–51, doi:10.1177/1077558716649109. (5) J. Traczynski and V. Udalova, “Nurse Practitioner Independence, Health Care Utilization, and Health Outcomes,” Journal of Health Economics 58 (2018):90–109. (6) Spetz, Joanne, et al. "Nurse Practitioner and Physician Assistant Waivers to Prescribe Buprenorphine and State Scope of Practice Restrictions." JAMA 321.14 (2019): 1407-1408. (7) Jennifer Perloff et al., “Association of State-Level Restrictions in Nurse Practitioner Scope of Practice with the Quality of Primary Care Provided to Medicare Beneficiaries,” Medical Care Research & Review 18 (Sept. 1, 2017); (8) Perloff, Jennifer, Catherine M. DesRoches, and Peter Buerhaus. "Comparing the cost of care provided to Medicare beneficiaries assigned to primary care nurse practitioners and physicians." Health services research 51.4 (2016): 1407-1423.

40
Notes: 28 states and the District of Columbia grant NPs full practice authority. Half of these states require that NPs practice in collaboration with physicians or more experienced NPs for a transitional period before they are allowed to practice and prescribe without formal oversight. Source: Spetz, J. “Expanding the Role of Nurse Practitioners in California: Physician Oversight in Other States,” California Health Care Foundation (May 2019), available at https://www.chcf.org/wp-content/uploads/2019/05/ExpandingNPOversightStates.pdf. Additional information for MA (1) Mass. Reg. Code §243-2.10 (5) (2) Mass. Reg. Code §243-2.10 (5) (3) Mass. Gen. Laws Ann. §176R(4)
Massachusetts has more restrictive NP scope of practice (SOP) laws than all other New England states.
Granted full practice authority following 24 months of supervision
by a physician or NP.
NPs are required to have a collaborative practice agreement with a supervising physician, and cannot write prescriptions without physician
oversight. Insurers must allow members to select an NP as their PCP, but there is no opportunity for
NPs to advance to full practice authority.
Granted full practice authority after 24 months and 2,400
hours of collaboration with a supervising physician or NP.
Full practice authority requires three years and 2,000 hours of physician
oversight. For prescribing, a formal written
collaborative agreement is maintained by the practice.
Can practice without formal physician oversight upon licensure
Can practice without formal physician oversight upon
licensure
Summary of state-specific SOP laws for New England states, 2019 Background

41
Describe the nurse practitioner (NPs) workforce in the Commonwealth
Understand how many NPs are serving as primary care providers (PCPs), where they practice, and who they provide care for, by:
– Examining direct billing for office visits – Being listed as primary care provider by a payer
Report on the prevalence of “incident-to billing” in MA by provider organization and implications for
health care spending in the Commonwealth
HPC Research Spotlight: Understanding the Role of Primary Care Nurse Practitioners in Massachusetts
Data sources
Research aims
CHIA All-Payer Claims Database (APCD), 2016 HPC Registry of Provider Organizations, IQVIA (SK&A), and HPC Provider Organization
Performance Variation attribution model NPPES NPI Registry MA Department of Public Health RN Licensure Renewal Survey (2016, 2018) Publically available payer documentation on billing guidelines for NPs
1
2
3

42
As observed in the Massachusetts APCD
Only a small subset of NPs in Massachusetts act as primary care providers by payer assignment.
Sources: (1) BLS OES estimates, May 2017; Redi-Data reports 6,264 nurse practitioners in Massachusetts as of March 2019. National estimates from AANP indicate that 73% of all NPs deliver primary care. (2) NPPES provider list does not reflect the number of actively practicing NPs. (3) Members were attributed to a primary care provider as indicated by their payer’s reporting of who their PCP is; 8,725 commercial members were attributed to an NP as their PCP using this method. (4) Members were attributed to a primary care provider as indicated by their utilization of healthcare services that would be expected to be provided by a primary care provider; 50,665 commercial members were attributed to a NP as their PCP. Notes: The figure is for illustrative purposes only; circle area is not directly proportional to the number of providers in each box.
1,837 NPs identified as a
PCP through utilization but not
payer assignment4
141 NPs identified as a PCP through payer assignment but not
utilization3
NPs in Massachusetts
4,926 primary care NPs
(based on specialty; NPPES)2
Total NPs in Massachusetts =
~6,3001 504 NPs identified as a PCP through both a
payer assignment and utilization3,4

43
Many Massachusetts residents see an NP as their primary provider, but their payer-assigned PCP is a physician.
Source: HPC analysis of All-Payer Claims Database, 2016, RPO, IQVIA (SKA), and NPPES. . Note: Figure is illustrative and not necessarily proportional. Universe includes only 753,302 members who have an identified PCP both through payer-assignment and utilization-based attribution. Through the utilization method alone, N=993,705 members are attributed to a primary care provider. Through the payer-recorded PCP N=1,154,273 members are attributed to a primary care provider.
26,255 members assigned an NP PCP based on primary care utilization, but a payer record assigned a physician PCP 3,899 members assigned an NP based BOTH on a payer record and primary care utilization 1,301 members assigned a physician PCP through primary care utilization, but a payer record assigned an NP PCP
Commercial members in the APCD who are reported by a payer or are assigned through utilization to an NP as their primary care provider, 2016
Utilization-assigned NP PCP
Payer-recorded NP PCP
Commercial members

44
Patients attributed to NPs are more likely to be female, younger, and have lower risk scores.
Source: HPC analysis of All-Payer Claims Database, 2016, RPO, IQVIA (SKA), and NPPES. Note: Total spend PMPY has been scaled to reflect instances where members may not have a full year of eligibility in the claims data. Otherwise, this number is raw and has not been adjusted for differences in age, sex, or risk score.
Commercial members

45
In both commercial and Medicaid managed care (MCO) populations, NPs play a larger role in providing primary care to more rural communities.
Source: HPC analysis of All-Payer Claims Database, 2016. Members attributed based on utilization.
Percent of commercial members attributed to an NP by geographic area (N=993,705), 2016
Percent of MCO members attributed to an NP by geographic area (N=458,476), 2016
4.8% 5.9% 6.5% 10.4% 0.0%
2.0%
4.0%
6.0%
8.0%
10.0%
12.0%
Urban Suburban Commuting Smalltown/rural
7.2% 6.3% 6.4% 10.9% 0.0%
2.0%
4.0%
6.0%
8.0%
10.0%
12.0%
Urban Suburban Commuting Smalltown/rural

46
In both commercial and MCO populations, NPs play a larger role in providing primary care to lower income communities.
Source: HPC analysis of All-Payer Claims Database, 2016. Members attributed based on utilization.
Percent of commercial members attributed to an NP by income quintile (N=933,705), 2016
Percent of MCO members attributed to an NP by income quintile (N=458,476), 2016
7.2% 6.0% 5.4% 4.8% 3.9% 0%
1%
2%
3%
4%
5%
6%
7%
8%
9%
10%
1 (lowest) 2 3 4 5 (highest)Income quintile
9.2% 6.9% 5.5% 4.5% 3.4% 0%
1%
2%
3%
4%
5%
6%
7%
8%
9%
10%
1 (lowest) 2 3 4 5 (highest)Income quintile

47
A significant number of NPs report barriers to practice, including employer restrictions and reimbursement restrictions from payers.
Source: DPH RN Licensure Renewal Survey, 2018 Notes: 5,546 APRNs responded to the survey in 2018. Among these, 1,984 respondents were identified as primary care NPs for the purposes of this analysis. This is a mandatory survey for the purposes of licensure renewal. Primary care NPs were identified through their self-reported practice specialty.
Additional credentials
Responses to the 2018 DPH Licensure Renewal Survey found among NPs: – 97% report having a national provider identification (NPI) number – 37% of primary care NPs report being listed as a PCP in an insurer directory
(up from 31% in 2016)
Practice barriers
17% of respondents reported practice barriers due to employer restrictions – In a hospital outpatient setting, the number increases to 23%
Approximately one in five respondents reported
practice barriers in the form of reimbursement restrictions from any payer
– In a hospital outpatient setting: 25% – In a physician office: 23% – In a community health center: 24%

48
In 2016, at least 27% of primary care visits that were provided by NPs were actually billed by a supervising physician.
Notes: The proportion of visits that are estimated as NP visits billed incident to a physician is the physician claim counts with an “SA” modifier divided by the sum of the claim counts with a physician NPI and “SA” modifier and the claim counts with an NP NPI. MedPAC estimated that 40% of all NP’s E&M office visits for established patients performed in physician offices were likely billed “incident to” in 2016. Source: HPC analysis of All-Payer Claims Database, 2016. (1) MedPAC Blog: “Improving Medicare’s payment policies for Advanced Practice Registered Nurses and Physician Assistants” (February 2019).
Claim counts indicating direct and indirect service provision through use of a procedure modifier (SA procedure modifier), or direct billing in an office setting, 2016
193,925
119,049
72,661
46,259
0
50,000
100,000
150,000
200,000
250,000
300,000
Commercial MCO
NP visit, billed directly NP visit, billed by physician
27%
28%
NPs provided 12% of all primary care E&M visits in 2016.
Medicare pays 85% of the physician rate when a service is billed under the NP’s own NPI, but 100% of the physician rate when the same service provided by an NP is billed “incident to” a supervising physician.1
Some other payers mirror these guidelines, and require the use of a specific procedure modifier to indicate “incident to” billing.

49
$144
$165 $169
$142
$163 $151
$89 $79
$121
$-
$20
$40
$60
$80
$100
$120
$140
$160
$180
Overall Partners Atrius
Physician visit NP visit, billed by physician NP visit, billed directly
Average price for a medium-level established evaluation and management visit billed directly or indirectly by a physician or nurse practitioner primary care provider, 2016
Notes: Percentages next to the ”NP visit, billed directly” bars indicate the percent of the physician visit rate. Bars represent the average price of a 99213 established evaluation and management visit. Claims with zero spending were not including in this analysis. There was no other trimming or imputation done in this analysis. ”NP visit, billed by physician claims” were identified through the presence of an “SA” procedure modifier. This modifier is meant to be used to indicate a visit where a NP provided the service. Analysis excluded claims with any other procedure modifier besides SA for all bars except the “NP visit, billed by physician” bar. Source: HPC analysis of All-Payer Claims Database, 2016.
Primary care visits billed by physicians are reimbursed at a much higher rate than visits billed directly by a NP; differentials vary by provider.
Commercial prices
62% 48%
72%

50
17%
15% 15% 15% 14% 13% 13%
11% 10%
9% 8%
4% 3%
0%
2%
4%
6%
8%
10%
12%
14%
16%
18%
20%
Reliant Lahey South Shore Atrius Southcoast Wellforce Steward Baystate UMass Partners BMC BIDCO MACIPA
The percentage of primary care providers that are NPs varies by provider organization.
Notes: Primary care NPs were identified on the basis of the practice specialty reported by IQVIA. NPs that were not found in IQVIA but were used in other areas of this presentation from NPPES have not been reflected in this slide because we cannot currently determine organizational affiliations for these additional NP providers. Sources: HPC analysis of 2017 Registry of Provider Organizations, SKA (IQVIA) 2017.
Percent of primary care providers who are NPs by provider organization, 2017
Across all provider organizations, we estimate that NPs are
12% of the primary care workforce
Providers
Of the 1,262 primary care NPs that are linkable to a
provider organization,
were affiliated with smaller provider organizations, including community health centers.

51
Only a fraction of primary care NPs in Massachusetts were reported by payers as acting as primary care providers for patients in 2016.
– Patients attributed to NPs are more likely to be younger and female; there may be segments of the population who would prefer having an NP as their PCP.
Patients living in low income or rural areas, or who are on MassHealth, are more likely to have an NP as their primary care provider.
Restrictive scope of practice laws, payer and provider restrictions may be inhibiting Massachusetts’ ability to fully utilize its NP workforce to expand access to primary care.
“Incident to” billing increases spending and inhibits accurate assessments of provider quality and performance by obscuring who is delivering a primary care service.
Summary of Initial Findings
1
2
3
4

52
Evaluate claims-based quality of care measures and annual health spending for patients attributed to an NP PCP or a physician PCP • Medication adherence • Prevention Quality Indicators (PQIs) • ED and inpatient visit rate
Better understand provider organizations’ distinct approaches toward employing NPs in primary care service provision
Plans for Future Research on Primary Care NPs

Call to Order
Approval of Minutes from June 5, 2019 Meeting
Prescription Drug Coupon Study: Preliminary Results
Primary Care Workforce: Nurse Practitioners
Reducing Administrative Complexity
– Quantifying Payer and Provider Administrative Spending – Identifying Stakeholder Priority Areas
Schedule of Next Meeting (November 20, 2019)
AGENDA

55
Administrative costs are a substantial share of national health care spending, contributing to high per capita health care spending in the U.S.
Sources: Emily Gee & Topher Spiro, Excess Administrative Costs Burden the U.S. Health Care System, Center for American Progress (2019); Steffie Woolhandler et al., Costs of Health Care Administration in the United States and Canada, New England Journal of Medicine (2003).
Nationally, billing and insurance-related activities are estimated to account for $496 billion in 2019. This accounts for approximately 13-14% of national health care spending.
• Providers (hospitals, physicians, others): $282 billion
• Private insurers: $158 billion • Public insurers: $56 billion • When non-BIR administrative
costs are included, administrative costs are estimated to reach 30% of national health care spending.
When examining private and public
payer spending on administrative costs, the U.S. had the highest level of administrative spending of any OECD country.
Note: There are many methods for measuring administrative complexity in healthcare. The figures cited in text above are specific to billing and insurance related expenses for payers and providers. The graph on the right is based on all administrative expenses for payers.

56
In 2017, $2.5 billion Massachusetts premium dollars went toward payer administrative expenses and profits/contribution to reserves.
Center for Health Information and Analysis. Performance of the Massachusetts Health Care System: Annual Report September 2018. http://www.chiamass.gov/assets/2018-annual-report/2018-Annual-Report.pdf; Division of Insurance. Financial Summary of the 2017 Market for Health Insurance. https://www.mass.gov/files/documents/2018/09/28/2017%20Annual%20Comprehensive%20Financial%20Statement.pdf; Gorman Actuarial analysis of 2017 Federal MLR reports with Merged Market rebates from the MA MLR reports. Two carriers were excluded from the Federal MLR analysis due to data quality concerns
$0.54B Merged Market
$0.78B Large Group
$0.33B Medicare
Advantage
$0.29B MMCO
$0.51B Self-
Insured
$2.5 B
2017 Net Cost of Private Health Insurance
Com
mer
cial
Ful
ly In
sure
d
$1.3 B
27.3%
12.6%
16.2%
13.7%
8.9%
8.8%
7.6%
3.8%
$361 M
$166 M
$214 M
$181 M
$117 M
$116 M
$100 M $50 M
2017 Commercial FI Admin Spending by Category
• CHIA estimates that private payers in Massachusetts spent approximately $2.5 billion on non-claims expenses in 2017.
• Spending on commercial, fully insured products accounted for just over half of the total spending, at $1.3 billion.
• The Division of Insurance reports similar figures, estimating administrative spending on commercial, fully insured products at $1.1 billion for the same year.
• These figures include areas that may constitute complexity without value as well as expenses like underwriting, rent, and salaries.
• These figures do not include carrier payments to providers, a portion of which are also spent on administrative tasks.
1.1% $14 M
General Admin
Profit / Contribution to
Reserve
Broker Fees + Commissions
Taxes and Fees
Quality Improvement
Direct Sales
Claims Adjustment
Cost Containment
Other

57
Center for Health Information and Analysis. Performance of the Massachusetts Health Care System: Annual Report September 2018. http://www.chiamass.gov/assets/2018-annual-report/2018-Annual-Report.pdf; Division of Insurance. Financial Summary of the 2017 Market for Health Insurance. https://www.mass.gov/files/documents/2018/09/28/2017%20Annual%20Comprehensive%20Financial%20Statement.pdf; Gorman Actuarial analysis of 2017 Federal MLR reports with Merged Market rebates from the MA MLR reports. Two carriers were excluded from the Federal MLR analysis due to data quality concerns.
$0.54B Merged Market
$0.78B Large Group
$0.33B Medicare
Advantage
$0.29B MMCO
$0.51B Self-
Insured
$2.5 B
2017 Net Cost of Private Health Insurance
Com
mer
cial
Ful
ly In
sure
d
$1.3 B
27.3%
12.6%
16.2%
13.7%
8.9%
8.8%
7.6%
3.8%
$361 M
$166 M
$214 M
$181 M
$117 M
$116 M
$100 M $50 M
2017 Commercial FI Admin Spending by Category
1.1% $14 M
General Admin
Profit / Contribution to
Reserve
Broker Fees + Commissions
Taxes and Fees
Quality Improvement
Direct Sales
Claims Adjustment
Cost Containment
Other • CHIA estimates that private payers in
Massachusetts spent approximately $2.5 billion on non-claims expenses in 2017.
• Spending on commercial, fully insured products accounted for just over half of the total spending, at $1.3 billion.
• The Division of Insurance reports similar figures, estimating administrative spending on commercial, fully insured products at $1.1 billion for the same year.
• These figures include areas that may
constitute complexity without value as well as expenses like underwriting, rent, and salaries.
• These figures do not include carrier
payments to providers, a portion of which are also spent on administrative tasks.
In 2017, $2.5 billion Massachusetts premium dollars went toward payer administrative expenses and profits/contribution to reserves.

58
Billing and insurance-related activities for commercial payers cost Massachusetts providers at least $1.3 and $1.6 billion annually.
Sources: Sakowski 2009, Casalino 2009, Kahn 2010. Commercial revenue data is sourced from CHIA’s 2017 Relative Price Databook.
Researchers have estimated the costs incurred by physician practices and hospitals in order to interact with commercial insurers.
• Physician practices are estimated to spend 10% to 14% of revenue on these activities.
• Applying this figure to Massachusetts physician groups, we estimate that they spend approximately $600 – $840 million per year.
• Hospitals are estimated to spend 8% of revenue on these activities.
• Applying this figure to Massachusetts hospitals, we estimate they spend approximately $768 million per year.
$1.5 billion
Taken together, we estimate Massachusetts providers’ BIR spending at approximately $1.5 billion annually.

Call to Order
Approval of Minutes from June 5, 2019 Meeting
Prescription Drug Coupon Study: Preliminary Results
Primary Care Workforce: Nurse Practitioners
Reducing Administrative Complexity
– Quantifying Payer and Provider Administrative Spending – Identifying Stakeholder Priority Areas
• Billing and Claims Processing • Prior Authorization • Provider Credentialing
Schedule of Next Meeting (November 20, 2019)
AGENDA

60
Payers and providers prioritize different areas of administrative complexity for action.
• The HPC’s Advisory Council identified Prior Authorization, Provider Credentialing, and Variation in Benefit Design as top priority areas.
• Through Pre-Filed Testimony (PFT) collected by the HPC ahead of the 2019 Health Care Cost Trends Hearing, 29 providers identified Billing and Claims Processing and Prior Authorization as top priority areas.
• Through PFT, 12 payers identified EHR Interoperability, Provider Credentialing, and Provider Directory Management as top priority areas.
Billing and Claims Processing EHR Interoperability
Provider Credentialing Provider Directory Management
Prior Authorization
Variation in Benefit Design

61
Levers for Reducing Administrative Complexity
• Improve processes that require unnecessary repetition
• Standardize requirements and processes across organizations
Reduce Variation & Duplication
• Reduce the use of faxing, phone, email
• Integrate forms, processes and systems into existing workflows
• Review existing IT systems against new technology
Leverage Technology
• Identify tasks that are no longer achieving their intended purpose
• Determine whether task is valuable in all circumstances and consider differential application
Eliminate Low-Value Tasks

Call to Order
Approval of Minutes from June 5, 2019 Meeting
Prescription Drug Coupon Study: Preliminary Results
Primary Care Workforce: Nurse Practitioners
Reducing Administrative Complexity
– Quantifying Payer and Provider Administrative Spending – Identifying Stakeholder Priority Areas
• Billing and Claims Processing • Prior Authorization • Provider Credentialing
Schedule of Next Meeting (November 20, 2019)
AGENDA

63
Example: Leveraging Technology to Improve Billing and Claims Processing
Morra et al., US Physician Practices Versus Canadians: Spending Nearly 4 Times as Much Money Interacting with Payers, Health Affairs (2011); Heffernan et al., Saving Billions of Dollars – and Physicians’ Time – By Streamlining Billing Practices, Health Affairs (2010); Winkler, Basch, & Cutler, Paper Cuts: Reducing Health Care Administrative Costs, Center for American Progress (2012).
Billing and claims processing is estimated to take 30-50 hours of staff time per physician per week. This is significantly more than other countries spend on these services and significantly more than other industries in the US spend on administrative services. In Ontario, Canada, physician practice staff spend approximately 18 hours on billing and
claims. In many non-health care sectors in the US, businesses employ ≤100 FTEs per $1 billion in
revenue collected for payment administration; physician practices employ closer to 770 FTEs.
Following in the footsteps of other industries, the health care industry has adopted standards for certain electronic transactions, thereby allowing for fast, accurate transfer of information and funds. The CAQH Index measures industry progress in transitioning from manual to electronic transactions.
Savings Opportunity
Transaction % Manual (US)
% Manual (MA)
Per Transaction Savings
MA Savings Opportunity (in Millions)
Eligibility and Benefit Verification 2% 3% $6.52 47 Claim Submission 4% 4% $1.32 $6 Claim Status Inquiry 6% 35% $9.22 $59 Claim Payment 37% 18% $0.65 $2 Remittance Advice 9% 10% $2.32 $3 Total $117
While adopting electronic transactions reduces administrative spending for payers and providers, it does not address several other issues with Billing and Claims Processing, including payer audits, clawbacks, variation in billing rules, and mid-year changes in payment policies.

Call to Order
Approval of Minutes from June 5, 2019 Meeting
Prescription Drug Coupon Study: Preliminary Results
Primary Care Workforce: Nurse Practitioners
Reducing Administrative Complexity
– Quantifying Payer and Provider Administrative Spending – Identifying Stakeholder Priority Areas
• Billing and Claims Processing • Prior Authorization • Provider Credentialing
Schedule of Next Meeting (November 20, 2019)
AGENDA

65
Prior Authorization: Background
Prior Authorization (PA) is a tool that payers use to manage the use of drugs and services in their networks.
• By focusing on expensive services and those that may be used outside of clinical appropriateness criteria, payers can target low-value care and act as responsible stewards of their purchasers’ premium dollars.
Researchers have found evidence that prior authorization is associated with reduced utilization and spending on the services for which PA is required:
• A meta-analysis of studies on prior authorization and step therapy for pharmaceutical products found that PA was associated with lower pharmacy utilization and costs.
• Another study found that after a PA program was implemented, high annual growth in rates of CT, MRI, and PET scans slowed.

66
Prior Authorization: Impact
Variation in PA requirements can be challenging for patients and providers (who must determine which procedures require PA) to navigate.
In an example shared with the HPC, PA requirements for 26 orthopedic procedures across 8 plans varied considerably.
Not a single procedure consistently required or was exempted from PA, leading to questions about clinical criteria or ordering patterns that inform PA programs.
A study out of Dana Farber identified 17 possible process steps and 10 decision points in their PA workflow.
Procedure Plan 1 Plan 2 Plan 3 Plan 4 Plan 5 Plan 6 Plan 7 Plan 8 Across
All Plans
A * PA * B PA PA PA C PA PA PA PA PA D PA PA PA PA E * PA PA PA PA PA F * PA PA PA PA PA G PA PA PA PA H PA PA PA PA PA I PA PA PA PA PA J PA PA K * PA PA PA PA PA L * PA PA PA PA PA M PA PA N PA PA PA PA O PA PA PA PA PA P PA PA PA * PA PA Q PA PA PA R PA PA PA S PA PA PA T PA PA PA U PA PA PA PA PA V PA PA PA PA PA W PA PA PA PA X PA PA PA PA PA Y PA PA PA PA PA Z PA PA PA PA PA
Agarwal et. al. Prior Authorization for Medications in a Breast Oncology Practice: Navigation of a Complex Process. Journal of Oncology Practice. Vol. 13 (4). April 2017.
* PA required for a subset of procedures

67
Prior Authorization: Physician Perceptions and Evidence
Impact on Patients
• A 2017 meta-analysis of PA and step therapy found unfavorable results on patient clinical outcomes and medication adherence
• A 2018 study found that PA requirements for medications can lead to delays in discharges
• 91% of physicians reported that PA had a negative impact on patient clinical outcomes
• 47% reported that PA always or often led to delays in treatment
Time and Resources
• Physicians reported that their offices completed an average of 31 PAs per physician per week
• PAs required almost 15 hours of physician and staff time per physician per week
• Per FTE physician estimates from the academic literature are even higher:
• Physicians: 1 hour per week • Nurses: 13 hours per week • Non-clinical staff: 6 hours per week
Increasing Burden
• 88% of physicians reported that the burden associated with PA has increased over the last 5 years
• 86% describe the burden as high or
extremely high
• The 2018 CAQH Index estimated a 14% increase in the national volume of prior authorization transactions from 2017 and a 27% increase from 2016
Front line physicians perceive negative impacts associated with PA, and their perceptions are largely supported by research.

68
Prior Authorization: State Regulation to Minimize Administrative Complexity
• Standard Form • 18 states have standards around PA
forms
• Response time • 28 states regulate response time • Most divide between urgent (1-3 days)
and standard (2-15 days)
• Electronic Prior Authorization • 21 states have standards around ePA • Many require that prior authorizations use
the NCPDP SCRIPT standard which allows for uniform information transfer of pharmaceutical data
• PA Length and Retrospective Denials • 12 states have standards in this area • Most prohibit plans from modifying or
rescinding a previous authorization • Some states mandate a minimum time
period during which the PA is valid, ranging from 45 days to 12 months
American Medical Association. 2018 Prior Authorization State law Chart. https://www.ama-assn.org/sites/ama-assn.org/files/corp/media-browser/public/arc-public/pa-state-chart.pdf; 211 CMR 52: Managed Care Consumer Protections and Accreditation of Carriers. https://www.mass.gov/files/documents/2017/10/20/211cmr52.pdf
MA Payers must also meet NCQA utilization management standards,
including for PA.
• MA: Plans must use the standard forms developed by DOI and the Mass Collaborative
• Forms have been issued for imaging, pharmacy, and behavioral health services
• MA: Requires that the standard PA forms be made available electronically and be capable of being electronically accepted by the payer after being completed
• DOI can consider national ePA standards in developing the standard forms
• MA: 2 business days

69
Prior Authorization: Consensus Statement
Consensus Statement on Improving the Prior Authorization Process. https://www.ama-assn.org/sites/ama-assn.org/files/corp/media-browser/public/arc-public/prior-authorization-consensus-statement.pdf
Consensus Statement on Improving the Prior Authorization Process
Signed By
Date
Opportunities for Improvement
1
2
3
4
5
American Medical Association, American Hospital Association, America’s Health Insurance Plans, American Pharmacists Association, the Blue Cross Blue Shield Association, and the Medical Group Management Association
January 2018
Selective Application of Prior Authorization
Prior Authorization Program Review and Volume Adjustment
Transparency and Communication Regarding Prior Authorization
Continuity of Patient Care
Automation to Improve Transparency and Efficiency

70
Levers for Reducing Administrative Complexity: Example Solutions for Prior Authorization
• More consistency across plans and products regarding which services
• Limits on mid-year changes to PA
• Upstream education opportunities for providers on clinical appropriateness criteria where available
Reduce Variation & Duplication
Example Solutions
• Transition from manual PA transactions to electronic: estimated $6M in savings in Massachusetts
• Continued work on adoption of a national standard for electronic PA Attachments.
• Incorporation of forms, requirements, and decision support into EHRs and other practice management software
• Artificial intelligence: real time adjudication of requests based on clinical data
Leverage Technology Example Solutions
• Eliminating PA requirements for drugs and services that have low variation in utilization across providers or low PA denial rates
• Exemptions for providers (individuals, groups, or facilities) that have historically low denial rates.
• Delegation of PA function to ACOs
Eliminate Low-Value Tasks
Example Solutions

Call to Order
Approval of Minutes from June 5, 2019 Meeting
Prescription Drug Coupon Study: Preliminary Results
Primary Care Workforce: Nurse Practitioners
Reducing Administrative Complexity
– Quantifying Payer and Provider Administrative Spending – Identifying Stakeholder Priority Areas
• Billing and Claims Processing • Prior Authorization • Provider Credentialing
Schedule of Next Meeting (November 20, 2019)
AGENDA

72
Credentialing: Overview
• Proof of Identity • Education and Training • Military Service • Professional Licensure • DEA/MCS Registration • Board Certification
• Affiliation and Work History • Criminal Background • Sanctions • Health Status • Malpractice Insurance • Professional References
Licensure with State Licensing Board
Mass Controlled Subs. Registration DEA Registration
Provider Credentialing and Privileging
Payer Credentialing and Enrollment
• Stakeholders often use the term “credentialing” to refer collectively to state licensure, controlled substances registration, credentialing, and health plan enrollment, distinct process that are all required for initial onboarding and at regular renewal intervals.
• Many of the elements that complicate the credentialing process are intended to protect patients and promote safety, including payer adherence to NCQA credentialing standards, primary source verification requirements, and the re-credentialing of physicians at regular intervals.
• As with Prior Authorization, the processes of seeking credentials, privileges, and enrollment is not uniform across providers or plans and the entire process can take up to 12 months.
• At a minimum, credentialing typically includes a review of:

73
Credentialing: Impact
Anthony et. al. Ready for Reform: Behavioral Health Care in Massachusetts. January 2019. https://bluecrossmafoundation.org/sites/default/files/download/publication/Model_BH_Report_January%202019_Final.pdf
Since credentialing must be completed before a provider can begin billing for services, the weekly time and expense associated with this task is not high.
• Physicians: 4 minutes per week (per FTE physician) • Nurses: 1 minute per week (per FTE physician) • Non-clinical staff: 2 hours per week (per FTE physician)
However, the upfront time and resources can lead to significant delays in provider onboarding.
• This can create access issues when there are vacancies that need to be filled immediately,
especially for per diem and locum tenens positions.
• The Blue Cross Blue Shield of Massachusetts Foundation’s 2019 report Ready For Reform: Behavioral Health Care in Massachusetts found that the complex credentialing process may lead behavioral health providers to decline participation in insurance networks, thereby exacerbating workforce shortages.
• These processes also pose financial challenges for providers. While providers may choose
to begin seeing patients before the final health plan enrollment phase is complete, they cannot bill for services provided during this window.
• Several providers reported having had out-of-state physicians decline employment in Massachusetts in order to work in another state with a shorter credentialing period.

74
Credentialing: Attempts to Reduce Complexity
Telemedicine: CMS allows hospitals when granting telemedicine privileges, to rely upon the privileging decisions of a distant-site hospital or telemedicine entity with which they have a written agreement that meets Medicare requirements
Centralized Medicaid Credentialing: Texas and North Carolina have both implemented centralized credentialing processes for their Medicaid programs, which will utilize a third-party Credentialing Verification Organization (CVO). MMCOs will be required to use the CVO for their credentialing programs.
Voluntary Credentialing Platform: In conjunction with CAQH, MA payers have formed Health Care Administrative Solutions (HCAS), which offers providers the ability to submit a centralized credentialing application.
• 95% of completed applications are processed within 30 days. • Data are used for other processes as well, including provider
directory management • However, only seven plans use HCAS (a few others use CAQH
directly) • Completing enrollment with health plans still requires the
submission of additional documents directly to the payer, such as participation agreements, W-9s, and letters of interest.

75
Levers for Reducing Administrative Complexity: Example Solutions for Credentialing
• Centralized credentialing process
• Massachusetts participation
in the Interstate Medical Licensure Compact
Reduce Variation & Duplication
Example Solutions
• Applications that streamline data collection process and centralize information and primary source verification records
• Greater plan participation in
HCAS
Leverage Technology Example Solutions
• Payer delegation of credentialing to providers
• Assess value of re-credentialing when otherwise credentialed providers change network affiliation
Eliminate Low-Value Tasks
Example Solutions

76
Next Steps
Public Presentations Defining HPC Approach
1
2
1
2
Cost Trends Hearing Witness panel on Confronting Complexity in the Health Care System
Board Meeting Presentation to full Commission and discussion of project goals
Priority Areas Consensus on initial focus areas
Solutions of Interest Identification of levers and strategies worth pursuing
3 Engagement Strategy for engaging stakeholders Expert outreach
4 Project Scope Timeline, outcomes, defining success

Call to Order
Approval of Minutes from June 5, 2019 Meeting
Prescription Drug Coupon Study: Preliminary Results
Primary Care Workforce: Nurse Practitioners
Reducing Administrative Complexity
Schedule of Next Meeting (November 20, 2019)
AGENDA

78
Upcoming 2019 Meetings and Contact Information
Board Meetings
Monday, December 16
Committee Meetings
Wednesday, November 20
Contact Us
Mass.Gov/HPC @Mass_HPC
Special Events
2019 Cost Trends Hearing Day 1 – Tuesday, October 22
Day 2 – Wednesday, October 23

79 5
APPENDIX

80
Top Drugs by Coupon Penetration Represented by Dermatology and Antiarthritic Therapies, Among Other Therapeutic Categories
Notes: Analysis restricted to commercial patients and claims with coupons used for branded drugs. Table includes drugs with at least 50 claims. Source: Symphony Health IDV® database, 2018
Rank Drug name Percent of eligible claims that used a
coupon Therapeutic category
1 UTOPIC 99% Dermatologicals 2 TALTZ AUTOINJECTOR 95% Immunologic Agents 3 AVAR LS 93% Dermatologicals 4 BROMSITE 90% Ophthalmic Preparations 5 ADIPEX-P 87% Miscellaneous Unassigned Products 6 SENSIPAR 87% Calcimimetic Agents 7 KERALAC 86% Dermatologicals
8 TALTZ AUTOINJECTOR (2 PACK) 85% Immunologic Agents
9 TARGADOX 85% Anti-infectives, Systemic 10 PLEXION 84% Dermatologicals 11 VSL#3 83% Natural Medicine 12 HUMIRA(CF) 83% Antiarthritics 13 VIMOVO 82% Antiarthritics 14 OTOVEL 82% Otic Preparations 15 DUEXIS 82% Antiarthritics 16 PENNSAID 81% Antiarthritics 17 AUBAGIO 81% Immunologic Agents 18 HUMATROPE 79% Hormones 19 AVAR 79% Dermatologicals 20 RAYOS 78% Hormones

81
Top Drugs by Total Coupon Spending Represented by Range of Therapeutic Categories
Notes: Analysis restricted to commercial patients and claims with coupons used for branded drugs. Table only includes branded drugs with at least 11 claims that used a coupon. Source: Symphony Health IDV® database, 2018
Rank Drug Name Total Coupon Amount Therapeutic Category
1 SENSIPAR $5,627,635 Calcimimetic Agents
2 TALTZ AUTOINJECTOR $1,921,849 Immunologic Agents 3 TRUVADA $1,081,284 Antivirals
4 HUMIRA PEN $791,816 Antiarthritics 5 ELIQUIS $759,028 Hemostatic Modifiers
6 TALTZ AUTOINJECTOR (2 PACK) $451,659 Immunologic Agents
7 EPIDUO FORTE $412,889 Dermatologicals 8 GENVOYA $330,951 Antivirals 9 ORACEA $322,098 Anti-infectives, Systemic
10 XARELTO $307,985 Hemostatic Modifiers 11 LANTUS SOLOSTAR $296,085 Diabetes Therapy
12 ENSTILAR $272,201 Hormones
13 TALTZ AUTOINJECTOR (3 PACK) $268,380 Immunologic Agents
14 SOOLANTRA $238,301 Dermatologicals
15 SYMBICORT $230,667 Respiratory Therapy 16 TRULICITY $216,001 Diabetes Therapy 17 BRILINTA $200,918 Hemostatic Modifiers
18 DUEXIS $196,973 Antiarthritics 19 PENNSAID $194,317 Antiarthritics 20 BROMSITE $187,850 Ophthalmic Preparations
82
Nurse Practitioners as Primary Care Providers: – NPs are recognized in state policy as primary care providers. If a health care
carrier requires the designation of a primary care provider, the carrier must provide its insured with an opportunity to select a participating provider nurse practitioner as a primary care provider or to change its primary care provider to a participating provider nurse practitioner at any time during their coverage period. Mass. Gen. Laws Ann. §176R(4)
Prescriptive Authority: – A written collaboration agreement must include prescriptive guidelines developed
by the physician. Eleven items must be outlined in the agreement including the scope of the NP’s prescribing practice and the types of medication that may be prescribed. Mass. Reg. Code §243-2.10 (5)
State Regulations in Massachusetts
Sources: http://scopeofpracticepolicy.org/states/ma/