massachusetts trial court annual diversity report fiscal
TRANSCRIPT

Massachusetts Trial Court Annual Diversity Report
Fiscal Year 2018
Paula M. Carey Chief Justice of the Trial Court
Jonathan S. Williams Court Administrator

TABLE OF CONTENTS
MESSAGE FROM CHIEF JUSTICE AND COURT ADMINISTRATOR .................................................. 1.
MISSION STATEMENT OF THE MASSACHUSETTS TRIAL COURT .................................................... 3.
OVERVIEW ...................................................................................................................................... 3.
CURRENT & ONGOING EFFORTS ................................................................................................... 4.
DEMOGRAPHIC DATA ................................................................................................................... 6.
COMPARISON OF WORKFORCE BY EEO CATEGORY ................................................................... 12.
COURT INTERPRETER SERVICES .................................................................................................. 22.
COURT SERVICE CENTERS ........................................................................................................... 24.
JURY COMMISSIONER ................................................................................................................. 24.
PROTECTED CLASS INVESTIGATIONS .......................................................................................... 26.
PLANS FOR FY2019 ...................................................................................................................... 26.


Message from Chief Justice & Court Administrator
This second annual Diversity Report is a key part of our efforts to build awareness of the Trial Court’s commitment to strengthening public trust and confidence in the Massachusetts Judicial System.
These efforts are now integrated into our overall mission of “delivering justice with dignity and speed,” and will be a critical element of upcoming strategic planning focused on 2019 -2021.
As the data show, our workforce is becoming more reflective of the diversity of our communities. Over the past fiscal year, the number of racial/ethnic minority Trial Court employees has increased by 71 or 4.8% to a total of 25%. Among the many job titles gaining racial/ethnic minority employees were: Associate Probation Officer, Chief Probation Officer, as well as Judges and Clerk Magistrates. The number of female Judges and Associate Probation Officers also increased.
Still, we recognize that more work is needed, so we are adding staff in Human Resources who can focus on recruitment. We have also engaged with the Massachusetts Bar Association to expand community recruitment efforts. We will continue our partnerships with bar associations and community organizations to ensure broader awareness of career opportunities within the court system.
We continue to expand the capacity of court leaders in effective management of issues of race and bias as they may arise. We commit to being an organization that is intentionally inclusive and deals directly with such issues and in 2019 the Trial Court will introduce new policies on discrimination and sexual harassment. Our expectation is that employees feel safe, are treated fairly and listened to, and that they do the same for court users.
We are actively building a culture in which we “lean in” to difficult conversations about race instead of avoiding them. As we noted in last year’s report, this work might be the hardest work we will ever do but it may also be the most important.
We look forward to our ongoing conversations with internal and external partners as we reinforce the priority of this essential commitment across our courts.
Chief Justice Paula M. Carey Court Administrator Jonathan S. Williams


MISSION STATEMENT OF THE MASSACHUSETTS TRIAL COURT
The Trial Court is committed to:
fair and impartial administration of justice; protection of constitutional and statutory rights and liberties; equal access to justice for all in a safe and dignified environment with policies
and practices that strengthen and support diversity, equity and inclusion; efficient, effective and accountable resolution of disputes; prompt and courteous service to the public by committed and dedicated
professionals utilizing best practices in a manner that inspires public trust andconfidence.
THE EXECUTIVE OFFICE OF THE TRIAL COURT
The Executive Office of the Trial Court is led by the Chief Justice of the Trial Court and the Court Administrator and oversees judicial and court operations, including the Office of Court Management. The Executive Office works collaboratively with the seven Trial Court Departments and Commissioners of Probation and Jury to develop and implement policies and initiatives that promote an environment of continuous improvement and ensure the most effective use of resources to allow the delivery of quality justice. The Executive Office also oversees the development and implementation of strategic planning for the Trial Court.
OVERVIEW
The Trial Court issued its first annual report on diversity for FY2017 to foster more transparency and awareness of the Trial Court’s overall demographics and work on diversity and inclusion. This FY2018 report seeks to do the same while highlighting the many efforts that have been underway and are still to come.
In addition, the annual diversity report highlights the Trial Court’s commitment to confront and address issues around race, diversity, equity, and inclusion. The report provides additional information to reflect the Trial Court’s interest in understanding how court users, including staff, are experiencing the courts. Along with employee demographic data, this year’s report has added jury utilization data and information regarding language access, including the fulfillment of interpreter requests, as well as utilization data for the six Trial Court Service Centers, which help self‐represented litigants navigate and understand our court system. Aggregate data on complaint disposition also is included.
In FY2018, court leaders adopted a Diversity, Equity, and Inclusion Domain within the Trial Court’s Strategic Plan, which included the formation of an Office of Diversity, Equity, and Inclusion. Legislative leaders and the Governor supported this need and provided necessary funding. This was done to ensure that the court is intentional in its focus and efforts to raise awareness, and in its effectiveness to address issues of Diversity, Equity, and Inclusion as they arise. These efforts reinforce the value of all court member contributions to the success of the Court.
3
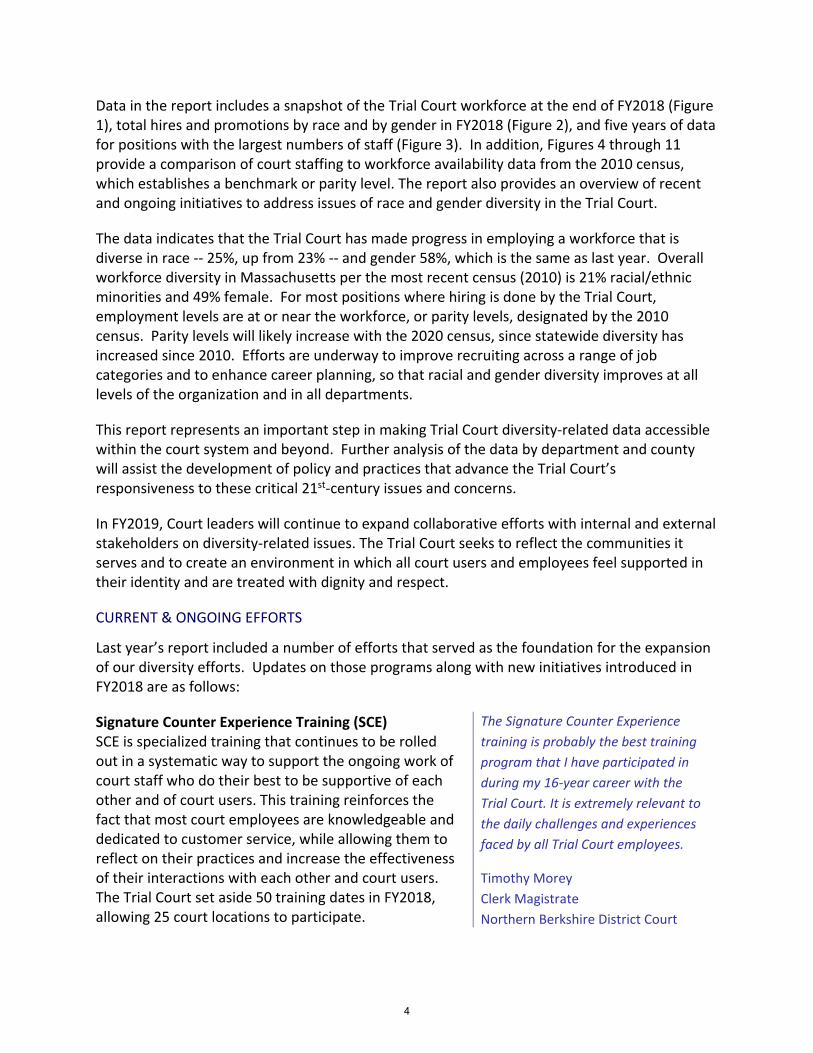
Data in the report includes a snapshot of the Trial Court workforce at the end of FY2018 (Figure 1), total hires and promotions by race and by gender in FY2018 (Figure 2), and five years of data for positions with the largest numbers of staff (Figure 3). In addition, Figures 4 through 11 provide a comparison of court staffing to workforce availability data from the 2010 census, which establishes a benchmark or parity level. The report also provides an overview of recent and ongoing initiatives to address issues of race and gender diversity in the Trial Court.
The data indicates that the Trial Court has made progress in employing a workforce that is diverse in race ‐‐ 25%, up from 23% ‐‐ and gender 58%, which is the same as last year. Overall workforce diversity in Massachusetts per the most recent census (2010) is 21% racial/ethnic minorities and 49% female. For most positions where hiring is done by the Trial Court, employment levels are at or near the workforce, or parity levels, designated by the 2010 census. Parity levels will likely increase with the 2020 census, since statewide diversity has increased since 2010. Efforts are underway to improve recruiting across a range of job categories and to enhance career planning, so that racial and gender diversity improves at all levels of the organization and in all departments.
This report represents an important step in making Trial Court diversity‐related data accessible within the court system and beyond. Further analysis of the data by department and county will assist the development of policy and practices that advance the Trial Court’s responsiveness to these critical 21st‐century issues and concerns.
In FY2019, Court leaders will continue to expand collaborative efforts with internal and external stakeholders on diversity‐related issues. The Trial Court seeks to reflect the communities it serves and to create an environment in which all court users and employees feel supported in their identity and are treated with dignity and respect.
CURRENT & ONGOING EFFORTS
Last year’s report included a number of efforts that served as the foundation for the expansion of our diversity efforts. Updates on those programs along with new initiatives introduced in FY2018 are as follows:
Signature Counter Experience Training (SCE) SCE is specialized training that continues to be rolled out in a systematic way to support the ongoing work of court staff who do their best to be supportive of each other and of court users. This training reinforces the fact that most court employees are knowledgeable and dedicated to customer service, while allowing them to reflect on their practices and increase the effectiveness of their interactions with each other and court users. The Trial Court set aside 50 training dates in FY2018, allowing 25 court locations to participate.
The Signature Counter Experience
training is probably the best training
program that I have participated in
during my 16‐year career with the
Trial Court. It is extremely relevant to
the daily challenges and experiences
faced by all Trial Court employees.
Timothy Morey
Clerk Magistrate
Northern Berkshire District Court
4

Leadership Committees Leadership committees continue to meet to educate and learn more on issues related to race and implicit bias. The Trial Court Race and Implicit Bias Advisory Committee (TRIBAC) includes judges from all court departments, and other committees include Clerks, Probation staff and Security staff. These groups all work to inform Trial Court practices and guide efforts to advance relative to diversity, equity, and inclusion. The committees meet independently to discuss the work from their perspectives and the committee chairs collectively inform our strategic efforts.
Transgender Training In January 2018, the Trial Court launched an on‐line training to provide better understanding and insight as to how transgender persons experience the court system as court users or employees. Guidance is provided as to our expectations that all members of the transgender community are treated with dignity and respect, whether they are litigants, jurors, witnesses, members of the public, attorneys, or colleagues. All managers were required to complete the training by June 2018, and all other employees are expected to complete the training by the end of the calendar year. The Boston Bar Foundation supported the development of the training and the use of pronoun pins that allow staff to demonstrate inclusiveness by wearing their pronouns.
Cultural Appreciation Events The Trial Court and the Probation Department held a series of statewide events of cultural sharing at 80 court locations for a Cultural Appreciation Day in September 2017. These efforts increase awareness of the different cultural norms, traditions, and practices of court employees that included food, music, clothing, literature, and dance. Plans for September 2018 expanded the celebration of diversity to a week of activities to engage local communities and hold signature events with Court leaders across the state.
Strategic Plan 2.0 Diversity, Equity, and Inclusion Domain The Diversity, Equity, and Inclusion Domain within Strategic Plan 2.0 was developed to reflect the Trial Court’s commitment to deliver quality justice by addressing bias, embracing diversity, equity, and inclusion, and eradicating discrimination.
Five focus areas within this domain are:
Leadership Policy, Accountability, Data Education, Training & Professional Development Customer Service Experience & Outcomes Workforce Development
By embedding this work into the strategic plan, Trial Court leaders can better ensure the focus and attention needed to increase organizational capacity, highlight best practices and address concerns. Elements of the plan include building leadership capacity to better understand and respond to issues, reviewing policies to ensure that they reflect the Trial Court’s vision and
5
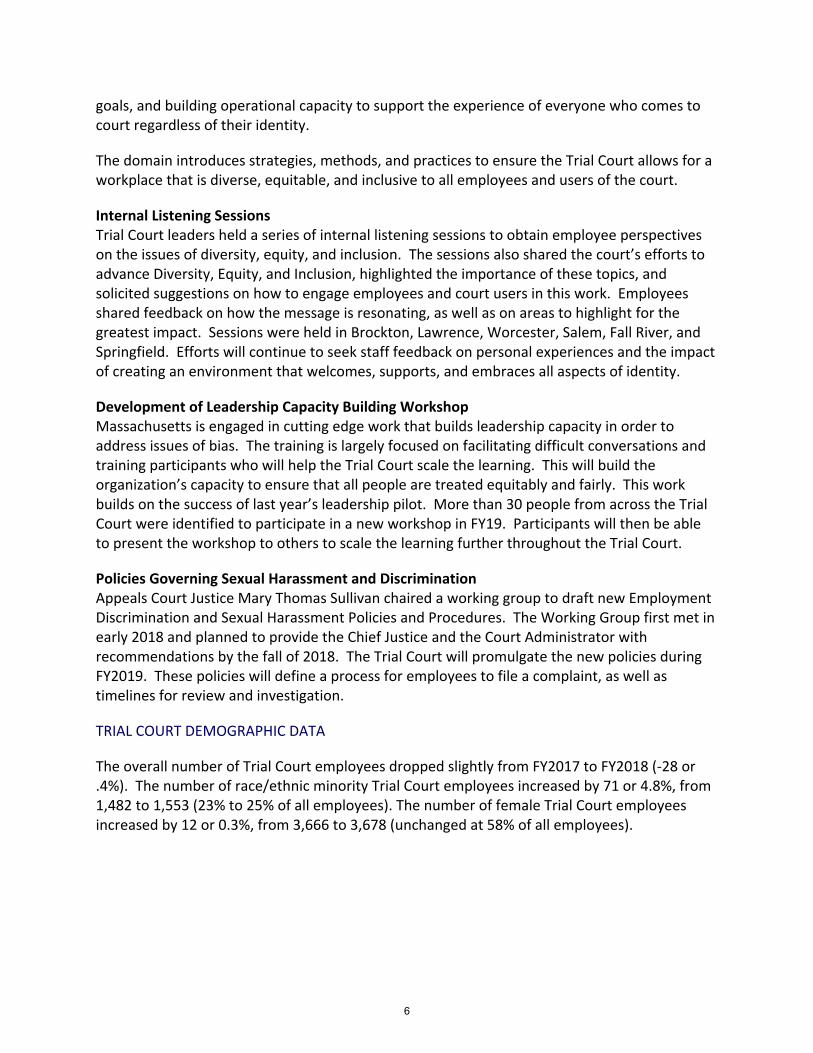
goals, and building operational capacity to support the experience of everyone who comes to court regardless of their identity.
The domain introduces strategies, methods, and practices to ensure the Trial Court allows for a workplace that is diverse, equitable, and inclusive to all employees and users of the court.
Internal Listening Sessions Trial Court leaders held a series of internal listening sessions to obtain employee perspectives on the issues of diversity, equity, and inclusion. The sessions also shared the court’s efforts to advance Diversity, Equity, and Inclusion, highlighted the importance of these topics, and solicited suggestions on how to engage employees and court users in this work. Employees shared feedback on how the message is resonating, as well as on areas to highlight for the greatest impact. Sessions were held in Brockton, Lawrence, Worcester, Salem, Fall River, and Springfield. Efforts will continue to seek staff feedback on personal experiences and the impact of creating an environment that welcomes, supports, and embraces all aspects of identity.
Development of Leadership Capacity Building Workshop Massachusetts is engaged in cutting edge work that builds leadership capacity in order to address issues of bias. The training is largely focused on facilitating difficult conversations and training participants who will help the Trial Court scale the learning. This will build the organization’s capacity to ensure that all people are treated equitably and fairly. This work builds on the success of last year’s leadership pilot. More than 30 people from across the Trial Court were identified to participate in a new workshop in FY19. Participants will then be able to present the workshop to others to scale the learning further throughout the Trial Court.
Policies Governing Sexual Harassment and Discrimination Appeals Court Justice Mary Thomas Sullivan chaired a working group to draft new Employment Discrimination and Sexual Harassment Policies and Procedures. The Working Group first met in early 2018 and planned to provide the Chief Justice and the Court Administrator with recommendations by the fall of 2018. The Trial Court will promulgate the new policies during FY2019. These policies will define a process for employees to file a complaint, as well as timelines for review and investigation.
TRIAL COURT DEMOGRAPHIC DATA
The overall number of Trial Court employees dropped slightly from FY2017 to FY2018 (‐28 or .4%). The number of race/ethnic minority Trial Court employees increased by 71 or 4.8%, from 1,482 to 1,553 (23% to 25% of all employees). The number of female Trial Court employees increased by 12 or 0.3%, from 3,666 to 3,678 (unchanged at 58% of all employees).
6

TotalEmployees
% Racial/EthnicMinority
% Female
Court Officials Trial Court Chief Justice
Justice
Clerk of Court/Register (Elected)
Clerk Magistrate/Recorder
Assistant Clerk/Judicial Case Manager/AsstJudicial Case Manager/Assistant Register
Probation DepartmentChief Probation Officer
Assistant Chief Probation Officer
Probation Officer
Associate Probation Officer
Security Department Director, Deputy, and Regional Director
Chief Court Officer
Assistant Chief Court Officer
Court Officer
Associate Court Officer
Facilities Department Director/Manager
Maintenance
All Court DepartmentsOffice/Clerical
54%
28%
45%
43%
63%
12%
9%
3%
11%
25%
433
86
29
362
8
71%
59%
45%
40%
33%
28%
19%
21%
180
752
176
97
29%
19%
19%
19%
14%
32%
27%
27%
25%
29%
138
794
63
36
7
21%
18%
40%
6%
379
17
85%25%2,330
Figure 1Trial Court Demographic Profile, Year-End FY2018, Selected Titles
Entire Trial Court 58%25%6,317
Massachusetts Labor Market(2010 Labor Pool Census)
49%21%
7

New Hires2016 2017 2018
Promotions2016 2017 2018
Separations2016 2017 2018
Total
414458 483
260309 290
433498 490
Figure 2FY2016 and FY2018 Hirings, Promotions, and SeparationsRacial/Ethnic Minorities and Females
Females 283
(68%)266(58%)
303(63%)
151(58%)
192(62%)
197(68%)
235(54%)
280(56%)
305(62%)
Racial/Ethnic Minority
149(36%)
139(30%)
196(41%)
61(23%)
70(23%)
89(31%)
85(20%)
104(21%)
106(22%)
8

Figure 3: Trial Court Employees, Top 25 Job Titles with EEO Job Category% Racial/Ethnic Minority, % Female, End of FY2014 to FY2018
20142015201620172018
Court Officer (ProtectiveService: Sworn)
Probation Officer(Professional)
Case Specialist (Office andClerical)
Assistant Clerk/Judicial CaseManager/Asst JCM/AsstRegister/Deputy Recorder
Justice (All Professionals)
Probation Case Spec (Gr 7-10)(Office and Clerical)
Case Coordinator (Gr12-13)(Office and Clerical)
Custodian (ServiceMaintenance)
Operations Supervisor Gr.14-15 (Office and Clerical)
779 815804 788794
765 796804 783752
612 609618 600590
443 452453 445433
374 362343 352370
249 258292 256257
227 223220 203206
211 209201 208202
176 178180 169170
Total Employees
2014 2015 2016 2017 2018
25% 26% 27% 27% 27%
26% 26% 27% 28% 28%
26% 28% 28% 28% 30%
10% 9% 10% 11% 12%
12% 11% 12% 11% 12%
27% 27% 30% 32% 34%
16% 18% 18% 18% 20%
48% 51% 53% 55% 58%
16% 16% 19% 21% 22%
% Race/Ethnic Minority
20142015201620172018
19% 19% 19% 20% 19%
55% 56% 59% 60% 59%
87% 85% 85% 86% 83%
48% 48% 49% 51% 54%
39% 39% 40% 41% 44%
92% 92% 93% 93% 91%
92% 91% 91% 91% 92%
32% 33% 32% 32% 36%
91% 92% 93% 94% 93%
% Female
9

Figure 3: Trial Court Employees, Top 25 Job Titles with EEO Job Category% Racial/Ethnic Minority, % Female, End of FY2014 to FY2018
20142015201620172018
Sessions Clerk (Office andClerical)
Assnt. Chief Probation Officer(Professional)
Associate Court Officer(Protective Service: Sworn)
Associate Probation Officer(Professional)
Clerk/Register/Recorder(Pro..
Chief Probation Officer(Officals and Administrators)
Office Manager (Gr. 16)(Officeand Clerical)
Judicial Secretary (Gr 12-13)(Office and Clerical)
165 166169 169184
155 139166 187176
138 137133 124138
120 109 83 140180
115 115115 115115
97 96 98 98 97
93 95 94 93 97
93 90 93 88 83
Total Employees
2014 2015 2016 2017 2018
14% 15% 15% 16% 18%
25% 23% 22% 21% 19%
30% 33% 32% 32% 32%
20% 19% 23% 29% 33%
5% 6% 6% 6% 8%
14% 16% 17% 17% 21%
11% 12% 13% 15% 18%
23% 23% 24% 24% 23%
% Race/Ethnic Minority
20142015201620172018
87% 86% 84% 84% 84%
43% 41% 42% 46% 45%
25% 26% 26% 27% 29%
68% 66% 69% 66% 71%
32% 32% 32% 32% 32%
33% 34% 39% 41% 40%
92% 92% 94% 92% 93%
97% 97% 96% 95% 95%
% Female
10

Figure 3: Trial Court Employees, Top 25 Job Titles with EEO Job Category% Racial/Ethnic Minority, % Female, End of FY2014 to FY2018
20142015201620172018
Probation Office Manager(Gr16) (Office and Clerical)
Head Account Clerk (Officeand Clerical)
Head AdministrativeAssistant (Office and Clerical)
Probation Case Coord(Gr12-13) (Office and Clerical)
Assistant Chief Court Officer(Protective Service: Sworn)
Child Support ProcessingClerk (Office and Clerical)
Sr. Maintenance Tech (Gr12-13) (Skilled Craft)
Asst. Court ServiceCoordinator (Office andClerical)
82 83 86 86 86
77 80 81 84 82
82 83 80 77 70
82 85 66 61 56
57 47 50 65 63
53 52 53 46 42
45 47 41 49 51
48 46 42 43 42
Total Employees
2014 2015 2016 2017 2018
10% 8% 10% 9% 12%
9% 13% 11% 14% 17%
10% 11% 13% 13% 14%
21% 20% 21% 30% 29%
19% 13% 18% 25% 27%
17%29% 36% 33% 40%
11% 9% 7% 10% 14%
19% 20% 17% 19% 21%
% Race/Ethnic Minority
20142015201620172018
98% 98% 99% 99% 99%
91% 90% 93% 92% 90%
90% 92% 91% 91% 91%
98% 97% 97% 97% 98%
25% 21% 16% 18% 19%
77% 77% 72% 67%81%
17% 17% 14% 14% 14%
% Female
11

Census Job Categories
Officials and Administrators The total number of Officials and Administrators decreased by 1. The number of
race/ethnic minority Officials and Administrators increased by 5, from 38 to 43 (16.1% to 18.7% of total Officials and Administrators). This represents an 13.2% increase in the number of race/ethnic minority Officials and Administrators and includes an increase in the number of race/ethnic minority Chief Probation Officers from 17 to 20 (17.3% to 20.6% of total Chief Probation Officers).
The number of female Officials and Administrators decreased by 2, from 110 to 108(46.6% to 47.0% of total Officials and Administrators). The percentage of female Officials and Administrators remains above parity (42.5%).
Professionals The overall number of Professionals increased by 23 or 1.2%. The number of race/ethnic
minority Professionals increased by 18 or 4.1%, from 436 to 454 (23.2% to 23.8% of total Professionals). The percentage of race/ethnic minority Professionals remains above parity (17.0%).
Within this category the number of race/ethnic minority Associate Probation Officersincreased from 41 to 60 (29.3% to 33.3% of total Associate Probation Officers). Overall, the number of Associate Probation Officers increased by 40 or 28.5%, whereas the number of race/ethnic minority Associate Probation Officers increased by 19 or 46.3%.
The number of female Professionals increased by 34 or 3.2%, from 1,062 to 1,096(56.5% to 57.5% of total Professionals). The percentage of female Professionals remains above parity (54.5%).
Within this job category the number of female Assistant Clerks/Judicial Case Managersincreased by 6 or 2.6%, from 226 to 233 (50.8% and 53.4% of total Assistant Clerks/Judicial Case Managers) despite an overall decrease in the number of Assistant Clerks/Judicial Case Managers of 12 or 2.3%, from 445 to 433.
The number of female Associate Probation Officers increased by 34 or 36.6%, from 93 to127 (66.4% and 69.8% of total Associate Probation Officers).
Professionals ‐ Elected and Appointed The overall number of Professionals who are Elected and Appointed increased by 18 or
3.8%. The number of race/ethnic minority Professionals, Elected and Appointed increased by 5 or 10.6%, from 47 to 52 (10.1% to 10.7% of total Professionals, Elected and Appointed). The percentage of race/ethnic minority Professionals, Elected and Appointed remains below parity (17.0%).
The number of race/ethnic minority Justices increased by 3 and the number ofrace/ethnic minority Clerk Magistrates/Recorders increased by 2. The proportion of race/ethnic minorities comprising both job titles remains below parity (17.0%).
The number of female Professionals, Elected and Appointed increased by 17 or 9.3%,from 182 to 199 (39.0% to 41.0% of total Professionals, Elected and Appointed). The percentage of female Professionals, Elected and Appointed remains below parity (54.5%).
12

The number of female Justices increased by 17 or 12.1%, from 140 to 157 (40.7% and43.4% of total Justices. The percentage of female Justices remains below parity (54.4%).
Office and Clerical The overall number of Office and Clerical staff decreased by 17 or 0.7%.The number of
race/ethnic minority Office and Clerical staff increased by 45 or 8.6%, from 526 to 571(22.5% to 24.6% of total Office and Clerical staff). The percentage of race/ethnicminority Office and Clerical Staff remains above parity (17.0%).
The number of female Office and Clerical staff decreased by 33 or 1.6%, from 2,024 to1,991 (86.5% to 85.7% of total Office and Clerical staff). The percentage of female Officeand Clerical staff remains above parity (63.2%).
Protective Service: Sworn The overall number of Protective Service: Sworn staff increased by 14 or 1.4%. The
number of race/ethnic minority Protective Service: Sworn staff increased by 9 or 3.6%,from 278 to 287 (27.4% to 27.9% of total Protective Service: Sworn staff). Thepercentage of race/ethnic minority Protective Service: Sworn staff remains above parity(17.9%).
The number of female Protective Service: Sworn staff increased by 4 or 1.9%, from 207to 211 (20.4% to 20.5% of total Protective Service: Sworn staff). The percentage offemale Protective Service: Sworn staff remains above parity (13.7%).
Service Maintenance The overall number of Service Maintenance staff decreased by 3 or 1.0%. The number of
race/ethnic minority Service Maintenance staff increased by 3 or 2.2%, from 137 to 140(45.8% to 47.3% of total Service Maintenance staff). Overall, the percentage ofrace/ethnic minority Service Maintenance staff remains above parity (17.9%).
The proportion of race/ethnic minority Facility Supervisors (I, II, and III) remained underparity (31.2%). The number of race/ethnic minority Facility Supervisors (I, II, and III)remained at 12, and accounted for 24.5% of total Facility Supervisors (I, II, and III).
The number of female Service Maintenance staff increased by 6 or 8.3%, from 72 to 78(24.1% to 26.4% of total Service Maintenance staff). The percentage of female ServiceMaintenance staff remains below parity (45.8%).
Skilled Craft The overall number of Skilled Craft staff increased by 2 or 4.1%. The number of
race/ethnic minority Skilled Craft staff increased by 2 or 40.0%, from 5 to 7 (10.2% to13.7% of total Skilled Craft staff). Overall, the percentage of race/ethnic minority SkilledCraft staff remains below parity (15.1%).
The Trial Court continues to have no female Skilled Craft staff. Parity is 5.8%.
Technicians The overall number of Technicians remained at 26. The number of race/ethnic minority
Technicians decreased by 2 or 33.3%, from 6 to 4 (23.1% to 15.4% of total Technicians).Overall, the percentage of race/ethnic minority Technicians fell below parity (20.3%).
The number of female Technicians decreased by 1 or 50.0%, from 2 to 1 (7.7% to 3.8%of total Technicians). The percentage of female Technicians remains below parity(57.2%).
13

Figure 4: Officials and Administrators, June 2018
(Parity - 2010 Census estimation of available workforce that is racial/ethnic minority or femalein this job category.)
EOTC/OCM Ct Dpts Fac Sec MPS/OCC
11.1%
23.8%
11.1%
28.6%18.6%
1. Racial/Ethnic Minority Employees(Parity = 12.2%)
EOTC/OCM Ct Dpts Fac Sec MPS/OCC
48.1%
64.3%
33.3%
14.3%
44.1%
Female Employees(Parity = 42.5%)
Department
Employees # Female # Black # Hispanic # Asian # Other Race
EOTC/OCM
Ct Dpts
Fac
Sec
MPS/OCC 145
7
9
42
27
64
1
3
27
13
17
1
1
4
2
7
1
0
4
1
2
0
0
2
0
1
0
0
0
0
2. Employees by Race, Gender
Total R/E M % R/E M ParityFemale Employees %Female Parity
Officials & Administrators
Chief Probation Officer
Program Manager
Field Coordinator
Deputy Court Administrator
Supervisor, Probation Services
230 43 18.7% 12.2% 108 47.0% 42.5%
97 20 20.6% 12.2% 39 40.2% 42.5%
19 3 15.8% 12.2% 12 63.2% 42.5%
13 4 30.8% 12.2% 9 69.2% 42.5%
8 12.2% 5 62.5% 42.5%
8 4 50.0% 12.2% 4 50.0% 42.5%
3. Top 5 Job Titles, % Employees Racial/Ethnic Minority, Female
14
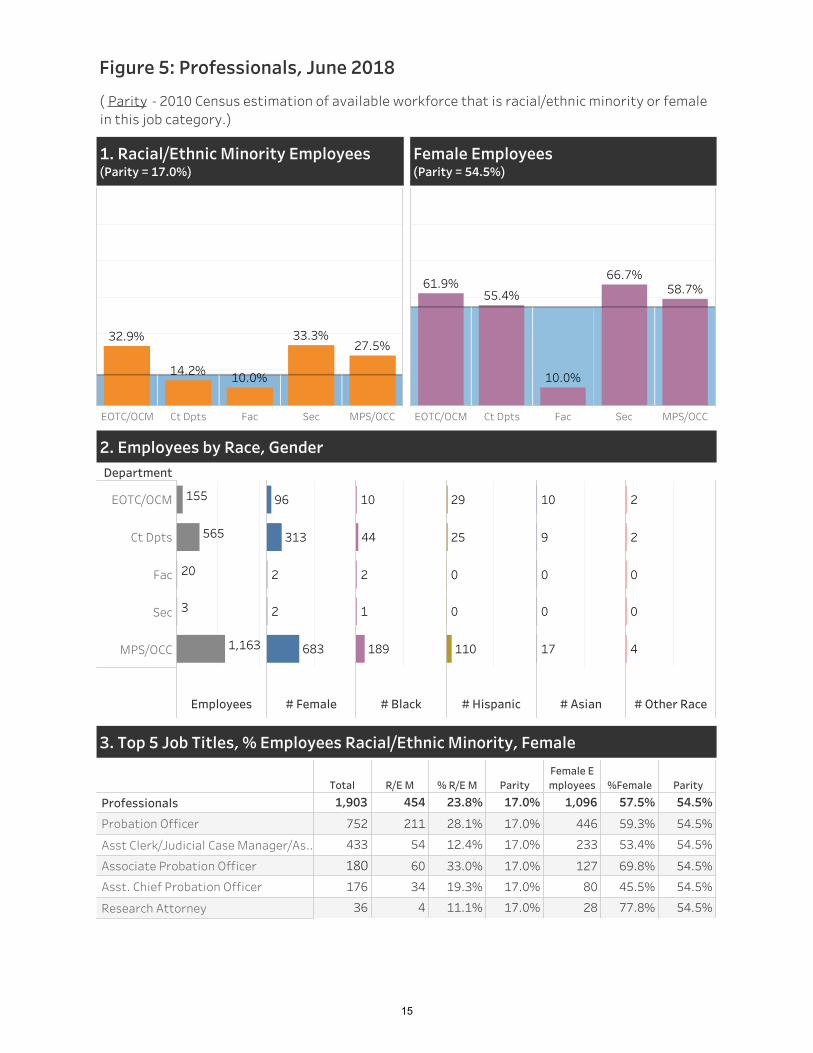
Figure 5: Professionals, June 2018
(Parity - 2010 Census estimation of available workforce that is racial/ethnic minority or femalein this job category.)
EOTC/OCM Ct Dpts Fac Sec MPS/OCC
32.9%
14.2% 10.0%
33.3%27.5%
1. Racial/Ethnic Minority Employees(Parity = 17.0%)
EOTC/OCM Ct Dpts Fac Sec MPS/OCC
61.9%55.4%
10.0%
66.7%58.7%
Female Employees(Parity = 54.5%)
Total R/E M % R/E M ParityFemale Employees %Female Parity
Professionals
Probation Officer
Asst Clerk/Judicial Case Manager/As..
Associate Probation Officer
Asst. Chief Probation Officer
Research Attorney
1,903 454 23.8% 17.0% 1,096 57.5% 54.5%
752 211 28.1% 17.0% 446 59.3% 54.5%
433 54 12.4% 17.0% 233 53.4% 54.5%
180 60 33.0% 17.0% 127 69.8% 54.5%
176 34 19.3% 17.0% 80 45.5% 54.5%
36 4 11.1% 17.0% 28 77.8% 54.5%
3. Top 5 Job Titles, % Employees Racial/Ethnic Minority, Female
Department
Employees # Female # Black # Hispanic # Asian # Other Race
EOTC/OCM
Ct Dpts
Fac
Sec
MPS/OCC 1,163
3
20
565
155
683
2
2
313
96
189
1
2
44
10
110
0
0
25
29
17
0
0
9
10
4
0
0
2
2
2. Employees by Race, Gender
15

Figure 6: Professionals - Elected and Appointed, June 2018
(Parity - 2010 Census estimation of available workforce that is racial/ethnic minority or femalein this job category.)
Ct Dpts Justices
11.3%7.8%
1. Racial/Ethnic Minority Employees(Parity = 17.0%)
Ct Dpts Justices
32.2%
43.4%
Female Employees(Parity = 54.5%)
Total R/E M % R/E M ParityFemale Employees %Female Parity
Professionals - Elected & Appointed
Justice
Clerk Magistrate/Recorder
Clerk of Court/Register (Elected)
Trial Court Chief Justice
485 52 10.7% 17.0% 199 41.0% 54.5%
362 41 11.3% 17.0% 157 43.4% 54.5%
86 8 9.3% 17.0% 24 27.9% 54.5%
29 1 3.4% 17.0% 13 44.8% 54.5%
8 2 25.0% 17.0% 5 62.5% 54.5%
3. Top Job Titles, % Employees Racial/Ethnic Minority, Female
Department
Employees # Female # Black # Hispanic # Asian # Other Race
Ct Dpts
Justices 370
115
162
37
25
5
8
4
8
0
2
0
2. Employees by Race, Gender
("Justices" is a separate employee category.)
16

Figure 7: Office and Clerical, June 2018
(Parity - 2010 Census estimation of available workforce that is racial/ethnic minority or femalein this job category.)
EOTC/OCM Ct Dpts Fac Sec MPS/OCC
25.5% 23.9%33.3%
25.0% 26.0%
1. Racial/Ethnic Minority Employees(Parity = 17.0%)
EOTC/OCM Ct Dpts Fac Sec MPS/OCC
100.0%
74.5%
87.4% 90.5%82.3%
Female Employees(Parity = 63.2%)
Total R/E M % R/E M ParityFemaleEmployees %Female Parity
Office and Clerical
Case Specialist
Probation Case Spec (Gr 7-10)
Case Coordinator (Gr 12-13)
Sessions Clerk
Operations Supervisor Gr 14-15
2,324 571 24.6% 17.0% 1,991 85.7% 63.2%
590 179 30.3% 17.0% 490 83.1% 63.2%
257 87 33.9% 17.0% 235 91.4% 63.2%
206 43 20.8% 17.0% 190 91.8% 63.2%
184 33 17.9% 17.0% 155 84.2% 63.2%
170 37 21.8% 17.0% 158 92.9% 63.2%
3. Top 5 Job Titles, % Employees Racial/Ethnic Minorities, Female
Department
Employees # Female # Black # Hispanic # Asian # Other Race
EOTC/OCM
Ct Dpts
Fac
Sec
MPS/OCC 577
8
21
1,616
102
475
8
19
1,413
76
65
0
4
166
14
65
2
1
164
2
14
0
2
34
8
6
0
0
22
2
2. Employees by Race, Gender
17

Figure 8: Protective Service: Sworn, June 2018
(Parity - 2010 Census estimation of available workforce that is racial/ethnic minority orfemale in this job category.)
Sec
27.9%
1. Racial/Ethnic Minority Employees(Parity = 17.9%)
Sec
20.5%
Female Employees(Parity = 13.7%)
Total R/E M % R/E M ParityFemaleEmployees %Female Parity
Protective Service: Sworn
Court Officer II
Court Officer III
Assoc Court Officer Sprvsr & Cou..
Associate Court Officer
Assistant Chief Court Officer
1,030 287 27.9% 17.9% 211 20.5% 13.7%
371 103 27.8% 17.9% 66 17.8% 13.7%
261 60 23.0% 17.9% 56 21.5% 13.7%
162 54 33.5% 17.9% 30 18.6% 13.7%
138 44 31.9% 17.9% 40 29.0% 13.7%
63 17 27.0% 17.9% 12 19.0% 13.7%
3. Top 5 Job Titles, % Employees Racial/Ethnic Minority, Female
Department
Employees # Female # Black # Hispanic # Asian # Other Race
Sec 1,030 211 177 94 10 6
2. Employees by Race, Gender
18
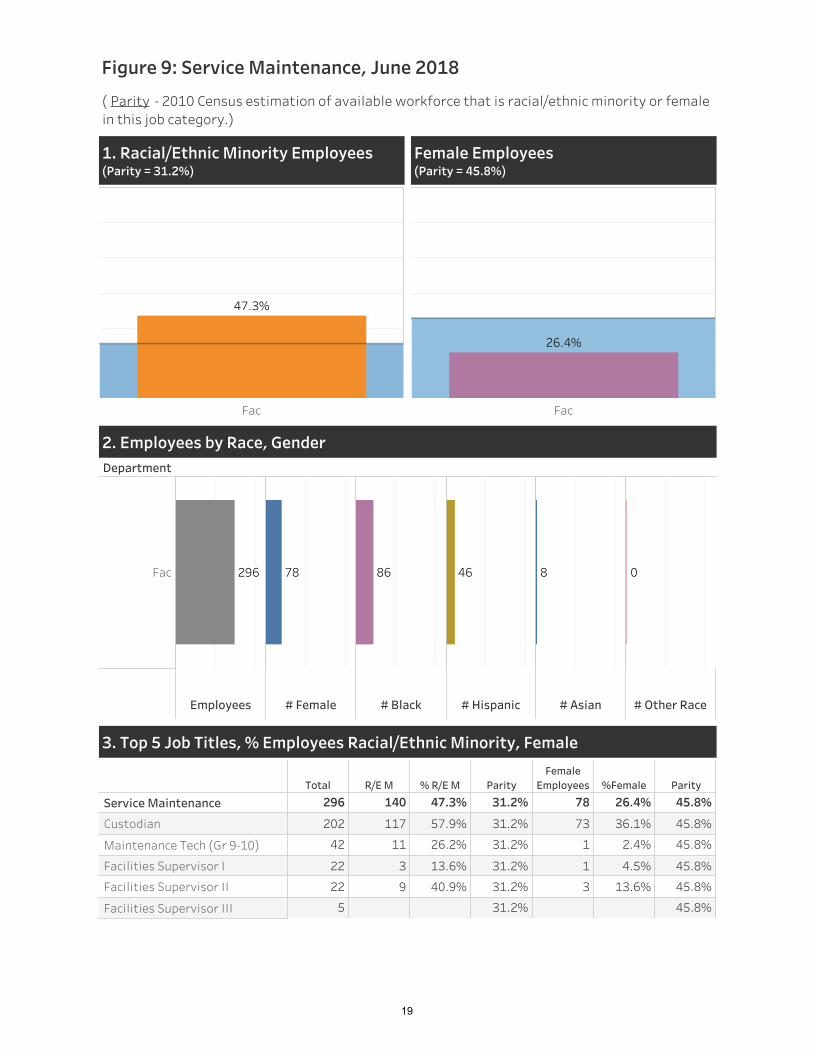
Figure 9: Service Maintenance, June 2018
(Parity - 2010 Census estimation of available workforce that is racial/ethnic minority or femalein this job category.)
Fac
47.3%
1. Racial/Ethnic Minority Employees(Parity = 31.2%)
Fac
26.4%
Female Employees(Parity = 45.8%)
Total R/E M % R/E M ParityFemaleEmployees %Female Parity
Service Maintenance
Custodian
Maintenance Tech (Gr 9-10)
Facilities Supervisor I
Facilities Supervisor II
Facilities Supervisor III
296 140 47.3% 31.2% 78 26.4% 45.8%
202 117 57.9% 31.2% 73 36.1% 45.8%
42 11 26.2% 31.2% 1 2.4% 45.8%
22 3 13.6% 31.2% 1 4.5% 45.8%
22 9 40.9% 31.2% 3 13.6% 45.8%
5 31.2% 45.8%
3. Top 5 Job Titles, % Employees Racial/Ethnic Minority, Female
Department
Employees # Female # Black # Hispanic # Asian # Other Race
Fac 296 78 86 46 8 0
2. Employees by Race, Gender
19

Figure 10: Skilled Craft, June 2018
(Parity - 2010 Census estimation of available workforce that is racial/ethnic minority or femalein this job category.)
Fac
13.7%
1. Racial/Ethnic Minority Employees(Parity = 15.1%)
Fac
Female Employees(Parity = 5.8%)
Total R/E M % R/E M ParityFemaleEmployees %Female Parity
Skilled Craft
Sr Maintenance Tech (Gr 13-14)
51 7 13.7% 15.1% 5.8%
51 7 13.7% 15.1% 5.8%
3. Top Job Titles, % Employees Racial/Ethnic Minority, Female
Department
Employees # Female # Black # Hispanic # Asian # Other Race
Fac 51 4 3 0 0
2. Employees by Race, Gender
20

Figure 11: Technicians, June 2018
(Parity - 2010 Census estimation of available workforce that is racial/ethnic minority orfemale in this job category.)
EOTC/OCM Fac
20.0%14.3%
1. Racial/Ethnic Minority Employees(Parity = 20.3%)
EOTC/OCM Fac
20.0%
Female Employees(Parity = 57.2%)
Total R/E M % R/E M ParityFemaleEmployees %Female Parity
Technicians
Facilities Systems Supervisor
Field Support Technician
Asst Bldg Systems Mgr
Facilities Service Supr (Gr17)
Security Systems Technician
26 4 15.4% 20.3% 1 3.8% 57.2%
19 3 15.8% 20.3% 57.2%
3 1 33.3% 20.3% 1 33.3% 57.2%
1 20.3% 57.2%
1 20.3% 57.2%
1 20.3% 57.2%
3. Top 5 Job Titles, % Employees Racial/Ethnic Minority, Female
Department
Employees # Female # Black # Hispanic # Asian # Other Race
Fac
EOTC/OCM 5
21
1 1
1
0
1
0
0
0
1
2. Employees by Race, Gender
21
COURT INTERPRETER SERVICES
The Trial Court Office of Court Interpreter Services (OCIS) was established to allow all persons within the Commonwealth, regardless of their literacy or proficiency in the English language, to have equal access to the courts and to justice, and have access to all of the services and programs provided in court facilities. OCIS provides language services for over 148,000 court events in 104 languages annually, in accordance with standards, procedures, and policies that are in the process of revision. As of the end of FY2018, 40 staff interpreters support the needs of court users in the following languages: Spanish (70%,), Portuguese (12%), Haitian Creole (5%), as well as Cape Verdean, Vietnamese, ASL, Arabic, Mandarin, Khmer and Russian. The use of 150 contract interpreters further enhance language access capacity.
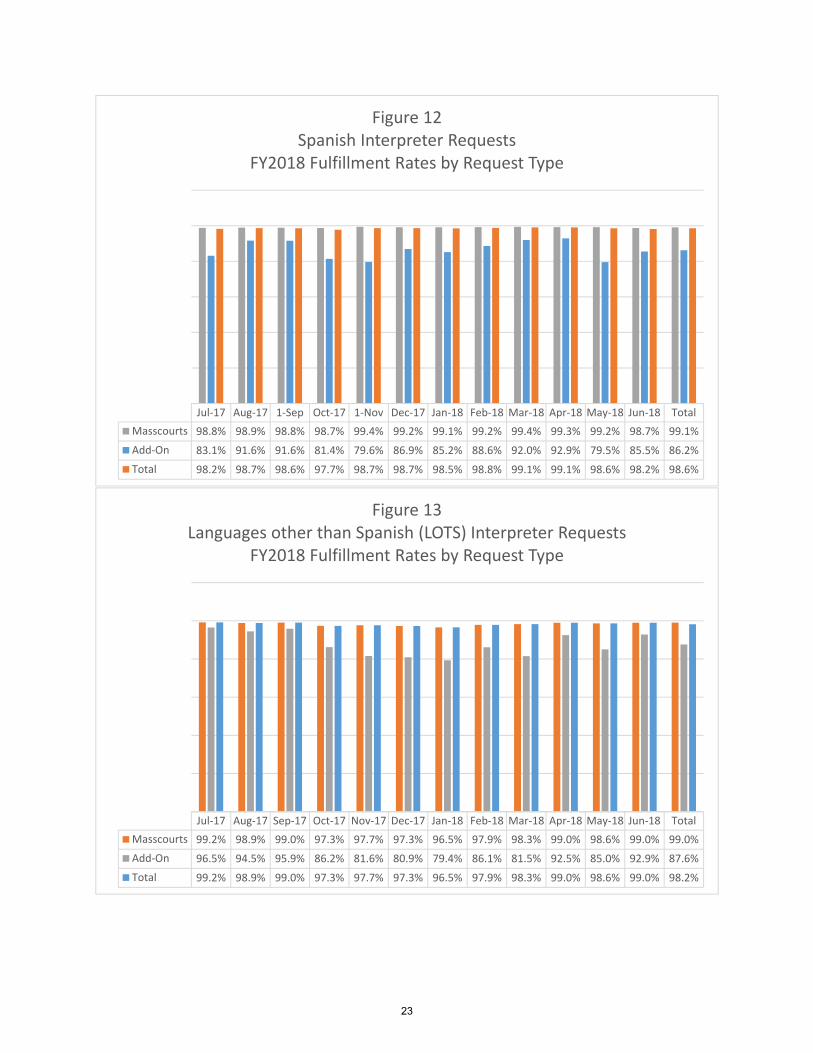
Spanish Language Requests In FY2018, OCIS received 66,162 requests through the MassCourts case management system in advance of the court date for Spanish language access. Of those requests 99.1%, or 65,542, received a Spanish interpreter for language access.
Requests received on the date needed are categorized as added‐on requests. In FY2018, OCIS received 2,712 added‐on requests for Spanish language access. Of those 86.2%, or 2,338, received a Spanish interpreter for language access (see Figure 12).
Combined all Spanish requests total 68,874, with 98.6% or 67,880 fulfillment.
The difference in fulfillment between types of requests highlights that court users benefit if requests are received in advance of the date of service and if additional interpreter resources are available.
Additional language resources would allow OCIS to assign floaters who could be readily available when added‐on requests occur. Currently, OCIS relies upon interpreters that are already scheduled and on assignment for the given day to take on the added‐on requests after they have completed their scheduled assignments. Additional staffing and contract resources would fill these gaps and expand the reach of the Court’s language access service.
Languages Other Than Spanish (LOTS) Requests In FY2018, the Office of Court Interpreter Services (OCIS) received 32,807 requests in MassCourts in advance of the court date for languages other than Spanish. Of those requests received, 99.0% or 32,484, received an interpreter for language access (see Figure 13).
Requests received on the date needed, or added‐on requests, totaled 2,453, with 87.6% or 2,148 receiving an interpreters. There was an 11.4% difference in fulfillment rates between advance requests and same‐day requests. Combined all non‐Spanish requests totaled 35,260 with a fulfillment rate of 98.2% or 34,632.
22
Jul‐17 Aug‐17 1‐Sep Oct‐17 1‐Nov Dec‐17 Jan‐18 Feb‐18 Mar‐18 Apr‐18 May‐18 Jun‐18 Total
Masscourts 98.8% 98.9% 98.8% 98.7% 99.4% 99.2% 99.1% 99.2% 99.4% 99.3% 99.2% 98.7% 99.1%
Add‐On 83.1% 91.6% 91.6% 81.4% 79.6% 86.9% 85.2% 88.6% 92.0% 92.9% 79.5% 85.5% 86.2%
Total 98.2% 98.7% 98.6% 97.7% 98.7% 98.7% 98.5% 98.8% 99.1% 99.1% 98.6% 98.2% 98.6%
Figure 12Spanish Interpreter Requests
FY2018 Fulfillment Rates by Request Type
Jul‐17 Aug‐17 Sep‐17 Oct‐17 Nov‐17 Dec‐17 Jan‐18 Feb‐18 Mar‐18 Apr‐18 May‐18 Jun‐18 Total
Masscourts 99.2% 98.9% 99.0% 97.3% 97.7% 97.3% 96.5% 97.9% 98.3% 99.0% 98.6% 99.0% 99.0%
Add‐On 96.5% 94.5% 95.9% 86.2% 81.6% 80.9% 79.4% 86.1% 81.5% 92.5% 85.0% 92.9% 87.6%
Total 99.2% 98.9% 99.0% 97.3% 97.7% 97.3% 96.5% 97.9% 98.3% 99.0% 98.6% 99.0% 98.2%
Figure 13Languages other than Spanish (LOTS) Interpreter Requests
FY2018 Fulfillment Rates by Request Type
23
COURT SERVICE CENTERS
The Massachusetts Trial Court established its first Court Service Centers (CSC) in 2014 in Greenfield and Boston and has since added centers in Lawrence, Brockton, Springfield, and Worcester. The CSCs work to engage the public and communities to enable greater access to the justice system for self‐represented litigants.
CSCs help people navigate the court system through free, in‐person service to those needing assistance with all types of court matters. CSCs have computers with access to online resources that are available to court users on a first‐come, first‐served basis. Some CSC staff speak languages other than English, but most services provided to Limited‐English Proficient court users are conducted through phone interpretation. Court users also receive translated forms, as needed. CSCs collaborate with various court departments and outside agencies to offer self‐represented litigants procedural and legal information, one‐on‐one assistance with filling out forms, access to interpreter services, assistance with legal research, as well as contact information for community resources, legal assistance programs, and social service agencies. The CSCs do not provide legal advice but can provide legal information on how the court works and the different options available.
In FY2018, 60,500 people visited the Trial Court’s six Court Service Centers. Court Service Centers are located at the following six courthouses: Edward W. Brooke Courthouse (Boston), Franklin County Justice Center (Greenfield), Fenton Judicial Center (Lawrence), George N. Covett Courthouse (Brockton), Roderick L. Ireland Courthouse (Springfield), Worcester Trial Court Complex (Worcester).
JURY COMMISSIONER
The core mission of the Office of Jury Commissioner (OJC) is to provide randomly‐selected pools of eligible jurors, representative of the community from which they are drawn, to each of the jury courts of the Commonwealth of Massachusetts, in accordance with the needs of those courts and the direction of the Trial Court.
The OJC oversees the random selection of a diverse and representative group of citizens to perform jury service and assist in the administration of justice. The OJC requires all persons summoned for jury service to complete a demographic survey modeled on the survey used in the federal courts. Jurors are asked to provide the race(s) with which they identify, and whether they consider themselves Hispanic. (“Hispanic” is considered a cultural/linguistic self‐identifier, not a “race.”) The results are tabulated and compared against federal census figures. (See Figure 14.)
For race, respondents can choose “Other,” in addition to the five standard categories (for example, people of Middle Eastern descent). In addition, anyone who identifies with two or more categories will be classified in the “Other” category. Therefore, most of the “Other” responses are considered to be non‐White.
24

Demographic Category
Race Population % Population % Population % Population %
Black/African American 315,902 6% 43,372 6% 13,002 6% 2,379 7%
White 4,217,035 82% 565,540 79% 168,673 82% 29,333 83%
Native Hawaiian/Pacific Islander 1,692 0% 621 0% 153 0% 21 0%
Asian 270,514 5% 34,941 5% 7,279 4% 1,178 3%
American Indian/Alaskan Native 13,622 0% 1,313 0% 350 0% 47 0%
Other 309,941 6% 67,216 9% 15,447 8% 2,433 7%
Total 5,128,706 100% 713,003 100% 204,904 100% 35,391 100%
Ethnicity Population % Population % Population % Population %
Yes, Hispanic/Latino 416,775 8% 60,458 8% 13,343 7% 2,114 6%
No, Not Hispanic/Latino 4,711,931 92% 642,722 89% 189,829 92% 33,093 93%
No Response Hispanic/Latino ‐
0% 16,433 2% 3,266 2% 376 1%
Figure 14
Federal Census and Selected Juror Populations
Federal Census 2010Jurors Who Responded
to Demographic Survey
Jurors Who Appeared for
Juror Service Population
Jurors Who Appeared &
Were Impaneled
25

The OJC tabulates the responses for three different groups: (1) those who responded to the survey (including those disqualified from service); (2) those who appeared for jury service, and (3) those who appeared and were impaneled on a jury.
Historically, these figures have tracked fairly closely statewide to the population as reported in the federal census figures. The exception is Asians and Hispanics, who do not qualify for service due to lack of citizenship or English language facility at a much higher rate than the other groups. The OJC has reviewed census data on these groups – non‐citizen/non‐English speakers among Asians and Hispanics – to confirm that the rates of citizens appearing for service is on track with their representation in the population.
The diversity and representativeness of the Massachusetts jury pools is attributed to the superior quality of the source list for the Massachusetts master juror list. Massachusetts uses the mandatory annual municipal census as its source list, which is widely believed to be one of the best source lists in the country because it is refreshed annually and is all‐inclusive, unlike self‐selecting, multi‐year sources, such as voter registration lists or driver registration lists.
PROTECTED CLASS INVESTIGATIONS
In light of increased focus by the Trial Court on issues of diversity, equity, and inclusion, as well as employee outreach sessions, the Trial Court received an increase in complaints in FY2018. The various types of complaints that were investigated by the Trial Court are shown in Figure 15. When new policies are promulgated in 2019, we anticipate a further increase in complaintsand investigations. In FY2019, the Trial Court plans to address the need for additional investigators to support the increase in complaints and ensure timely investigations. The Trial Court received 64 complaints in FY2018, of which 14% were substantiated by the investigator, based on the Trial Court Policies and Procedures Manual. (See Figure 15.) An additional 6% percent of the “Other” complaints resulted in a determination that the behavior alleged occurred, but were not protected class violations. As needed, complaints are referred to Human Resources to provide assistance that would support a resolution.
PLANS FOR FY2019
Recruitment The Office of Diversity, Equity, and Inclusion will work with Human Resources to extend active recruiting efforts to increase the diversity of applicant pools to bring the court departments closer to parity where it is lacking, based on the FY2018 data. The Office of Diversity, Equity, and Inclusion will partner with Trial Court Departments, Human Resources, and affinity groups to establish and meet strategic goals.
Internal Diversity Survey The Trial Court will survey employees to identify how their experience in the court is impacted by their identity. This will help the Trial Court understand issues faced by employees and will inform policies and practices to improve the work environment and also enable the court to better serve court users.
26

Figure 15 Protected Class Investigations
(*NCR‐ Non Civil Rights Complaint)
(** The total number of complaints do not equal the number in each category because some complaints have greater than one allegation)
0
5
10
15
20
25
30
35
Race NationalOrigin
Sex Gender Disability GenderIdentity
SexualOrientation
Color Ancestry NCR
Complaints
Harassment Discrimination
0
5
10
15
20
25
30
35
Race Sex Gender Identity Sexual Orientation Gender
Substantiated Complaints
Harassment Discrimination
27
Community Engagement Sessions The Trial Court will conduct community engagement sessions to obtain first‐hand accounts of how people experience and perceive the court system. These forums will build understanding of the aspects of the court system that court users and communities most want to question, learn and discuss. Increased Education and Training Training efforts in FY2019 include:
Enhanced employee training focus on issues of race; Equal Employment Opportunity (EEO) training for managers to ensure understanding
and compliance with policy; Diversity Training to better understand the multitude of diversity and why it matters; Cultural Competency training to broaden the understanding of how people of different
cultures may approach the world in different ways and to increase understanding of what that means in our daily interactions.
Community Outreach Pilot with the National Center for State Courts (NCSC) In a pilot community engagement project with the National Center for State Courts, the Trial Court will expand outreach at the local and state levels. Pilot sites of Springfield, Holyoke, and Chicopee will provide an initial focus to inform statewide efforts. In order to build public trust and confidence, outreach will involve community leaders, the general public, local court leaders, bar associations, criminal justice partners, and court management on issues of race and bias, understanding of the court system, and the role each entity plays. NCSC will provide technical assistance and evaluate Trial Court efforts at conclusion of the pilot.
Massachusetts Bar Association Judicial Diversity Task Force The Trial Court will partner with the MBA and local Bar Associations, including Affinity Bar Associations, to introduce a program, “Jobs in the Trial Court.” Forums will be hosted by the Bar and supported by the court to introduce the court and potential job opportunities to diverse communities in order to spark interest in working for the court system. Judges and Clerks will participate to explain their roles and their perspectives on career advancement in the court.
Implicit Bias Training for Security As Massachusetts Court Officers are the third largest law enforcement entity in the Commonwealth, the Trial Court will work with a leading law enforcement consultant to develop a train‐the‐trainer module for security staff on race and implicit bias. The training will be designed to address the science of bias, introduce elements of a comprehensive program to promote fairness and impartiality, and provide insight on implications for the organization.
28