massachusetts state hazard mitigation and climate ... · massachusetts state hazard mitigation and...
TRANSCRIPT
Massachusetts State Hazard Mitigation and Climate Adaptation Plan
Chapter 2: Planning Context
September 2018
Prepared for:
Massachusetts Emergency Management Agency 400 Worcester Road (Route 9 East) Framingham, MA 01702-5399
Massachusetts Executive Office of Energy and Environmental Affairs 100 Cambridge Street, Suite 900 Boston, MA 02114
Prepared by:
AECOM 250 Apollo Drive Chelmsford, MA 01824

This page intentionally left blank.
Massachusetts State Hazard Mitigation and Climate Adaptation Plan i September 2018
Table of Contents
Acronyms and Abbreviations ........................................................................................ iii
2. Planning Context ................................................................................................. 2-1
2.1 Organization of State Government ....................................................................................... 2-2
2.1.1 Counties...................................................................................................................... 2-3
2.1.2 Municipalities ............................................................................................................. 2-4
2.1.3 Indian Tribal Governments ......................................................................................... 2-5
2.1.4 Planning Regions ........................................................................................................ 2-5
2.1.5 The Commonwealth’s Climate Change Strategy ........................................................ 2-6
2.2 Recent and Projected Development Trends ......................................................................... 2-7
2.2.1 Population and Population Trends ............................................................................. 2-7
2.2.2 Housing and Development Highlights ...................................................................... 2-14
2.3 Climate Change Projections ................................................................................................ 2-21
2.3.1 Resilient MA Climate Change Clearinghouse for the Commonwealth ..................... 2-21
2.3.2 Massachusetts Climate Projections ......................................................................... 2-22
Figures
Figure 2-1: Map of Counties in Massachusetts ..................................................................................... 2-4
Figure 2-2: Map of Planning Regions in Massachusetts ........................................................................ 2-6
Figure 2-3: Past and Projected Population ............................................................................................ 2-8
Figure 2-4: Projected Percent Growth by Region 2010-2035 ................................................................ 2-9
Figure 2-5: Assessment of Climate Change Vulnerability .................................................................... 2-10
Figure 2-6: Environmental Justice Communities (2010 Census Block Groups) ................................... 2-13
Figure 2-7: Housing Choice Communities and Small Towns ................................................................ 2-15
Figure 2-8: Known Brownfields Sites in Massachusetts ...................................................................... 2-18
Figure 2-9: Population Density and Access to Fixed-Route Transit ..................................................... 2-19
Figure 2-10: Communities with Complete Streets Policies and Projects ............................................ 2-20
Figure 2-11: Annual Total Precipitation ............................................................................................... 2-23
Figure 2-12: Projected Annual Average Temperature ......................................................................... 2-25
Figure 2-13: Projected Annual Days with Temperature Below 32°F ................................................... 2-26
Figure 2-14: Projected Annual Days with Temperature Above 90°F ................................................... 2-26
Figure 2-15: Projected Annual Growing Degree-Day Accumulation ................................................... 2-27
Figure 2-16: Relative Mean Sea Level and Future Scenarios for Boston, MA ..................................... 2-29
Figure 2-17: Relative Mean Sea Level and Future Scenarios for Woods Hole, MA ............................. 2-30
Figure 2-18: Relative Mean Sea Level and Future Scenarios for Nantucket, MA ................................ 2-31
Table of Contents
ii Massachusetts State Hazard Mitigation and Climate Adaptation Plan September 2018
Tables
Table 2-1: Commonwealth Government Roles for Hazard Mitigation and Climate Adaptation Planning .............................................................................................................................. 2-1
Table 2-2: Constitutional Officers as of September 2018 ..................................................................... 2-2
Table 2-3: Executive Offices of Massachusetts ..................................................................................... 2-3
Table 2-4: Population and Population Density by County ..................................................................... 2-8
Table 2-5: Vulnerable Populations by County ..................................................................................... 2-11
Table 2-6: Housing Characteristics by County ..................................................................................... 2-14
Table 2-7: Continuous Dry Days by Planning Year ............................................................................... 2-23
Table 2-8: Maximum Daily Projected Temperature Changes through 2100 ....................................... 2-24
Table 2-9: Northeast Climate Adaptation Science Center Relative Mean Sea Level Projections for Boston, MA, Tide Station ......................................................................... 2-28
Massachusetts State Hazard Mitigation and Climate Adaptation Plan iii September 2018
Acronyms and Abbreviations °F Degrees Fahrenheit
BIA U.S. Bureau of Indian Affairs
CZM Office of Coastal Zone Management
DEP Department of Environmental
Protection
DPA Designated Port Areas
EJ Environmental Justice
EOEEA Executive Office of Energy and
Environmental Affairs
EOPSS Executive Office of Public Safety and
Security
GHG Greenhouse Gas
GIS Geographic Information System
GWSA Global Warming Solutions Act of 2008
MAPC Metropolitan Area Planning Council
MassDOT Massachusetts Department of
Transportation
MEMA Massachusetts Emergency Management
Agency
MBTA Massachusetts Bay Transportation
Authority
MVP Municipal Vulnerability Preparedness
RTA(s) Regional Transit Authority
(Authorities)
SHMCAP State Hazard Mitigation and Climate
Adaptation Plan
STIP State Transportation Improvement Plan
TDI Transformative Development Initiative

This page intentionally left blank.
Massachusetts State Hazard Mitigation and Climate Adaptation Plan 2-1 September 2018
2. Planning Context This chapter provides an overview of key considerations for hazard mitigation and climate
adaptation planning in the Commonwealth, including the organization of government in
Massachusetts and introduction of the Commonwealth’s Climate Change Strategy. Table 2-1
identifies the Commonwealth’s Executive Offices and agencies that are primarily responsible for
hazard mitigation and climate adaptation planning in the state. Sections on recent and projected
development trends and climate change projections are also included to provide a summary of
changes that have occurred or are projected to occur in Massachusetts that may affect risk and
vulnerability, as determined in the risk assessment that was conducted for this integrated State
Hazard Mitigation and Climate Adaptation Plan (SHMCAP).
Table 2-1: Commonwealth Government Roles for Hazard Mitigation and Climate Adaptation Planning
Executive Office / Agency Role
Massachusetts Emergency Management Agency (MEMA)
MEMA ensures the state is prepared to withstand, respond to, and recover from all types of emergencies and disasters, and is responsible for maintaining the Commonwealth’s State Hazard Mitigation Plan.
Executive Office of Energy and Environmental Affairs (EOEEA) and the Executive Office of Public Safety and Security (EOPSS)
Per Governor Baker’s Executive Order 569, Establishing an Integrated Climate Change Strategy for the Commonwealth, EOEEA and EOPSS are responsible for maintaining a statewide climate adaptation plan.
Chapter 2: Planning Context
2-2 Massachusetts State Hazard Mitigation and Climate Adaptation Plan September 2018
2.1 Organization of State Government Massachusetts was designated a commonwealth in 1780 when the Massachusetts constitution
was ratified. The term is used to describe a body of people constituting a nation or state.
Massachusetts has three branches of government—the Executive, Legislative, and Judicial
Branches—as well as constitutional officers and independent agencies and commissioners,
which are part of the Executive Branch, but not subject to its oversight or control. The
Commonwealth elects six constitutional officers every 4 years (see Table 2-2).
Table 2-2: Constitutional Officers as of September 2018
Title Name
Governor Charlie Baker
Lieutenant Governor Karyn Polito
Secretary of the Commonwealth William Francis Galvin
Treasurer and Receiver General Deborah Goldberg
Attorney General Maura Healey
Auditor Suzanne Bump
The General Court, which consists of a 40-member Senate and a 160-member House of
Representatives, is the legislative body of Massachusetts. Senators and Representatives are
elected every 2 years. The Legislative Branch creates State laws and makes changes to existing
laws. The Judicial Branch consists of the Supreme Judicial Court, Appeals Court, Executive
Office of the Trial Court, seven Trial Court departments, Massachusetts Probation Services, and
the Office of Jury Commissioner. The Supreme Judicial Court consists of Chief Justice Ralph D.
Gants and six associate justices. The Governor, with the advice and consent of an executive
council, appoints all justices. The Executive Branch of the state government oversees the
programs and services offered by the State. Table 2-3 lists the Executive Offices and their
functions.
The State House in Boston is the primary seat of Massachusetts government. The State
Legislature and offices of the Governor are located at the State House.
Chapter 2: Planning Context
Massachusetts State Hazard Mitigation and Climate Adaptation Plan 2-3 September 2018
Table 2-3: Executive Offices of Massachusetts
Executive Office Function
Executive Office of Administration and Finance
Oversees the financial and administrative aspects of State government.
Executive Office of Education Manages and sets the standards for State-backed education, and provides support for administrators, teachers, parents, and students.
Executive Office of Energy and Environmental Affairs
Manages and preserves the Commonwealth’s open spaces, enforces pollution laws, ensures new development projects do not harm the environment, and promotes eco-friendly energy production and conservation.
Executive Office of Health and Human Services
Oversees health and general support services to help people meet basic needs.
Executive Office of Housing and Economic Development
Supports job creation and economic development by fostering an environment conducive to business creation and expansion, and helps to drive housing construction that addresses the needs of residents.
Executive Office of Labor and Workforce Development
Manages the Commonwealth’s workforce and labor departments to ensure that employers, workers, and the unemployed have the tools and training needed to succeed in the Massachusetts economy.
Executive Office of Public Safety and Security
Keeps the people of Massachusetts informed about public safety issues, and provides services to protect residents from natural and man-made threats.
Massachusetts Department of Transportation
Oversees roads, public transit, aeronautics, and transportation licensing and registration across the state.
Executive Office of Technology Services and Security
Provides secure and quality digital information, services, and tools to customers and constituents when and where they need them.
Source: Mass.gov, 2018
2.1.1 Counties
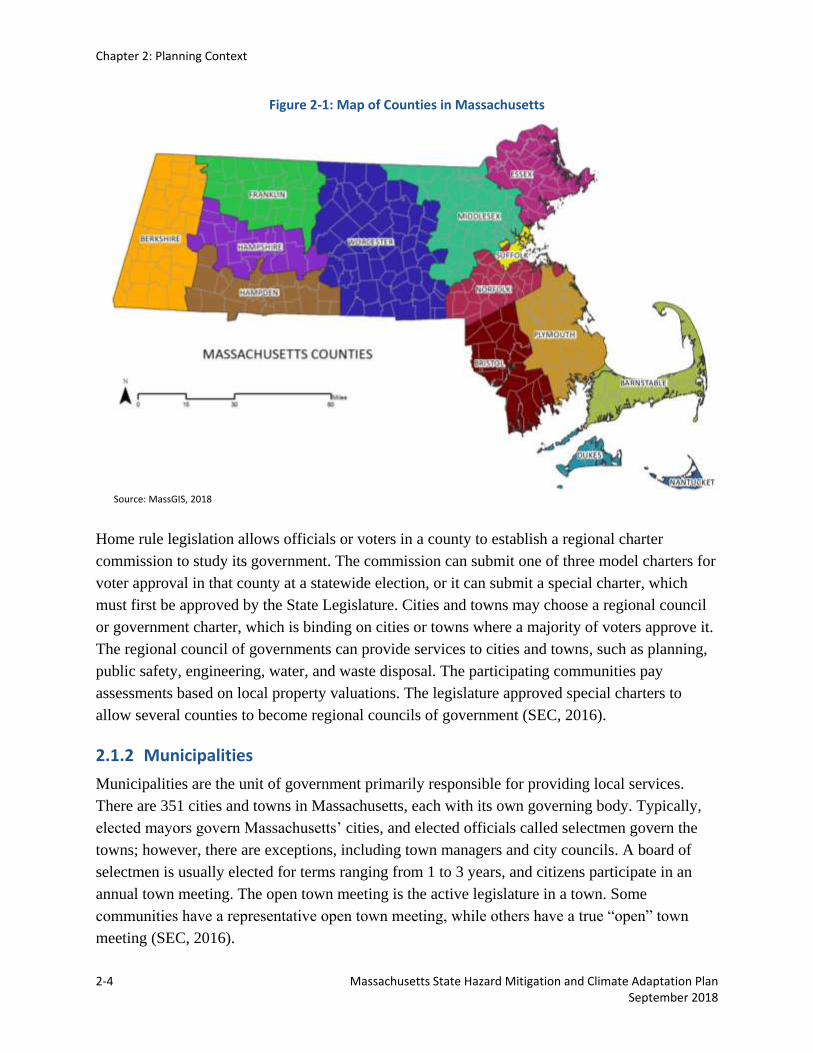
There are 14 counties in Massachusetts (see Figure 2-1). Many counties’ governments are no
longer in existence. However, county government continues to exist in Barnstable, Bristol,
Dukes, Nantucket, Norfolk, and Plymouth Counties. In all counties, regardless of where there is
a county government, there is a sheriff elected by the voters of the county.
Chapter 2: Planning Context
2-4 Massachusetts State Hazard Mitigation and Climate Adaptation Plan September 2018
Figure 2-1: Map of Counties in Massachusetts
Source: MassGIS, 2018
Home rule legislation allows officials or voters in a county to establish a regional charter
commission to study its government. The commission can submit one of three model charters for
voter approval in that county at a statewide election, or it can submit a special charter, which
must first be approved by the State Legislature. Cities and towns may choose a regional council
or government charter, which is binding on cities or towns where a majority of voters approve it.
The regional council of governments can provide services to cities and towns, such as planning,
public safety, engineering, water, and waste disposal. The participating communities pay
assessments based on local property valuations. The legislature approved special charters to
allow several counties to become regional councils of government (SEC, 2016).
2.1.2 Municipalities
Municipalities are the unit of government primarily responsible for providing local services.
There are 351 cities and towns in Massachusetts, each with its own governing body. Typically,
elected mayors govern Massachusetts’ cities, and elected officials called selectmen govern the
towns; however, there are exceptions, including town managers and city councils. A board of
selectmen is usually elected for terms ranging from 1 to 3 years, and citizens participate in an
annual town meeting. The open town meeting is the active legislature in a town. Some
communities have a representative open town meeting, while others have a true “open” town
meeting (SEC, 2016).
Chapter 2: Planning Context
Massachusetts State Hazard Mitigation and Climate Adaptation Plan 2-5 September 2018
2.1.3 Indian Tribal Governments
The Commonwealth of Massachusetts has two federally recognized Indian Tribes within its
boundary: the Mashpee Wampanoag Tribe, and the Wampanoag Tribe of Gay Head (Aquinnah).
Federally recognized tribes are those recognized by the U.S. Bureau of Indian Affairs (BIA) for
certain Federal government purposes. Federal tribal recognition grants to tribes the right to self-
government, as well as certain benefits that include funding and services from the BIA and other
federal agencies, either directly or through contracts, grants, or compacts.
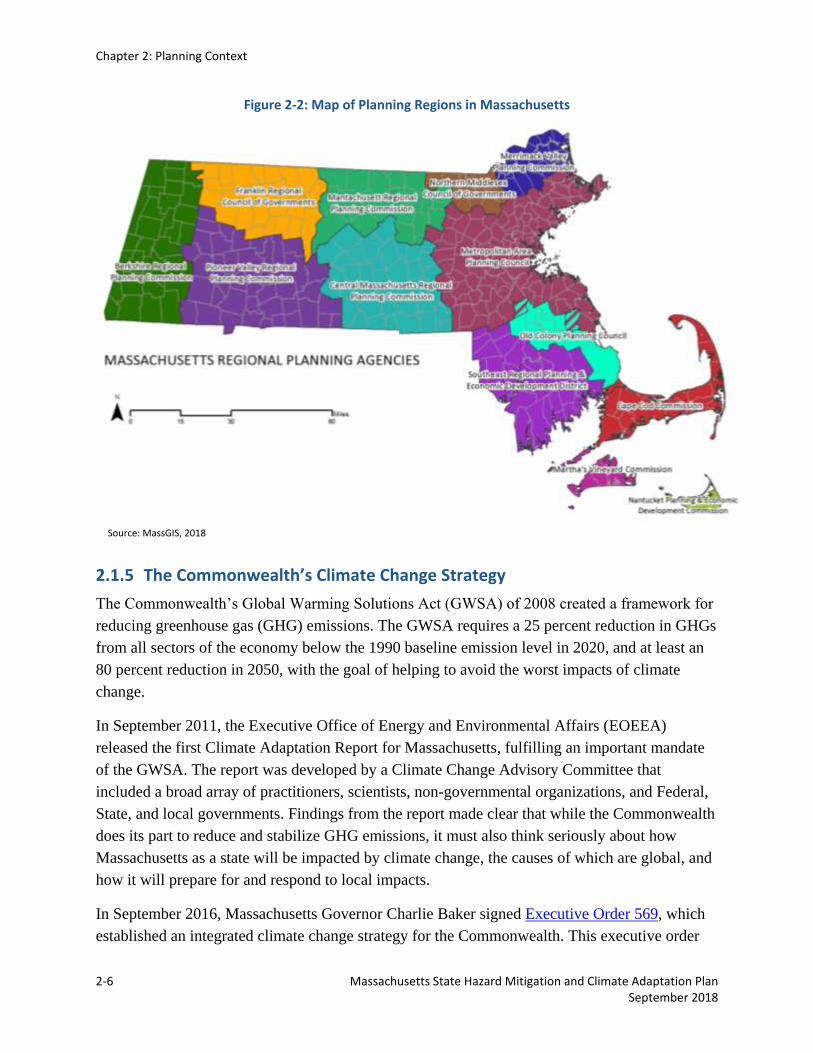
2.1.4 Planning Regions
Chapter 40B of the Massachusetts General Laws established 13 planning regions throughout the
Commonwealth in 1963 (see Figure 2-2). The Regional Planning Agency for each planning
region works in concert with partnering jurisdictions and organizations to complete planning
tasks, such as development of regional mitigation plans, transportation planning, economic
growth studies, land use and energy planning, historic preservation, open space and natural
resources, water and coastal resources, and mapping/geographic information system (GIS).
These planning regions also support the Commonwealth’s District Local Technical Assistance
Program to pursue a variety of municipal shared service initiatives and planning projects through
a region-wide solicitation process. Regional Planning Agencies are established as commissions
or councils, and serve an advisory role. Each commission or council is composed of a
representative from each member community.
Chapter 2: Planning Context
2-6 Massachusetts State Hazard Mitigation and Climate Adaptation Plan September 2018
Figure 2-2: Map of Planning Regions in Massachusetts
Source: MassGIS, 2018
2.1.5 The Commonwealth’s Climate Change Strategy
The Commonwealth’s Global Warming Solutions Act (GWSA) of 2008 created a framework for
reducing greenhouse gas (GHG) emissions. The GWSA requires a 25 percent reduction in GHGs
from all sectors of the economy below the 1990 baseline emission level in 2020, and at least an
80 percent reduction in 2050, with the goal of helping to avoid the worst impacts of climate
change.
In September 2011, the Executive Office of Energy and Environmental Affairs (EOEEA)
released the first Climate Adaptation Report for Massachusetts, fulfilling an important mandate
of the GWSA. The report was developed by a Climate Change Advisory Committee that
included a broad array of practitioners, scientists, non-governmental organizations, and Federal,
State, and local governments. Findings from the report made clear that while the Commonwealth
does its part to reduce and stabilize GHG emissions, it must also think seriously about how
Massachusetts as a state will be impacted by climate change, the causes of which are global, and
how it will prepare for and respond to local impacts.
In September 2016, Massachusetts Governor Charlie Baker signed Executive Order 569, which
established an integrated climate change strategy for the Commonwealth. This executive order
Chapter 2: Planning Context
Massachusetts State Hazard Mitigation and Climate Adaptation Plan 2-7 September 2018
expands on the objectives of the GWSA to reduce GHG emissions, and directs the EOEEA to
continue and accelerate efforts to mitigate and reduce GHG emissions. This includes establishing
statewide GHG emissions limits for 2030 and 2040, and to promulgate regulations to ensure
compliance with the 2020 emissions limit. Section 3 of the Executive Order directs the EOEEA
to coordinate efforts across the Commonwealth to strengthen the resilience of communities,
prepare for the impacts of climate change, and prepare for and mitigate damage from extreme
weather events. This integrated hazard mitigation plan and climate adaptation plan has been
developed in response to this recognition of the need and benefits of addressing climate change
through an integrated strategy across sectors that brings together all parts of State and local
government, and capitalizes on the expertise and institutional knowledge of the Executive Office
of Public Safety and Security and the Massachusetts Emergency Management Agency. This plan
satisfies the Executive Order 569 directive to publish a statewide climate adaptation plan.
Executive Order 569 also directs GHG emissions reductions and natural hazard resilience
planning to wherever possible employ strategies that conserve and sustainably employ the
natural resources of the Commonwealth to enhance climate adaptation, build resilience, and
mitigate climate change. Natural resources, open spaces, and nature-based solutions provide
multiple services that include resilience benefits, public health services, and contribute to
environmental and restoration economies.
2.2 Recent and Projected Development Trends
2.2.1 Population and Population Trends
Massachusetts is a small, densely populated and growing state. Between 2000 and 2010, the
population of Massachusetts increased by 3.1 percent, or nearly 200,000 people (U.S. Census
2000, 2010). Although in recent years it has been the fastest growing state in the Northeast
(UMDI, 2015), the state has a relatively slow growth rate compared to the national growth rate of
9.7 percent between 2000 and 2010. According to the most recent American Community Survey
5-Year Estimates, the population of the state was 6,742,143 (ACS, 2012-2016). Middlesex
County is the most populous county in the state, accounting for approximately 23 percent of the
estimated population in 2016, while Dukes and Nantucket Counties comprise less than 1 percent
of the population. The statewide density is approximately 864 people per square mile, and ranges
from 101 people per square mile in Franklin County to 13,180 people per square mile in Suffolk
County (see Table 2-4).
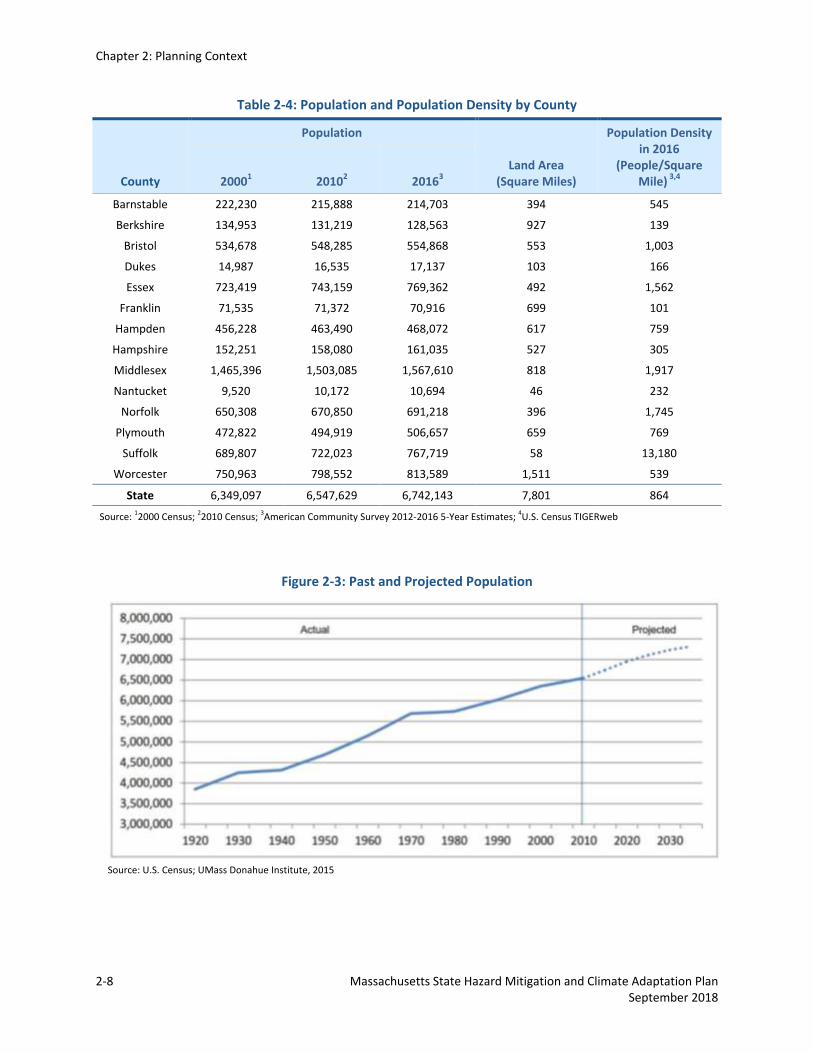
Local, regional, and statewide populations in Massachusetts were prepared by the University of
Massachusetts Donahue Institute in 2015. The projected statewide population from 2015 through
2035 is displayed on Figure 2-3. According to these projections, the state’s population is
Chapter 2: Planning Context
2-8 Massachusetts State Hazard Mitigation and Climate Adaptation Plan September 2018
Table 2-4: Population and Population Density by County
County
Population
Land Area (Square Miles)
Population Density in 2016
(People/Square Mile) 3,4 20001 20102 20163
Barnstable 222,230 215,888 214,703 394 545
Berkshire 134,953 131,219 128,563 927 139
Bristol 534,678 548,285 554,868 553 1,003
Dukes 14,987 16,535 17,137 103 166
Essex 723,419 743,159 769,362 492 1,562
Franklin 71,535 71,372 70,916 699 101
Hampden 456,228 463,490 468,072 617 759
Hampshire 152,251 158,080 161,035 527 305
Middlesex 1,465,396 1,503,085 1,567,610 818 1,917
Nantucket 9,520 10,172 10,694 46 232
Norfolk 650,308 670,850 691,218 396 1,745
Plymouth 472,822 494,919 506,657 659 769
Suffolk 689,807 722,023 767,719 58 13,180
Worcester 750,963 798,552 813,589 1,511 539
State 6,349,097 6,547,629 6,742,143 7,801 864
Source: 12000 Census;
22010 Census;
3American Community Survey 2012-2016 5-Year Estimates;
4U.S. Census TIGERweb
Figure 2-3: Past and Projected Population
Source: U.S. Census; UMass Donahue Institute, 2015
Chapter 2: Planning Context
Massachusetts State Hazard Mitigation and Climate Adaptation Plan 2-9 September 2018
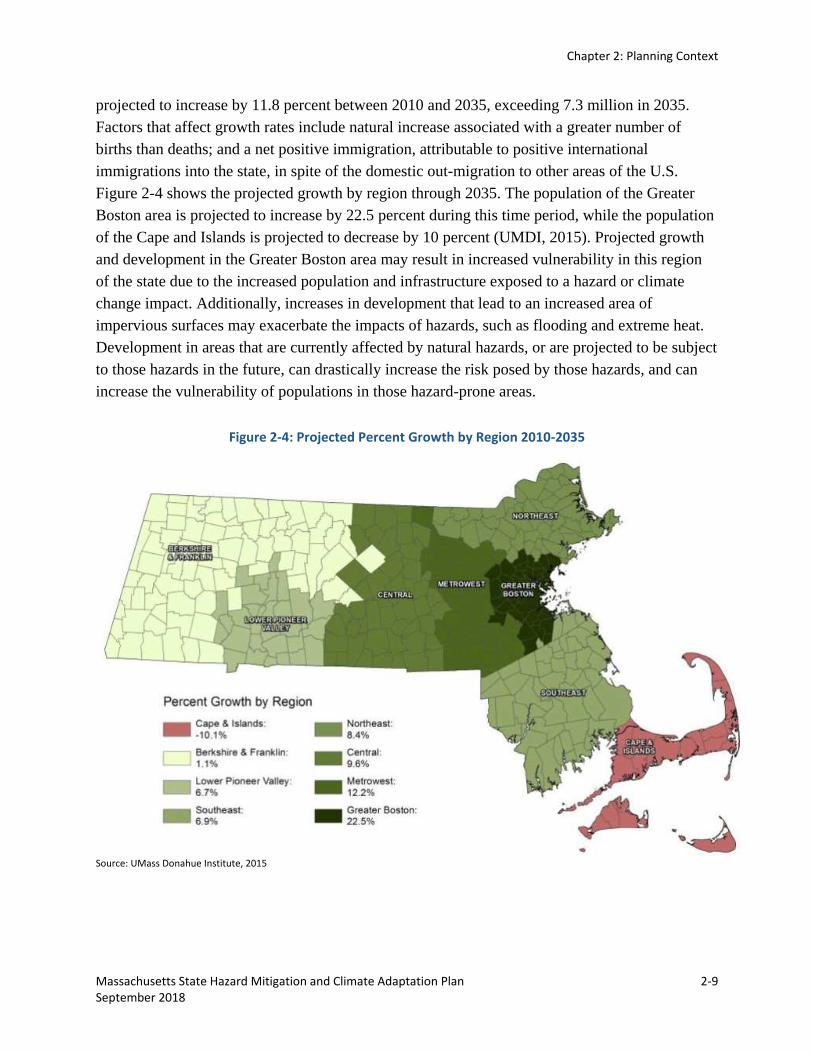
projected to increase by 11.8 percent between 2010 and 2035, exceeding 7.3 million in 2035.
Factors that affect growth rates include natural increase associated with a greater number of
births than deaths; and a net positive immigration, attributable to positive international
immigrations into the state, in spite of the domestic out-migration to other areas of the U.S.
Figure 2-4 shows the projected growth by region through 2035. The population of the Greater
Boston area is projected to increase by 22.5 percent during this time period, while the population
of the Cape and Islands is projected to decrease by 10 percent (UMDI, 2015). Projected growth
and development in the Greater Boston area may result in increased vulnerability in this region
of the state due to the increased population and infrastructure exposed to a hazard or climate
change impact. Additionally, increases in development that lead to an increased area of
impervious surfaces may exacerbate the impacts of hazards, such as flooding and extreme heat.
Development in areas that are currently affected by natural hazards, or are projected to be subject
to those hazards in the future, can drastically increase the risk posed by those hazards, and can
increase the vulnerability of populations in those hazard-prone areas.
Figure 2-4: Projected Percent Growth by Region 2010-2035
Source: UMass Donahue Institute, 2015
Chapter 2: Planning Context
2-10 Massachusetts State Hazard Mitigation and Climate Adaptation Plan September 2018
A gradual slow-down in growth is projected in the 2020s and 2030s due to the state’s aging
population, which impacts both birth and death rates. The effect of aging will be more
pronounced in Massachusetts because the state already has an older population than the national
average. (UMDI, 2015). By 2035, the percentage of the population aged 65 and over is projected
to account for 23.0 percent of the state’s population, compared to 13.8 percent in 2010. Because
the population aged 65 and over is considered to be more vulnerable to natural hazards and the
secondary impacts of natural hazards, an increase in this population has implications for hazard
mitigation ranging from evaluation management and assistance to the availability of cooling
centers. This will likely increase the burden on emergency responders, hospitals, and
communities assisting this population.
VULNERABLE POPULATIONS
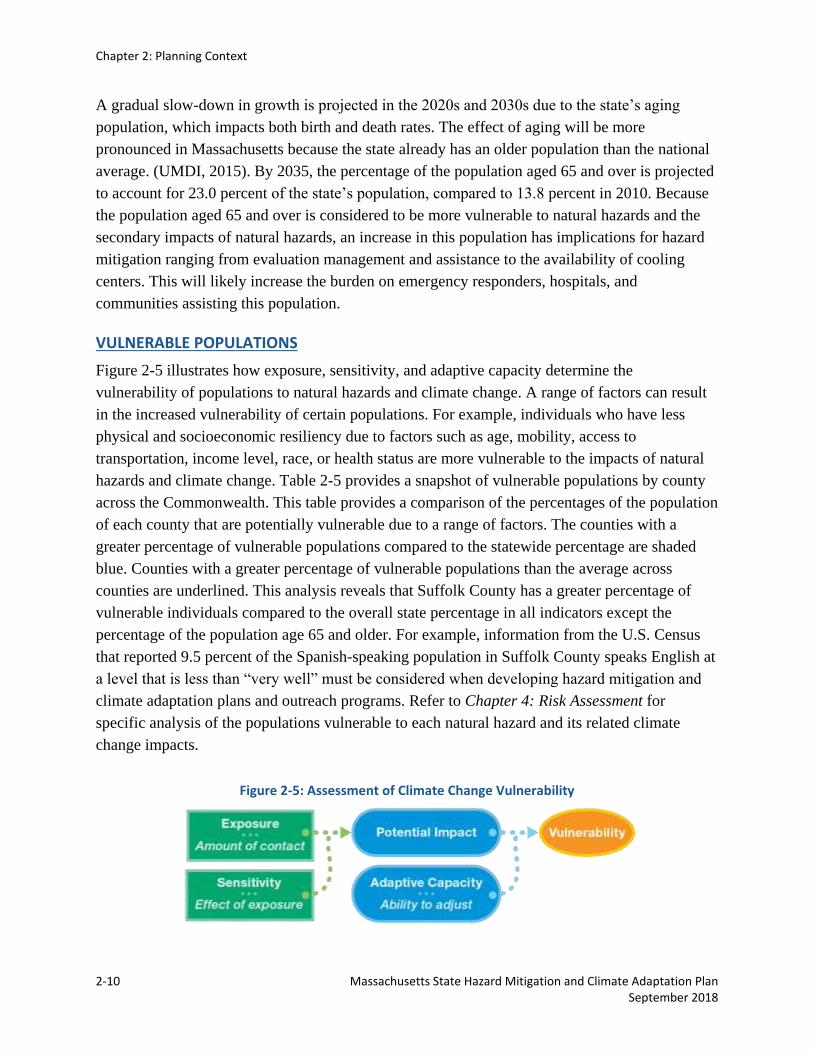
Figure 2-5 illustrates how exposure, sensitivity, and adaptive capacity determine the
vulnerability of populations to natural hazards and climate change. A range of factors can result
in the increased vulnerability of certain populations. For example, individuals who have less
physical and socioeconomic resiliency due to factors such as age, mobility, access to
transportation, income level, race, or health status are more vulnerable to the impacts of natural
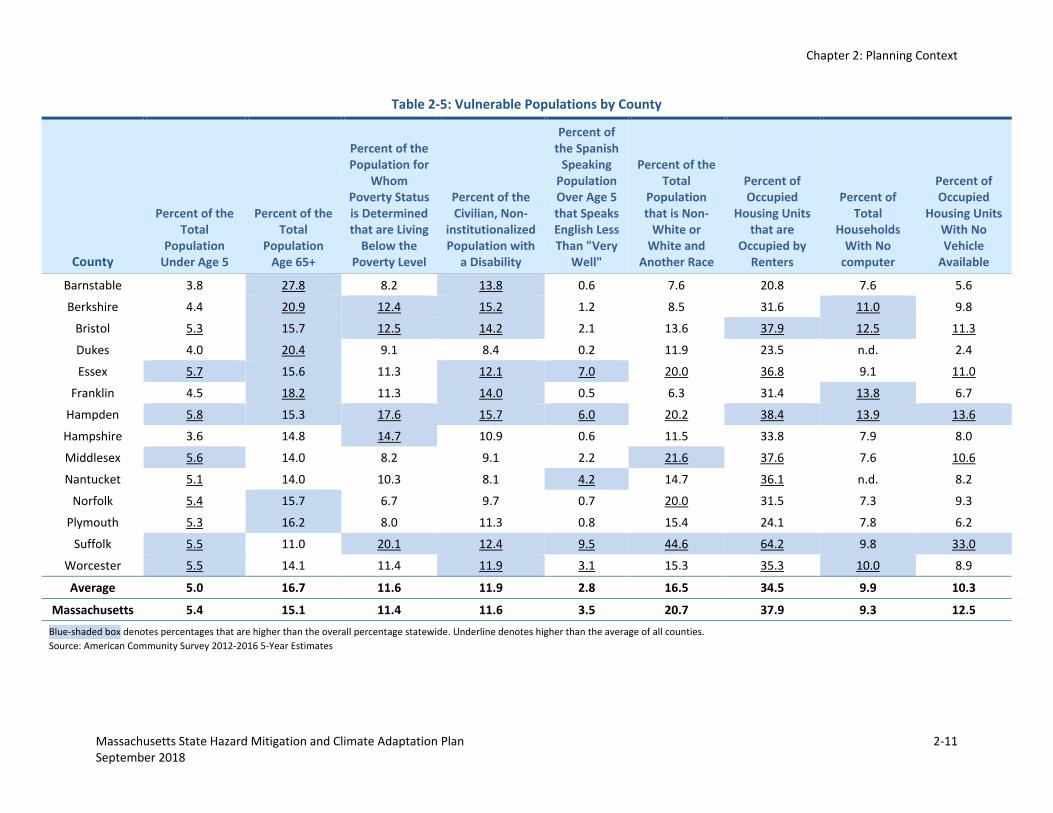
hazards and climate change. Table 2-5 provides a snapshot of vulnerable populations by county
across the Commonwealth. This table provides a comparison of the percentages of the population
of each county that are potentially vulnerable due to a range of factors. The counties with a
greater percentage of vulnerable populations compared to the statewide percentage are shaded
blue. Counties with a greater percentage of vulnerable populations than the average across
counties are underlined. This analysis reveals that Suffolk County has a greater percentage of
vulnerable individuals compared to the overall state percentage in all indicators except the
percentage of the population age 65 and older. For example, information from the U.S. Census
that reported 9.5 percent of the Spanish-speaking population in Suffolk County speaks English at
a level that is less than “very well” must be considered when developing hazard mitigation and
climate adaptation plans and outreach programs. Refer to Chapter 4: Risk Assessment for
specific analysis of the populations vulnerable to each natural hazard and its related climate
change impacts.
Figure 2-5: Assessment of Climate Change Vulnerability
Chapter 2: Planning Context
Massachusetts State Hazard Mitigation and Climate Adaptation Plan 2-11 September 2018
Table 2-5: Vulnerable Populations by County
County
Percent of the Total
Population Under Age 5
Percent of the Total
Population Age 65+
Percent of the Population for
Whom Poverty Status is Determined that are Living
Below the Poverty Level
Percent of the Civilian, Non-
institutionalized Population with
a Disability
Percent of the Spanish
Speaking Population Over Age 5 that Speaks English Less Than "Very
Well"
Percent of the Total
Population that is Non-
White or White and
Another Race
Percent of Occupied
Housing Units that are
Occupied by Renters
Percent of Total
Households With No
computer
Percent of Occupied
Housing Units With No Vehicle
Available
Barnstable 3.8 27.8 8.2 13.8 0.6 7.6 20.8 7.6 5.6
Berkshire 4.4 20.9 12.4 15.2 1.2 8.5 31.6 11.0 9.8
Bristol 5.3 15.7 12.5 14.2 2.1 13.6 37.9 12.5 11.3
Dukes 4.0 20.4 9.1 8.4 0.2 11.9 23.5 n.d. 2.4
Essex 5.7 15.6 11.3 12.1 7.0 20.0 36.8 9.1 11.0
Franklin 4.5 18.2 11.3 14.0 0.5 6.3 31.4 13.8 6.7
Hampden 5.8 15.3 17.6 15.7 6.0 20.2 38.4 13.9 13.6
Hampshire 3.6 14.8 14.7 10.9 0.6 11.5 33.8 7.9 8.0
Middlesex 5.6 14.0 8.2 9.1 2.2 21.6 37.6 7.6 10.6
Nantucket 5.1 14.0 10.3 8.1 4.2 14.7 36.1 n.d. 8.2
Norfolk 5.4 15.7 6.7 9.7 0.7 20.0 31.5 7.3 9.3
Plymouth 5.3 16.2 8.0 11.3 0.8 15.4 24.1 7.8 6.2
Suffolk 5.5 11.0 20.1 12.4 9.5 44.6 64.2 9.8 33.0
Worcester 5.5 14.1 11.4 11.9 3.1 15.3 35.3 10.0 8.9
Average 5.0 16.7 11.6 11.9 2.8 16.5 34.5 9.9 10.3
Massachusetts 5.4 15.1 11.4 11.6 3.5 20.7 37.9 9.3 12.5
Blue-shaded box denotes percentages that are higher than the overall percentage statewide. Underline denotes higher than the average of all counties.
Source: American Community Survey 2012-2016 5-Year Estimates
Chapter 2: Planning Context
2-12 Massachusetts State Hazard Mitigation and Climate Adaptation Plan September 2018
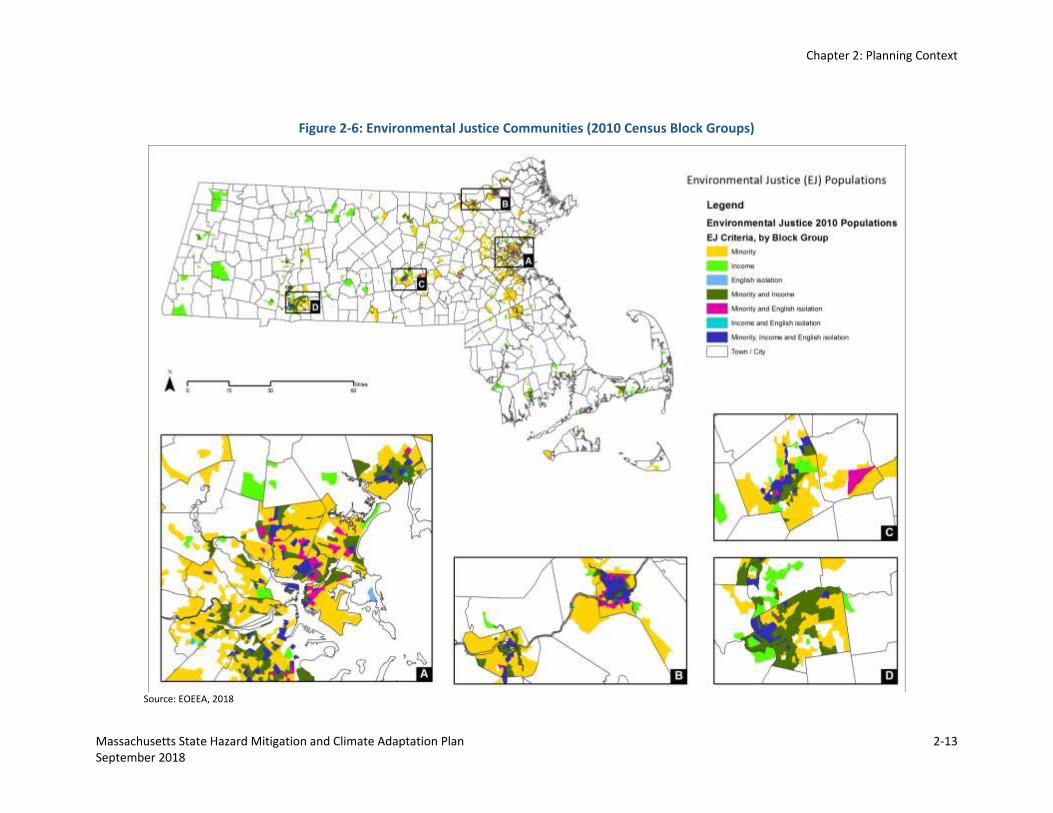
Vulnerable populations include Environmental Justice (EJ) populations. In Massachusetts, EJ
populations are determined by identifying all block groups from the 2010 Census that meet any
of the following criteria:
Annual median household income is equal to or less than 65 percent of the statewide median
($62,072 in 2010); or
25 percent or more of the residents identify as a race other than white; or
25 percent or more of households have no one over the age of 14 who speaks English only,
or very well (EOEEA, 2018).
EJ communities are vulnerable to hazards due to a range of factors, which may include lack of
personal transportation or access to resources, preexisting health conditions, or difficulty
translating and understanding emergency alerts or procedures.
There is a total of 1,838 EJ block groups in 138 municipalities in Massachusetts. The population
in these block groups accounts for nearly half of the population in these municipalities. In
Aquinnah, Chelsea, Everett, Lawrence, and Randolph, 100 percent of the block groups are EJ
communities. Many EJ block groups meet more than one EJ criteria, and 38 EJ communities
meet all three (income, minority population, English isolation). Figure 2-6 displays EJ
communities (EOEEA, 2018).
Refer to Chapter 4 for a discussion of the populations vulnerable to each hazard and its related
climate change impacts.
Chapter 2: Planning Context
Massachusetts State Hazard Mitigation and Climate Adaptation Plan 2-13 September 2018
Figure 2-6: Environmental Justice Communities (2010 Census Block Groups)
Source: EOEEA, 2018

Chapter 2: Planning Context
2-14 Massachusetts State Hazard Mitigation and Climate Adaptation Plan September 2018
2.2.2 Housing and Development Highlights
HOUSING
Between 2000 and 2010, the total number of housing units in the state increased by
186,265 units: from 2,621,989 to 2,808,254 units. The average annual increase in housing units
during this time was 0.71 percent. The American Community Survey 2012-2016 5-Year
Estimates reports that the state has an estimated 2,836,658 units, an increase of approximately
28,400 units from 2010 at a rate of 0.1 percent per year (U.S. Census, 2000; 2010).
Nearly 10 percent of housing units in the state are vacant (see Table 2-6). The high vacancy rates
for Barnstable, Dukes, and Nantucket Counties shown in Table 2-6 may reflect the high seasonal
populations. Owner-occupancy rates range from a low of 35.8 percent in Suffolk County to a
high of 79.2 percent in Barnstable County. Conversely, Suffolk County has the highest
percentage of renter-occupied housing units in the state (see Table 2-6).
Table 2-6: Housing Characteristics by County
County Total Housing
Units
Percent of Housing Units
that are Vacant
Total Occupied
Housing Units
Percent of Housing Units
that are Owner Occupied
Percent of Housing Units that are
Renter Occupied
Barnstable 161,632 41.6 94,351 79.2 20.8
Berkshire 68,391 19.8 54,854 68.4 31.6
Bristol 231,247 7.9 212,933 62.1 37.9
Dukes 17,536 65.0 6,134 76.5 23.5
Essex 308,459 6.5 288,291 63.2 36.8
Franklin 33,684 9.8 30,389 68.6 31.4
Hampden 192,032 7.7 177,153 61.6 38.4
Hampshire 62,915 7.1 58,448 66.2 33.8
Middlesex 619,399 5.1 587,735 62.4 37.6
Nantucket 11,844 67.6 3,836 63.9 36.1
Norfolk 273,280 4.8 260,061 68.5 31.5
Plymouth 202,564 10.0 182,252 75.9 24.1
Suffolk 324,390 7.6 299,658 35.8 64.2
Worcester 329,285 8.0 302,794 64.7 35.3
Massachusetts 2,836,658 9.8 2,558,889 60.9 37.9
Source: American Community Survey 2012-2016 5-Year Estimates
Chapter 2: Planning Context
Massachusetts State Hazard Mitigation and Climate Adaptation Plan 2-15 September 2018
STATEWIDE INITIATIVES, ACCOMPLISHMENTS, AND TRENDS THAT SHAPE THE COMMONWEALTH’S LANDSCAPE
Policies, initiatives, and programs influence development trends and patterns. Targeted economic
development, housing programs, transportation improvements, coastal land use planning, and
numerous other planning efforts shape the physical landscape of the Commonwealth and
influence residential settlement. Examples of statewide initiatives and accomplishments are
briefly described in this section. This section is not intended to serve as a comprehensive review
of all development initiatives, but to highlight trends and initiatives that have the potential to
influence the vulnerability of people, the built environment, and the natural environment to
hazards discussed in this SHMCAP.
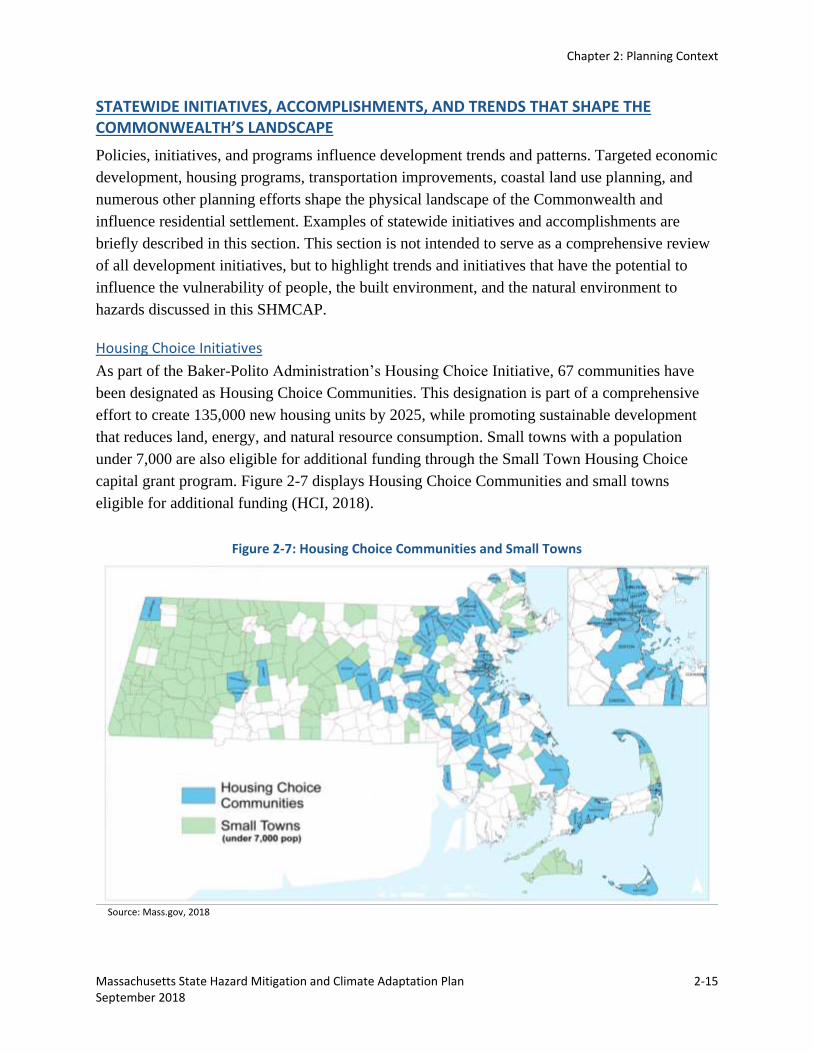
Housing Choice Initiatives
As part of the Baker-Polito Administration’s Housing Choice Initiative, 67 communities have
been designated as Housing Choice Communities. This designation is part of a comprehensive
effort to create 135,000 new housing units by 2025, while promoting sustainable development
that reduces land, energy, and natural resource consumption. Small towns with a population
under 7,000 are also eligible for additional funding through the Small Town Housing Choice
capital grant program. Figure 2-7 displays Housing Choice Communities and small towns
eligible for additional funding (HCI, 2018).
Figure 2-7: Housing Choice Communities and Small Towns
Source: Mass.gov, 2018
Chapter 2: Planning Context
2-16 Massachusetts State Hazard Mitigation and Climate Adaptation Plan September 2018
Transformative Development Initiative Districts
In 2014, the Commonwealth’s economic development and finance authority, MassDevelopment,
launched the Transformative Development Initiative (TDI), a place-based development program
for Gateway Cities designed to be a tool for economic development. Ten cities were selected for
a 3-year TDI pilot program in 2014. Since MassDevelopment initiated a TDI Fellow program in
2015, 11 fellows have been placed in communities to provide assistance. In May of 2018,
additional TDI Districts were announced, including Chelsea, Fitchburg, Lawrence, and
Worcester; and existing TDI districts in Brockton, Holyoke, Lynn, New Bedford, Pittsfield, and
Springfield were extended (MassDevelopment, 2018).
Shoreline Change Project
The coast of Massachusetts continues to be subject to intense development. To assist coastal
managers, shorefront landowners, and potential property owners with making informed decisions
about coastal land use and development, the Office of Coastal Zone Management (CZM)
initiated the Shoreline Change Project in 1989. CZM delineated and mapped shoreline trends
from the mid-1800s to 2009, and released updated shoreline data in 2013. This shoreline analysis
found that the highest statistically significant long-term (mid-1900s to the early 2000s) rates of
erosion occurred on Nantucket, Outer Cape Cod, and Martha’s Vineyard. The highest
statistically significant rates of erosion over the short term (between 1970 and 1982 to the early
2000s) occurred on the North Shore, Outer Cape Cod, and Nantucket. The Shoreline Change
Project presents shoreline change rates at 50-meter intervals along ocean-facing sections of the
coast (USGS, 2013). Updated rates of change will be released in 2018, and this information can
be used to understand historical and recent migration of shorelines, hot spots of erosion, and the
influence of coastal structures (e.g., seawalls and revetments), and to guide smart development
(CZM, 2018a).
Port and Harbor Planning Program
As part of the CZM Port and Harbor Planning Program, Massachusetts has 10 Designated Port
Areas (DPAs): Gloucester Inner Harbor, Salem Harbor, Lynn, Mystic River, Chelsea Creek, East
Boston, South Boston, Weymouth Fore River, New Bedford-Fairhaven, and Mount Hope Bay.
DPAs have been designated to promote and protect water-dependent industrial uses. CZM works
with municipalities to take a comprehensive approach to planning for DPAs through a DPA
Master Plan, which is one component of a Municipal Harbor Plan. The primary goals of Port and
Harbor Planning are to help ensure that waterfront areas in the Commonwealth grow in a safe,
environmentally sound, and economically prosperous manner; and to balance potentially
competing uses in a port or harbor (CZM, 2018b).
Chapter 2: Planning Context
Massachusetts State Hazard Mitigation and Climate Adaptation Plan 2-17 September 2018
Land Conservation Trends
As of May 2018, almost 26 percent of the Commonwealth’s 5 million acres of land were
protected as conservation or parkland. Between 2007 and 2018, more than 162,479 acres
(254 square miles) of land were permanently conserved. For a sense of scale, Suffolk County is
58 square miles.
Community Compact Initiative
In 2015, Governor Baker established the Community Compact Initiative to give cities and towns
the chance to make needed improvements in a range of areas through collaboration with and
support from the Commonwealth. Communities that participate choose one or more best practices,
which include energy and environment, housing and economic development, transportation and
citizens’ safety, and regionalization/shared services.
Massachusetts Downtown Initiative
The Department of Housing and Community Development provides a range of services and
assistance to communities seeking help on how to revitalize their downtowns through the
Massachusetts Downtown Initiative. In 2016, 13 communities were awarded technical assistance
grants for engaging in revitalization in areas that included design, business improvement district
management, economics of downtown, parking, small business support, and wayfinding. The 2016
grantees were: Auburn, Holliston, Hudson, Middleborough, Saugus, Stoughton, Beverly, Essex,
Sturbridge, Stoneham, Agawam, Wellesley, and Woburn.
Last Mile Infrastructure Grant Program
The Last Mile Infrastructure Grant Program, administered by the Executive Office of Housing
and Economic Development, aims to increase access to broadband in communities that are
unserved or underserved. The program has provided grants since its inception in 2015. These
grants have resulted in increased access to the internet and to information about hazards and
emergency response (EOHED, 2018).
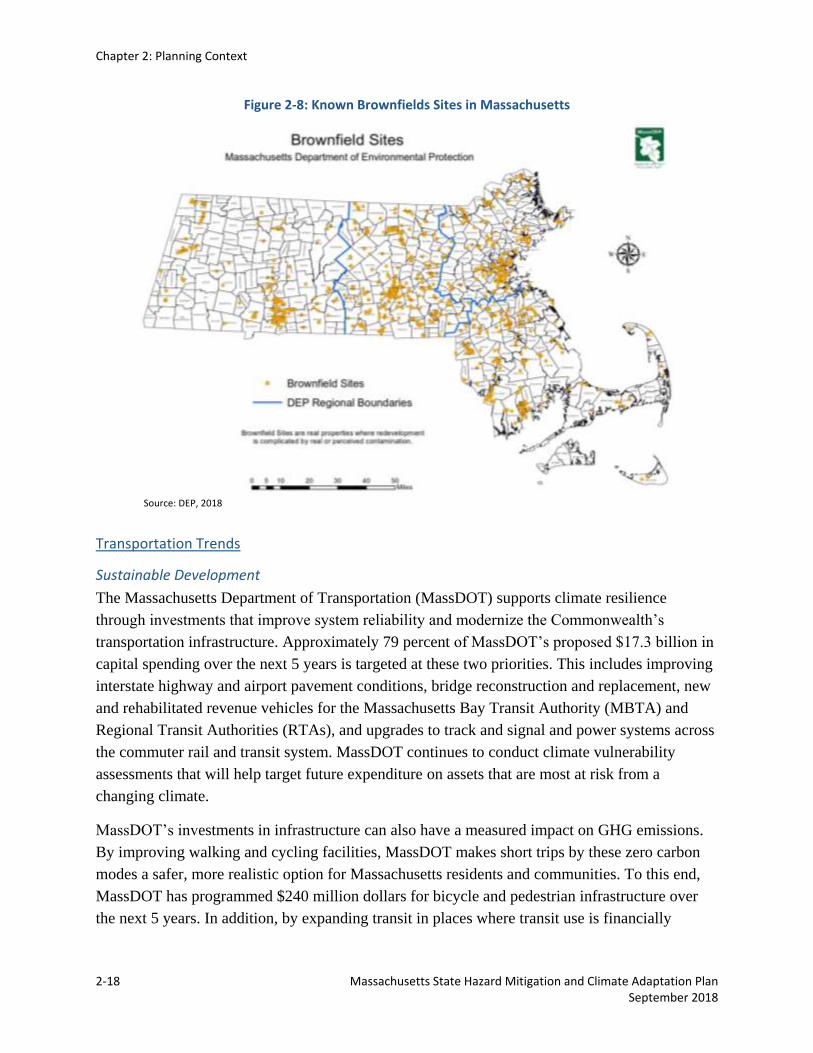
Brownfields Cleanup and Redevelopment
Since 1993, more than 35,000 brownfields sites have been cleaned up in Massachusetts. As of
January 2017, the Department of Environmental Protection (DEP) brownfields list identifies
more than 1,000 sites across the state (displayed on Figure 2-8). The presence of contamination
on these sites may exacerbate the impacts of natural hazards.
Chapter 2: Planning Context
2-18 Massachusetts State Hazard Mitigation and Climate Adaptation Plan September 2018
Figure 2-8: Known Brownfields Sites in Massachusetts
Source: DEP, 2018
Transportation Trends
Sustainable Development
The Massachusetts Department of Transportation (MassDOT) supports climate resilience
through investments that improve system reliability and modernize the Commonwealth’s
transportation infrastructure. Approximately 79 percent of MassDOT’s proposed $17.3 billion in
capital spending over the next 5 years is targeted at these two priorities. This includes improving
interstate highway and airport pavement conditions, bridge reconstruction and replacement, new
and rehabilitated revenue vehicles for the Massachusetts Bay Transit Authority (MBTA) and
Regional Transit Authorities (RTAs), and upgrades to track and signal and power systems across
the commuter rail and transit system. MassDOT continues to conduct climate vulnerability
assessments that will help target future expenditure on assets that are most at risk from a
changing climate.
MassDOT’s investments in infrastructure can also have a measured impact on GHG emissions.
By improving walking and cycling facilities, MassDOT makes short trips by these zero carbon
modes a safer, more realistic option for Massachusetts residents and communities. To this end,
MassDOT has programmed $240 million dollars for bicycle and pedestrian infrastructure over
the next 5 years. In addition, by expanding transit in places where transit use is financially
Chapter 2: Planning Context
Massachusetts State Hazard Mitigation and Climate Adaptation Plan 2-19 September 2018
sustainable and where transit-oriented development will be encouraged, MassDOT can support
land use change that makes driving less necessary.
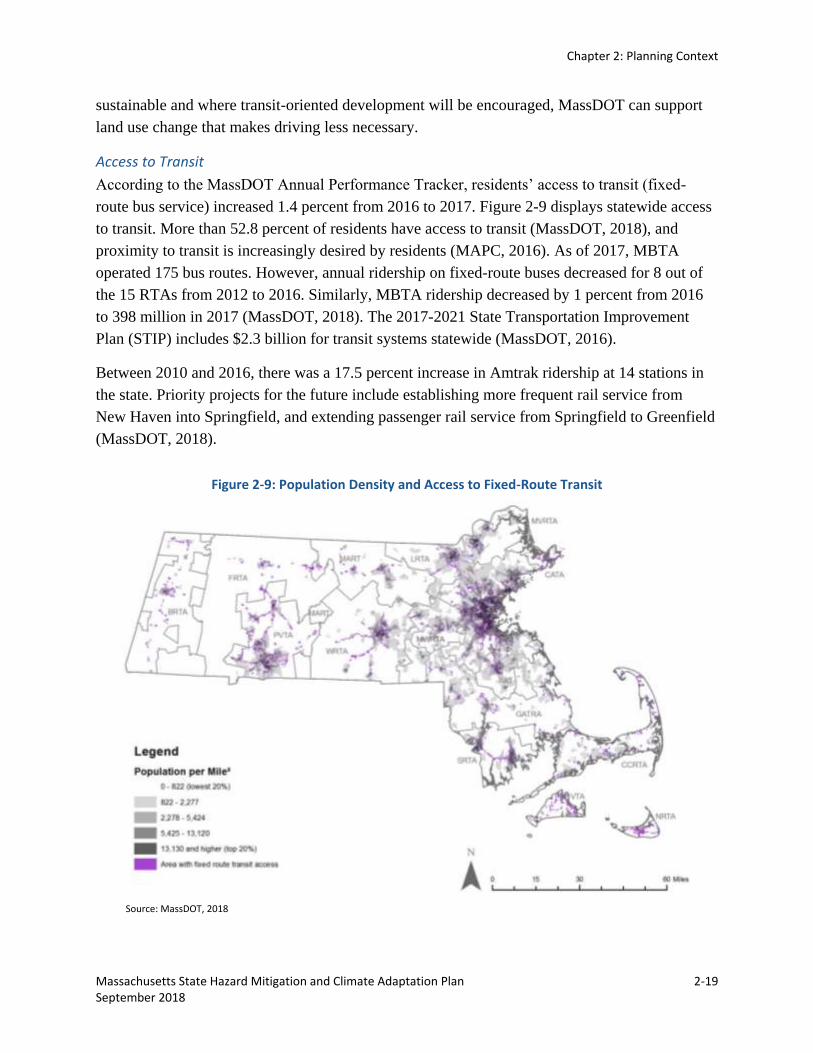
Access to Transit
According to the MassDOT Annual Performance Tracker, residents’ access to transit (fixed-
route bus service) increased 1.4 percent from 2016 to 2017. Figure 2-9 displays statewide access
to transit. More than 52.8 percent of residents have access to transit (MassDOT, 2018), and
proximity to transit is increasingly desired by residents (MAPC, 2016). As of 2017, MBTA
operated 175 bus routes. However, annual ridership on fixed-route buses decreased for 8 out of
the 15 RTAs from 2012 to 2016. Similarly, MBTA ridership decreased by 1 percent from 2016
to 398 million in 2017 (MassDOT, 2018). The 2017-2021 State Transportation Improvement
Plan (STIP) includes $2.3 billion for transit systems statewide (MassDOT, 2016).
Between 2010 and 2016, there was a 17.5 percent increase in Amtrak ridership at 14 stations in
the state. Priority projects for the future include establishing more frequent rail service from
New Haven into Springfield, and extending passenger rail service from Springfield to Greenfield
(MassDOT, 2018).
Figure 2-9: Population Density and Access to Fixed-Route Transit
Source: MassDOT, 2018
Chapter 2: Planning Context
2-20 Massachusetts State Hazard Mitigation and Climate Adaptation Plan September 2018
Bridge Improvements
Nearly 9 percent of Massachusetts bridges (more than 400) are considered structurally deficient
(MAPC, 2018). A total of $760 million has been allocated for improvements to bridge health in
the STIP (MassDOT, 2016). MassDOT owns 3,491 bridges in the state (MassDOT, 2018).
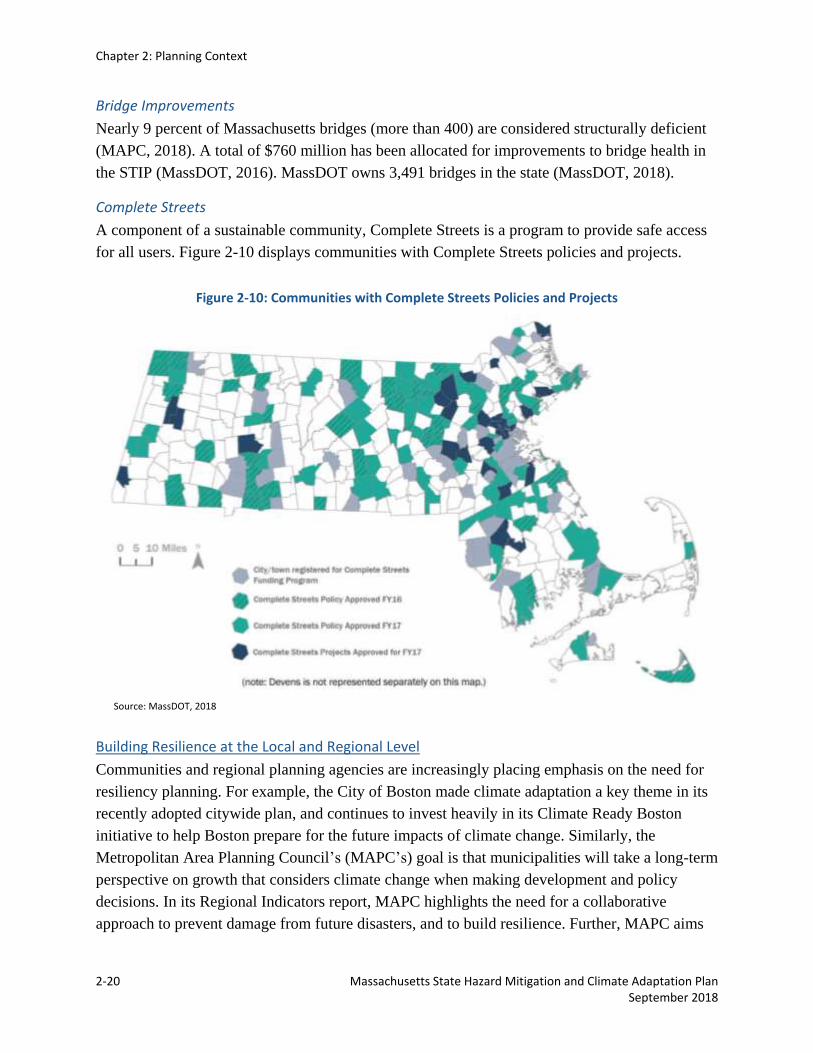
Complete Streets
A component of a sustainable community, Complete Streets is a program to provide safe access
for all users. Figure 2-10 displays communities with Complete Streets policies and projects.
Figure 2-10: Communities with Complete Streets Policies and Projects
Source: MassDOT, 2018
Building Resilience at the Local and Regional Level
Communities and regional planning agencies are increasingly placing emphasis on the need for
resiliency planning. For example, the City of Boston made climate adaptation a key theme in its
recently adopted citywide plan, and continues to invest heavily in its Climate Ready Boston
initiative to help Boston prepare for the future impacts of climate change. Similarly, the
Metropolitan Area Planning Council’s (MAPC’s) goal is that municipalities will take a long-term
perspective on growth that considers climate change when making development and policy
decisions. In its Regional Indicators report, MAPC highlights the need for a collaborative
approach to prevent damage from future disasters, and to build resilience. Further, MAPC aims
Chapter 2: Planning Context
Massachusetts State Hazard Mitigation and Climate Adaptation Plan 2-21 September 2018
to mitigate hazards by having no structurally deficient dams and limited new growth in
floodplains (MAPC, 2008).
The Commonwealth provides technical assistance and funding to municipalities for resiliency
planning through various programs, including the CZM Coastal Resilience Grant Program and
the Municipal Vulnerability Preparedness (MVP) Program. The CZM Coastal Resilience Grant
Program provides the 78 coastal communities with funding to advance local efforts to address
coastal flooding, erosion, and sea level rise through the StormSmart Coasts Program. As of June
2018, there are 156 communities participating in the MVP Program that have completed or are in
the process of completing climate change vulnerability assessments. Refer to Chapter: 10
Coordination of Local Hazard Mitigation and Climate Adaptation Planning for additional
information about this program.
2.3 Climate Change Projections
2.3.1 Resilient MA Climate Change Clearinghouse for the Commonwealth
In 2017, the Commonwealth launched the
Massachusetts Climate Change Clearinghouse
(resilient MA), an online gateway for policymakers,
local planners, and the public to identify and access climate data, maps, websites, tools, and
documents on climate change adaptation and mitigation. The goal of resilient MA is to support
scientifically sound and cost-effective decision-making, and to enable users to plan and prepare
for climate change impacts.
The resilient MA site provides access to resources relevant to adaptation and building resiliency
for climate change in Massachusetts. This includes information about GHG emissions and
atmospheric concentrations, projected temperature and precipitation changes, climate change
impacts such as sea level rise and extreme weather events, and other changes. It also catalogs
specific vulnerabilities, risks, and strategies for and across industry sectors (including
agriculture, forestry, local government, education, energy, recreation, and transportation) and for
local governance priorities, including public health, public safety/emergency management,
infrastructure, coastal zones, natural resources/habitats, and water resources.
The website’s target audiences are local planners, decision makers, and state agency staff. It is
intended to help decision makers identify vulnerable infrastructure, residential areas, and
ecosystems; evaluate the risks posed by climate change; and develop strategies and
implementation plans for their community. It is also a resource for policymakers, analysts,
scientists, planners, businesses, and the general public.
Chapter 2: Planning Context
2-22 Massachusetts State Hazard Mitigation and Climate Adaptation Plan September 2018
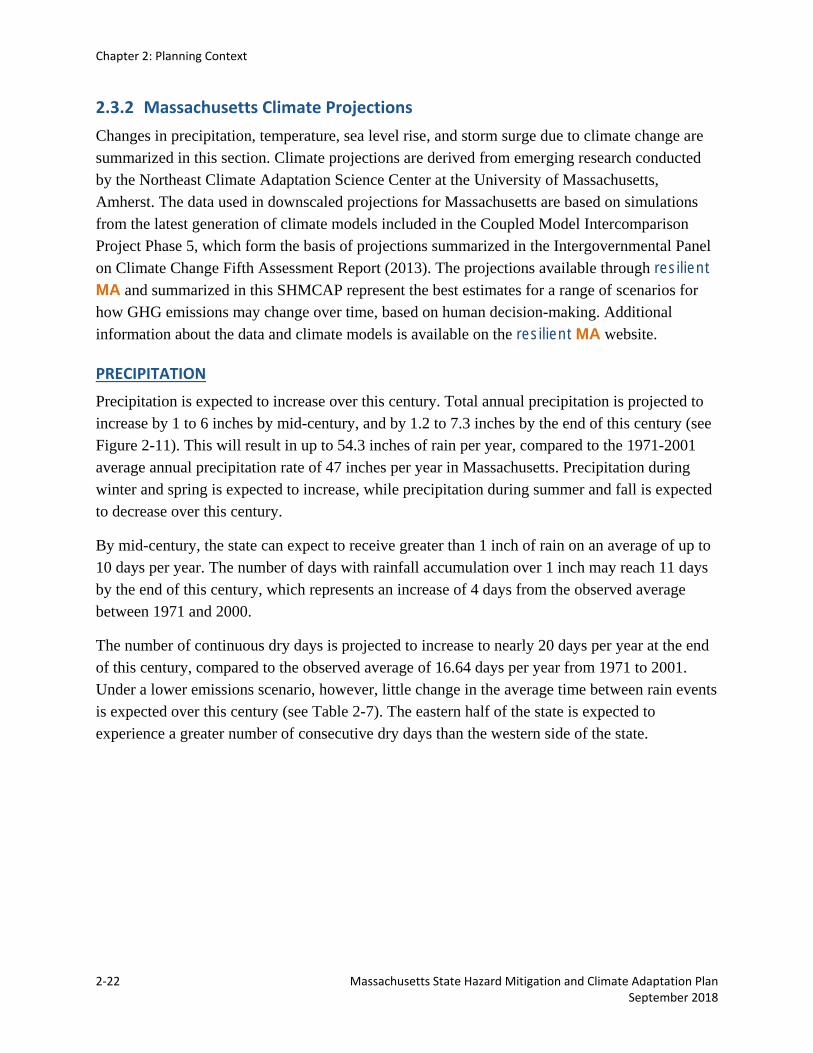
2.3.2 Massachusetts Climate Projections
Changes in precipitation, temperature, sea level rise, and storm surge due to climate change are
summarized in this section. Climate projections are derived from emerging research conducted
by the Northeast Climate Adaptation Science Center at the University of Massachusetts,
Amherst. The data used in downscaled projections for Massachusetts are based on simulations
from the latest generation of climate models included in the Coupled Model Intercomparison
Project Phase 5, which form the basis of projections summarized in the Intergovernmental Panel
on Climate Change Fifth Assessment Report (2013). The projections available through resilient
MA and summarized in this SHMCAP represent the best estimates for a range of scenarios for
how GHG emissions may change over time, based on human decision-making. Additional
information about the data and climate models is available on the resilient MA website.
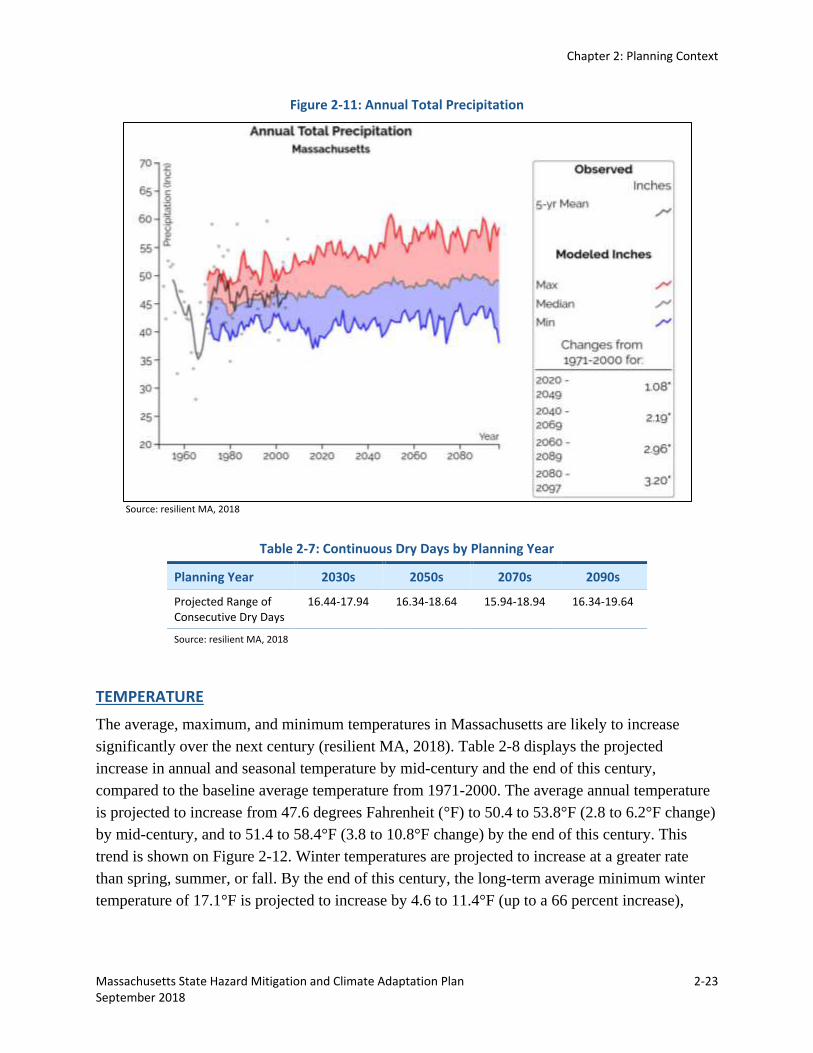
PRECIPITATION
Precipitation is expected to increase over this century. Total annual precipitation is projected to
increase by 1 to 6 inches by mid-century, and by 1.2 to 7.3 inches by the end of this century (see
Figure 2-11). This will result in up to 54.3 inches of rain per year, compared to the 1971-2001
average annual precipitation rate of 47 inches per year in Massachusetts. Precipitation during
winter and spring is expected to increase, while precipitation during summer and fall is expected
to decrease over this century.
By mid-century, the state can expect to receive greater than 1 inch of rain on an average of up to
10 days per year. The number of days with rainfall accumulation over 1 inch may reach 11 days
by the end of this century, which represents an increase of 4 days from the observed average
between 1971 and 2000.
The number of continuous dry days is projected to increase to nearly 20 days per year at the end
of this century, compared to the observed average of 16.64 days per year from 1971 to 2001.
Under a lower emissions scenario, however, little change in the average time between rain events
is expected over this century (see Table 2-7). The eastern half of the state is expected to
experience a greater number of consecutive dry days than the western side of the state.
Chapter 2: Planning Context
Massachusetts State Hazard Mitigation and Climate Adaptation Plan 2-23 September 2018
Figure 2-11: Annual Total Precipitation
Source: resilient MA, 2018
Table 2-7: Continuous Dry Days by Planning Year
Planning Year 2030s 2050s 2070s 2090s
Projected Range of Consecutive Dry Days
16.44-17.94 16.34-18.64 15.94-18.94 16.34-19.64
Source: resilient MA, 2018
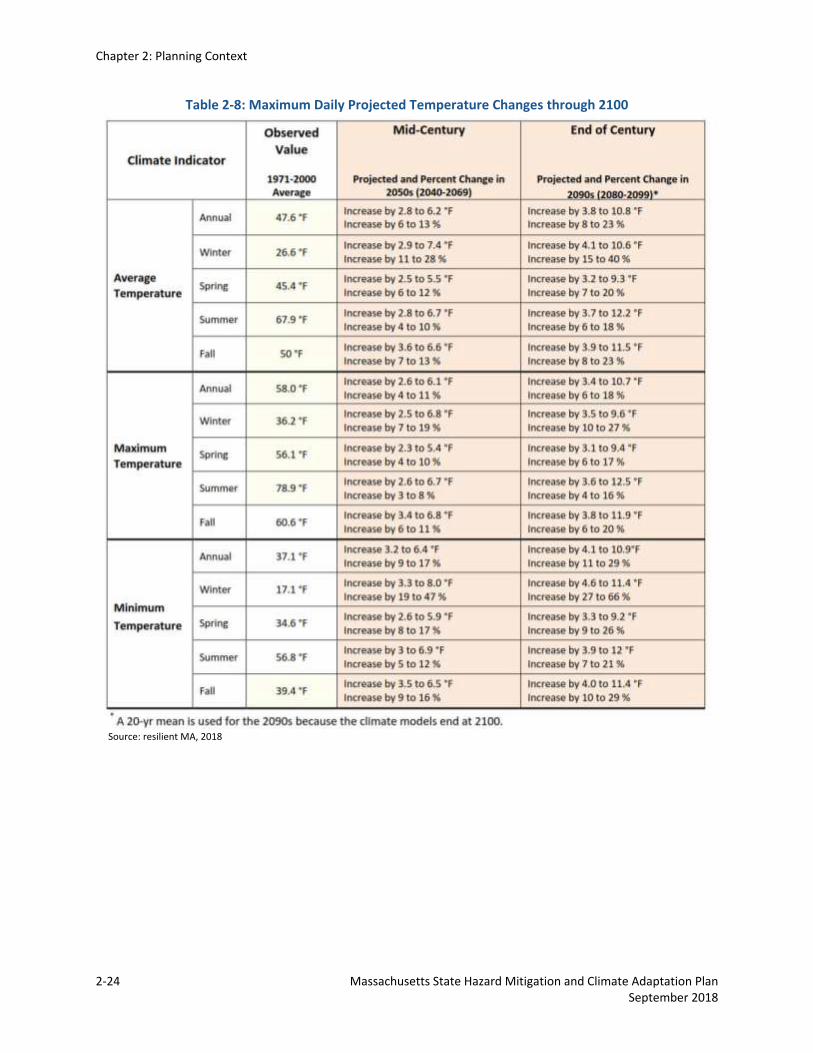
TEMPERATURE
The average, maximum, and minimum temperatures in Massachusetts are likely to increase
significantly over the next century (resilient MA, 2018). Table 2-8 displays the projected
increase in annual and seasonal temperature by mid-century and the end of this century,
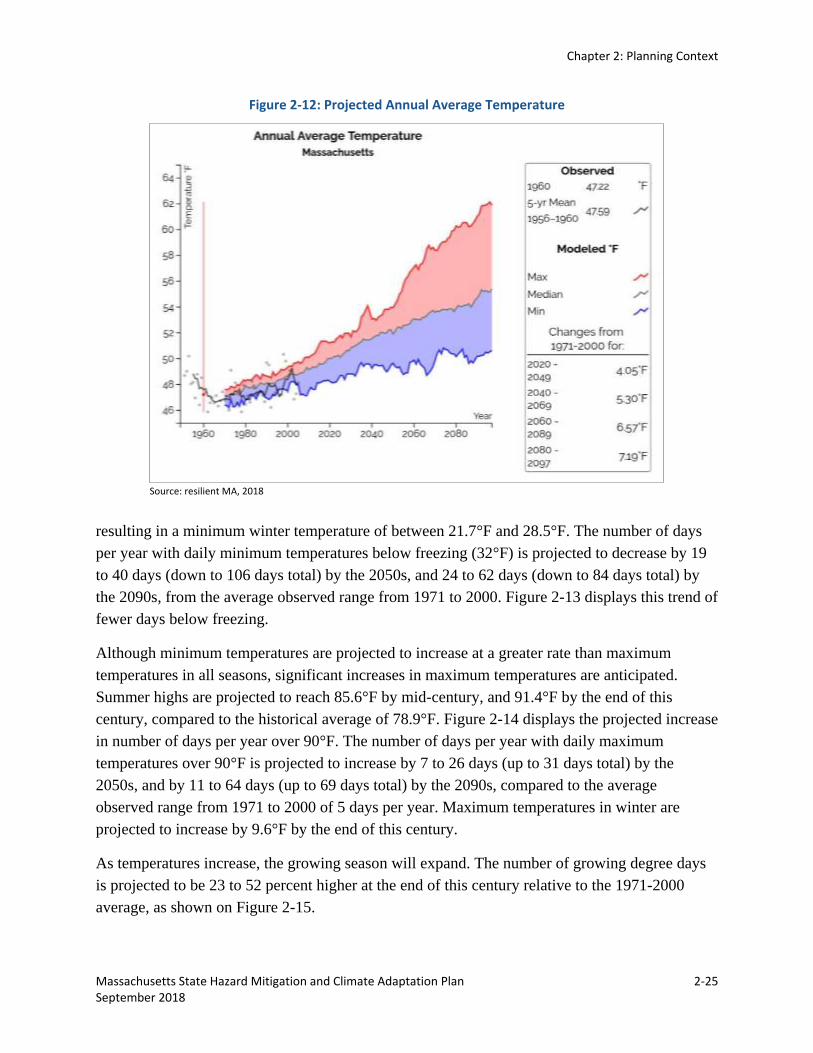
compared to the baseline average temperature from 1971-2000. The average annual temperature
is projected to increase from 47.6 degrees Fahrenheit (°F) to 50.4 to 53.8°F (2.8 to 6.2°F change)
by mid-century, and to 51.4 to 58.4°F (3.8 to 10.8°F change) by the end of this century. This
trend is shown on Figure 2-12. Winter temperatures are projected to increase at a greater rate
than spring, summer, or fall. By the end of this century, the long-term average minimum winter
temperature of 17.1°F is projected to increase by 4.6 to 11.4°F (up to a 66 percent increase),
Chapter 2: Planning Context
2-24 Massachusetts State Hazard Mitigation and Climate Adaptation Plan September 2018
Table 2-8: Maximum Daily Projected Temperature Changes through 2100
Source: resilient MA, 2018
Chapter 2: Planning Context
Massachusetts State Hazard Mitigation and Climate Adaptation Plan 2-25 September 2018
Figure 2-12: Projected Annual Average Temperature
Source: resilient MA, 2018
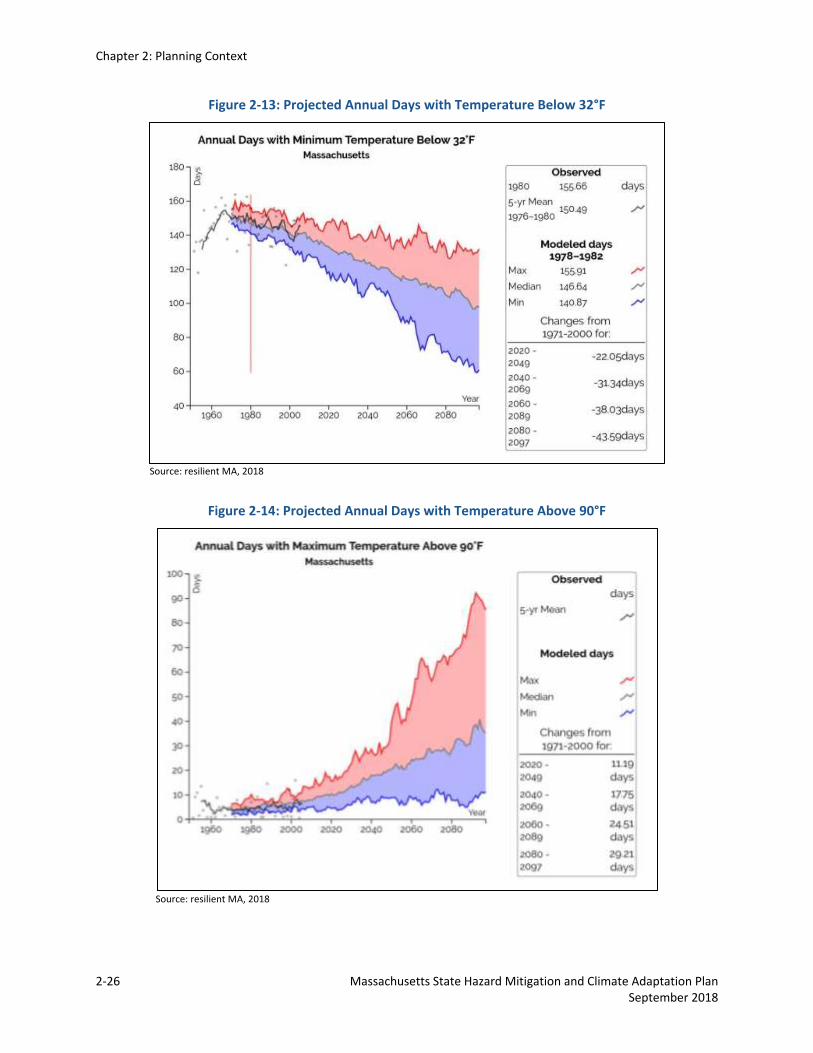
resulting in a minimum winter temperature of between 21.7°F and 28.5°F. The number of days
per year with daily minimum temperatures below freezing (32°F) is projected to decrease by 19
to 40 days (down to 106 days total) by the 2050s, and 24 to 62 days (down to 84 days total) by
the 2090s, from the average observed range from 1971 to 2000. Figure 2-13 displays this trend of
fewer days below freezing.
Although minimum temperatures are projected to increase at a greater rate than maximum
temperatures in all seasons, significant increases in maximum temperatures are anticipated.
Summer highs are projected to reach 85.6°F by mid-century, and 91.4°F by the end of this
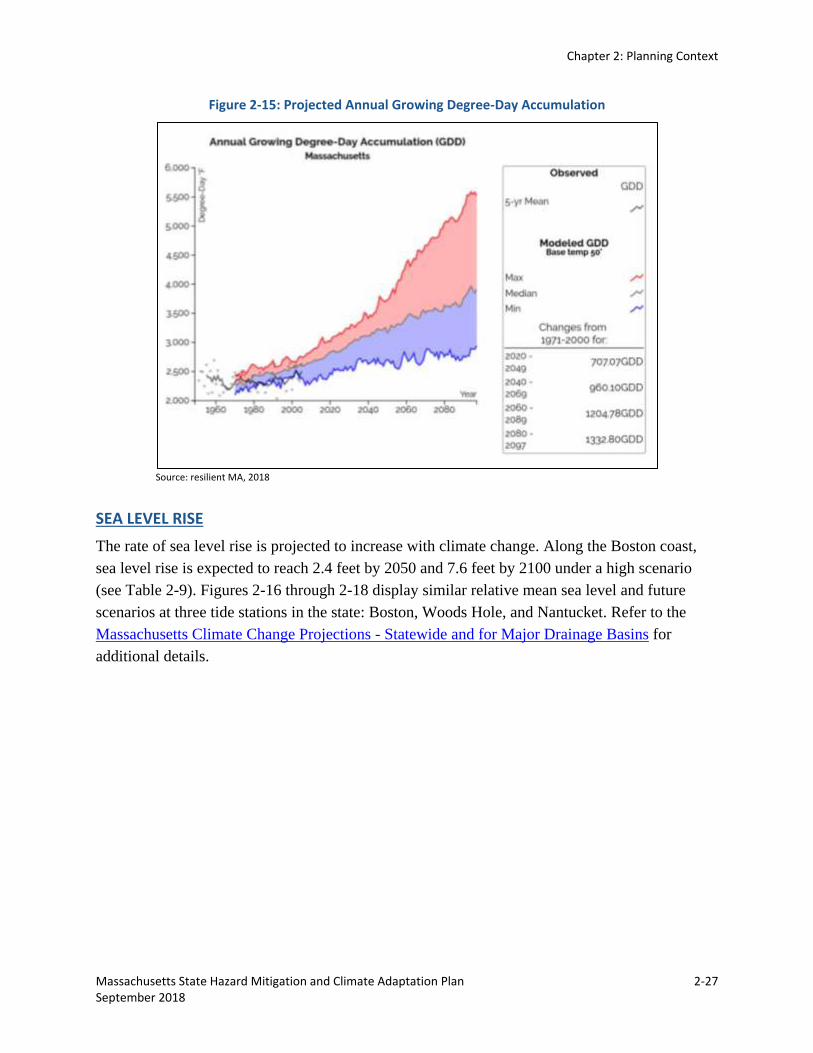
century, compared to the historical average of 78.9°F. Figure 2-14 displays the projected increase
in number of days per year over 90°F. The number of days per year with daily maximum
temperatures over 90°F is projected to increase by 7 to 26 days (up to 31 days total) by the
2050s, and by 11 to 64 days (up to 69 days total) by the 2090s, compared to the average
observed range from 1971 to 2000 of 5 days per year. Maximum temperatures in winter are
projected to increase by 9.6°F by the end of this century.
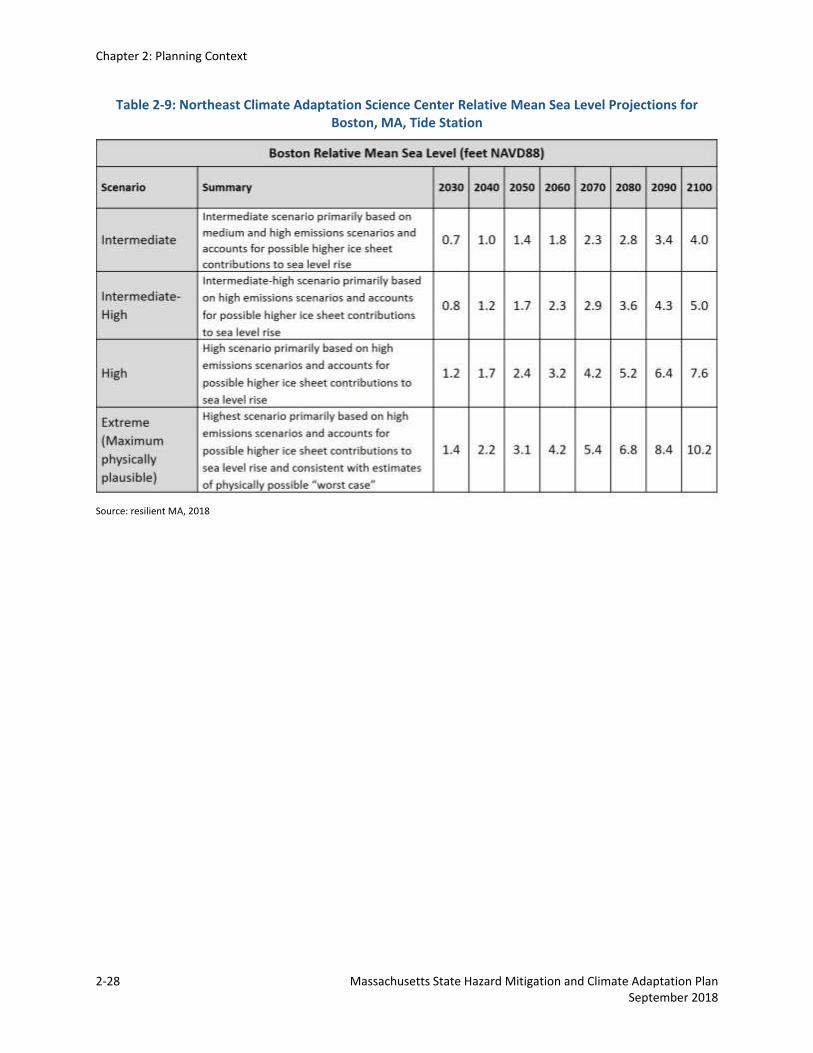
As temperatures increase, the growing season will expand. The number of growing degree days
is projected to be 23 to 52 percent higher at the end of this century relative to the 1971-2000
average, as shown on Figure 2-15.
Chapter 2: Planning Context
2-26 Massachusetts State Hazard Mitigation and Climate Adaptation Plan September 2018
Figure 2-13: Projected Annual Days with Temperature Below 32°F
Source: resilient MA, 2018
Figure 2-14: Projected Annual Days with Temperature Above 90°F
Source: resilient MA, 2018
Chapter 2: Planning Context
Massachusetts State Hazard Mitigation and Climate Adaptation Plan 2-27 September 2018
Figure 2-15: Projected Annual Growing Degree-Day Accumulation
Source: resilient MA, 2018
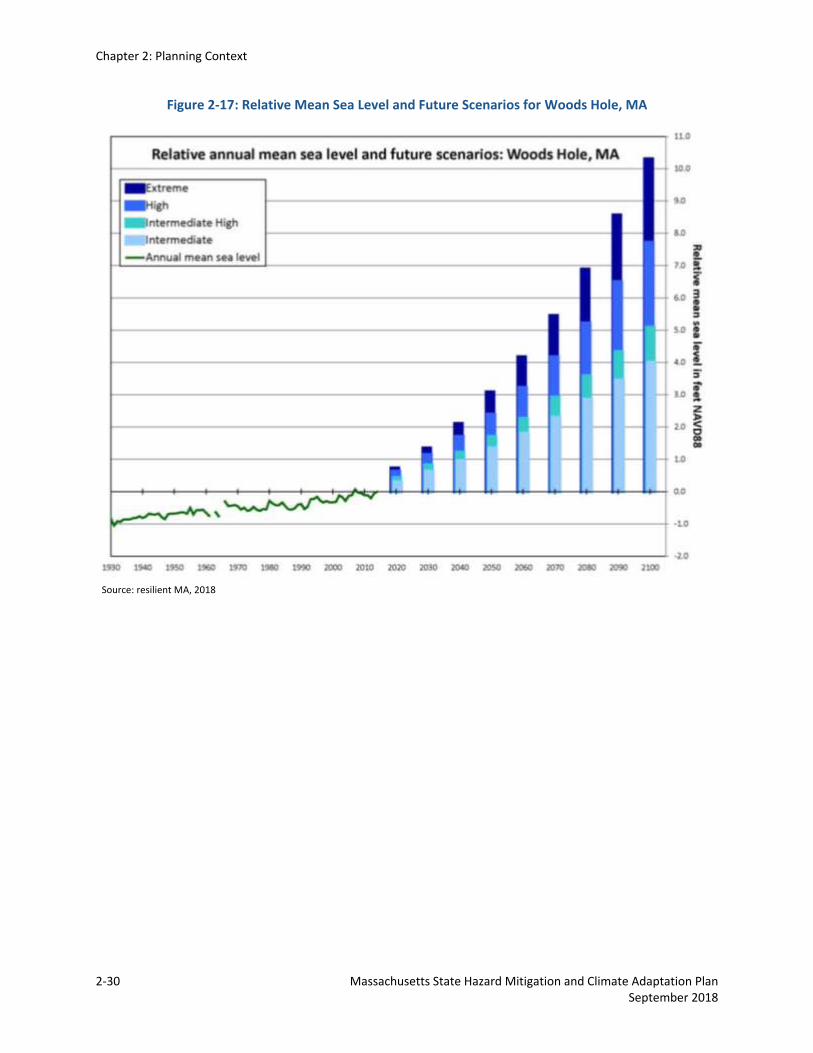
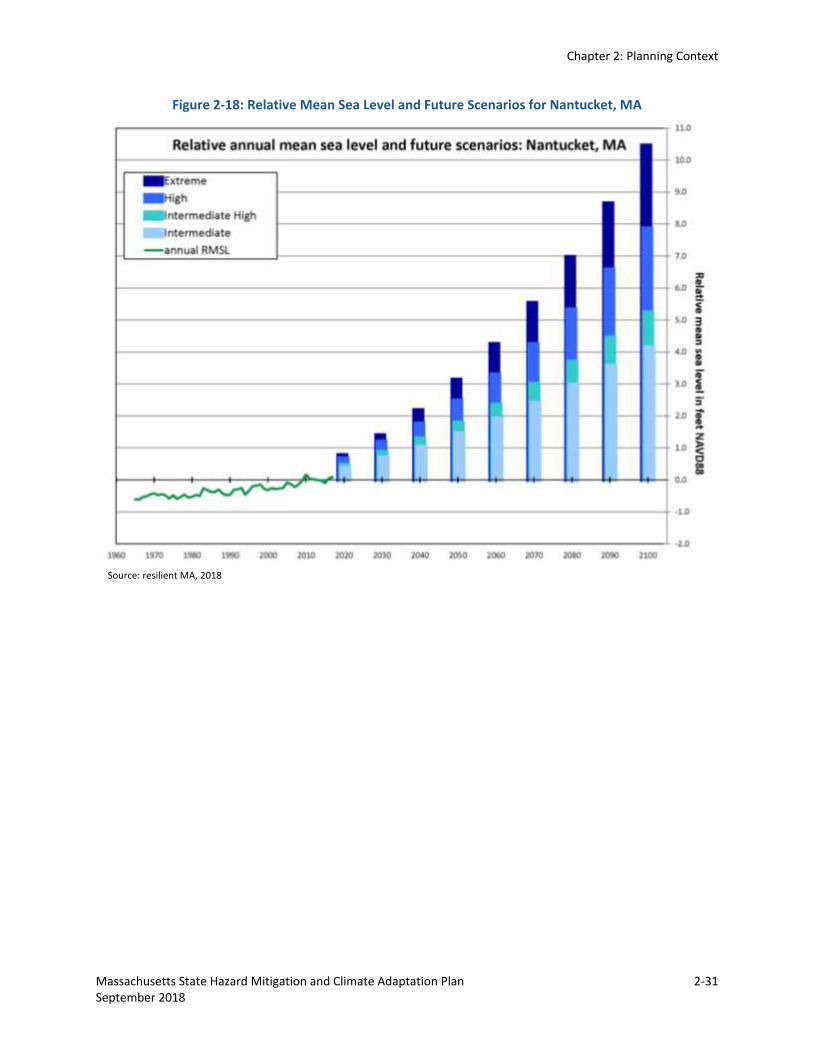
SEA LEVEL RISE
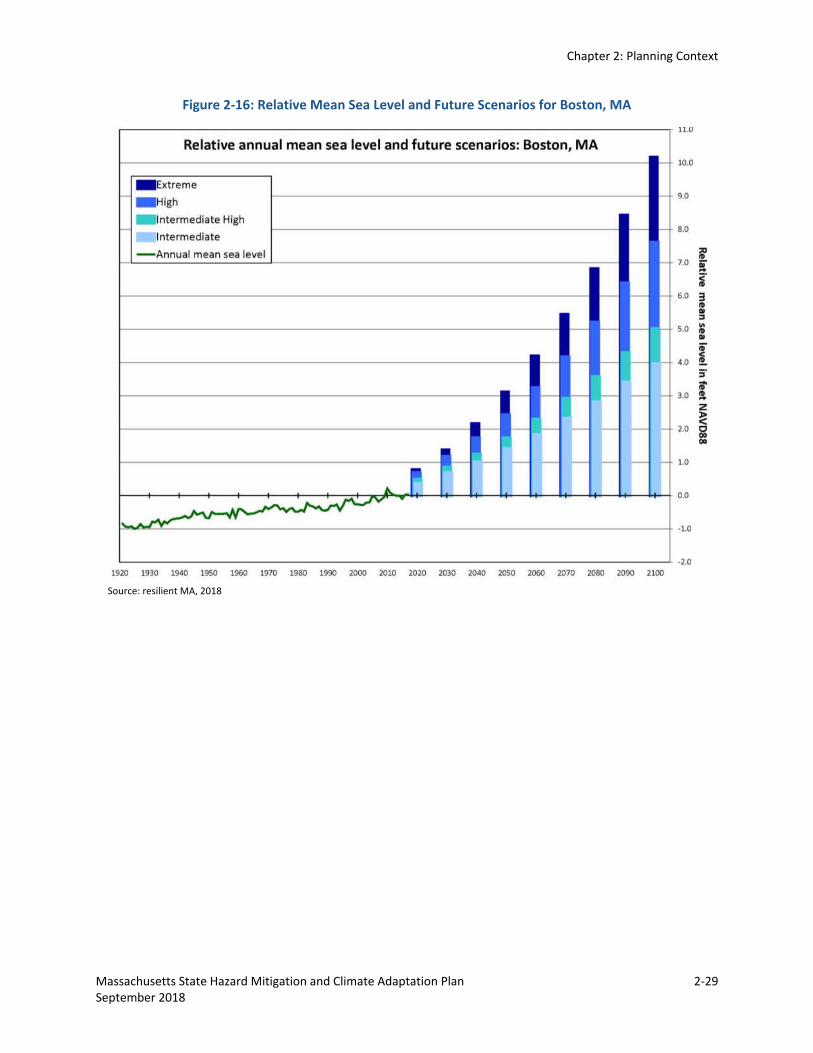
The rate of sea level rise is projected to increase with climate change. Along the Boston coast,
sea level rise is expected to reach 2.4 feet by 2050 and 7.6 feet by 2100 under a high scenario
(see Table 2-9). Figures 2-16 through 2-18 display similar relative mean sea level and future
scenarios at three tide stations in the state: Boston, Woods Hole, and Nantucket. Refer to the
Massachusetts Climate Change Projections - Statewide and for Major Drainage Basins for
additional details.
Chapter 2: Planning Context
2-28 Massachusetts State Hazard Mitigation and Climate Adaptation Plan September 2018
Table 2-9: Northeast Climate Adaptation Science Center Relative Mean Sea Level Projections for Boston, MA, Tide Station
Source: resilient MA, 2018
Chapter 2: Planning Context
Massachusetts State Hazard Mitigation and Climate Adaptation Plan 2-29 September 2018
Figure 2-16: Relative Mean Sea Level and Future Scenarios for Boston, MA
Source: resilient MA, 2018
Chapter 2: Planning Context
2-30 Massachusetts State Hazard Mitigation and Climate Adaptation Plan September 2018
Figure 2-17: Relative Mean Sea Level and Future Scenarios for Woods Hole, MA
Source: resilient MA, 2018
Chapter 2: Planning Context
Massachusetts State Hazard Mitigation and Climate Adaptation Plan 2-31 September 2018
Figure 2-18: Relative Mean Sea Level and Future Scenarios for Nantucket, MA
Source: resilient MA, 2018

This page intentionally left blank.