massachusetts' plan for excellence in stem education
TRANSCRIPT

a foundation for the future
Massachusetts’ Plan for Excellence in STEM Education science, technology, engineering and math
Version 2.0: Expanding the Pipeline for All
A Plan from the Governor’s STEM Advisory Council November 13, 2013
ContentsExecutive Summary .........................................................................................................3
Celebrating Success .........................................................................................................7
STEM Plan 2.0: Expanding the Pipeline for All .................................................11
Goal 1: Student Interest ........................................................................................................ 18
Goal 2: Student Achievement .......................................................................................... 20
Goal 3: Skilled Educators ..................................................................................................... 23
Goal 4: Post-Secondary STEM Preparation .......................................................... 26
Goal 5: Employment Opportunities ........................................................................... 28
Phased Implementation .......................................................................................30
Appendix A: Progress From STEM Plan 1.0 Through Today ................................31
Appendix B: Deep Learning Scale ...............................................................................39
Appendix C: @ Scale Project Portfolio ........................................................................40
Appendix D: STEM Plan 2.0 Contributors .................................................................43
Appendix E: Governor’s STEM Advisory Council Members ................................45
Appendix F: Index of Tables and Charts ....................................................................48
On the cover: Students work in the biotechnology lab at MassBay Community College.
1
The CommonwealTh of massaChuseTTs
exeCuTive DeparTmenT
state house • boston, ma 02133
(617) 725-4000
Deval l. paTriCk governor
November 13, 2013
Dear All,
On behalf of the Commonwealth of Massachusetts and the Governor’s STEM Advisory Council, I am pleased to submit STEM Plan 2.0, an update to the 2010 report called A Foundation for the Future: Massachusetts’ Plan for Excellence in STEM Education.
STEM Plan 1.0 created a STEM Pipeline infrastructure that became the envy of the nation. I am excited to say the second version of this plan, Expanding the Pipeline for All, will maintain the momentum generated in the first while providing an increased focus on equity thus ensuring every student in Commonwealth has access to first class STEM education.
STEM Plan 2.0 is intended to catalyze a common movement across the Commonwealth that takes place at the local level in order to prepare citizens to be STEM literate and to prepare the STEM Talent Pipeline. This plan is based on community feedback that the STEM Council received from all levels of education, government, non-profits, and industry during the summer of 2013. The goals of the plan still have the same focus as our plan from 2010. New elements of the plan include trend data from 2009 through the present, concrete strategies that can be implemented at the local level, increased agency alignment, improved metrics, and greater inclusion of all students.
During my time as Governor my administration has made key investments as a part of our Science, Technology, Engineering, and Math Jobs, Education, and Workforce Initiative. Over the last several years, we have formed strong partnerships to work towards shared goals as we make significant improvements in STEM fields. I thank every single person involved in this process, ranging from former Lieutenant Governor and STEM Council founder Timothy Murray, to current honorary chairman Congressman Joseph Kennedy, to professionals in academia, workforce training, and economic development to our partners in the private sector and community organizations.
As we take our STEM Initiative to the next phase it is imperative that we all continue to work together to encourage more students to pursue careers in STEM fields and to provide them with the resources they need to become the successful leaders of tomorrow. STEM education is a civic obligation and an economic need. I thank you for your efforts to push forward on everything STEM.
Sincerely,

The Massachusetts Governor’s STEM Advisory Council
One Ashburton Place, Rm. 1401 Honorary Chair: Congressman Joe Kennedy Boston, MA 02108 Executive Director: Allison Scheff
Dear Friend,
On behalf of the Governor’s STEM Advisory Council, I am proud to present you with Version 2.0 of “A Foundation for the Future: Massachusetts’ Plan for Excellence in STEM Education.” This document builds on the tremendous success of the Council’s work to date and explores new ways for our state to bring the benefits of STEM education to every child, school and community in the Commonwealth. Thanks to the unparalleled leadership of the Patrick Administration, Massachusetts continues to lead the way in our national STEM conversation. With a deep commitment to innovation, excellence and equity, we are pursuing cutting-edge strategies that are an example to cities and towns across the country. At a time when 40 percent of all employment in our Commonwealth revolves around innovation industries like clean energy, defense, information technology and advanced manufacturing, these efforts are more critical than ever. Moving forward, our challenge is not just to expand the STEM opportunities our state has successfully incubated, but to increase access to them wherever we can. While we have made important progress in closing persistent achievement gaps in science and mathematics, the reality is that zip code, ethnicity and gender still play too powerful a role in predicting a student’s interest or achievement in STEM. To that end, this plan seeks to better support the vocational schools, community colleges, and workforce training programs that provide critical access for students who might not be exposed to STEM otherwise. Version 2.0 also provides an increased focus on low-income and minority communities, where the opportunities provided by STEM education are often most needed but hardest to come by. I’d like to thank Governor Patrick for the incredible opportunity to serve on the Council as well as the tireless members of the Council’s Executive Committee for their leadership and creativity. And in particular, I’d like to recognize the teachers, mentors, businesses and other advocates who put our STEM ideas into action each and every day. I look forward to working with all of you and sharing Massachusetts’ innovation with my colleagues in Washington. Our Commonwealth is better and stronger for the work you do. Sincerely,
Congressman Joe Kennedy Honorary Chair, Governor’s STEM Advisory Council
2
November 13, 2013
Dear Friends,
On behalf of the Governor’s STEM Advisory Council, I am proud to present you with Version 2.0 of A Foundation for the Future: Massachusetts’ Plan for Excellence in STEM Education. This document builds on the tremendous success of the Council’s work to date and explores new ways for our state to bring the benefits of STEM education to every child, school and community in the Commonwealth.
Thanks to the unparalleled leadership of the Patrick Administration, Massachusetts continues to lead the way in our national STEM conversation. With a deep commitment to innovation, excellence and equity, we are pursuing cutting-edge strategies that are an example to cities and towns across the country. At a time when 40 percent of all employment in our Commonwealth revolves around innovation industries like clean energy, defense, information technology and advanced manufacturing, these efforts are more critical than ever.
Moving forward, our challenge is not just to expand the STEM opportunities our state has successfully incubated, but to increase access to them wherever we can. While we have made important progress in closing persistent achievement gaps in science and mathematics, the reality is that ZIP code, ethnicity and gender still play too powerful a role in predicting a student’s interest or achievement in STEM. To that end, this plan seeks to better support the vocational schools, community colleges, and workforce training programs that provide critical access for students who might not be exposed to STEM otherwise. Version 2.0 also provides an increased focus on low-income and minority communities, where the opportunities provided by STEM education are often most needed but hardest to come by.
I’d like to thank Governor Patrick for the incredible opportunity to serve on the Council as well as the tireless members of the Council’s Executive Committee for their leadership and creativity. And in particu-lar, I’d like to recognize the teachers, mentors, businesses and other advocates who put our STEM ideas into action each and every day. I look forward to working with all of you and sharing Massachusetts’ innovation with my colleagues in Washington.
Our Commonwealth is better and stronger for the work you do.
Sincerely,
Congressman Joe Kennedy Honorary Chair, Governor’s STEM Advisory Council
The Massachusetts Governor’s STEM Advisory Council
One Ashburton Place, Rm. 1401 Honorary Chair: Congressman Joe Kennedy Boston, MA 02108 Executive Director: Allison Scheff
Dear Friend,
On behalf of the Governor’s STEM Advisory Council, I am proud to present you with Version 2.0 of “A Foundation for the Future: Massachusetts’ Plan for Excellence in STEM Education.” This document builds on the tremendous success of the Council’s work to date and explores new ways for our state to bring the benefits of STEM education to every child, school and community in the Commonwealth. Thanks to the unparalleled leadership of the Patrick Administration, Massachusetts continues to lead the way in our national STEM conversation. With a deep commitment to innovation, excellence and equity, we are pursuing cutting-edge strategies that are an example to cities and towns across the country. At a time when 40 percent of all employment in our Commonwealth revolves around innovation industries like clean energy, defense, information technology and advanced manufacturing, these efforts are more critical than ever. Moving forward, our challenge is not just to expand the STEM opportunities our state has successfully incubated, but to increase access to them wherever we can. While we have made important progress in closing persistent achievement gaps in science and mathematics, the reality is that zip code, ethnicity and gender still play too powerful a role in predicting a student’s interest or achievement in STEM. To that end, this plan seeks to better support the vocational schools, community colleges, and workforce training programs that provide critical access for students who might not be exposed to STEM otherwise. Version 2.0 also provides an increased focus on low-income and minority communities, where the opportunities provided by STEM education are often most needed but hardest to come by. I’d like to thank Governor Patrick for the incredible opportunity to serve on the Council as well as the tireless members of the Council’s Executive Committee for their leadership and creativity. And in particular, I’d like to recognize the teachers, mentors, businesses and other advocates who put our STEM ideas into action each and every day. I look forward to working with all of you and sharing Massachusetts’ innovation with my colleagues in Washington. Our Commonwealth is better and stronger for the work you do. Sincerely,
Congressman Joe Kennedy Honorary Chair, Governor’s STEM Advisory Council
Executive Summary
The Commonwealth of Massachusetts’ economic strength and civic prowess have always been dependent on the talents and skills of its citizens. As we face the future, the role of scientific and technological innovations will continue to provide both challenges and opportunities. To be successful, the citizens of Massachusetts need to be better prepared with the knowledge and skills encompassed by the fields of science, technology, engineering and mathematics (STEM).
For many, STEM preparation will be critical for find-ing well-paying jobs and long-term careers. For all, understanding the implications of scientific and technological innovations will prepare citizens to influence public policies, as well as become adapt-able to the changes arising from applications of STEM knowledge and skills. STEM Plan 1.0, Building the Pipeline of STEM Professionals to Fuel Massachusetts’ Innovation Economy, established a strategic plan for the Commonwealth. It created an infrastructure to align efforts and mechanisms to provide resource support. STEM Plan 2.0, Expanding the Pipeline for All, builds on the framework of 1.0 and provides for an increased focus on providing equitable opportunities and preparation for those in the STEM pipeline.
ThemesThe second iteration of the plan has four main themes:
Reduction of achievement, interest, and skills gaps. While many of our students excel in STEM subjects, we still face a persistent achievement gap. Latino and African-American students, who represent fast-growing segments of our population, still lag behind their white and Asian peers on key academic assessments and in their rate of participation in STEM career fields. Female students, while often demonstrating strong achievement levels in STEM subjects, too often express lower levels of interest in these highly rewarding careers, one example of an improving but still present interest gap. Even though declines in Massachusetts’ unemployment rate shows the return of a strong and productive economy, we still experience a workforce skills gap in which good jobs, important jobs, go unfilled while far too many residents remain unemployed or underemployed. Many of these unfilled jobs are STEM jobs.
Continued focus on creating and maintaining a skilled STEM educator workforce. Educator preparation and continued professional development are important components to be ad-dressed to realize the goals of the plan. Highly skilled educators in grades PreK through higher education are necessary for making STEM interesting to students; preparing students to be successful, knowl-edgeable, and skillful; and helping them to persist in the pursuit of a STEM degree or career. Teacher and administrator preparation should prepare educators for the roles they will face in today’s schools, which goes beyond content and instruction. As teachers enter the classroom, continuous and ongoing profes-sional development that is differentiated for the particular needs of each educator helps to maintain a highly skilled educator workforce.
3

A Foundation for the Future: Massachusetts’ Plan for Excellence in STEM Education4
Explore diverse and innovative instructional strategies to promote the teaching and learning of STEM. State standards for PreK–12 education detail what is recommended for students to know by the time they graduate high school. These standards provide a foundation for students to be college and career ready. However, the standards do not articulate which curricula or pedagogical strategies for student learn-ing to use. A state as innovative as Massachusetts should continue to be an incubator of new ideas. These diverse strategies can provide multiple entry points for students to become interested in and excel at STEM areas of study. Vocational and technical schools provide an instructional model for providing students with a skills-based education that prepares them to enter the workforce or to pursue post-sec-ondary certificates and degrees. Likewise, community colleges have partnered with local industry to design curricula that train students to enter specific indus-tries and graduate with a certificate or an associate’s degree. The pedagogical and content areas explored in this plan include arts and STEM, computer science, and the use of English language learner instructional strategies for all students.
Increasing scale of programs across the Commonwealth. Achieving scale will be one of the key challenges that Massachusetts must address in this next phase of implementation of the state STEM initiative. Scale must be defined both quantitatively and qualitatively. When securing funding, planning programs, and building capacity, we must be clear about the num-ber of students that must be engaged at all grade levels as well as the teachers/classrooms/learning experiences and other activities needed to support those students. We must also address what resources are necessary to provide a high-quality learning expe-rience for all students who represent many different academic readiness levels, education backgrounds and cultural norms and aspirations.
GoalsThe themes throughout STEM Plan 2.0 can be achieved by meeting the five goals that are described in the plan. The five goals of the plan are:
1. Increase student interest in STEM areas.2. Increase student achievement among all PreK–12
students in order to prepare graduates to be civically and college and/or career ready.
3. Increase the percentage of skilled educators who teach PreK–16 STEM.
4. Increase the percent of students completing post-secondary degrees or certificates in STEM subjects.
5. STEM degrees and certificate attainment will be aligned with corresponding opportunity in STEM-related fields to match the state’s workforce needs for a STEM talent pipeline.
Each goal consists of four parts: a measurable bench-mark, several priority areas to focus efforts to meet the benchmark, recommended strategies as exam-ples of what could be done to meet the benchmark, and metrics to assess progress toward meeting the benchmark. The benchmarks for each goal are taken from STEM Plan 1.0, which was originally written as a five-year plan and with a target date of 2016.

5Version 2.0: Expanding the Pipeline for All
TakeawaysThe objectives of the five goals in 2.0 are parallel to the objectives described in STEM Plan 1.0. The University of Massachusetts’ Donahue Institute has been tracking the Commonwealth’s progress on meeting these goals since 2010. The data are avail-able in the appendix of the plan. Based on the data, three conclusions can be made:
Closing the achievement gap. MCAS data between 2009 and 2013 show that Massachusetts is making progress in closing the achievement gap in mathematics and in science and technology/engineering.
In mathematics, there has been an increase in the percentage of students scoring proficient or higher at all grade levels except in grade 6, where it remained unchanged. The achievement gap for Latino and African-American students decreased on the math-ematics MCAS exams at all grade levels, with the exception of African-American students at grade 5, from 2009 until 2013. The gap between low-income students and non-low-income students has also de-creased at all levels, with the exception of no change for grade 4 students.
In science and technology/engineering (STE), there has been a 10% increase in students scoring profi-cient or higher at the high school level. The achieve-ment gap for Latino and African-American students decreased at all grade levels between 2009 and 2013. The gap between low-income students also dropped for all grade levels during this time.
As a Commonwealth, there is still much progress to be made to eliminate these gaps and expand the STEM pipeline to include all, but these results do indicate that we are moving in the positive direction for these subgroups.
Socio-economic status matters. Whether it is children attending prekindergarten programs, teens in high school, or adults who are un/underemployed, socio-economic status directly correlates with access to opportunity. The quality and quantity of opportunities directly correlates with STEM interest, achievement, and career options.
Early learning and experiences matter. Developmentally, a child’s identity—including gender, race, and scientific identity—are set at an early age. Early exposure and experience to science, technology, engineering, and mathematics is an ex-cellent way to promote an increased interest in STEM areas. Likewise, a strong mathematical foundation that is developed at an early age is needed to learn more complex ideas. For example, it is more difficult for students to learn about addition or fractions in elementary school if they were never taught the underlying concept of magnitude earlier in life.
The hallmarks of STEM Plan 2.0, Expanding the Pipeline for All, will be to advance and accelerate the STEM movement already visibly underway in classrooms, campuses, regional community groups, and through industry, non-profits, and employers throughout the Commonwealth. This plan seeks to identify research-based best educational practices, attain statewide scale-of-implementation, and effectively manage public/private investments to achieve targeted out-comes framed by the goals of the plan and validated through data. Our challenge and opportunity is to realize the principle that STEM education is for all students from all communities in all regions of the Commonwealth throughout their learning and work-ing lifetime.

A Foundation for the Future: Massachusetts’ Plan for Excellence in STEM Education6
Shared VisionThis plan is intended to continue with the themes of 1.0 to catalyze movement across the Commonwealth in order for a long-term vision to be realized. Our shared vision as a STEM Advisory Council, and one we know many of the readers of this plan share, is that in the future, all residents of the Commonwealth—regardless of race, gender, special needs, ZIP code or socio-economic background—need to be STEM literate. Members of this STEM-literate society will be prepared to make informed decisions for themselves, their families, and their communities. They will be STEM skilled and, therefore, prepared to attain gainful employment and careers within the growth industries that reflect the Commonwealth’s knowledge and innovation economy. By achieving these goals, economic prosperity across the state will be enhanced for all throughout the Commonwealth’s well- educated workforce and result in:
z Parents will engage their children with questions about their world and their children will respond with critically conceived ideas supported by the knowledge and experience gained through math-ematics, science and technology classes enhanced through embedded experiential learning.
z Recent college graduates will demonstrate the knowledge, skills and abilities necessary for employment as members of diverse, collaborative teams addressing global as well as local challenges and will readily find jobs in their chosen field.
z Adults, as lifelong learners, will routinely return for further education to advance their knowledge, skills and abilities within their field of practice and will have access to higher education to support their pursuit of emerging opportunities in new fields.
z New entrants to our community will have ready access to post-secondary education to transfer credentials, overcome academic deficits, and accel-erate their readiness to participate and contribute to the richness of our economy and society.
z Massachusetts’ workforce will be the envy of the nation and the world. Our workforce will be even more robust, supporting the growth of current industries, and will show agility as new emerging industries come to the forefront.
7Version 2.0: Expanding the Pipeline for All
Together, the community of STEM educators, business and industry leaders, state agencies, school districts and higher education institutions, not-for-profit partners and so very many dedicated individuals have, over the last decade-plus, contributed to the growth of our students, the quality of our workforce and the success of our economy. While indi-vidual and institutional accomplishments are too numerous to list, it is worthy to note key contributions of the state agencies that span segments of the education and workforce system as well as lead initiatives of the Governor’s STEM Advisory Council.
The Role of the Governor’s STEM Advisory CouncilAs part of the Administration’s efforts to align education with workforce development, and also due to a call to action from the business community and STEM leaders, Governor Patrick established the STEM (Science, Technology, Engineering and Math) Advisory Council in October 2009 to increase coordination and collaboration among existing STEM programs and resources. Building on the Patrick Administration’s comprehensive education agenda, in 2010 former Lieutenant Governor Timothy Murray tasked the Governor’s STEM Advisory Council to develop and implement the state’s first STEM Plan, which outlined the Commonwealth’s first-ever strategic plan for tying economic and workforce development to educational enhancement in the fields of science, technology, engineering and math. In addition to being rated number one by the U.S. Department of Education in the nationwide Race to the Top Competition, Massachusetts has also been recognized by the National Governors Association’s
Center for Best Practices, Change the Equation and Innovate+Education as a top STEM state.
From the beginning, the STEM Advisory Council has helped to shape the STEM pipeline within Massachusetts. In addition to creating the first STEM Plan, the STEM Advisory Council created new Regional STEM Networks and enhanced existing Regional STEM Networks across Massachusetts to engage the STEM community locally around the goals of the plan and helped to promote the scaling of best practices across the Commonwealth through the @Scale initiative.
The system of Networks, which convene local schools, colleges, employers, non-profit groups and individuals in each of eight regions across the Commonwealth, from the Berkshires to Cambridge and Cape Cod to Cape Ann, have developed into a critically important resource that aligns resources and catalyzes action locally to advance the goals of the statewide plan. State funds, matched by cash and in-kind donations, plus many volunteer hours from devoted STEM Network members have yielded a significant return-on-investment for this strategy.
In response to a call from private sector and foundation partners for guidance in aligning their investments with the goals of the STEM Plan, the STEM Advisory Council, launched what is known as the @Scale Initiative. The @Scale Initiative builds upon the Patrick Administration’s strategic plan tying economic and workforce development to educational enhancement in STEM fields. With @Scale, the STEM Advisory Council has collaborated with government, academia and the private sector to “scale up” existing programs in Massachusetts, replicating models and best practices to reach more students and adults studying and pursuing STEM education and careers. @Scale has been hailed by STEM advocates as a breakthrough model at delivering a combination of public and private funding to replicate and bring to
Celebrating SuccessCelebrating Our Collective Success

A Foundation for the Future: Massachusetts’ Plan for Excellence in STEM Education8
scale transformative, system-wide improvements in STEM education across the Commonwealth. The @Scale model is a strong example of private-public partnership by requiring each state-funded project to secure at least $3 in outside support for every $1 in funding it receives from the state. This model promotes local partnership building and a pathway toward sustainability that many publically funded projects never attain. As of September 2013, 17 projects (described in Appendix C) have since been endorsed and received $1.03 million in grant funding from the STEM Pipeline Fund matched by over $4.48 million in private resources to support the replication and scale-up of these projects. In addition to further scale-up of these projects, this initiative will now turn its focus to developing a research-based evaluation of this portfolio of projects and establish a framework for best practices that will be unique in the nation.
The annual STEM Summit, the longest-running in the nation, developed and led for the past 10 years by the UMass Donahue Institute convenes the statewide STEM community. The Summit has grown in size such that in 2012 and 2013 it has been hosted at Gillette Stadium, attracting some 1200 attendees represent-ing all constituencies, including PreK–12 teachers and school/district leaders, higher education faculty and administrators, students and representatives of parent groups, employers and industry leaders, non-profit education partners and government officials.
The ongoing public awareness campaign is used to help to communicate what a STEM career is and looks like to all students. One such current state-supported effort is the WOW campaign. The WOW campaign, an initiative by the STEM Advisory Council’s Public Awareness Subcommittee, highlights STEM profes-sionals from across the Commonwealth through a dynamic poster, video, and school visits. These Massachusetts-based STEM professionals, called “Wowsters,” volunteer their time to visit students and teachers in their classrooms. Public awareness efforts, like this one and many other local efforts, are aimed to change misconceptions about STEM jobs and careers. For example, advanced manufacturing is not about building cars on an assembly line in a dark fac-tory. In fact advanced manufacturing companies are working with computerized equipment and robots to make precise parts, carry out assemblies, or produce machinery in modernized, well-lit plants that pay workers healthy wages.
Other important achievements of note include development and release of a statewide Data Dashboard which reports on 140 indicators to inform the design, evaluation and outcome assessments of STEM projects, strategies and policies statewide; the launch of a public awareness campaign to create a targeted STEM brand and messaging; and community college initiatives focused on strengthening student recruiting, retention and graduation rates in STEM programs to address the STEM “Middle Skills” work-force gap and improve transfer of students into STEM programs at the state universities and the University of Massachusetts.
In June 2013, the chairmanship of the STEM Advisory Council transitioned from Lieutenant Governor Timothy Murray to honorary chair Congressman Joseph P. Kennedy III.
By working across agencies and considering poli-cies and initiatives through a STEM lens, the Patrick Administration has increased their focus and distribu-tion of funding to align our state’s governance system to address the goals and call to action from STEM Plan 1.0. The initiatives below led by state and quasi-public agencies demonstrate how the framework of STEM Plan 1.0 has been put into practice.
State AgenciesWorking in partnership, the Executive Office of Education (EOE) and the Departments of Early Education and Care, Elementary and Secondary Education, and Higher Education are collectively responsible for the teaching and learning of almost 1.3 million students in 400 school districts; 11,000 licensed early-care providers and After-School Out-of-School Time (ASOST) programs and over 30,000 early care and ASOST educators; and 292,000 students on its 29 public higher education campuses across the Commonwealth. These agencies have aligned to implement statewide polices and initiatives that deliver measurable results in support of the strategic goals for STEM education in Massachusetts.
EOE has focused its work to accelerate student achievement; close achievement and attainment gaps that disproportionately affect students of color, those with learning disabilities, those living in poverty, and English language learners; and increase opportunities for all students across all levels. As a re-sult, EOE’s efforts have led to accelerated innovation

9Version 2.0: Expanding the Pipeline for All
throughout our public education system which includes the establishment of 44 Innovation Schools across the Commonwealth. A quarter of Innovation Schools have STEM themes with the faculty receiving professional development to incorporate hands-on science, technology, engineering and mathematics projects into their curriculum. Additionally, EOE is addressing access to college and career by supporting multiple career pathway programs that create stronger pipelines to jobs in high-demand industries, particularly STEM fields, and that enable our students to gain the knowledge and skills to meet employer needs.
The Department of Early Education and Care (DEEC) has taken a significant step in helping to identify STEM impact areas for providers by creating Science, Technology, and Engineering standards.1 Early education and care providers have long worked on numeracy, sorting, engineering design, patterns, asking questions, and looking at cause and effect; however, through increased access to profes-sional development, educators are able to be more intentional when presenting new STEM ideas and concepts to preschool children. While STEM may be a new label or lens for the work being done by our early education and care providers, it is not work that is unfamiliar to them. Programs throughout the Commonwealth that use DEEC-approved formative assessment tools are assessing children’s STEM skills. DEEC has also taken strides to increase STEM profes-sional development offerings for early education and care providers with support for the implementation and use of the standards and tools.
The Department of Elementary and Secondary Education (DESE) has adopted the Common Core frameworks for mathematics and English language arts and is working toward a revised set of science and technology/engineering standards. These new standards are aligned with the practices, foundational concepts, and skills that employers are looking for in the STEM-enabled workforce. Massachusetts is exploring new assessments to measure student practices, such as making sense of problems, reason-ing quantitatively, constructing viable arguments, modeling, and attending to precision. It is expected that such assessments will allow students to demon-strate learning through multiple modes, including
1 Approved for public comment by the Board of Early Education and Care on October 8, 2013.
performance-based formats. DESE is also working closely with Out-of-School Time organizations to ensure that the work that is going on outside of the school day supports formal classroom learn-ing. The STEM Plan is designed to work within the context of the MA Mathematics and Science and Technology/Engineering standards and policies of the Commonwealth.
The Department of Higher Education (DHE) has dedicated itself to increasing college completion rates. The Vision Project’s Time to Lead report outlines the DHE’s strategy for becoming a leader in public higher education. One of the seven outcomes identi-fied to become the premier public higher education system is an increase in graduation rates at our public two-year and four-year institutions of higher educa-tion. To achieve these increases, there needs to be an increase in college participation and student learning and a decrease in the achievement gaps among stu-dents from different backgrounds. The STEM Starter Academies, which are being designed by community colleges during the 2013–2014 school year, will encourage a more diverse body of students to enter STEM majors through the use of scholarships and stipends, and the Academies will provide centralized support to help all STEM majors persist. Additionally, the Patrick Administration has made STEM-specific investments at every public college and university in Massachusetts.
Across this education system and in coordina-tion with the Executive Offices of Housing and Economic Development and Labor and Workforce Development, policies, resources and programs have been aligned to reflect and support the goals of the STEM Plan and to catalyze local implementation initiatives.
The Executive Office of Housing and Economic Development (EOHED) has organized and executed initiatives designed to identify the spe-cific STEM needs of industry in regions throughout Massachusetts and engage industry and academia as partners in delivering solutions. In 2011, Secretary Gregory Bialecki worked with business and educational leaders to deliver to Governor Deval Patrick the state’s economic development plan, Choosing to Compete in the 21st Century. The plan includes 55 specific goals with measures, including the goal to focus on STEM Plan priorities-related middle-skill jobs; expand awareness of STEM

A Foundation for the Future: Massachusetts’ Plan for Excellence in STEM Education10
career opportunities, particularly in high-demand occupations; and expanding STEM interest and achievement in under-represented populations. The plan further emphasizes retaining STEM students in Massachusetts by improving internship opportunities in the state’s innovation industries and improving the responsiveness and alignment of the economic development, workforce development and education sectors to STEM career opportunities in advanced manufacturing.
In 2012, MassDevelopment, in partnership with EOHED and the Advanced Manufacturing Collaborative, launched a career awareness and promotional campaign called AMP it up!, which provides promotional materials and grants to regional partnerships of secondary schools, higher education, manufacturers, workforce profession-als and economic development leaders to educate parents, students, guidance counselors and others on career pathways in advanced manufacturing. MassDevelopment provided $100,000 in grants to ten regional partnerships in 2012, and a new grant round opened in October 2013.
EOHED’s three innovation economy quasi-public corporate partners, the Massachusetts Life Sciences Center, Massachusetts Tech Collaborative, and Massachusetts Clean Energy Center, have all launched paid internship programs that connect college students, from the community college level through graduate school, with companies through-out the state. The internships are primarily focused on students graduating in STEM fields. Collectively, the agencies have supported nearly 2,000 students with internships at dynamic innovation economy companies in Massachusetts.
At the Executive Office of Labor and Workforce Development (EOLWD), efforts in workforce develop-ment continue to focus on strengthening the pipeline for middle-skilled workers, closing the skills gaps for under- and unemployed adults and disconnected youth, and providing continuing education for incumbent workers across high-demand fields. The Workforce Competitiveness Trust Fund is a workforce development initiative that supports programs in critical industry sectors in Massachusetts particularly for our high-need, innovation economy in healthcare, advanced manufacturing, information technology and life sciences. This state-funded initiative is
administered by Commonwealth Corporation on behalf of EOLWD to improve the competitive stature of Massachusetts businesses by improving the skills of current and future workers, and to improve access to well-paying jobs and long-term career success for
all residents of Massachusetts, especially those who experience structural, social, and educational barriers to employment success. The most recent round of grants is designed to address the gap between the skills held by workers and the skills needed by em-ployers for jobs that require more than a high school diploma but less than the equivalent of a four-year degree. Lastly, EOLWD has made significant invest-ments in workforce training through the Workforce Training Fund Program. This fund has increased opportunity and skills for workers, especially those in STEM fields, while also making Massachusetts companies more competitive and sustainable. Since 2007, EOLWD has awarded $54.6 million for 722 grants to employers to train 66,211 workers within STEM fields like advanced manufacturing, healthcare, and engineering.
in memory of LArry mAier 1950–2012 former member of governor’s stem Advisory counciL (2010–2012)
Larry Maier’s passion for encouraging the next generation to look at precision manufacturing as a viable career choice fueled his commitment to STEM education. Larry knew that, without STEM education, there would be little to no future workforce for precision manufacturing.
—kristen mAier, president peerLess precision, inc.

11Version 2.0: Expanding the Pipeline for All
Long-Term OutcomesSTEM Plan 2.0 is intended to expand on the successes implemented since the release of 1.0 and provide a common vision that catalyzes local action throughout Massachusetts. Key to this vision is promoting stu-dent interest in STEM through relevant and engaging experiences throughout their multi-pronged progres-sion through the STEM pipeline. Implementation
of this plan at all levels of the STEM pipeline will increase our likelihood of academic success and economic prosperity. This plan can unite stakeholders in Massachusetts to better prepare STEM-literate citizens and STEM professionals, innovators, and leaders. If this plan accurately reflects the current and anticipated STEM needs of the Commonwealth, then
We invest in education because well-prepared young minds and mid-career talent are our global calling cards and our economic edge. We invest in innovation because, with a workforce like ours, enabling and encouraging new ideas is the best way to take advantage of the knowledge explosion happening in the world economy today.
—governor devAL pAtrick 2013 stAte of the commonweALth
The Commonwealth of Massachusetts is a leader in education, innovation, and infrastruc-ture.2 We have achieved and maintained this leadership through the commitment to core principles that define who we are as a com-munity and by making important investments even in the face of challenging times. Our commitment to provide access to high-quality STEM education for all students and to sustain our investments in this priority, even during recent economic challenges all that states are grappling with, exemplifies Massachusetts’ leadership, nationally and around the world.
We are proud of the accomplishments of our students who continue to outperform their peers across the nation on science and mathematics tests.3 We are also proud of our economic leadership, the envy of most states and many countries, as we have led the way forward from the recent economic recession. (Massachusetts consistently ranks as the top innova-tion economy among the 50 U.S. states.4) However, the people of this Commonwealth always want to do more and be better. We recognize that we face significant challenges and yet also have wonderful opportunities ahead.
2 Patrick, Deval. 2013 State of the Commonwealth Address. Massachusetts State House. House Chamber, Boston, MA. 16 January 2013. http://www.boston.com/politicalintelligence/2013/01/16/text-governor-deval-patrick-state-the-commonwealth-speech/NQiuFA1KeGvjESNxR1qghP/story.html
3 http://www.wbur.org/2012/12/11/massachusetts-students-timss
4 ITIF. State New Economy Index. Various years.
STEM Plan 2.0: Expanding the Pipeline for AllFoundation for Excellence

A Foundation for the Future: Massachusetts’ Plan for Excellence in STEM Education12
the value of the plan is to provide a framework that guides how all agencies—both public and private—align their resources and effort to create systemic change across Massachusetts and provide access and opportunities to all people regardless of the region in which they live.
A core value of this plan is that all learners deserve equitable opportunities and access from PreK through post-secondary experiences. Our responsibil-ity is to the students: students are educated so they can pursue opportunities for economic well-being, thus providing the conditions that enable employees and employers to stay and grow in Massachusetts. However, a challenge is that students are mobile and transient. To help overcome this, students need to receive an excellent education regardless of where they came from and where they are going.
Equity in Learning Opportunities: Elimination of Achievement and Interest GapsWhile many of our students excel in STEM subjects, we still face a persistent and resistant achievement gap. Latino and African-American students, who rep-resent fast-growing segments of our population, still lag behind their white and Asian peers on key aca-demic assessments and in their rate of participation in STEM career fields. Female students, while often demonstrating strong achievement levels in STEM subjects, too often express lower levels of interest in
these highly rewarding careers; this is one example of an improving but still present interest gap. And while a decline in Massachusetts’ unemployment rate shows our strong and productive economy, we still experience a workforce skills gap in which good jobs go unfilled while far too many residents remain un-employed or underemployed. Many of these unfilled jobs are STEM jobs.
A strong foundation in STEM education is essential for all residents of the Commonwealth to make informed decisions for themselves, their families and communi-ties, and to prepare for rewarding employment and sustainable careers within growing and emerging industries that make up Massachusetts’ knowledge and innovation economy. Our society is already faced with difficult decisions about the natural world: fossil fuel consumption and alternative energies, protecting the food water supply, and ensuring the quality of the air we breathe—to name just a few. It is essential to ensure that all students understand why it is important to study these areas. Students need to be sufficiently STEM-literate to make informed deci-sions, understand both sides of an issue, and realize that new solutions to such problems can come from anyone, anywhere, at any time.
One challenge is our STEM interest-preparation gap. Many students who are well-prepared are not interested in entering STEM careers, and many who are interested often are not sufficiently prepared, which has resulted in a STEM interest-preparation gap. The analysis of many years of student survey data collected from the College Board’s Scholastic Aptitude Test (SAT) and student achievement data from Massachusetts Comprehensive Assessment System (MCAS) indicate that Massachusetts schools that report the highest levels of student interest in STEM majors are many of the same (low-income) schools that report the lowest levels of student academic performance (10th grade mathematics).5 This high-interest low-achievement gap results in a frustrating barrier for many students, often those from communities underrepresented in STEM fields.
Many students have benefitted from sustained exposure to the excitement, creativity and discovery inherent in STEM subjects, sparking their individual interest. These students have enjoyed access to high-quality curriculum, instruction, and experiential
5 Please see UMass Donahue Institute’s Dashboard Data for more information.
STEM lies at the intersection of education, economics and social justice. It is a vehicle not just for growth and innovation but for access and opportunity. We need to expand the conversation this country is having about STEM to ensure ZIP code, skin color and gender can no longer be used as indicators of success.
—congressmAn joseph p. kennedy iii honorAry chAir, governor’s stem Advisory counciL

13Version 2.0: Expanding the Pipeline for All
learning opportunities, which has provided the necessary academic preparation to be successful. However, too many others have had a very different experience. The reduction in the achievement and in-terest gaps are needed to in order for Massachusetts to realize STEM for all.
Workforce AlignmentMassachusetts leads the nation in the proportion of our young adults enrolled in college (60% of residents 18–24 years old were enrolled in colleges/universities in 20116). However, we still face a “skills gap” as nearly half of the current job openings in Massachusetts require a college degree, and nearly half of those jobs require strong STEM knowledge and skills. In 2012, only 34% of the degrees and certificates granted by
public and private post-secondary institutions were in STEM fields, whereas 46% of the occupations that require a college degree (college labor market jobs) require high proficiency in at least one STEM field. Further, the expressed demand of employers through current online job postings reflects even stronger STEM demand—67% of posted jobs are targeted to STEM professionals. The occupations with the tight-est labor markets in Massachusetts all require STEM skills: computer & mathematical science occupations, healthcare practitioners and technicians, engineers, and business and financial operations occupations.7
6 Khatiwada, Ishwar, Walter McHugh, and Andrew Sum. Center for Labor Market Studies Northeastern University. August 2013. “The College Enrollment and College Degree Attainment Status of 18-24 Year Olds in Massachusetts, Each of the 49 States, and the U.S.: 2007–2009 and 2009–2001,” Prepared for the Massachusetts Department of Higher Education.
7 The Conference Board Help Wanted Online Press Release.
Leverage Points for Success
Equitable Opportunities for All StudentsEducators are the first-level implementers of the strategies that support the five goals. Research has determined attributes of high-quality instruction and the environment that educators need for this instruc-tion to occur.8,9 Attributes that support the teaching and learning of STEM in the classroom include using standards to guide instruction; a learning environ-ment that supports positive student attitudes toward “self, society, and science”;10 supporting instruction with hands-on, research-based curriculum materials; a safe physical space for instruction; and administra-tor support that values science as an important field of study for students, applies the learning of STEM content, concepts, and skills to real-world problems, and assesses students on the content learned and on what is valuable for a student to know to be STEM-literate. These attributes should be observed in all classrooms across the Commonwealth to support the STEM pipeline. We are encouraged by implementa-tion of these strategies; however we recognize that more needs to be done before we can fully declare success.
Multiple Access Points and Well-Defined Pathways to Enter the STEM PipelineSTEM is not a singular thing, and it should not have a singular trajectory for success. Traditionally—and most often—students are directed into certain math-ematics and science classes starting in middle school.
There is a need to move beyond the idea that there is a one-size-fits-all practice to engaging in STEM-enabled careers. To do this, there should be multiple entry points for someone to enter or return to the STEM sectors. Clearly defined pathways for different levels of education attainment and interests will help to communicate how to obtain STEM content and skills and reduce the barriers of entry.
The Department of Elementary and Secondary Education (DESE) and the Department of Higher
July 3, 2013
8 Reference Horizons Research (April 2013) on quality science instruction and NSTA
9 Weis, A. M. (2013). 2012 National Survey of Science and Mathematics Education: Status of middle school science. Chapel Hill, NC: Horizon Research, Inc.
10 http://www.nsta.org/about/positions/elementary.aspx
From May 2008 to May 2012, even during the worldwide economic downturn, Massachusetts gained 19,200 jobs in IT and Computer Science professions, 10,400 jobs in biology and health professions, and 6,600 jobs in math and physi-cal science-enabled professions.source: u.s. bureAu of LAbor stAtistics, occupAtionAL empLoyment stAtistics

A Foundation for the Future: Massachusetts’ Plan for Excellence in STEM Education14
Education (DHE) are in the early stages of collaborat-ing to review enrollment and persistence data of STEM majors at Massachusetts Institutions of Higher Education. This information will be combined with high school course enrollment data to provide a robust set of data from secondary school through higher education. This will result in the identification of patterns of who decides to enter post-secondary education as a STEM major, and who persists, to help articulate the various pathways of success for students.
Innovative Educator PreparationHighly skilled teachers in PreK through higher educa-tion are essential to engage and interest students in STEM subjects, to prepare students for success, and to support them to persist in rigorous programs of study.
Teacher preparation needs to support educators for the roles they will face in the classroom, which goes beyond content and pedagogy.
As teachers enter the classroom, continuous and ongoing professional development that is differenti-ated for the particular needs of each educator should be made widely available. Many educators across the
Commonwealth are looking to grow in the areas of implementing new standards, preparing students for new assessments, and understanding the new evaluation tools. Statewide professional development would help to train a small cohort of educators who can take this back to their regions and support one another.
The term “educator” is not limited to the teacher who is in front of the classroom every day. Out-of-school time providers and instructors in informal learning environments also support the development of STEM interest and engagement. The efforts of both in-school and out-of-school educators need to be aligned and supportive of each other. Joint profes-sional development can enhance these efforts and ensure that each education professional is reinforcing the same content, skills, and practices even if the delivery method looks different.
Nationally, movements like 100Kin10, Change the Equation, and Innovate+Educate are imploring businesses to invest in the development of highly ef-fective STEM teachers who are essential to increasing student interest, engagement, and achievement—all of which need to work in concert for students to be STEM-literate and prepared to enter STEM careers.11
Diversity in STEM Instructional StrategiesState standards for K–12 education detail what is recommended for students to know by the time they graduate high school. These standards provide a foundation for students to be college and career ready. The standards do not articulate which curricula or pedagogical strategies to use for student learn-ing. A state as innovative as Massachusetts should continue to be an incubator of new ideas to address this issue.
While strong advocates of STEM-related programs, like the arts and computer science, may not directly see their work articulated in state standards, they do provide important opportunities to engage students by offering lessons that connect to authentic applica-tions of curriculum.
The arts engage students at profound levels by requiring focus and concentration, developing aes-thetic rewards, and demanding high levels of perfec-tion. The creative process in the arts is closely aligned
11 Jolly, E.J, Campbell, P.B., & Perlman, L. (2004). Engagement, capacity, and continuity: A trilogy for student success. GE Foundation.
The importance of STEM education for our students to be successful in this new economy is undeniable, but we must be thoughtful in how we increase STEM opportunities for our kids. Specifically, we need to bolster our teacher preparation programs and our in service trainings to make sure that our teachers have the content knowledge necessary to deliver high-quality instruction.
—jeff riLey, superintendent LAwrence pubLic schooLs

15Version 2.0: Expanding the Pipeline for All
such as the students in Boston Arts Academy and the public schools in Canton.
Computer science is also another important STEM subject that is not specifically stressed in the five goals of the plan but is garnering more attention, es-pecially when the workforce preparation-opportunity gap is examined. Computer literacy enables learning across all disciplines, and technology companies remind us that students also should be exposed to computer science as an area of study to support student interest in this growing field.
With its focus on problem analysis and solution design, computer science provides students with critical computational thinking skills necessary to create and innovate in a society that is driven by technology. Whether it is creating animated stories, designing simulations and games, writing code for their own mobile app, configuring networks,
programming a robot to detect danger, solving a Cyber crime, or designing a method to analyze a big set of data, students in computer science classrooms explore their creativity as they learn to develop real-world solutions. Computer science also launches students on the pathway to jobs in one of the fastest-growing segments of the economy. Chris Stephenson, executive director of the Computer Science Teachers Association, states that “Computer science has become critical knowledge in the 21st
with the scientific inquiry method, as well as the skills needed for outlining, drafting, and writing an essay. Music or visual art have an extraordinary amount of built-in mathematics; they use patterns, sequences, fractions, and angles. Musical vibration, harmonics, and amplification as well as the use of light and color require scientific thought. Computer software is now part of all of the arts, whether it is music notation, media arts, dance choreography, theatrical lighting and staging, and visual arts design. The arts stimulate creative thinking and the knowledge that there is never just one “right” answer, but that there may be alternative ways of knowing and communicating. Engineering design cries out for artistic ways of think-ing and comprehending. In short, the arts often are an important entry point for STEM learning.
The arts provide a way of thinking, innovation, and creativity that is different from many other traditional disciplines. Art has the ability to engage and interest students who do not think of themselves as tradi-tional learners. For many learners, the combination of arts—especially in design or music—can support STEM learning: patterns, waves, light, colors, design, problem solving, and perspective. Teaching STEM through art has been successful for many students,
Imagination, invention and problem solving are as fundamental to science as they are to the arts. Creative strategies like envisioning, ideation and scenario building (otherwise known as ‘design thinking’) are increasing taught in MBA programs. These capacities are a great example of how education in the arts is linked to economic innovation. If you are looking only at the STEM fields, it’s easy to miss the inherent connection between arts and innovation. However, these visual competencies and creative abilities are vitally needed for the 21st-century innovation economy.
—dAwn bArret t, president mAssAchuset ts coLLege of Art & design
One 4th grade girl in an inner city school, frustrated with math during a math + music lesson on fractions said it best: ‘This is math and I am not good at math,’ and refused to even try the problems in front of her. Once the music angle was introduced, she quickly said, ‘Oh, this is music, I can do that,’ and promptly did all of the math problems correctly.
—jonAthAn rAppAport Arts | LeArning
A Foundation for the Future: Massachusetts’ Plan for Excellence in STEM Education16
century, and countries across the world are gearing up to ensure that their students can compete in the global economy.”12 One in every two STEM jobs will be in computing. Massachusetts can lead in preparing our students to fill the nearly 1.4 million nationwide job openings in computer science by 2020. We can begin now to prepare our students and our state for future economic success by implementing rigorous computer science curriculum and units of study in grades K–12.
Massachusetts vocational and technical schools also provide another model of STEM education for students. These schools are an excellent example of combining STEM content with real-world training. No governor has ever addressed education in a more comprehensive manner than Governor Patrick, and no lieutenant governor has ever focused so much time on the importance of vocational-technical edu-cation than former Lieutenant Governor Murray, who visited all 64 schools with Chapter 74 programs.
With sixty-four Chapter 74 programs serving 44,000 students statewide, every region of the state is impacted by vocational programs and their gradu-ates. The workforce training component and regional economic benefits of these schools need to be recognized for their achievements. With the skills gap widening across the country, Massachusetts’ vocational-technical programs are providing students with essential and valuable workforce training skills. We need to ensure that together—across govern-ment and in partnership with the private sector—we are promoting and improving the network of vocational-technical schools in Massachusetts. The quality of instruction at these schools more often than not leads to higher graduation rates and MCAS scores; this level of success is a model worth replicat-ing and expanding.
Vocational-technical schools enhance, rather than limit, a student’s career and educational oppor-tunities. Many of the programs emphasize STEM education while putting students on a path for apprenticeship training and providing them with the expertise our workforce demands. As we prepare the next generation for academic and career success, education is the greatest asset that will open oppor-tunities for students. Our vocational-technical schools will continue to serve as a significant tool in closing
12 http://www.computinginthecore.org/newsroom/senators-casey-and-rubio-introduce-legislation-to-bolster-K–12-compute
the achievement gap and the skills gap by training and preparing our students to compete in the 21st century global economy.
Together former Lieutenant Governor Murray, the Patrick Administration, and vocational and techni-cal school personnel have strengthened linkages across education systems; developed apprenticeship articulation agreements; invested in infrastructure upgrades; improved the public image of vocational and technical education programs; and provided vocational and technical school officials a voice on many boards and commissions.
All students can benefit from strategies used to teach STEM subjects to English language learners and special needs students. Instructional techniques include being student-centered, providing hands-on-experiences, providing opportunities to demonstrate learning through multiple ways, and having students teach each other. These are not just good practices for certain populations of students; these strategies can work for all students.
Achieving ScaleThe central theme of A Foundation for the Future: Massachusetts Plan for Excellence in STEM Education (2010) is that all students must have access to high-quality STEM education and the supports necessary to achieve successful outcomes. We are committed to the principle that all learners deserve equitable access to high-quality learning opportunities and support services from PreK through post-secondary education. To realize this for all students in all com-munities to create a world-class workforce for all companies will require a scale of operation beyond our current design.
Achieving scale will be one of the key challenges that Massachusetts must address in this next phase of implementation of the state’s STEM initiative. Scale must be defined both quantitatively and qualitatively. When securing funding, planning programs, and building capacity we must be clear about the number of students that must be engaged at all grade levels as well as the teachers/classrooms/learning experi-ences and other activities needed to support those students. We must also address what resources are necessary to provide a high-quality learning experi-ence for all students who represent many different academic readiness levels, education backgrounds, and cultural norms and aspirations.
17Version 2.0: Expanding the Pipeline for All
Cultivating Private-Public PartnershipsEmployers are faced with a daunting problem: There is a substantial gap between the numbers of projected future jobs requiring STEM skills and the projected supply of qualified workers to fill them.13 Employers need to know that there is a plan to fill the pipeline of workers with the skills necessary to fill those jobs. That is why businesses are involved with STEM public policy. Investing in STEM is a workforce issue and an economic development issue. Businesses invest in STEM education in a variety of ways: financially supporting STEM projects such as those in the @Scale program; offering volunteers, mentors and equipment; and providing jobs, intern-ships, and externships so students can earn while they learn and see firsthand the value of a STEM education and a STEM experience. In each instance, employers seek to inspire students and promote science identity in all children so they are prepared to compete and succeed in a global economy.
Implementation of the STEM PlanThis plan reflects the value of STEM to the people of Massachusetts: (1) to provide Massachusetts with a continuum of highly qualified and diverse workers that matches the employment opportunities of the local economy and (2) to provide an education to all students to be scientifically literate in order to make civically, socially, and environmentally responsible decisions.
The five goals of this plan represent what is needed to continue to catalyze action that is implemented at the local level.14
1. Student Interest2. Student Achievement3. Skilled Educators4. Post-secondary STEM Preparation5. Employment Opportunities
13 Massachusetts Department of Higher Education. Time to Lead: The Need for Excellence in Public Higher Education (Vision Project Annual Report), September 2012.
14 STEM Plan 1.0 had six goals. Student achievement and college and career readiness have been combined in STEM Plan 2.0.
The following pages describe a plan to build on the successes of 1.0 and achieve this articulated vision. The plan is structured as follows:
GoalsSimilar to the goals in the original STEM Plan, a series of goals are outlined. They have been modified slightly based on learning from the years since 1.0 was released. These goals represent aspects of achievement, which will support fulfillment of this vision.
BenchmarksEach goal has a corresponding macro-level indicator which, if achieved, represents clear positive move-ment towards reaching the stated goal. These bench-marks are taken from STEM Plan 1.0. 1.0 was written to be a five-year plan which set goals from 2010 through 2016. 2.0 revises these goals and provides us with an update on where we are in year three during this five-year process.
Priority AreasTo meet the core benchmark and work toward STEM goals, several priority areas are articulated to help to focus efforts towards key outcomes.
Recommended StrategiesTo meet the desired outcomes of each goal, the plan articulates several strategies to support the realiza-tion of the benchmark and goal. These strategies are provided as suggestions of what a local region can choose to do if it is exploring ways to make progress on a particular goal.
MetricsSeveral data sources have allowed for tracking prog-ress toward STEM goals and benchmarks. The plan also suggests new resources or data sets that could support further understanding and measurement of progress toward goals and provide indicators that could be used to inform best practice, program successes, as well as growth areas. The UMass Donahue Institute, on behalf of the STEM Advisory Council, will collect available data and will establish data agreements with agencies that are already collecting this information.

A Foundation for the Future: Massachusetts’ Plan for Excellence in STEM Education18
BenchmarkIncrease interest in STEM college majors among college-going MA public school graduates from 35% in 2009 to 45% by 2016.15
Total STEM interest among MA public school SAT-takers increased slightly from 2008 to 2012 (from about 37% in 2008 to about 39% in 2012). Total STEM interest increased more among female SAT-takers than among males, with female STEM interest going from about 34% in 2008 to about 37% in 2012, indicating that the gap in total STEM interest between girls and boys has decreased. The interest in STEM for African-Americans, Latinos, and whites has increased slightly since 2008 by 1% to 2% for each group.
Priority Areas z Break through the interest gap
{ Increase interest among the underrepresented gender and underrepresented races/ethnicities in fields where data indicate interest gaps.
z Highlight STEM career opportunities { Increase interest in fields where STEM knowl-edge and skill are expected to expand across occupations/industries in the future.
15 This change is reflective of the change in the way the data has been recalculated to include more majors in the definition of STEM.
Goal 1: Increase student interest in STEM areas.
The School Union #28 Community Network for Children Program (CNC) incorporates STEM activities into many aspects of the rural, community-based program for young children and their families. We meet at the Northfield Mountain Recreation Center to engineer and build “houses” in the natural, outdoor play space or make messy mixtures and ask questions about why oobleck acts the way it does if we add more water or cornstarch. During one of our after-school collaborations with the local library and local cultural council children investigate solar power and how to create circuits to power light bulbs from solar panels. The CNC Story Hour facilitator sings songs and rhymes with children, developing and exposing them to rhythm and patterns, beginning to build mathematical skills such as patterning and sequencing. One of the most important aspects of our programs is to provide the opportunity for children to play and for us to model for parents how to create opportunities for discovery and exploration and to for them to recognize their role as their child’s first teacher.
—giLLiAn budine cnc progrAm coordinAtor

19Version 2.0: Expanding the Pipeline for All
Recommended Strategies z Early exposure
{ Engage families with preschool age children. The Department of Early Education and Care is using Coordinated Family and Community Engagement (CFCE) programs to support family engagement and direct them to community resource, such as libraries, museums, or nature centers.
z Don’t keep it a secret { Refer to STEM activities and exposure as science, technology, engineering, and/or mathematics in early educational experiences so young children associate engaging and fun activities with science.16
{ Increase public awareness of STEM to inform the public about post-secondary STEM career op-portunities in high-need fields, such as manufac-turing, information technology, and healthcare, across all skill levels.
z Facilitate exploration { Establish formal programs in PreK–16 schools that facilitate STEM career exposure, explora-tion, education, and planning that include STEM activities, fields, role models, and careers. One example of this is the state’s Your Plan for the Future site, which connects students with all of these resources.17
z Facilitate access { Work with guidance counselors and Parent Teacher Associations to increase parent, guardians, and student awareness of financial aid options—including how to fill out FASFA and apply for scholarship opportunities and grants—and educate parents, guardians, and students on the financial and job security benefits of careers in STEM.
16 Akerson, V.L., Buzzelli, C.A., & Donnelly, L.A. (2010). On the nature of teaching nature of science: Preservice early childhood teachers’ in-struction in preschool and elementary settings. Journal of Research in Science Teaching, 47(2), 213-233.
17 https://www.yourplanforthefuture.org
Metrics z Currently available data sources
{ Continue to use the SAT registration questionnaire to capture students’ interest in majors.
z Recommended data sources { Use PSAT-SAT matched data to look at changes in interest as students get closer to leaving the K–12 system.
{ Use available labor market data to evaluate trends in future employment areas.
{ Add an MCAS survey question to capture stu-dent interest across the state at multiple points of time.
{ Use existing or assist in the development of a common student interest survey tool in order to compare impact on student interest across various programs.
Science from Scientists is an organization that complements classroom instruction with hands-on lessons taught by real, charismatic scientists. This academic year, the program will reach 2,500 students in 20 partner schools across Greater Boston. In addition to their during-school program, they offer various science outreach activities and programs that serve over 3,000 students across Massachusetts each year.

A Foundation for the Future: Massachusetts’ Plan for Excellence in STEM Education20
BenchmarkIncrease the percentage of all students who score proficient or advanced on the MCAS mathematics and science and technology/engineering assess-ments by 20 points by 2016.18
In mathematics, there has been an increase in the percentage of students scoring proficient or higher at all grade levels except in grade 6, where it remained unchanged. The achieve-ment gap for Latino and African-American students decreased on the mathematics MCAS exams at all grade levels, with the exception of African-American students at grade 5, from 2009 until 2013. The gap between low-income students and non-low-income students has also decreased at all levels, with the exception of no change for grade 4 students.
In science and technology/engineering (STE), there has been a 10% increase in students scor-ing proficient or higher at the high school level. The achievement gap for Latino and African-American students decreased at all grade levels between 2009 and 2013. The gap between low-income students also dropped for all grade levels during this time.
18 STEM Plan 1.0 goals 2 (student achievement) and 3 (college readiness) have been combined in STEM Plan 2.0. The rationale for doing so is that an increase in the percentage of students who dem-onstrate readiness for post-secondary pathways, including STEM careers, STEM degrees, and being informed citizens, is an outcome of student achievement.
Goal 2: Increase student achievement among all PreK–12 students in order to prepare graduates to be civically and college and/or career ready.
Table 1: % of Students Scoring Proficient or Advanced on MCAS
MCAS DataMath 2009
Math 2013
Math 2016 target
Grade 5 54% 61% 74%Grade 8 48% 55% 70%High School 75% 80% 85%All Students (incl. gd. 3 math) 59% 65% 76%
MCAS DataSTE
2009STE
2013STE
2016 targetGrade 5 49% 51% 69%Grade 8 39% 39% 59%High School 61% 71% 72%All Students 50% 54% 67%
21Version 2.0: Expanding the Pipeline for All
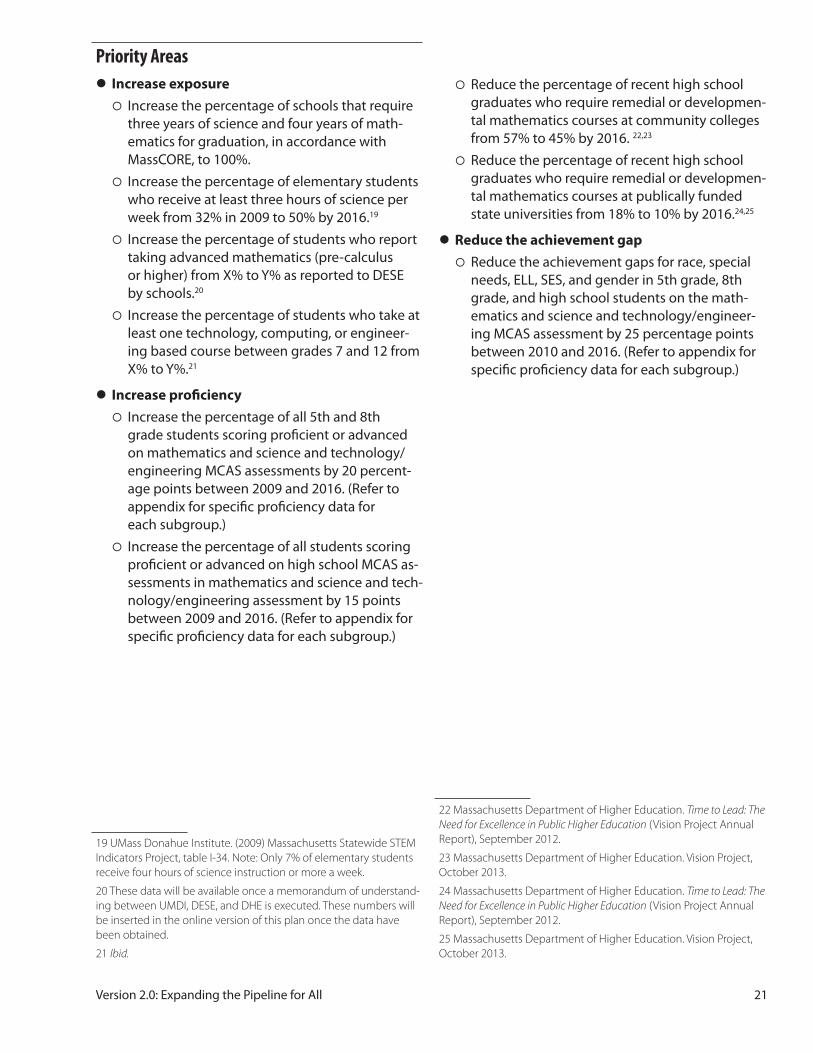
Priority Areas z Increase exposure
{ Increase the percentage of schools that require three years of science and four years of math-ematics for graduation, in accordance with MassCORE, to 100%.
{ Increase the percentage of elementary students who receive at least three hours of science per week from 32% in 2009 to 50% by 2016.19
{ Increase the percentage of students who report taking advanced mathematics (pre-calculus or higher) from X% to Y% as reported to DESE by schools.20
{ Increase the percentage of students who take at least one technology, computing, or engineer-ing based course between grades 7 and 12 from X% to Y%.21
z Increase proficiency { Increase the percentage of all 5th and 8th grade students scoring proficient or advanced on mathematics and science and technology/engineering MCAS assessments by 20 percent-age points between 2009 and 2016. (Refer to appendix for specific proficiency data for each subgroup.)
{ Increase the percentage of all students scoring proficient or advanced on high school MCAS as-sessments in mathematics and science and tech-nology/engineering assessment by 15 points between 2009 and 2016. (Refer to appendix for specific proficiency data for each subgroup.)
19 UMass Donahue Institute. (2009) Massachusetts Statewide STEM Indicators Project, table I-34. Note: Only 7% of elementary students receive four hours of science instruction or more a week.
20 These data will be available once a memorandum of understand-ing between UMDI, DESE, and DHE is executed. These numbers will be inserted in the online version of this plan once the data have been obtained.
21 Ibid.
{ Reduce the percentage of recent high school graduates who require remedial or developmen-tal mathematics courses at community colleges from 57% to 45% by 2016. 22,23
{ Reduce the percentage of recent high school graduates who require remedial or developmen-tal mathematics courses at publically funded state universities from 18% to 10% by 2016.24,25
z Reduce the achievement gap { Reduce the achievement gaps for race, special needs, ELL, SES, and gender in 5th grade, 8th grade, and high school students on the math-ematics and science and technology/engineer-ing MCAS assessment by 25 percentage points between 2010 and 2016. (Refer to appendix for specific proficiency data for each subgroup.)
22 Massachusetts Department of Higher Education. Time to Lead: The Need for Excellence in Public Higher Education (Vision Project Annual Report), September 2012.
23 Massachusetts Department of Higher Education. Vision Project, October 2013.
24 Massachusetts Department of Higher Education. Time to Lead: The Need for Excellence in Public Higher Education (Vision Project Annual Report), September 2012.
25 Massachusetts Department of Higher Education. Vision Project, October 2013.

A Foundation for the Future: Massachusetts’ Plan for Excellence in STEM Education22
Recommended Strategies z Couple STEM with content related to citizenship and Massachusetts’ innovation economy
{ Identify instructional STEM materials that contextualize content in the areas of contem-porary issues in order to prepare students to be informed citizens and engaged in STEM-based issues after completion of secondary school.
z Use research-based instructional methods, practices, and curricula
{ Use hands-on, project based learning curricula and instructional materials to support high-quality instruction in STEM courses.26
{ Document numbers of hours spent on elementary science/engineering/technology instruction and locally determine if this supports high-quality instruction and promotes student learning.
{ Provide opportunities for students do capstone projects in high school senior STEM classes.
z Align learning with career-based skills { Work with industry to communicate skills needed for entry-level positions through posi-tions requiring graduate degrees.
{ Increase the number of internships and summer research programs for middle school through college students by having schools build and expand current partnerships with local industry.
{ Continue to measure achievement of 21st cen-tury skills via surveys and assessments.
26 Trygstad, P.J., Smith, P.S., Banilower, E.R., & Nelson, M.M. (2013). The status of elementary science education: Are we ready for the next generation science standards? Retrieved from http://www.horizon-research.com/2012nssme/wp-content/uploads/2013/06/The-Status-of-Elementary-Science-Education_paper.pdf
Metrics z Currently available data
{ Use MCAS achievement data. { Collect SAT data measuring course enrollment for science and mathematics classes.
{ Obtain student-level course enrollment data that are reported to DESE by schools.
{ Obtain school-level information about course offerings that are reported to DESE and merged with course enrollment data.
{ Analyze disaggregated data looking at improve-ment of similar sub-groups at different types of schools, such as vocational educational schools, vocational educational programs within tradi-tional schools, low-resourced schools, and MCAS score achievement levels.
z Recommended data { Survey instructors of freshman STEM-related courses at the 29 public higher education cam-puses about the quality of their skills, practices, and content knowledge of incoming students.
{ Collect state-level K–12 assessment data.

23Version 2.0: Expanding the Pipeline for All
Goal 3: Increase the percentage of skilled educators who teach PreK–16 STEM classes.
BenchmarkIncrease the number/percentage of STEM classes led by skilled educators from PreK–16 by 2016.27
The vast majority of STEM teachers in MA pub-lic schools meet the federal definition of being “highly qualified.” However, the percentage of teachers at low-income schools who meet the highly qualified standard is measurably lower than the percentage at high-income schools. That being said, the percentage of teachers at low-income schools who are highly qualified increased much more from 2008–2012 than the percentage at high-income schools, result-ing in a decrease in the gap between low- and high-income schools in this area. Going forward, this measure will not only analyze licensure data but will also incorporate data from MA Educator Effectiveness tools.
27 This goal has changed from effective educators to skilled educa-tors in order to distinguish from the definition of effective that is currently being used for teacher evaluation at the K–12 level.
Priority Areas z Early Childhood Educators
{ Increase the number and percentage of certified or credentialed early education providers.
{ Increase the percentage of early childhood providers who follow the Massachusetts Early Childhood Science, Technology, and Engineering Standards.
{ Increase the number of hours early childhood educators report taking STEM-focused profes-sional development.
{ Increase the percentage of early educators who are trained on QRIS and implement the science, technology, and engineering standards after ratification.
z Elementary Educators { Increase pass rates of K–5 educators on the mathematics subtest of the elementary Massachusetts Tests for Educator Licensure (MTEL).
{ Encourage K–5 educators to become certified in science.
{ Increase number of STEM teacher practitioner programs, as measured by an increase in specific elementary mathematics and science methods courses.
{ Increase the number of students enrolled in STEM teacher practitioner programs.
{ Increase the number of hours PreK–5 teachers report taking STEM-focused professional development.
DEEC offers STEM professional development through the Educator and Provider Support (EPS) grantees and Readiness Centers. Additionally, DEEC is writing a Request for Response to identify innovative STEM curricula. Both initiatives support goals of STEM Plan 2.0 and show DEEC’s alignment to the state’s STEM goals.

A Foundation for the Future: Massachusetts’ Plan for Excellence in STEM Education24
z Post-secondary Educators { Increase the percentage of faculty members who report that they participate in professional development on annual faculty reviews.
{ Use professional development participation for tenure review decisions.
{ Increase in retention rates of students in fresh-man STEM courses.
{ Increase the number of PreK–12 teachers who are deemed exemplary or proficient that come out of MA teacher practitioner programs.
z Out-of-School Time (OST) Educators { Increase the number of professional develop-ment hours OST providers spend in STEM- based training.
{ Increase the number of hours OST programs report on providing STEM support.
Recommended Strategies z Tailor and align professional development opportunities
{ Encourage PreK through college educators to become proficient in current mathematics and science (including technology and engineering) methods by offering professional development that is specifically designed for each audience. This is currently being supported through Educator and Provider Support grantees and Readiness Centers.
z Secondary Educators { Increase the percentage of STEM secondary educators rated exemplary or proficient in the Massachusetts Educator Evaluation system.
{ Increase the percentage of STEM secondary teachers with at least five years of experience who move from being rated proficient to exemplary.
{ Increase student achievement growth rates. This factor is locally determined by the school district and is reported as part of the Educator Evaluation Tool.
{ Increase MTEL pass rates for STEM subject tests. { Increase the number of STEM educators with multiple STEM certifications and in the number of technology/engineering endorsements granted.
{ Decrease the number and percent of waivers for teachers teaching STEM who do not have an appropriate STEM license.
It is clear that ongoing professional development is expected and rewarded in the School for the Environment and the College of Science and Mathematics during the an-nual faculty report review and the tenure review processes. Participation in and quality of professional development activities is hard evidence that faculty members are striving to increase their ability to conduct impactful research, teaching, and service.
—robert f. chen, ph.d., fuLL professor; chAir of depArtmentAL personneL commit tee; former chAir of coLLege personneL commit tee university of mAssAchuset ts boston
The Massachusetts Kindergarten Entry Assessment (MKEA) project asks public kindergartens to make use of the same research/evidence-based formative assessments that preschool programs are currently using. This will encourage more alignment between preschool and kindergarten.

25Version 2.0: Expanding the Pipeline for All
{ Assist educators in understanding how PreK through post-secondary standards, skills, and practices are vertically and horizontally aligned.
{ Offer joint in-service, pre-service, and OST pro-fessional development opportunities in order to better align and support everyone’s efforts for the improvement of the child.
{ Tie PreK–16 educator professional development programs to teacher effectiveness through the collection of participation data.
{ Create a culture of high-quality professional development for higher education faculty at post-secondary campuses that focuses on peda-gogy and pedagogical content knowledge to increase student retention rates and graduation rates. The University of Massachusetts Boston’s College of Science and Math can be looked to as a model for how to encourage this at other public higher education institutions.
z Connect pre-service teachers to STEM { Provide data to pre-service teachers of job open-ings to inform them about the high demand for STEM teachers to encourage pursuit of STEM as an area of study.
{ Offer general science degrees at post-secondary institutions that are interdisciplinary in nature and reflect the content needs of primary school teachers of science.
{ Connect pre-service teachers with out-of-school program providers prior to student teaching.
z Design innovative professional development programs for educators to promote educator growth.
{ Encourage teacher practitioner programs look at different models of practicum work.
{ Increase the number of teacher externships or teacher research experiences, such as the National Science Foundation’s Research Experiences for Teachers.
{ Connect student and teacher outcomes to teacher practitioner programs in order to have a practitioner program effectiveness measure.
Metrics z Currently available data
{ Use MA Educator Effectiveness tools to measure K–12 teacher impact on instruction.
{ Collect MTEL data. { Collect professional development hours data from the Educator Licensure and Recruitment database that is managed by DESE.
{ Use data from DHE’s Vision Project annual reports for higher education retention data.
z Recommended data { Update and use the Status of Educator Workforce report from the MA Department of Higher Education to determine the quality of STEM teacher preparation.
{ Use Quality Rating and Improvement System (QRIS) data to assess implementation of STEM in early education and Out-of-School Time programs.
The College Board, Mass Insight, and the Boston Science Partnership all have developed models of vertical and horizontal teaming. These professional development op-portunities bring teachers from different grade levels within a discipline or across disciplines within the same grade level to make connections between the content that they teach.

A Foundation for the Future: Massachusetts’ Plan for Excellence in STEM Education26
Goal 4: Increase the percentage of students completing post-secondary degrees or certificates in STEM subjects.
BenchmarkIncrease the percentage of students who complete STEM-related post-secondary degrees and certificates at public and private institutions by 50% from 2008 to 2016.
The number of STEM bachelor’s degrees earned by students at MA public and private colleges increased about 28% from 2007 to 2011. The increase in the number of STEM bachelor’s degrees earned by women was almost 32%, compared to about 23% for men, indicating that the gender gap in STEM degree attainment is closing. In addition, the number of STEM bachelor’s degrees earned by non-white students increased by almost 29%, compared to about 27% for white students, indicating that the race/ethnicity gap is closing at this level as well.
Priority Areas z Increase and support STEM post-secondary credential attainment
{ Increase the percentage of bachelor’s degrees awarded in STEM fields28 from 23% in 2009 to be 50% of all degrees awarded in 2016. Increase the percentage of associate’s degrees and “less-than-bachelor’s” certificates in STEM fields by 50% by 2015.
{ Inform students of local or regional voca-tional and technical education programs to increase access and awareness of STEM career opportunities.
z Bridge the credential attainment gap { Increase the percentage of bachelor’s and asso-ciate’s degrees in STEM majors granted from 4% to 10% for African-Americans and from 4% to 10% for Latinos of all STEM degrees conferred.
{ Increase the percentage of computer science and engineering bachelor’s degrees earned by women from 17% to 25% in computer science and from 23% to 35% in engineering.
{ Increase the percentage of health science de-grees earned by men from 15% to 25%.
28 See Appendix for degrees classified as STEM.

27Version 2.0: Expanding the Pipeline for All
Recommended Strategies z Align secondary to post-secondary pathways
{ Continue collaboration between Department of Elementary and Secondary Education (DESE) and the Department of Higher Education (DHE) to identify pathway of success for students who choose to enter and persist in STEM fields.
{ Improve feeder patterns of students and improve articulation agreements among community colleges and four-year institutions. Encourage the development of programs in which community college students participate in their feeder four-year institutions.
{ Encourage adult under- and unemployed to reemploy in new careers in STEM occupations through the attainment of post-secondary credentials.
z Promote best practices that target student engagement and relevancy of content
{ Increase the number of research and internships available for higher education students at local industries and businesses.
{ Reduce the number of remediation courses needed by developing summer bridge or dual-enrollment programs, or by participating in the Commonwealth Dual Enrolment Program.
{ Explore small-group instructional support strategies, like facilitated study-groups or cohort models, to increase student achievement and student support networks.
{ Look for successful models, such as the ef-forts by the Latino STEM Alliance, and review literature, such as Succeeding in the City: A Report from the New York City Black and Latino Male High School Achievement Study, that shows persistence of minority students in STEM to dis-seminate throughout the Commonwealth.29,30
29 http://www.latinostem.org
30 http://www.gse.upenn.edu/equity/nycReport
Priority Areas z Increase and support STEM post-secondary credential attainment
{ Increase the percentage of bachelor’s degrees awarded in STEM fields28 from 23% in 2009 to be 50% of all degrees awarded in 2016. Increase the percentage of associate’s degrees and “less-than-bachelor’s” certificates in STEM fields by 50% by 2015.
{ Inform students of local or regional voca-tional and technical education programs to increase access and awareness of STEM career opportunities.
z Bridge the credential attainment gap { Increase the percentage of bachelor’s and asso-ciate’s degrees in STEM majors granted from 4% to 10% for African-Americans and from 4% to 10% for Latinos of all STEM degrees conferred.
{ Increase the percentage of computer science and engineering bachelor’s degrees earned by women from 17% to 25% in computer science and from 23% to 35% in engineering.
{ Increase the percentage of health science de-grees earned by men from 15% to 25%.
28 See Appendix for degrees classified as STEM.
Metrics z Currently available data
{ Continue to have UMass Donahue Institute update the Integrated Postsecondary Education Data System (IPEDS).
{ Collect joint DESE-DHE data on dual-enrollment student credits issued.
z Recommended data { Analyze DHE data to determine increase of stu-dents transferring from community colleges to four-year institutions and the number of credits that transferred over in STEM courses.
{ Track number of public high school students who choose to stay in Massachusetts and major in STEM compared to student who attend school out-of-state.
{ Analyze data of students who choose to enter/leave a STEM major.
{ Disaggregate data of current post-secondary students to compare those who graduated from a Massachusetts high school vs. non-Massachu-setts high school.
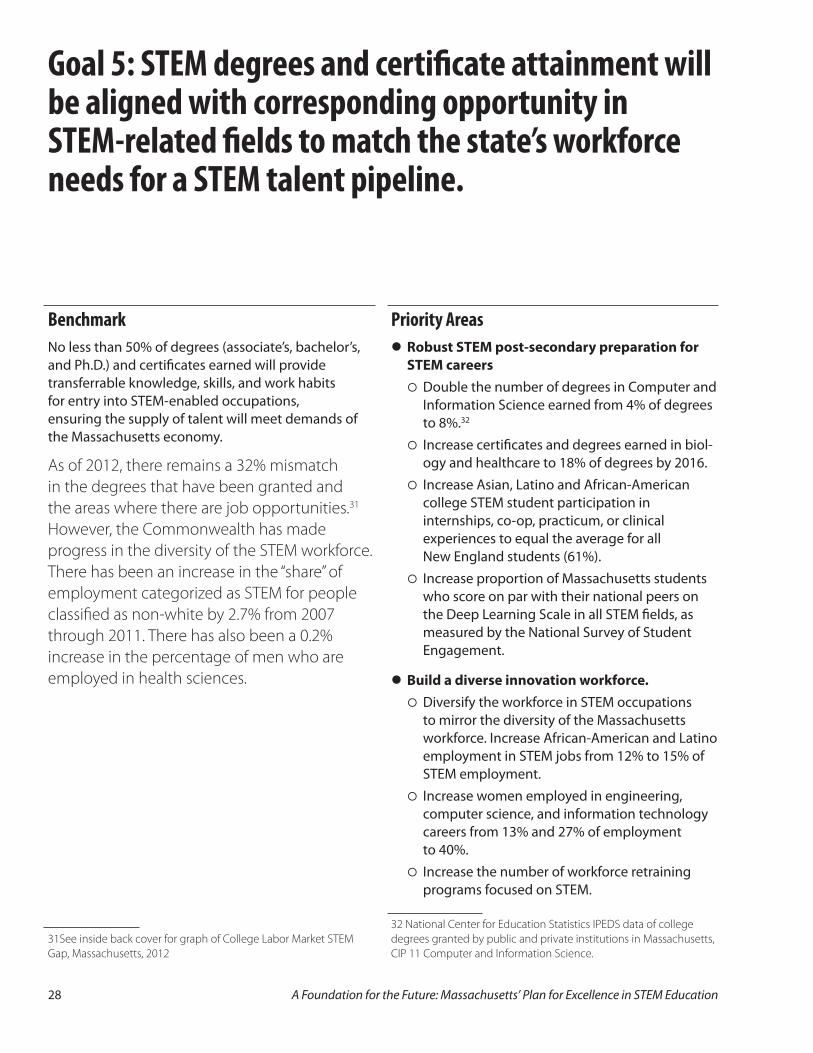
A Foundation for the Future: Massachusetts’ Plan for Excellence in STEM Education28
Goal 5: STEM degrees and certificate attainment will be aligned with corresponding opportunity in STEM-related fields to match the state’s workforce needs for a STEM talent pipeline.
BenchmarkNo less than 50% of degrees (associate’s, bachelor’s, and Ph.D.) and certificates earned will provide transferrable knowledge, skills, and work habits for entry into STEM-enabled occupations, ensuring the supply of talent will meet demands of the Massachusetts economy.
As of 2012, there remains a 32% mismatch in the degrees that have been granted and the areas where there are job opportunities.31 However, the Commonwealth has made progress in the diversity of the STEM workforce. There has been an increase in the “share” of employment categorized as STEM for people classified as non-white by 2.7% from 2007 through 2011. There has also been a 0.2% increase in the percentage of men who are employed in health sciences.
31See inside back cover for graph of College Labor Market STEM Gap, Massachusetts, 2012
Priority Areas z Robust STEM post-secondary preparation for STEM careers
{ Double the number of degrees in Computer and Information Science earned from 4% of degrees to 8%.32
{ Increase certificates and degrees earned in biol-ogy and healthcare to 18% of degrees by 2016.
{ Increase Asian, Latino and African-American college STEM student participation in internships, co-op, practicum, or clinical experiences to equal the average for all New England students (61%).
{ Increase proportion of Massachusetts students who score on par with their national peers on the Deep Learning Scale in all STEM fields, as measured by the National Survey of Student Engagement.
z Build a diverse innovation workforce. { Diversify the workforce in STEM occupations to mirror the diversity of the Massachusetts workforce. Increase African-American and Latino employment in STEM jobs from 12% to 15% of STEM employment.
{ Increase women employed in engineering, computer science, and information technology careers from 13% and 27% of employment to 40%.
{ Increase the number of workforce retraining programs focused on STEM.
32 National Center for Education Statistics IPEDS data of college degrees granted by public and private institutions in Massachusetts, CIP 11 Computer and Information Science.

29Version 2.0: Expanding the Pipeline for All
Recommended Strategies z Ensure alignment of educational opportunities with shifts in workforce demand
{ Build new and expand current public/private partnerships with industry, government agen-cies and post-secondary institutions to ensure that shifts and changes in modern workforce needs are reflected in educational and training opportunities in STEM fields.
{ Utilize thorough and robust labor market projection analysis and align educational and training resources with talent demand growth.
z Connect STEM learning with modern civil society and workforce
{ Students should be encouraged to learn how to use STEM tools in all fields in order to develop transferable skills across sectors.
{ Encourage liberal arts majors to minor or receive a certificate in a STEM field in order to diversify their skill set.
{ Increase communication to high school, col-lege, and unemployed/underemployed adults of the job opportunities that are available in Massachusetts and the skills needed to obtain these jobs.
{ Increase mentoring programs for underrepre-sented groups.
z Support skill growth for current workforce { Encourage adult unemployed to reemploy in new careers in STEM occupations through the attainment of post-secondary credentials.
{ Assist non-native residents in acquiring lan-guage and other skills to capture the innovation and education that they bring with them when they move here.
{ Assist new residents to become “re-cred- entialed” in areas that they have already received training.33
{ Look for models of innovative financial support programs to help people pay for training programs.
{ Encourage employers to increase the number of internships and co-ops for adults participating in training programs that are offered throughout the year.
Metrics z Currently available data
{ Compare the mix of STEM degrees and certificates earned (IPEDS) to the mix of STEM occupations in college labor market jobs (BLS Occupational Employment Statistics) and to the mix of job openings posted online (HWOL). Look at participation rates in internship, co-op, practicum, or clinical experience opportunities for students, disaggregated by fields of study, gender, and race, through National Survey of Student Engagement (NSSE) data.
{ Use college NSSE data to track relative score on deep learning scale by major field for New England compared to the nation. (Deep Learning Scale questions are included in the Appendix.)
z Recommended data { Analyze data on economic outcomes from non-degree certificates completed in STEM fields.
{ Begin to collect STEM career and vocational ed-ucation program completion rates at career and technology high schools and comprehensive high schools across the state in a unified way.
{ Use apprenticeship completion data for STEM trades.
33 Nineteen percent (19%) of college-educated immigrants are either unemployed or underemployed. Their involvement in the workforce increases our tax basis, quality of life for their children, and diversity of workforce, as well as provides a strategy for strengthen-ing the output side of the STEM pipeline.
Educating the workforce of the future in the STEM fields is crucial to the success of the biotechnology industry. The recent expansion of local STEM programs will serve as a catalyst to put the Berkshires on the map as a life science hub in Massachusetts.
—pAtrick murAcA nucLeA biotechnoLogies, pit tsfieLd, mA

A Foundation for the Future: Massachusetts’ Plan for Excellence in STEM Education30
Phased Implementation
Going forward, we will focus intently on the meaning of “Excellence in STEM Education” as reflected within the title of this Massachusetts STEM Plan. Our challenge and opportunity is to realize the principle that STEM education is for all students from all communities in all regions of the Commonwealth throughout their learning and working lifetime. We agree that in education and workforce development, “Equity is the next level of excellence for Massachusetts [and the country].” 34
Massachusetts’ statewide STEM Plan, A Foundation for the Future: Massachusetts Plan for Excellence in STEM Education (STEM Plan), first released in 2010, provided a framework to convene constituencies from every corner of the Commonwealth, including educators, employers, industry and government leaders and not-for-profit partners. This coming together of multiple stakeholders resulted in former Secretary of Education Paul Reville referring to Massachusetts’ collective action as a “movement” to advance STEM education in his remarks at the ninth annual STEM Summit.
34 Wiener, Ross. Commonwealth Collaborations Meeting: The Common Core and Higher Education. College of the Holy Cross. Hogan Center Ballroom, Worcester, MA. 27 September 2013.
This second release (V2.0) of the STEM Plan reports progress achieved since 2010, incorporates new information about promising education practices, provides updated benchmarks, references new data sources and trend analysis, and suggests strategies to accomplish the goals and promote broader and deeper collaboration among Massachusetts extended STEM community. The hallmark of V2.0 will be to advance and accelerate the STEM movement already visibly underway in classrooms, campuses, regional community groups and employers throughout the Commonwealth, identify research-based best edu-cational practices, attain statewide scale-of-imple-mentation, and effectively manage public/private investments to achieve targeted outcomes framed by the goals of the plan and validated through data.
Version 3.0 of the STEM Plan, scheduled for 2016, will focus on sustaining our successes statewide while identifying new innovations and targeting expanded opportunities for the benefit of every resident and employer in the Commonwealth.
The Governor’s STEM Advisory Council will continue to update the plan every three years, with a summa-tive report in planned for 2020.

31Version 2.0: Expanding the Pipeline for All
Appendix A Progress From STEM Plan 1.0 Through Today
Goal 1: STEM Interest
0%
10%
20%
30%
40%
50%
60%
70%
80%
90%
100%
WhiteHispanicAfrican-American
Asian
0%
10%
20%
30%
40%
50%
60%
70%
80%
90%
100%
FemaleMaleAll
38.9% 37.0%41.1%
2008
2010
2012
2008
2010
2012
2008
2010
2012
0%
10%
20%
30%
40%
50%
60%
70%
80%
90%
100%
FemaleMaleAll
78.2% 78.4%78.6%
2008
2010
2012
2008
2010
2012
2008
2010
2012
53.0%
41.8%36.8%
43.3%
200820102012
200820102012
200820102012
200820102012
0%
10%
20%
30%
40%
50%
60%
70%
80%
90%
100%
ScienceMathScienceMath
62%
86%80%
48%
200820102012
200820102012
200820102012
200820102012
Low-Income Non-Low-Income
0%
10%
20%
30%
40%
50%
60%
70%
80%
90%
100%
ScienceMathScienceMath
30%
65%55%
20%
200820102012
200820102012
200820102012
200820102012
Low-Income Non-Low-Income
0%
10%
20%
30%
40%
50%
60%
70%
80%
90%
100%
ScienceMathScienceMath
36%
69% 66%
28%
200820102012
200820102012
200820102012
200820102012
Low-Income Non-Low-Income
1
2
3
4
5
8
0
3,000
6,000
9,000
12,000
15,000
FemaleMaleAll
14,574
7,7446,830
2007
2009
2011
2007
2009
2011
2007
2009
2011
13
0%
5%
10%
15%
20%
25%
30%
FemaleMaleAll
13.7% 14.0%13.4%
2007
2009
2011
2007
2009
2011
2007
2009
2011
16
0
3,000
6,000
9,000
12,000
15,000
WhiteFemale
WhiteMale
WhiteAll
9,285
4,9454,340
2007
2009
2011
2007
2009
2011
2007
2009
2011
14
0
3,000
6,000
9,000
12,000
15,000
Non-WhiteFemale
Non-WhiteMale
Non-WhiteAll
5,289
2,7992,490
2007
2009
2011
2007
2009
2011
2007
2009
2011
15
0%
10%
20%
30%
40%
50%
60%
70%
80%
90%
100%
ScienceMath
97.5% 97.0%
2008
2010
2012
2008
2010
2012
0%
10%
20%
30%
40%
50%
60%
70%
80%
90%
100%
ScienceMath
95.9% 95.1%
2008
2010
2012
2008
2010
2012
10
11
0%
10%
20%
30%
40%
50%
60%
70%
80%
90%
100%
ScienceMath
98.9% 98.4%
2008
2010
2012
2008
2010
2012
12
0%
5%
10%
15%
20%
25%
30%
Non-WhiteWhite
13.6% 14.3%
2007
2009
2011
2007
2009
2011
17
0%
10%
20%
30%
40%
50%
60%
70%
80%
90%
100%
WhiteHispanicAfrican-American
Asian
0%
10%
20%
30%
40%
50%
60%
70%
80%
90%
100%
FemaleMaleAll
38.9% 37.0%41.1%
2008
2010
2012
2008
2010
2012
2008
2010
2012
0%
10%
20%
30%
40%
50%
60%
70%
80%
90%
100%
FemaleMaleAll
78.2% 78.4%78.6%
2008
2010
2012
2008
2010
2012
2008
2010
2012
53.0%
41.8%36.8%
43.3%
200820102012
200820102012
200820102012
200820102012
0%
10%
20%
30%
40%
50%
60%
70%
80%
90%
100%
ScienceMathScienceMath
62%
86%80%
48%
200820102012
200820102012
200820102012
200820102012
Low-Income Non-Low-Income
0%
10%
20%
30%
40%
50%
60%
70%
80%
90%
100%
ScienceMathScienceMath
30%
65%55%
20%
200820102012
200820102012
200820102012
200820102012
Low-Income Non-Low-Income
0%
10%
20%
30%
40%
50%
60%
70%
80%
90%
100%
ScienceMathScienceMath
36%
69% 66%
28%
200820102012
200820102012
200820102012
200820102012
Low-Income Non-Low-Income
1
2
3
4
5
8
0
3,000
6,000
9,000
12,000
15,000
FemaleMaleAll
14,574
7,7446,830
2007
2009
2011
2007
2009
2011
2007
2009
2011
13
0%
5%
10%
15%
20%
25%
30%
FemaleMaleAll
13.7% 14.0%13.4%
2007
2009
2011
2007
2009
2011
2007
2009
2011
16
0
3,000
6,000
9,000
12,000
15,000
WhiteFemale
WhiteMale
WhiteAll
9,285
4,9454,340
2007
2009
2011
2007
2009
2011
2007
2009
2011
14
0
3,000
6,000
9,000
12,000
15,000
Non-WhiteFemale
Non-WhiteMale
Non-WhiteAll
5,289
2,7992,490
2007
2009
2011
2007
2009
2011
2007
2009
2011
15
0%
10%
20%
30%
40%
50%
60%
70%
80%
90%
100%
ScienceMath
97.5% 97.0%
2008
2010
2012
2008
2010
2012
0%
10%
20%
30%
40%
50%
60%
70%
80%
90%
100%
ScienceMath
95.9% 95.1%
2008
2010
2012
2008
2010
2012
10
11
0%
10%
20%
30%
40%
50%
60%
70%
80%
90%
100%
ScienceMath
98.9% 98.4%
2008
2010
2012
2008
2010
2012
12
0%
5%
10%
15%
20%
25%
30%
Non-WhiteWhite
13.6% 14.3%
2007
2009
2011
2007
2009
2011
17
Chart 1: % of MA SAT Question Respondents Whose First Choice of Major is STEM For All and by Gender; Statewide: Public Schools Only
Chart 2: % of MA SAT Question Respondents Whose First Choice of Major is STEM By Race/Ethnicity; Statewide: Public Schools Only
Original benchmark z Increase interest in STEM college majors among college-going MA public school graduates to 35% by 2016 (from 25% in 2009).
ProgressTotal STEM interest among MA public school SAT-takers increased slightly from 2008 to 2012 (from about 37% in 2008 to about 39% in 2012). Total STEM interest increased more among female SAT-takers than among males with female STEM interest going from about 34% in 2008 to about 37% in 2012, indi-cating that the gap in total STEM interest between girls and boys had decreased.
Total STEM interest was generally higher among non-white SAT-takers than among white SAT-takers. However, total STEM interest increased most among white SAT-takers (going from 35% in 2008 to 37% in 2012), indicating that the gap in total STEM interest between whites and non-whites had decreased.

A Foundation for the Future: Massachusetts’ Plan for Excellence in STEM Education32
Goal 2: STEM Achievement Part A: Student Achievement (Formerly Goal 2)
0%
10%
20%
30%
40%
50%
60%
70%
80%
90%
100%
WhiteHispanicAfrican-American
Asian
0%
10%
20%
30%
40%
50%
60%
70%
80%
90%
100%
FemaleMaleAll
38.9% 37.0%41.1%
2008
2010
2012
2008
2010
2012
2008
2010
2012
0%
10%
20%
30%
40%
50%
60%
70%
80%
90%
100%
FemaleMaleAll
78.2% 78.4%78.6%
2008
2010
2012
2008
2010
2012
2008
2010
2012
53.0%
41.8%36.8%
43.3%
200820102012
200820102012
200820102012
200820102012
0%
10%
20%
30%
40%
50%
60%
70%
80%
90%
100%
ScienceMathScienceMath
62%
86%80%
48%
200820102012
200820102012
200820102012
200820102012
Low-Income Non-Low-Income
0%
10%
20%
30%
40%
50%
60%
70%
80%
90%
100%
ScienceMathScienceMath
30%
65%55%
20%
200820102012
200820102012
200820102012
200820102012
Low-Income Non-Low-Income
0%
10%
20%
30%
40%
50%
60%
70%
80%
90%
100%
ScienceMathScienceMath
36%
69% 66%
28%
200820102012
200820102012
200820102012
200820102012
Low-Income Non-Low-Income
1
2
3
4
5
8
0
3,000
6,000
9,000
12,000
15,000
FemaleMaleAll
14,574
7,7446,830
2007
2009
2011
2007
2009
2011
2007
2009
2011
13
0%
5%
10%
15%
20%
25%
30%
FemaleMaleAll
13.7% 14.0%13.4%
2007
2009
2011
2007
2009
2011
2007
2009
2011
16
0
3,000
6,000
9,000
12,000
15,000
WhiteFemale
WhiteMale
WhiteAll
9,285
4,9454,340
2007
2009
2011
2007
2009
2011
2007
2009
2011
14
0
3,000
6,000
9,000
12,000
15,000
Non-WhiteFemale
Non-WhiteMale
Non-WhiteAll
5,289
2,7992,490
2007
2009
2011
2007
2009
2011
2007
2009
2011
15
0%
10%
20%
30%
40%
50%
60%
70%
80%
90%
100%
ScienceMath
97.5% 97.0%
2008
2010
2012
2008
2010
2012
0%
10%
20%
30%
40%
50%
60%
70%
80%
90%
100%
ScienceMath
95.9% 95.1%
2008
2010
2012
2008
2010
2012
10
11
0%
10%
20%
30%
40%
50%
60%
70%
80%
90%
100%
ScienceMath
98.9% 98.4%
2008
2010
2012
2008
2010
2012
12
0%
5%
10%
15%
20%
25%
30%
Non-WhiteWhite
13.6% 14.3%
2007
2009
2011
2007
2009
2011
17
0%
10%
20%
30%
40%
50%
60%
70%
80%
90%
100%
WhiteHispanicAfrican-American
Asian
0%
10%
20%
30%
40%
50%
60%
70%
80%
90%
100%
FemaleMaleAll
38.9% 37.0%41.1%
2008
2010
2012
2008
2010
2012
2008
2010
2012
0%
10%
20%
30%
40%
50%
60%
70%
80%
90%
100%
FemaleMaleAll
78.2% 78.4%78.6%
2008
2010
2012
2008
2010
2012
2008
2010
2012
53.0%
41.8%36.8%
43.3%
200820102012
200820102012
200820102012
200820102012
0%
10%
20%
30%
40%
50%
60%
70%
80%
90%
100%
ScienceMathScienceMath
62%
86%80%
48%
200820102012
200820102012
200820102012
200820102012
Low-Income Non-Low-Income
0%
10%
20%
30%
40%
50%
60%
70%
80%
90%
100%
ScienceMathScienceMath
30%
65%55%
20%
200820102012
200820102012
200820102012
200820102012
Low-Income Non-Low-Income
0%
10%
20%
30%
40%
50%
60%
70%
80%
90%
100%
ScienceMathScienceMath
36%
69% 66%
28%
200820102012
200820102012
200820102012
200820102012
Low-Income Non-Low-Income
1
2
3
4
5
8
0
3,000
6,000
9,000
12,000
15,000
FemaleMaleAll
14,574
7,7446,830
2007
2009
2011
2007
2009
2011
2007
2009
2011
13
0%
5%
10%
15%
20%
25%
30%
FemaleMaleAll
13.7% 14.0%13.4%
2007
2009
2011
2007
2009
2011
2007
2009
2011
16
0
3,000
6,000
9,000
12,000
15,000
WhiteFemale
WhiteMale
WhiteAll
9,285
4,9454,340
2007
2009
2011
2007
2009
2011
2007
2009
2011
14
0
3,000
6,000
9,000
12,000
15,000
Non-WhiteFemale
Non-WhiteMale
Non-WhiteAll
5,289
2,7992,490
2007
2009
2011
2007
2009
2011
2007
2009
2011
15
0%
10%
20%
30%
40%
50%
60%
70%
80%
90%
100%
ScienceMath
97.5% 97.0%
2008
2010
2012
2008
2010
2012
0%
10%
20%
30%
40%
50%
60%
70%
80%
90%
100%
ScienceMath
95.9% 95.1%
2008
2010
2012
2008
2010
2012
10
11
0%
10%
20%
30%
40%
50%
60%
70%
80%
90%
100%
ScienceMath
98.9% 98.4%
2008
2010
2012
2008
2010
2012
12
0%
5%
10%
15%
20%
25%
30%
Non-WhiteWhite
13.6% 14.3%
2007
2009
2011
2007
2009
2011
17
Chart 3: % of MA Students Scoring Proficient or Advanced on 10th Grade MCAS By Income; Public Schools Only
Chart 4: % of MA Students Scoring Proficient or Advanced on 8th Grade MCAS By Income; Public Schools Only
Chart 5: % of MA Students Scoring Proficient or Advanced on 5th Grade MCAS By Income; Public Schools Only
Original benchmarks z Increase the percentage of all students scoring proficient or advanced on the MCAS mathematics and science and technology/engineering tests.
z Increase percentage of all 5th and 8th grade students scoring proficient or advanced on math-ematics and science and technology/engineering MCAS assessments by 20 percentage points by 2016.
z Increase the percentage of all high school students scoring proficient or advanced on mathematics and science and technology/engineering MCAS assessments by 10 percentage points by 2016.
z Reduce the achievement gaps of 5th grade, 8th grade, and high school students on the mathemat-ics and science and technology/engineering MCAS assessments by 25% between 2010 and 2014, and another 25% between 2014 and 2016.
ProgressAchievement gaps in STEM subjects, as measured by the percentage of MA public school students who scored Proficient or higher on MCAS tests, decreased from 2008–2012. For example, the percentage of 10th grade low-income students who scored Proficient or higher on the mathematics MCAS increased by 11 percentage points compared to 8 for non-low-income students.
The percentage of students scoring Proficient or higher on STEM MCAS tests has steadily increased from 2008–2012. The largest increase has been in the performance of 10th graders on the science MCAS test; the percentage of students scoring Proficient or higher on this test has increased from 57% in 2008 to 69% in 2012.

33Version 2.0: Expanding the Pipeline for All
Chart 6: Math MCAS Gap Changes Between 2009 and 2013 Note: Negative value represents narrowing of gap; positive value represents widening of gap.
Chart 7: Science MCAS Gap Changes Between 2009 and 2013 Note: Negative value represents narrowing of gap; positive value represents widening of gap.
6
-20
-15
-10
-5
0
5
10
15
20
All Students & Low-Income
All Students & ELL
All Students & SPED
White & Latino
White & Black
Grade 5 Grade 8 Grade 10
13 2 2 1
3
10
-3 -4-5
-3 -4-2 -2
-4
7
-20
-15
-10
-5
0
5
10
15
20
All Students & Low-Income
All Students & ELL
All Students & SPED
White & Latino
White & Black
Grade 5 Grade 8 Grade 10
3
02 2 1
6
-5 -6-4
-2-4 -5 -4 -3 -4
0%
10%
20%
30%
40%
50%
60%
70%
80%
90%
100%
No FeeWaiver
FeeWaiver
WhiteLatinoAfrican-American
Asian
80.1%
68.0% 71.0%
80.5%
68.3%
80.8%
200820102012
200820102012
200820102012
200820102012
2012
2012
9
6
-20
-15
-10
-5
0
5
10
15
20
All Students & Low-Income
All Students & ELL
All Students & SPED
White & Latino
White & Black
Grade 5 Grade 8 Grade 10
13 2 2 1
3
10
-3 -4-5
-3 -4-2 -2
-4
7
-20
-15
-10
-5
0
5
10
15
20
All Students & Low-Income
All Students & ELL
All Students & SPED
White & Latino
White & Black
Grade 5 Grade 8 Grade 10
3
02 2 1
6
-5 -6-4
-2-4 -5 -4 -3 -4
0%
10%
20%
30%
40%
50%
60%
70%
80%
90%
100%
No FeeWaiver
FeeWaiver
WhiteLatinoAfrican-American
Asian
80.1%
68.0% 71.0%
80.5%
68.3%
80.8%
200820102012
200820102012
200820102012
200820102012
2012
2012
9
In mathematics, there has been an increase in the percentage of students scoring proficient or higher at all grade levels except in grade 6, where it remained unchanged. The achievement gap for Latino and African-American/Black students decreased on the mathematics MCAS exams at all grade levels, with the exception of black students at grade 5, from 2009 until 2013. The gap between low-income students and non-low income students has also decreased at all levels, with the exception of no change for grade 4 students.
In science and technology/engineering, there has been a 10% increase in students scoring proficient or higher at the high school level. The achievement gap for Latino and African-American students decreased at all grade levels between 2009 and 2013. The gap between low-income students also dropped for all grade levels during this time.

A Foundation for the Future: Massachusetts’ Plan for Excellence in STEM Education34
Goal 2: STEM Achievement Part B: College Readiness (Formerly Goal 3)
Original Benchmarks z Increase the percentage of Massachusetts public high school students who report taking at least four years of mathematics (from 69% in 2009 [SAT]) and three years of lab-based science (from 79% in 2009 [SAT]) to 100% in 2016, consistent with MassCORE, and increase the percentage of Massachusetts public high school students who report taking advanced mathematics (pre-calculus and above) to 55% (from 44% in 2009 [SAT]) by 2016.
z Increase STEM course-taking among the underrep-resented gender in courses with a gender-based gap in participation
z Increase STEM course-taking among underrep-resented races/ethnicities in courses with a race/ethnicity-based gap in participation.
ProgressThe percentage of Massachusetts public school SAT-takers who report completing four years of mathematics and three years of science remained fairly stable from 2008–2012. While there was a small decline in the reported completion rate, it is believed that this is due to a change in the type of students taking the SAT, rather than reflective of a change in course-taking patterns. However, the data do show clear differences between various groups in reported completion of the MassCORE standard. In 2012, the largest gap was between test-takers who received a fee waiver for the SAT (about a 69% reported completion rate) versus those who did not receive a fee waiver (about an 81% reported completion rate). This gap is likely reflective of differences in opportunities associated with the schools attended by these different groups of test-takers with schools located in lower-income, urban areas offering fewer opportunities and resources to their students than higher-income, non-urban schools.
In 2012, 37% of SAT-takers from schools in the highest income quartile (i.e., schools where 25% of students or less received free or reduced price lunch) expressed an interest in a STEM major compared to
43% of SAT-takers from schools in the lowest income quartile (i.e., school where over 75% of students received free or reduced price lunch).
This interest level gap between low-income and high-income schools holds true across both genders: 35% of female and 39% of male SAT-takers from high-income schools expressed an interest in a STEM major compared to 41% of female and 46% of male SAT-takers from low-income schools.
The largest school-related interest gap can be seen between vocational/technical high schools and traditional/comprehensive high schools. Depending on the type of programming these schools and pro-grams offer (e.g., the number of STEM-related careers for which students can be prepared), overall STEM interest expressed by students from vocational/tech-nical high schools can be as much as twice as high as that expressed by students from some traditional/comprehensive high schools.
In terms of preparation, in 2012, 86% of SAT-takers from schools in the highest income quartile reported completing MassCORE (four years of mathematics as well as three years of science study in high school) compared to only 71% of SAT-takers from schools in the lowest income quartile. This trend was almost identical for female and male SAT-takers.
It is important to note that gaps—whether interest- or achievement-related—stem from the opportuni-ties and exposure students receive both in and out of school or lack thereof. Students from low-income backgrounds are just as able to be academically suc-cessful as students from high-income backgrounds; girls are just as able as boys to be interested in engineering; and white students are just as able as African-American students to be interested in health. However, reducing—and, eventually, hopefully, eliminating—interest and achievement gaps requires addressing large social issues (like gender stereotypes and poverty) as well as increasing in- and out-of-school time learning opportunities.
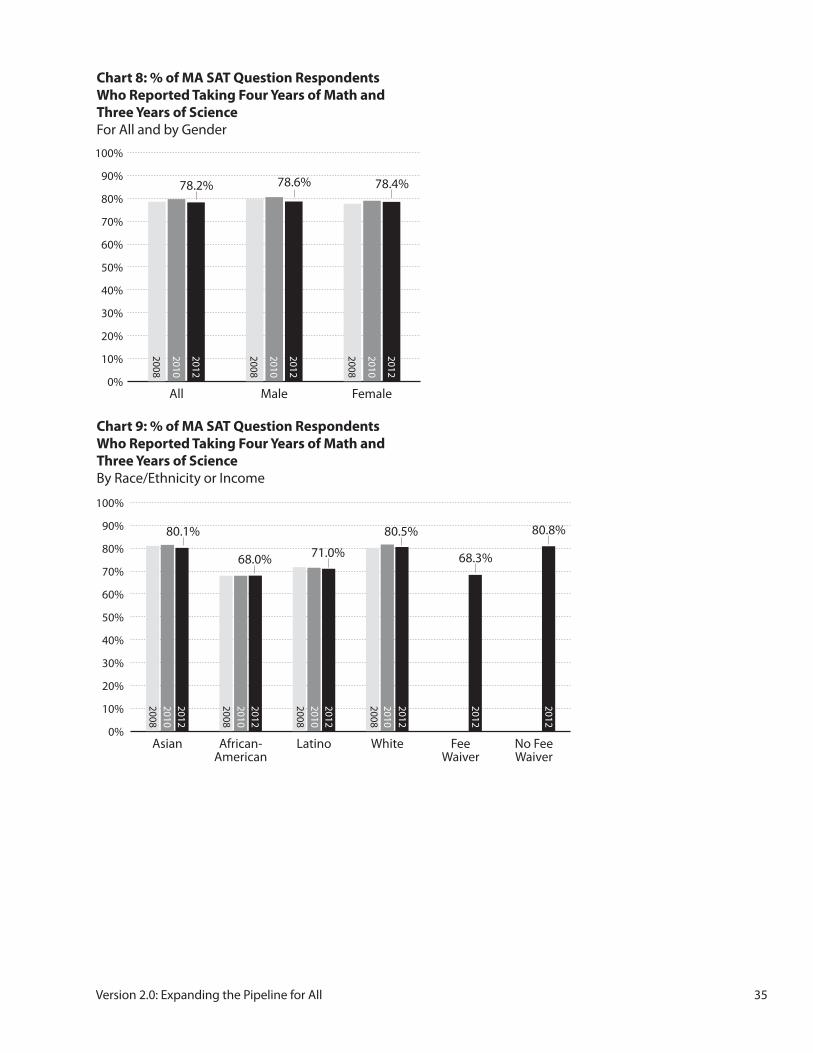
35Version 2.0: Expanding the Pipeline for All
0%
10%
20%
30%
40%
50%
60%
70%
80%
90%
100%
WhiteHispanicAfrican-American
Asian
0%
10%
20%
30%
40%
50%
60%
70%
80%
90%
100%
FemaleMaleAll
38.9% 37.0%41.1%
2008
2010
2012
2008
2010
2012
2008
2010
2012
0%
10%
20%
30%
40%
50%
60%
70%
80%
90%
100%
FemaleMaleAll
78.2% 78.4%78.6%
2008
2010
2012
2008
2010
2012
2008
2010
2012
53.0%
41.8%36.8%
43.3%
200820102012
200820102012
200820102012
200820102012
0%
10%
20%
30%
40%
50%
60%
70%
80%
90%
100%
ScienceMathScienceMath
62%
86%80%
48%
200820102012
200820102012
200820102012
200820102012
Low-Income Non-Low-Income
0%
10%
20%
30%
40%
50%
60%
70%
80%
90%
100%
ScienceMathScienceMath
30%
65%55%
20%
200820102012
200820102012
200820102012
200820102012
Low-Income Non-Low-Income
0%
10%
20%
30%
40%
50%
60%
70%
80%
90%
100%
ScienceMathScienceMath
36%
69% 66%
28%
200820102012
200820102012
200820102012
200820102012
Low-Income Non-Low-Income
1
2
3
4
5
8
0
3,000
6,000
9,000
12,000
15,000
FemaleMaleAll
14,574
7,7446,830
2007
2009
2011
2007
2009
2011
2007
2009
2011
13
0%
5%
10%
15%
20%
25%
30%
FemaleMaleAll
13.7% 14.0%13.4%
2007
2009
2011
2007
2009
2011
2007
2009
2011
16
0
3,000
6,000
9,000
12,000
15,000
WhiteFemale
WhiteMale
WhiteAll
9,285
4,9454,340
2007
2009
2011
2007
2009
2011
2007
2009
2011
14
0
3,000
6,000
9,000
12,000
15,000
Non-WhiteFemale
Non-WhiteMale
Non-WhiteAll
5,289
2,7992,490
2007
2009
2011
2007
2009
2011
2007
2009
2011
15
0%
10%
20%
30%
40%
50%
60%
70%
80%
90%
100%
ScienceMath
97.5% 97.0%
2008
2010
2012
2008
2010
2012
0%
10%
20%
30%
40%
50%
60%
70%
80%
90%
100%
ScienceMath
95.9% 95.1%
2008
2010
2012
2008
2010
2012
10
11
0%
10%
20%
30%
40%
50%
60%
70%
80%
90%
100%
ScienceMath
98.9% 98.4%
2008
2010
2012
2008
2010
2012
12
0%
5%
10%
15%
20%
25%
30%
Non-WhiteWhite
13.6% 14.3%
2007
2009
2011
2007
2009
2011
17
Chart 8: % of MA SAT Question Respondents Who Reported Taking Four Years of Math and Three Years of Science For All and by Gender
Chart 9: % of MA SAT Question Respondents Who Reported Taking Four Years of Math and Three Years of Science By Race/Ethnicity or Income
6
-20
-15
-10
-5
0
5
10
15
20
All Students & Low-Income
All Students & ELL
All Students & SPED
White & Latino
White & Black
Grade 5 Grade 8 Grade 10
13 2 2 1
3
10
-3 -4-5
-3 -4-2 -2
-4
7
-20
-15
-10
-5
0
5
10
15
20
All Students & Low-Income
All Students & ELL
All Students & SPED
White & Latino
White & Black
Grade 5 Grade 8 Grade 10
3
02 2 1
6
-5 -6-4
-2-4 -5 -4 -3 -4
0%
10%
20%
30%
40%
50%
60%
70%
80%
90%
100%
No FeeWaiver
FeeWaiver
WhiteLatinoAfrican-American
Asian
80.1%
68.0% 71.0%
80.5%
68.3%
80.8%
200820102012
200820102012
200820102012
200820102012
2012
2012
9

A Foundation for the Future: Massachusetts’ Plan for Excellence in STEM Education36
Goal 3: Skilled Educators
Goal 4: STEM Degrees/Certificates
0%
10%
20%
30%
40%
50%
60%
70%
80%
90%
100%
WhiteHispanicAfrican-American
Asian
0%
10%
20%
30%
40%
50%
60%
70%
80%
90%
100%
FemaleMaleAll
38.9% 37.0%41.1%
2008
2010
2012
2008
2010
2012
2008
2010
2012
0%
10%
20%
30%
40%
50%
60%
70%
80%
90%
100%
FemaleMaleAll
78.2% 78.4%78.6%
2008
2010
2012
2008
2010
2012
2008
2010
2012
53.0%
41.8%36.8%
43.3%
200820102012
200820102012
200820102012
200820102012
0%
10%
20%
30%
40%
50%
60%
70%
80%
90%
100%
ScienceMathScienceMath
62%
86%80%
48%
200820102012
200820102012
200820102012
200820102012
Low-Income Non-Low-Income
0%
10%
20%
30%
40%
50%
60%
70%
80%
90%
100%
ScienceMathScienceMath
30%
65%55%
20%
200820102012
200820102012
200820102012
200820102012
Low-Income Non-Low-Income
0%
10%
20%
30%
40%
50%
60%
70%
80%
90%
100%
ScienceMathScienceMath
36%
69% 66%
28%
200820102012
200820102012
200820102012
200820102012
Low-Income Non-Low-Income
1
2
3
4
5
8
0
3,000
6,000
9,000
12,000
15,000
FemaleMaleAll
14,574
7,7446,830
2007
2009
2011
2007
2009
2011
2007
2009
2011
13
0%
5%
10%
15%
20%
25%
30%
FemaleMaleAll
13.7% 14.0%13.4%
2007
2009
2011
2007
2009
2011
2007
2009
2011
16
0
3,000
6,000
9,000
12,000
15,000
WhiteFemale
WhiteMale
WhiteAll
9,285
4,9454,340
2007
2009
2011
2007
2009
2011
2007
2009
2011
14
0
3,000
6,000
9,000
12,000
15,000
Non-WhiteFemale
Non-WhiteMale
Non-WhiteAll
5,289
2,7992,490
2007
2009
2011
2007
2009
2011
2007
2009
2011
15
0%
10%
20%
30%
40%
50%
60%
70%
80%
90%
100%
ScienceMath
97.5% 97.0%
2008
2010
2012
2008
2010
2012
0%
10%
20%
30%
40%
50%
60%
70%
80%
90%
100%
ScienceMath
95.9% 95.1%
2008
2010
2012
2008
2010
2012
10
11
0%
10%
20%
30%
40%
50%
60%
70%
80%
90%
100%
ScienceMath
98.9% 98.4%
2008
2010
2012
2008
2010
2012
12
0%
5%
10%
15%
20%
25%
30%
Non-WhiteWhite
13.6% 14.3%
2007
2009
2011
2007
2009
2011
17
0%
10%
20%
30%
40%
50%
60%
70%
80%
90%
100%
WhiteHispanicAfrican-American
Asian
0%
10%
20%
30%
40%
50%
60%
70%
80%
90%
100%
FemaleMaleAll
38.9% 37.0%41.1%
2008
2010
2012
2008
2010
2012
2008
2010
2012
0%
10%
20%
30%
40%
50%
60%
70%
80%
90%
100%
FemaleMaleAll
78.2% 78.4%78.6%
2008
2010
2012
2008
2010
2012
2008
2010
2012
53.0%
41.8%36.8%
43.3%
200820102012
200820102012
200820102012
200820102012
0%
10%
20%
30%
40%
50%
60%
70%
80%
90%
100%
ScienceMathScienceMath
62%
86%80%
48%
200820102012
200820102012
200820102012
200820102012
Low-Income Non-Low-Income
0%
10%
20%
30%
40%
50%
60%
70%
80%
90%
100%
ScienceMathScienceMath
30%
65%55%
20%
200820102012
200820102012
200820102012
200820102012
Low-Income Non-Low-Income
0%
10%
20%
30%
40%
50%
60%
70%
80%
90%
100%
ScienceMathScienceMath
36%
69% 66%
28%
200820102012
200820102012
200820102012
200820102012
Low-Income Non-Low-Income
1
2
3
4
5
8
0
3,000
6,000
9,000
12,000
15,000
FemaleMaleAll
14,574
7,7446,830
2007
2009
2011
2007
2009
2011
2007
2009
2011
13
0%
5%
10%
15%
20%
25%
30%
FemaleMaleAll
13.7% 14.0%13.4%
2007
2009
2011
2007
2009
2011
2007
2009
2011
16
0
3,000
6,000
9,000
12,000
15,000
WhiteFemale
WhiteMale
WhiteAll
9,285
4,9454,340
2007
2009
2011
2007
2009
2011
2007
2009
2011
14
0
3,000
6,000
9,000
12,000
15,000
Non-WhiteFemale
Non-WhiteMale
Non-WhiteAll
5,289
2,7992,490
2007
2009
2011
2007
2009
2011
2007
2009
2011
15
0%
10%
20%
30%
40%
50%
60%
70%
80%
90%
100%
ScienceMath
97.5% 97.0%
2008
2010
2012
2008
2010
2012
0%
10%
20%
30%
40%
50%
60%
70%
80%
90%
100%
ScienceMath
95.9% 95.1%
2008
2010
2012
2008
2010
2012
10
11
0%
10%
20%
30%
40%
50%
60%
70%
80%
90%
100%
ScienceMath
98.9% 98.4%
2008
2010
2012
2008
2010
2012
12
0%
5%
10%
15%
20%
25%
30%
Non-WhiteWhite
13.6% 14.3%
2007
2009
2011
2007
2009
2011
17
Chart 10: % of MA Public School Classes Taught by Highly Qualified Teachers Public Schools Only
Chart 13: Total # of STEM Bachelor’s Degrees Granted by MA Institutions To All and by Gender; Public and Private Institutions
Original benchmark z Increase the number/percentage of STEM classes led by effective educators, from PreK–16.
ProgressThe vast majority of STEM teachers in Massachusetts public schools meet the federal definition of being “highly qualified.” However, the percentage of teach-ers at low-income schools who meet the highly qualified standard is measurably lower than the percentage at high-income schools. That being said, the percentage of teachers at low-income schools who are highly qualified increased much more from 2008–2012 than the percentage at high-income schools, resulting in a decrease in the gap between low- and high-income schools in this area.
Original benchmarks z Increase the number of students who complete STEM post-secondary degrees at Massachusetts’ public and private higher education institutions by 50% from 2008 to 2016.
z Increase in the number of bachelor’s degrees granted in all STEM majors to all students by 50% by 2016.
z Increase the number of bachelor’s degrees granted in all STEM majors to the underrepresented gender in majors with a gender-based gap.
z Increase the number of bachelor’s degrees granted to underrepresented minorities.
ProgressThe number of STEM bachelor’s degrees earned by students at Massachusetts public and private colleges and universities increased about 28% from 2007 to 2011. The increase in the number of STEM bachelor’s degrees earned by women was almost 32%, compared to about 23% for men, indicating that the gender gap in STEM degree attainment is closing. In addition, the number of STEM bachelor’s degrees earned by non-white students increased by almost 29%, compared to about 27% for white students, indicating that the race/ethnicity gap is closing at this level as well.

37Version 2.0: Expanding the Pipeline for All
Goal 3: Skilled Educators
Goal 4: STEM Degrees/Certificates
0%
10%
20%
30%
40%
50%
60%
70%
80%
90%
100%
WhiteHispanicAfrican-American
Asian
0%
10%
20%
30%
40%
50%
60%
70%
80%
90%
100%
FemaleMaleAll
38.9% 37.0%41.1%
2008
2010
2012
2008
2010
2012
2008
2010
2012
0%
10%
20%
30%
40%
50%
60%
70%
80%
90%
100%
FemaleMaleAll
78.2% 78.4%78.6%
2008
2010
2012
2008
2010
2012
2008
2010
2012
53.0%
41.8%36.8%
43.3%
200820102012
200820102012
200820102012
200820102012
0%
10%
20%
30%
40%
50%
60%
70%
80%
90%
100%
ScienceMathScienceMath
62%
86%80%
48%
200820102012
200820102012
200820102012
200820102012
Low-Income Non-Low-Income
0%
10%
20%
30%
40%
50%
60%
70%
80%
90%
100%
ScienceMathScienceMath
30%
65%55%
20%
200820102012
200820102012
200820102012
200820102012
Low-Income Non-Low-Income
0%
10%
20%
30%
40%
50%
60%
70%
80%
90%
100%
ScienceMathScienceMath
36%
69% 66%
28%
200820102012
200820102012
200820102012
200820102012
Low-Income Non-Low-Income
1
2
3
4
5
8
0
3,000
6,000
9,000
12,000
15,000
FemaleMaleAll
14,574
7,7446,830
2007
2009
2011
2007
2009
2011
2007
2009
2011
13
0%
5%
10%
15%
20%
25%
30%
FemaleMaleAll
13.7% 14.0%13.4%
2007
2009
2011
2007
2009
2011
2007
2009
2011
16
0
3,000
6,000
9,000
12,000
15,000
WhiteFemale
WhiteMale
WhiteAll
9,285
4,9454,340
2007
2009
2011
2007
2009
2011
2007
2009
2011
14
0
3,000
6,000
9,000
12,000
15,000
Non-WhiteFemale
Non-WhiteMale
Non-WhiteAll
5,289
2,7992,490
2007
2009
2011
2007
2009
2011
2007
2009
2011
15
0%
10%
20%
30%
40%
50%
60%
70%
80%
90%
100%
ScienceMath
97.5% 97.0%
2008
2010
2012
2008
2010
2012
0%
10%
20%
30%
40%
50%
60%
70%
80%
90%
100%
ScienceMath
95.9% 95.1%
2008
2010
2012
2008
2010
2012
10
11
0%
10%
20%
30%
40%
50%
60%
70%
80%
90%
100%
ScienceMath
98.9% 98.4%
2008
2010
2012
2008
2010
2012
12
0%
5%
10%
15%
20%
25%
30%
Non-WhiteWhite
13.6% 14.3%
2007
2009
2011
2007
2009
2011
17
0%
10%
20%
30%
40%
50%
60%
70%
80%
90%
100%
WhiteHispanicAfrican-American
Asian
0%
10%
20%
30%
40%
50%
60%
70%
80%
90%
100%
FemaleMaleAll
38.9% 37.0%41.1%
2008
2010
2012
2008
2010
2012
2008
2010
2012
0%
10%
20%
30%
40%
50%
60%
70%
80%
90%
100%
FemaleMaleAll
78.2% 78.4%78.6%
2008
2010
2012
2008
2010
2012
2008
2010
2012
53.0%
41.8%36.8%
43.3%
200820102012
200820102012
200820102012
200820102012
0%
10%
20%
30%
40%
50%
60%
70%
80%
90%
100%
ScienceMathScienceMath
62%
86%80%
48%
200820102012
200820102012
200820102012
200820102012
Low-Income Non-Low-Income
0%
10%
20%
30%
40%
50%
60%
70%
80%
90%
100%
ScienceMathScienceMath
30%
65%55%
20%
200820102012
200820102012
200820102012
200820102012
Low-Income Non-Low-Income
0%
10%
20%
30%
40%
50%
60%
70%
80%
90%
100%
ScienceMathScienceMath
36%
69% 66%
28%
200820102012
200820102012
200820102012
200820102012
Low-Income Non-Low-Income
1
2
3
4
5
8
0
3,000
6,000
9,000
12,000
15,000
FemaleMaleAll
14,574
7,7446,830
2007
2009
2011
2007
2009
2011
2007
2009
2011
13
0%
5%
10%
15%
20%
25%
30%
FemaleMaleAll
13.7% 14.0%13.4%
2007
2009
2011
2007
2009
2011
2007
2009
2011
16
0
3,000
6,000
9,000
12,000
15,000
WhiteFemale
WhiteMale
WhiteAll
9,285
4,9454,340
2007
2009
2011
2007
2009
2011
2007
2009
2011
14
0
3,000
6,000
9,000
12,000
15,000
Non-WhiteFemale
Non-WhiteMale
Non-WhiteAll
5,289
2,7992,490
2007
2009
2011
2007
2009
2011
2007
2009
2011
15
0%
10%
20%
30%
40%
50%
60%
70%
80%
90%
100%
ScienceMath
97.5% 97.0%
2008
2010
2012
2008
2010
2012
0%
10%
20%
30%
40%
50%
60%
70%
80%
90%
100%
ScienceMath
95.9% 95.1%
2008
2010
2012
2008
2010
2012
10
11
0%
10%
20%
30%
40%
50%
60%
70%
80%
90%
100%
ScienceMath
98.9% 98.4%
2008
2010
2012
2008
2010
2012
12
0%
5%
10%
15%
20%
25%
30%
Non-WhiteWhite
13.6% 14.3%
2007
2009
2011
2007
2009
2011
17
0%
10%
20%
30%
40%
50%
60%
70%
80%
90%
100%
WhiteHispanicAfrican-American
Asian
0%
10%
20%
30%
40%
50%
60%
70%
80%
90%
100%
FemaleMaleAll
38.9% 37.0%41.1%
2008
2010
2012
2008
2010
2012
2008
2010
2012
0%
10%
20%
30%
40%
50%
60%
70%
80%
90%
100%
FemaleMaleAll
78.2% 78.4%78.6%
2008
2010
2012
2008
2010
2012
2008
2010
2012
53.0%
41.8%36.8%
43.3%
200820102012
200820102012
200820102012
200820102012
0%
10%
20%
30%
40%
50%
60%
70%
80%
90%
100%
ScienceMathScienceMath
62%
86%80%
48%
200820102012
200820102012
200820102012
200820102012
Low-Income Non-Low-Income
0%
10%
20%
30%
40%
50%
60%
70%
80%
90%
100%
ScienceMathScienceMath
30%
65%55%
20%
200820102012
200820102012
200820102012
200820102012
Low-Income Non-Low-Income
0%
10%
20%
30%
40%
50%
60%
70%
80%
90%
100%
ScienceMathScienceMath
36%
69% 66%
28%
200820102012
200820102012
200820102012
200820102012
Low-Income Non-Low-Income
1
2
3
4
5
8
0
3,000
6,000
9,000
12,000
15,000
FemaleMaleAll
14,574
7,7446,830
2007
2009
2011
2007
2009
2011
2007
2009
2011
13
0%
5%
10%
15%
20%
25%
30%
FemaleMaleAll
13.7% 14.0%13.4%
2007
2009
2011
2007
2009
2011
2007
2009
2011
16
0
3,000
6,000
9,000
12,000
15,000
WhiteFemale
WhiteMale
WhiteAll
9,285
4,9454,340
2007
2009
2011
2007
2009
2011
2007
2009
2011
14
0
3,000
6,000
9,000
12,000
15,000
Non-WhiteFemale
Non-WhiteMale
Non-WhiteAll
5,289
2,7992,490
2007
2009
2011
2007
2009
2011
2007
2009
2011
15
0%
10%
20%
30%
40%
50%
60%
70%
80%
90%
100%
ScienceMath
97.5% 97.0%
2008
2010
2012
2008
2010
2012
0%
10%
20%
30%
40%
50%
60%
70%
80%
90%
100%
ScienceMath
95.9% 95.1%
2008
2010
2012
2008
2010
2012
10
11
0%
10%
20%
30%
40%
50%
60%
70%
80%
90%
100%
ScienceMath
98.9% 98.4%
2008
2010
2012
2008
2010
2012
12
0%
5%
10%
15%
20%
25%
30%
Non-WhiteWhite
13.6% 14.3%
2007
2009
2011
2007
2009
2011
17
Chart 11: % of MA Public School Classes Taught by Highly Qualified Teachers in Districts with a Low-Income Population at or above the State Average Public Schools Only
Chart 14: Total # of STEM Bachelor’s Degrees Granted by MA Institutions To White by Gender; Public and Private Institutions
Chart 12: % of MA Public School Classes Taught by Highly Qualified Teachers in Districts with a Low-Income Population below the State Average Public Schools Only
Chart 15: Total # of STEM Bachelor’s Degrees Granted by MA Institutions To Non-White by Gender; Public and Private Institutions

A Foundation for the Future: Massachusetts’ Plan for Excellence in STEM Education38
Goal 5: Workforce Alignment
0%
10%
20%
30%
40%
50%
60%
70%
80%
90%
100%
WhiteHispanicAfrican-American
Asian
0%
10%
20%
30%
40%
50%
60%
70%
80%
90%
100%
FemaleMaleAll
38.9% 37.0%41.1%
2008
2010
2012
2008
2010
2012
2008
2010
2012
0%
10%
20%
30%
40%
50%
60%
70%
80%
90%
100%
FemaleMaleAll
78.2% 78.4%78.6%
2008
2010
2012
2008
2010
2012
2008
2010
2012
53.0%
41.8%36.8%
43.3%
200820102012
200820102012
200820102012
200820102012
0%
10%
20%
30%
40%
50%
60%
70%
80%
90%
100%
ScienceMathScienceMath
62%
86%80%
48%
200820102012
200820102012
200820102012
200820102012
Low-Income Non-Low-Income
0%
10%
20%
30%
40%
50%
60%
70%
80%
90%
100%
ScienceMathScienceMath
30%
65%55%
20%
200820102012
200820102012
200820102012
200820102012
Low-Income Non-Low-Income
0%
10%
20%
30%
40%
50%
60%
70%
80%
90%
100%
ScienceMathScienceMath
36%
69% 66%
28%
200820102012
200820102012
200820102012
200820102012
Low-Income Non-Low-Income
1
2
3
4
5
8
0
3,000
6,000
9,000
12,000
15,000
FemaleMaleAll
14,574
7,7446,830
2007
2009
2011
2007
2009
2011
2007
2009
2011
13
0%
5%
10%
15%
20%
25%
30%
FemaleMaleAll
13.7% 14.0%13.4%
2007
2009
2011
2007
2009
2011
2007
2009
201116
0
3,000
6,000
9,000
12,000
15,000
WhiteFemale
WhiteMale
WhiteAll
9,285
4,9454,340
2007
2009
2011
2007
2009
2011
2007
2009
2011
14
0
3,000
6,000
9,000
12,000
15,000
Non-WhiteFemale
Non-WhiteMale
Non-WhiteAll
5,289
2,7992,490
2007
2009
2011
2007
2009
2011
2007
2009
2011
15
0%
10%
20%
30%
40%
50%
60%
70%
80%
90%
100%
ScienceMath
97.5% 97.0%
2008
2010
2012
2008
2010
2012
0%
10%
20%
30%
40%
50%
60%
70%
80%
90%
100%
ScienceMath
95.9% 95.1%
2008
2010
2012
2008
2010
2012
10
11
0%
10%
20%
30%
40%
50%
60%
70%
80%
90%
100%
ScienceMath
98.9% 98.4%
2008
2010
2012
2008
2010
2012
12
0%
5%
10%
15%
20%
25%
30%
Non-WhiteWhite
13.6% 14.3%
2007
2009
2011
2007
2009
2011
17
0%
10%
20%
30%
40%
50%
60%
70%
80%
90%
100%
WhiteHispanicAfrican-American
Asian
0%
10%
20%
30%
40%
50%
60%
70%
80%
90%
100%
FemaleMaleAll
38.9% 37.0%41.1%
2008
2010
2012
2008
2010
2012
2008
2010
2012
0%
10%
20%
30%
40%
50%
60%
70%
80%
90%
100%
FemaleMaleAll
78.2% 78.4%78.6%
2008
2010
2012
2008
2010
2012
2008
2010
2012
53.0%
41.8%36.8%
43.3%
200820102012
200820102012
200820102012
200820102012
0%
10%
20%
30%
40%
50%
60%
70%
80%
90%
100%
ScienceMathScienceMath
62%
86%80%
48%
200820102012
200820102012
200820102012
200820102012
Low-Income Non-Low-Income
0%
10%
20%
30%
40%
50%
60%
70%
80%
90%
100%
ScienceMathScienceMath
30%
65%55%
20%
200820102012
200820102012
200820102012
200820102012
Low-Income Non-Low-Income
0%
10%
20%
30%
40%
50%
60%
70%
80%
90%
100%
ScienceMathScienceMath
36%
69% 66%
28%
200820102012
200820102012
200820102012
200820102012
Low-Income Non-Low-Income
1
2
3
4
5
8
0
3,000
6,000
9,000
12,000
15,000
FemaleMaleAll
14,574
7,7446,830
2007
2009
2011
2007
2009
2011
2007
2009
2011
13
0%
5%
10%
15%
20%
25%
30%
FemaleMaleAll
13.7% 14.0%13.4%
2007
2009
2011
2007
2009
2011
2007
2009
201116
0
3,000
6,000
9,000
12,000
15,000
WhiteFemale
WhiteMale
WhiteAll
9,285
4,9454,340
2007
2009
2011
2007
2009
2011
2007
2009
2011
14
0
3,000
6,000
9,000
12,000
15,000
Non-WhiteFemale
Non-WhiteMale
Non-WhiteAll
5,289
2,7992,490
2007
2009
2011
2007
2009
2011
2007
2009
2011
15
0%
10%
20%
30%
40%
50%
60%
70%
80%
90%
100%
ScienceMath
97.5% 97.0%
2008
2010
2012
2008
2010
2012
0%
10%
20%
30%
40%
50%
60%
70%
80%
90%
100%
ScienceMath
95.9% 95.1%
2008
2010
2012
2008
2010
2012
10
11
0%
10%
20%
30%
40%
50%
60%
70%
80%
90%
100%
ScienceMath
98.9% 98.4%
2008
2010
2012
2008
2010
2012
12
0%
5%
10%
15%
20%
25%
30%
Non-WhiteWhite
13.6% 14.3%
2007
2009
2011
2007
2009
2011
17
Chart 16: MA STEM Employment as a % of All Employment For All and by Gender
Chart 17: MA STEM Employment as a % of All Employment By Race/Ethnicity
Original benchmark z Align STEM education programs with needs of economic sectors to:
{ Improve the competence (knowledge, skills, and attitudes) of current prospective workers for in-demand career tracks across relevant job levels.
{ Increase the availability and diversity of STEM competent workers to support the replacement (retirement) and growth needs of employers.
{ Increase total employment of the STEM work-force, regionally and statewide.
ProgressThe segment of jobs in Massachusetts that fall into the category of “STEM” has increased steadily from 2007–2011. That is, a higher percentage of jobs held in 2011 were associated with STEM fields than in 2007. Individuals from all racial/ethnic backgrounds and both males and females are employed in jobs that fall into the category of STEM.

39Version 2.0: Expanding the Pipeline for All
Appendix BDeep Learning Scale
Goal 5, which begins on page 28, includes the Deep Learning Scale35 derived from the National Survey of Student Engagement (NSSE) administered at public and private colleges around the United States to measure deep learning in STEM fields at the higher education level as a metric to measure workforce alignment. The following are questions from NSSE that are used to compute the “Deep Learning Scale.”
Higher Level LearningDuring the current school year, how much has your coursework emphasized the following mental activities?
{ Very little { Some { Quite a bit { Very much
HL1 ANALYZING the basic elements of an idea, experience, or theory, such as examining a particular case or situation in depth and considering its components
HL2 SYNTHESIZING and organizing ideas, informa-tion, or experiences into new, more complex interpre-tations and relationships
HL3 MAKING JUDGMENTS about the value of information, arguments, or methods, such as examin-ing how others gathered and interpreted data and assessing the soundness of their conclusions
HL4 APPLYING theories or concepts to practical problems or in new situations
35 Nelson Laird, Thomas F. Rick Shoup, and George D. Kuh. “Measuring Deep Approaches to Learning Using the National Survey of Student Engagement. Paper presented at the Annual Meeting of the Association for Institutional Research. May 2005, Chicago, IL.
Integrative LearningIn your experience at your institution during the current school year, about how often have you done each of the following?
{ Never { Sometimes { Often { Very often
IL1 Worked on a paper or project that required integrating ideas or information from various sources
IL2 Included diverse perspectives (different races, religions, genders, political beliefs, etc.) in class discussions or writing assignments
IL3 Put together ideas or concepts from different courses when completing assignments or during class discussions
IL4 Discussed ideas from your readings or classes with faculty members outside of class
IL5 Discussed ideas from your readings or classes with others outside of class (students, family mem-bers, co-workers, etc.)
Reflective LearningDuring the current school year, about how often have you done each of the following?
{ Never { Sometimes { Often { Very often
RL1 Examined the strengths and weaknesses of your own views on a topic or issue
RL2 Tried to better understand someone else’s views by imagining how an issue looks from his or her perspective
RL3 Learned something that changed the way you understand an issue or concept

A Foundation for the Future: Massachusetts’ Plan for Excellence in STEM Education40
Appendix C@ Scale Project Portfolio
Phase IBioTeach is an ambitious program that features teacher professional development, equipment supply and student experiential learning. The program is designed to support biotechnology instruction and career awareness activities. The program prepares teachers to access and use biotechnology curricula, exposes students to career awareness activities, and partners with government and local businesses to support scientific curiosity and increase student par-ticipation in sciences. Over a six-year period, BioTeach has provided professional training for more than 600 educators in 177 Massachusetts high schools. Contact: Robert Ross at [email protected] or (617) 674-5153. www.massbioed.org
DIGITS is a classroom program that pairs STEM professionals with sixth-grade classes throughout the state to increase students’ interest in STEM subjects and careers. STEM volunteers meet and talk with students about their careers, lead students in interac-tive STEM-related exercises, and serve as role models, encouraging students to study math and science and urging them to consider STEM careers. The program, which is based on a uniquely designed alphabet with STEM icons embedded in each letter, takes place in a math or science class during the course of a typical school day. Contact: Joyce Plotkin at [email protected] or (617) 694-7309. http://digits.us.com
Mass Math+Science Initiative (MMSI) was created to drive a school culture of high expectations by dra-matically increasing participation and performance in Advanced Placement courses, particularly among underserved populations, to prepare students for college and career success in science, technology, engineering, and mathematics (STEM). MMSI focuses on three measurable goals: 1) Increase AP participa-tion, 2) Increase AP performance and 3) Increase college success. MMSI is currently working directly with 8,000 students in 53 high schools across the Commonwealth. Contact: Morton Orlov II at [email protected] or (617) 778-1528. www.massinsight.org/mmsi
Project Lead the Way (PLTW) is a nationally ac-claimed, project-based STEM curriculum for grades 6–12 that uses real-world problem-solving as a framework. PLTW curriculum offers students engag-ing programs in engineering and biomedical sciences to prepare them for STEM post-secondary education and careers. PLTW is offered at over 4,200 middle and high schools in all 50 states, including 26 MA schools. WPI is one of 38 affiliate universities for the PLTW Engineering Program and runs a two-week profes-sional development summer institute to prepare edu-cators to teach PLTW courses. Contact: Terry Adams at [email protected] or (508) 831-5198. www.pltw.org
Massasoit Community College’s Science Transfer Initiative has a goal of increasing enrollment, reten-tion, diversity, and access for students who plan to transfer to four-year liberal arts baccalaureate degree institutions and who wish to major in the sciences, engineering, pre-med, or other advanced medical fields. The principal goal is to prepare students for successful transfer to four-year institutions as science majors by providing early undergraduate research opportunities, enhanced advising, mentors for aca-demic and career advice, exposure to science career paths, and access to financial aid. Contact Gilles Bolduc via email at [email protected] or via phone at (508) 588-9100 X1617. www.massasoit.mass.edu
Advanced Robotics Intensive (ARI), through Quinsigamond Community College, introduces stu-dents to many STEM topics at one time (engineering, electronics, physics, computer programming, etc.), providing math and science enrichment and real life teamwork experiences. ARI utilizes a variety of ap-proaches to robotics like summer camps and middle school after-school programs. Students participate in “kick-offs,” practice sessions and competitions at QCC. Teams pair up to work on a unique challenge (e.g., a series of “obstacles” on a game board) and compete with other schools, which fosters awareness of others, collaborative innovation and strategy. Contact: Betty Lauer at [email protected] or (508) 854-2765. www.qcc.edu
41Version 2.0: Expanding the Pipeline for All
Gateway Project was developed to assist school districts in developing a strategic plan of action to implement rigorous and engaging K–12 technology and engineering programs that both inspire and encourage student achievement. In addition, the program introduces educators to user-friendly tools and resources (developed by the National Center for Technological Literacy, an initiative of the Museum of Science, Boston) that deliver technology and en-gineering content. These tools are not only designed to inspire students but are also aligned with state standards, making them ideal teaching instruments to pique students’ interest in STEM topics. Contact: Yvonne Spicer at [email protected] or (617) 589-3101. www.mos.org/nctl/k12_gateway.php
Phase IIUMass “ABLE 4 STEM” is a program focused on un-der-represented minorities to promote associate and baccalaureate degree completion at all four UMass undergraduate campuses and the 15 Massachusetts community colleges. http://able4stem.org
BATEC’s “Big Data” program provides training to students as well as displaced and incumbent workers seeking to upgrade or develop their knowledge and skills in IT. BATEC plans to expand their programming to Roxbury Community College, Northern Essex CC, Quinsigamond CC and Holyoke CC. http://batec.org
Central Mass WIB’s “STEM Power” project re-engineers Career Center practices, procedures and policies to provide a sector-based approach to nearly all facets of the services offered to dislocated workers including job seeker STEM pathways outreach, orien-tation and education; STEM-related pathways career counseling; training; placement for job seekers; and STEM employer engagement and support. Sixteen local Workforce Investment Boards (WIBs) and their One-Stop Career Centers are partners in this project. cmwib.org
McCann Technical School’s “Western Regional Partnership” is a workforce development project in the area of advanced manufacturing. The educational institutions that make up the STEM Western Regional Partnership currently offer Chapter 74 approved technical programming in advanced manufacturing, precision and machine tools. www.mccanntech.org
MCLA’s “STEM Pathways Project” (SSPP) promotes student success with the goal to increase graduation rates by providing strategic and successful initiatives which address students’ academic, experiential, and career awareness interests. MCLA’s SSPP employs a STEM retention plan, starting with activities for freshman and continuing through senior year. Administered through the MCLA Center for Student Success and Engagement (CSSE), the program delivers enhanced academic support, advising, and career planning, and marshals the efforts of both the academic affairs and student affairs divisions. www.mcla.edu
Phases III and IVBoston Public Schools’ Strengthening PreK Mathematics Teaching and Learning will scale up a successful PreK mathematics program, Building Blocks. This project, “Strengthening PreK Mathematics Teaching and Learning: A Boston K1DS Collaboration between the Boston Public Schools and Boston Community-Based Organizations,” will expand from the 2,300 PreK students in BPS to eventually serve over 6,500 low-income, at-risk three- and four-year-olds in over 200 community-based organizations. The project will focus on PreK student engagement and educator effectiveness, and plans to contribute to the existence of transformative, system-wide and sustainable improvements that are consistent with the goals described in the Massachusetts STEM Plan. www.bostonpublicschools.org
A Foundation for the Future: Massachusetts’ Plan for Excellence in STEM Education42
Future City Competition Working Cities Expansion Project is run by the Boston Society for Civil Engineers and the Metro North Regional Employment Board, Future City is a team-based transformative educational program designed for 6th, 7th and 8th grade students in which students imagine and design cities of the future and explain the underlying technologies and design principles that would make their city possible. Students create both physical scale models and virtual models (utiliz-ing SimCity software), prepare presentations/Q&A responses, and write research documents as part of their engineering design process. This program will scale up to the cities of Chelsea, Everett, Haverhill, Lawrence, Lowell, Lynn, Malden, Revere, Salem, and Somerville. futurecity.org/region-sponsor/boston-society-civil-engineers-section-asce
Increasing Accessibility to Algebra & Geometry for All Students (IAAG) is a teacher profes-sional development project run by the University of Massachusetts Medical School in Worcester, which offers foundational math content and pedagogical strategies for general education, inclusion and special education mathematics teachers of grades 5 through 10. This program has proven to be especially helpful for teachers in high-needs districts. IAAG strengthens teachers’ understanding of concepts and relation-ships among concepts within various domains includ-ing Operations and Algebraic Thinking; Equations and Expressions; Functions; and Geometry. Teachers learn universal design strategies and techniques to increase accessibility of rigorous mathematics to a broad range of learners. This program serves the greater Worcester area and other high-needs school districts, including Springfield, Lowell and Medford. www.umassmed.edu/rsrc/index.aspx
Massachusetts Afterschool Partnership’s Zero Robotics Program will scale up its program beyond the Boston area where they currently operate. The program is described as a fun, flexible yet rigorous summer STEM program for middle school students with a key element of targeting under-served and under-represented youth. Over five weeks during the summer, students work in teams to learn about com-puter programming, robotics and space engineering while gaining hands-on experience working with and coding SPHERES (Synchronized Position, Hold, Engage, Reorient Experimental Satellites). The pro-gram culminates in a tournament where each team competes for a spot to operate and race a SPHERE satellite against other teams aboard the International Space Station (ISS). MAP will also use @Scale funds to develop a comprehensive teacher training program to train prospective Zero Robotics educators and their regional partners across each of the seven Regional STEM networks. www.massafterschool.org
Science from Scientists (SfS) will expand its suc-cessful “During School In-Class STEM Enrichment Program” to two first-time partner schools in new locations, Winthrop and Plainville. The funding will enable SfS to provide in-class enrichment to 475 new students and allow as many as 16 classroom teachers to enroll in their Professional Development Program. Student goals include improving students’ attitudes in STEM by working with every student in the class-room, using real, charismatic scientists and building mentoring relationships. sciencefromscientists.org
43Version 2.0: Expanding the Pipeline for All
Appendix DSTEM Plan 2.0 Contributors
STEM Plan 2.0 could not have been written without members of the STEM community. The STEM Advisory Council would like to thank the following people for their contributions:
z Beth Ashman, Department of Higher Education z Barbara Berns, Education Development Center z Judy Boccia, Northeast STEM Network and University of Massachusetts Lowell z Ruth Bramson, Girl Scouts of Eastern Massachusetts z Marybeth Campbell, Executive Offices of Education, Workforce and Labor Development, and Housing and Economic Development
z Heather Johnson Carey, Mass TLC z Ronit Carter, Consultant z Bob Cody, Cape Cod Community College z Marissa Cole, Executive Office of Education z Marilyn Decker, Department of Elementary and Secondary Education z Marjie Dennis, Northeast STEM Network z Beth Doherty, New Bedford Public Schools z Karen Feinberg, Feinberg Consultants z Jake Foster, Department of Elementary and Secondary Education z Adam Freudberg, Office of Governor Deval L. Patrick z Mariana Gerena-Melia, University of Massachusetts Donahue Institute z Sharon Gale, Organization of Nurse Leaders, Massachusetts and Rhode Island z Lynn Griesemer, University of Massachusetts Donahue Institute z Katherine Honey, Southeast STEM Network z Jason Hunter, Brockton Area Workforce Investment Board z Jennifer James, Department of Labor and Workforce Development z Monica Joslin, Berkshire STEM Network and Massachusetts College of Liberal Arts z Diane Kelly, Revere Public Schools z Sue Lane, Department of Higher Education z Eric Lieberman, Department of Early Education and Care z Katie Lynch, Executive Office of Education z Katie Magrane, Massachusetts Afterschool Partnership z Reinier Moquette, Latino STEM Alliance z Scott Morrison, Manchester Essex Regional School District z Eric Nakajima, Department of Housing and Economic Development z Alysia Ordway, Boston STEM Network and Private Industry Council z Zorica Pantic, Wentworth Institute of Technology

A Foundation for the Future: Massachusetts’ Plan for Excellence in STEM Education44
z Pamela Pelletier, Boston Public Schools z Joyce Plotkin, DIGITS z Mary Ellen D. Rancourt, North Shore Technical High School z Jonathan Rappaport, Arts|Learning z Peg Riley, Massachusetts Academy of Science z Bridget Rodriguez, Executive Office of Education z Annamaria Schrimpf, Consultant z Joyce M. Smith, Education Development Center z Yvonne Spicer, Museum of Science z Jean Supel, University of Massachusetts Donahue Institute z Kevin Thurston, MetroWest STEM Network and Greater Boston Readiness Center z Keith Westrich, Department of Elementary and Secondary Education z Emma Youndtsmith, Bootstrap World z Christos Zahopoulos, Northeastern University
Also, the STEM Advisory Council would like to specifically recognize Lance Hartford of MassBioEd Foundation and Isa Zimmerman of IKZ Advisors for their leadership in organizing the STEM goal teams.

45Version 2.0: Expanding the Pipeline for All
Appendix EGovernor’s STEM Advisory Council Members
Ex Officio Members z Joseph P. Kennedy III, Congressman, Honorary Chairman of the STEM Advisory Council z Greg Bialecki, Secretary, Executive Office of Housing and Economic Development z Joanne Goldstein, Secretary, Executive Office of Labor and Workforce Development z Matthew Malone, Secretary, Executive Office of Education z Mitchell Chester, Commissioner, Department of Elementary and Secondary Education z Richard M. Freeland, Commissioner, Department of Higher Education z Thomas L. Weber, Commissioner, Department of Early Education and Care z Robert Caret, President, University of Massachusetts
Legislative Members z (Open), State Representative z Thomas Conroy, State Representative, Speaker of the House’s Appointee z Thomas McGee, State Senator z Karen Spilka, State Senator, Senate President’s Appointee
Members * denotes membership on Council’s Executive Committee
z Ted Acworth, Founder and CEO, Artaic Innovative Mosaic z Dennis Berkey, President, Worcester Polytechnic Institute z Melinda Boone, Superintendent, Worcester Public Schools* z James Brosnan, Superintendent, Northern Berkshire Vocational Regional School District* z J.D. Chesloff, Executive Director, Massachusetts Business Roundtable* z Rebecca Cusick, 4th Grade Teacher, Fall River Public Schools* z Gary DiCamillo, Chairman, Mass. Business Roundtable’s Education and Workforce Development Task Force; Partner, Eaglepoint Advisors, LLC.
z Mark DiNapoli, President and General Manager, Suffolk Construction Northeast Division z Mary Grant, President, Massachusetts College of Liberal Arts z John Hodgman, Lecturer, Gordon Institute at Tufts University* z Bruce Johnson, Director, Technology and Innovation, MITRE z Mary McLaughlin, Vice President Greater Boston Region/South, Comcast z Ioannis Miaoulis, President and Director, Museum of Science* z Barnas Monteith, Chairman, MA State Science and Engineering Fair; Managing Partner and Co-Founder, Advanced Diamond Solutions, Inc.
z Kevin O’Sullivan, President and CEO, Massachusetts Biomedical Initiatives z Zorica Pantic, President, Wentworth Institute of Technology

A Foundation for the Future: Massachusetts’ Plan for Excellence in STEM Education46
z Joyce L. Plotkin, President, The DIGITS Project* z Marcy Reed, Senior Vice President, National Grid z Alex Sanchez, Senior Principal Systems Engineer, Raytheon Company z Yvonne Spicer, Vice President-Advocacy for Educational Partnerships, Museum of Science z Jim Stanton, Executive Director, MassCAN; Senior Project Director, Education Development Center
z Michael Tamasi, Principal, Boston Centerless/AccuRounds z Steve Vinter, Engineering and Site Director, Google Inc. z Susan Windham-Bannister, President and CEO, Massachusetts Life Sciences Center z Christos Zahopoulos, Ph.D., Executive Director, Northeastern University Center for STEM Education
z Isa Zimmerman, Principal, IKZ Advisors
STEM Advisory Council Staff z David Cedrone, Associate Commissioner for Economic and Workforce Development and STEM at the Dept. of Higher Education
z Marissa Cole, Deputy Chief of Staff, Executive Office of Education z Keith Connors, Senior Program Manager of the STEM Pipeline Fund z Adam Freudberg, Policy Advisor and Executive Director of the Military Task Force, Office of Governor Deval L. Patrick
z Allison Scheff, Executive Director of STEM at the Department of Higher Education and the Governor’s STEM Advisory Council
Congressman Kennedy’s Staff z Emily Browne, Director of Communications z Nick Clemons, District Director z Eric Fins, Senior Legislative Assistant
47Version 2.0: Expanding the Pipeline for All
Contact InformationFor more information on STEM Plan 2.0 or the work of the Governor’s STEM Advisory Council, please contact:
Allison Scheff Executive Director of STEM Department of Higher Education and the Governor’s STEM Advisory Council
E-mail: [email protected] Phone: (617) 994-6935

A Foundation for the Future: Massachusetts’ Plan for Excellence in STEM Education48
Appendix FIndex of Tables and Charts
Table 1: % of Students Scoring Proficient or Advanced on MCAS .........................................................................................20
Chart 1: % of MA SAT Question Respondents Whose First Choice of Major is STEM —For All and by Gender; Statewide: Public Schools Only ........................................................................................................31
Chart 2: % of MA SAT Question Respondents Whose First Choice of Major is STEM —By Race/Ethnicity; Statewide: Public Schools Only ................................................................................................................31
Chart 3: % of MA Students Scoring Proficient or Advanced on 10th Grade MCAS —By Income; Public Schools Only ....................................................................................................................................................32
Chart 4: % of MA Students Scoring Proficient or Advanced on 8th Grade MCAS —By Income; Public Schools Only ....................................................................................................................................................32
Chart 5: % of MA Students Scoring Proficient or Advanced on 5th Grade MCAS —By Income; Public Schools Only ....................................................................................................................................................32
Chart 6: Math MCAS Gap Changes Between 2009 and 2013 ..................................................................................................33
Chart 7: Science MCAS Gap Changes Between 2009 and 2013 ............................................................................................33
Chart 8: % of MA SAT Question Respondents Who Reported Taking Four Years of Math and Three Years of Science—For All and by Gender ............................................................................35
Chart 9: % of MA SAT Question Respondents Who Reported Taking Four Years of Math and Three Years of Science —By Race/Ethnicity or Income ...............................................................35
Chart 10: % of MA Public School Classes Taught by Highly Qualified Teachers—Public Schools Only ...................36
Chart 11: % of MA Public School Classes Taught by Highly Qualified Teachers in Districts with a Low-Income Population at or above the State Average—Public Schools Only ................................37
Chart 12: % of MA Public School Classes Taught by Highly Qualified Teachers in Districts with a Low-Income Population below the State Average —Public Schools Only ...........................................................................................................................................................................37
Chart 13: Total # of STEM Bachelor’s Degrees Granted by MA Institutions—To All and by Gender; Public and Private Institutions .............................................................................36
Chart 14: Total # of STEM Bachelor’s Degrees Granted by MA Institutions —To White by Gender; Public and Private Institutions ..............................................................................................................37
Chart 15: Total # of STEM Bachelor’s Degrees Granted by MA Institutions —To Non-White by Gender; Public and Private Institutions ....................................................................................................37
Chart 16: MA STEM Employment as a % of All Employment—For All and by Gender ...................................................38
Chart 17: MA STEM Employment as a % of All Employment—By Race/Ethnicity ...........................................................38
Chart 18: College Labor Market STEM Gap, Massachusetts, 2012 .........................................................................................49

49Version 2.0: Expanding the Pipeline for All
Chart 18: College Labor Market STEM Gap, Massachusetts, 2012 (See Goal 5 on page 28 for more information.)
14% 11% 13%6% 5%
16%19% 21%
4%
10%
28%
66%54%
33%
0%
10%
20%
30%
40%
50%
60%
70%
80%
90%
100%
Not STEM
CIS & IT
Health & Biology
High STEM Production, Construction & Repair
Physical Science, Math, & Engineering
STEM:
34% 46% 67%
Degrees & Certi�cates
Awarded
SUPPLY DEMANDStatus Quo
DEMANDWhat Employers are Trying to Hire Now
20%GAP
12%GAP
Filled College Labor Market Jobs
Online Job Postings
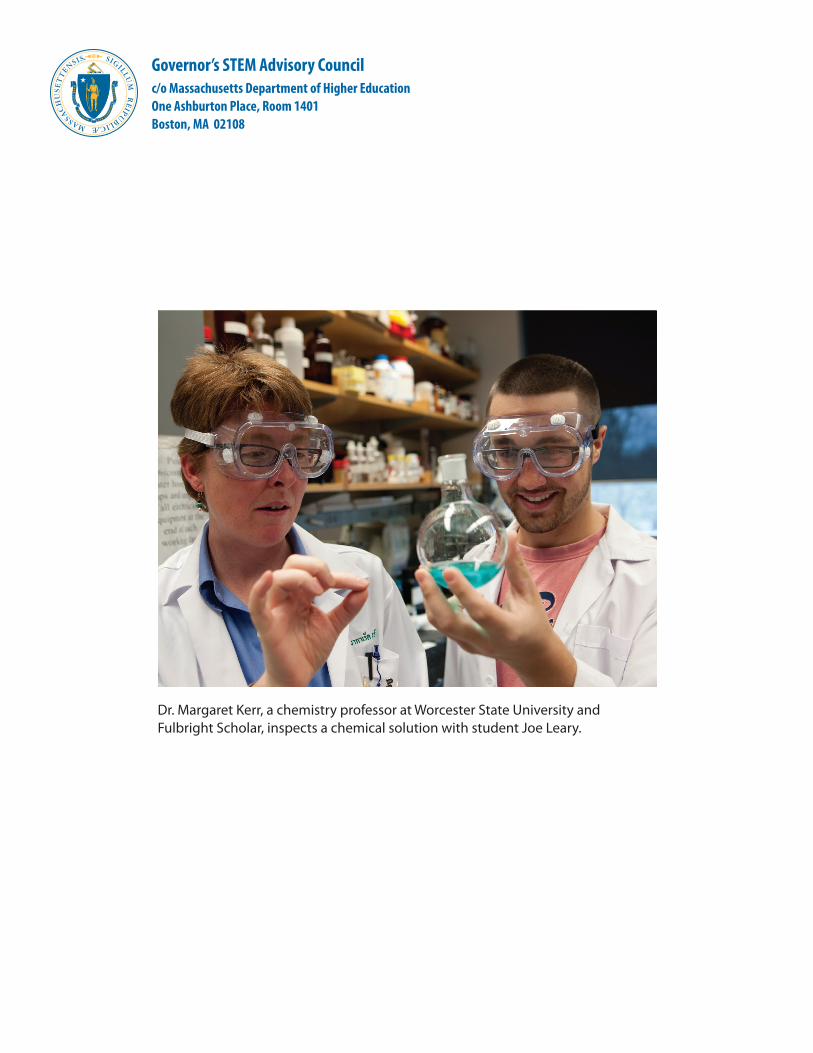
Governor’s STEM Advisory Councilc/o Massachusetts Department of Higher Education One Ashburton Place, Room 1401 Boston, MA 02108
Dr. Margaret Kerr, a chemistry professor at Worcester State University and Fulbright Scholar, inspects a chemical solution with student Joe Leary.