massachusetts afterschool research study (mars) - national
TRANSCRIPT

Pathways to Success for Youth:What Counts in After-School
Massachusetts After-School Research Study (MARS)
REPORT
Intercultural Center for Research in Education (INCRE)Arlington, MANational Institute on Out-of School Time (NIOST)Wellesley Centers for Women • Wellesley College
Acknowledgements The authors would like to thank the many individuals and organizations who contributed to the Massachusetts Afterschool Research Study (MARS). The staff of the major funding partner—United Way of Massachusetts Bay—worked hand in hand with us throughout the entire process, from conceptualizing the study to working through the inevitable challenges of carrying out a project of this scope. We would especially like to thank Don Buchholtz, Lisa Pickard, Peg Sprague, Jane Feinberg, and Mary Kay Leonard. In addition, Fran Barrett of the Massachusetts Office of Child Care Services and Karyl Resnick of the Massachusetts Department of Education played key roles, providing contacts, context, funding, and feedback, as the need arose. The Nellie Mae Education Foundation provided additional support for the middle school youth survey, which allowed us to include the voices of the participants themselves. We would also like to acknowledge our Advisory Group. The members included Sheri Adlin, Bob Monahan, Jennifer Davis, Maryellen Coffey, Maria M. Del Rio, Adrian Haugabrook, Dishon Mills, Karyl Resnick, Blenda Wilson, Lynn D'Ambrose, Fran Barrett, Eric Buch, Jude Goldman, Jim Horne, Marion Kane, Kerry Herlihy Sullivan, Robert Wadsworth, and Gwynn Hughes, Janet McKeon, and Ellen Gannett. These committed individuals contributed invaluable advice, questions, and suggestions from their many different perspectives, strengthening the research design, implementation, and analysis. The following staff members of INCRE and NIOST served on the research team: Tom Breen, Julie Dennehy, Georgia Hall, Kristin Lewis-Warner, Beth M. Miller, Joyce Shortt, and John Zuman. In addition, the following individuals conducted site visits at participating programs: David Alexander, Ruth Bowman, Claudette Fongkong-Mungal, Lynn Hatch, Luis Melendez, and Erika Moldow. A number of other researchers assisted with the study in a variety of important ways and we thank them for their support: Nancy Barra, Tahisha David, Mareike Every, Ellen Gannett, Diane Gruber, Laura Israel, Fern Marx, Loreto Ruiz, Wendy Surr, and Allison Tracy. The MARS project was only possible through the collaboration of ten school districts and a multi-district collaborative. School superintendents, OCCS administrators, 21st Century Community Learning Center Grant Coordinators, and other key afterschool stakeholders across the state, from Boston, Fall River, Framingham, Greenfield, the Hampshire Educational Collaborative, Holyoke, Lowell, Northampton, South Hadley, Turners Falls, and Worcester, all took time out of their extremely busy schedules to help us in selecting sites, collecting data, and understanding our findings. Last but certainly not least, we give our heartfelt thanks to the hundreds of individuals connected to the 78 afterschool programs that took part in the MARS study. While we continue to protect their confidentiality, we also want each of them to know how much we appreciate their contribution. The afterschool administrators, program coordinators, program staff, middle school youth, school teachers, and principals who participated in MARS did so without any compensation or direct benefit. They hosted our visits, collected consents from parents, filled out surveys, tracked down school teachers, and much more. They did it for one reason: their belief in the field, and their dedication to the children who will benefit from our increased understanding of how afterschool programs contribute to healthy learning and development. This study truly would not have been possible without them.
2005 United Way of Massachusetts Bay i

We thank all those who helped in every way and we hope that this report does justice to their contributions. At the same time, all the findings, interpretations, and errors herein should be attributed solely to the authors.
2005 United Way of Massachusetts Bay ii

Table of Contents I. Introduction .....................................................................................................................1
II. Description of the MARS Study and Sample.................................................................6
III. Program Characteristics and Program Quality ............................................................17
IV. Program Participation and Youth Outcomes ..............................................................22
Program Characteristics and Youth Outcomes .........................................................23
Staff Characteristics and Youth Outcomes ...............................................................24
Program Quality and Youth Outcomes.....................................................................24
VI. References....................................................................................................................32
Appendix A. Research Tools Used in MARS ...................................................................37
Appendix B. Survey of Afterschool Youth Outcomes: Staff Version...............................40
Appendix C. Path Models for Quality Indicators and Youth Outcomes ...........................43
2005 United Way of Massachusetts Bay 1

I. Introduction For the past 10 years, expectations of afterschool programs have increased, as the public looks to these programs to support working families, stem youth crime, and, most recently, boost academic achievement. Despite these ideas, and the increased funding that has accompanied them, little is known about how programs affect young people and which aspects of programs are most likely to result in positive outcomes for youth. How does program participation affect youth? What factors are likely to lead to high quality, effective programs? What is the quality of existing afterschool programs? The Massachusetts Afterschool Research Study (MARS) was designed to help answer these questions. This brief report reviews the rationale and, research of the MARS study and summarizes the key findings. The Massachusetts Afterschool Research Study has two major goals: (1) to identify those program characteristics that are most closely related to high quality implementation, and (2) to explore the links between program quality and youth outcomes. We focus on afterschool programs serving elementary and middle school youth from ten different communitiesacross the state, including urban, suburban, and rural areas, with an emphasis on communities that include lower income children who are the most likely to benefit from program participation (Posner and Vandell 1994; Marshall, Coll et al. 1997; Posner and Vandell 1999; Huang, Gribbons et al. 2000; Miller 2003). By examining a range of academic and non-academic outcomes, and linking these to program practices, the MARS study is designed to build our understanding of the complex relationships between program goals, program practices, and outcomes for youth. The study focuses on 4,108 children in 78 afterschool programs distributed across the state of Massachusetts. As such, it is the largest study of its kind to date in the Commonwealth.
Research on Afterschool Programs Most of the intense interest in afterschool programs over the last decade has been fueled by the idea that program participation can boost children’s success in school. The pressure to increase standardized test scores, coupled with the financial and bureaucratic challenges of reforming schools, has led policymakers to consider the potential of afterschool programs to be harnessed to the cause of academic achievement. Over the past ten years, this interest has led to significantly increased funding nationally for the field; in addition to investments in cities and states around the country, the federal government’s interest has resulted in nearly $1 billion per year of grants through the 21st Century Community Learning Centers (21st CCLC) program. Despite this increasing interest, the research on the direct academic effects of program participation has been mixed, with some studies finding increases in academic achievement measures such as grades and test scores (Posner and Vandell 1994; Baker and Witt 1996; Carlisi 1996; Hamilton and Klein 1998; Schinke, Cole et al. 1998; Hamilton, Le et al. 1999; Johnson, Zorn et al. 1999; Huang, Gribbons et al. 2000; Huang 2001; University of California Irvine 2002; Espino, Fabiano et al. 2004) while others find no such effects (Vandell and Corasaniti 1985; Schwager, Garcia et al. 1997; Jordan and Nettles 1999; Scales 1999; Trousdale 2000; National Institute of Child Health and Human Development Early Child Care Research Network 2004). The only national study to date of the impact of 21st CCLC’s found minimal effects on academic outcomes (U.S. Department of Education 2003). These discrepant results are no doubt due in part to differences in study methodology, validity, populations served, and so on, but researchers agree that a key reason is that many past studies
2005 United Way of Massachusetts Bay 1

have not taken program quality into consideration (Bissell, Cross et al. 2003; Mahoney and Zigler 2003; Vandell 2003; Granger and Kane 2004; Kane 2004). Unfortunately, few studies are available to help us understand how, why, and when program goals, characteristics, and quality results in positive outcomes for youth (Miller 2003; Bodilly and Beckett 2005).
Past research on afterschool programs has often focused on whether programs are “good” or “not good” for children and youth. We don’t expect a child who attends a bad school or a low quality child care center (or lives in a harmful family environment) to experience positive results from this experience. The quality of the environment, interacting in complex ways with what the child brings to the experience (personality, gender, race, experiences in other settings, etc.) results in outcomes for youth.
It is common sense that low quality programs are unlikely to produce positive outcomes for youth. Many studies may be mixing low and high quality programs, and therefore finding little evidence of program effects. Unfortunately, at this point in the development of the field, we have only limited knowledge about how program quality is related to youth outcomes. By examining a range of outcomes, and linking these youth outcomes to program practices, the MARS study is designed to build our understanding of the complex relationships between program practices and outcomes for youth.
We do have some previous studies that guided our research design. In two studies of elementary school children, Vandell and her colleagues (Rosenthal and Vandell 1996; Pierce, Hamm et al. 1999) found that positive interactions between staff and children, as well as between children and peers, were related to successful functioning. A team of researchers from the RAND corporation (Beckett, Hawken et al. 2001) reviewed all existing studies of afterschool program quality in 2001. While concluding that there were few studies emulating high scientific standards, they found a number of program practices that the data supported as good indicators of program quality, includingstaff training, education, and compensation, low child-to-staff ratio, age-appropriate activities, positive emotional climate, communication with school and families, and community partnerships. A recent review by the National Research Council’s Committee on Community-Level Programs for youth (Eccles and Gootman 2002), drawing broadly on research in psychology, identified eight features of developmental settings: physical and psychological safety; appropriate structure; supportive relationships: explicit mentoring, or implicit program design for extensive one-to-one, or small group connections between young people and adults; opportunities to belong; positive social norms; support for efficacy and mattering: opportunities for autonomy, taking responsibility, and challenge; opportunities for skill building; and integration of family, school and community efforts. Furthermore, it is not clear that expecting programs to have direct academic effects is a fruitful avenue for the afterschool field in general. There is a growing consensus that, while afterschool programs can contribute to improving academic achievement, they are best suited to support development in what might be termed the “prerequisites” for academic success, which are also assets key to healthy development in general (Boggiano and Pittman 1992; McLaughlin, Irby et al. 1994; Benard 1996; Pittman and Irby 1996; Scales and Leffert 1999; Benson and Saito 2000; Miller 2003). A growing body of research suggests that afterschool programs can have positive effects on many of these “intermediary” outcomes, including an interest in learning, social competence, improved behavior, expectations of success, leadership skills, and parental involvement (Pierce, Hamm et al. 1999; Larson 2000; Walker and Arbreton 2004; Mahoney and Lord 2005; Vandell, Dadisman et al. 2005).
2005 United Way of Massachusetts Bay 2

These intermediary outcomes for academic achievement are focused on engagement in learning and motivation. In addition, they include attitude-related factors such as a sense of hope for the future as well as skills such as good work habits, competencies in cognitive and non-cognitive areas, and behaviors such as reduction in risk-taking (for summaries, see Leffert, Saito et al. 1996; Catalano, Berglund et al. 1998; Eccles and Gootman 2002; Rothstein 2004). Motivation and engagement in learning have been identified in the education literature as key factors in promoting academic success (Clark 1988; Csikszentmihalyi and Nakamura 1989; Eccles and Midgley 1989; Boggiano and Pittman 1992; Connell, Spencer et al. 1994; Department of Education 1998; National Institute of Child Health and Human Development 1998; Nettles and Robinson 1998; Wentzel and Wigfield 1998; Eccles, Wigfield et al. 2000; Ross and Broh 2000; Ryan and Patrick 2001; Corbett and Wilson 2002; Danielson 2002; Barton 2003; Elias 2003; Marzano 2003; Klem and Connell 2004; Learning Point Associates 2004; Libbey 2004; Mahoney and Lord 2005; Sadowski 2005; Lee, Smith et al. NA). Finally, it is likely that there are specific afterschool program characteristics that promote particular outcomes. For example, one program might be particularly effective in promoting math skills, while another builds children’s motivation to learn and a third increases their ability to get along with peers. By examining a range of academic and non-academic outcomes, and linking these to program practices, the MARS study is designed to build our understanding of the complex relationships between program goals, program practices, and outcomes for youth.
Conceptual Framework for the Study The MARS study was conducted in a total of 78 afterschool program sites in ten geographically and economically diverse school districts. Building on previous studies, the MARS team developed a conceptual framework that posits two types of program features: (1) program characteristics, which vary between programs, are structural in character, and may or may not be related to program quality; and (2) program quality, which is process-oriented, and captures the actual program as it is implemented. Table 1 provides some examples of each type of program feature.
Table 1. Examples of Program Characteristics and Program Quality Indicators
Program Characteristic Program Quality Indicator Location (school, community) Staff-youth interactions Number of Youth Enrolled Youth-youth interactions Ages Served Engaging activities Funding Sources Communication with families Group Size for Activities Homework support Program characteristics affect program quality, as well as leading to outcomes for youth (see Figure 1, below). Other factors also affect youth outcomes. Child and family characteristics such as income, gender, race, or special needs status might affect the extent or ways in which program participation results in youth outcomes. In addition, simply enrolling in a program is not likely to lead to outcomes unless a child spends a significant amount of time there (intensity) over a number of months (duration). The effects measured by the MARS study include both academic and non-academic outcomes.
2005 United Way of Massachusetts Bay 3

Figure 1. Conceptual Framework for MARS
Afterschool Program Characteristics/Type
For example:
• Location
• Activities
• Size
• Ages Served • Funding Sources
Child & Family Characteristics
Dosage
Afterschool Program Quality
For example:
• Interactions Between Staff-Child & Staff-Parent
• Structure/Curriculum
• Role of Staff
• Staff Turnover
• Engaging activities
• Youth Participation
For example: • Demographics
• Gender
• Race/ethnicity Youth Outcomes
For example: • Behavior in the Program
• Initiative: Motivation & Persistence in Effort
• Relationship with Peers & Adults in the Program
• Homework Completion & Effort
Overall, the MARS study aims to answer the following research questions:
1) What kinds of afterschool programs are children and youth in the study attending? What variation do we find in program characteristics and features, including activities offered, ages served, goals, type of staff utilized and level of participation by youth?
2) In what ways are program characteristics and features related to program quality?
3) What outcomes for youth are associated with attending afterschool programs? How do these outcomes vary depending on program practices and features? Which program characteristics and aspects of quality are associated with youth development and student learning outcomes?
In answering these questions, the MARS study can deepen our understanding of the current status of the field of afterschool programs in the Commonwealth and across the nation, as well as provide guidance on how to build stronger, more effective, higher quality programs in the future. However, it is important to keep in mind that a single study can only point to fruitful approaches, not provide unequivocal answers. As a correlational study, MARS can not prove that program participation causes changes in youth outcomes. That is, while we are able to statistically link changes in youth outcomes to program features, we cannot prove that it is program participation, rather than other factors, that accounts for the results. Nor can we necessarily generalize the results beyond the programs in the study, which were not randomly selected from all programs in the state. In addition, there are areas that,
2005 United Way of Massachusetts Bay 4

while relevant to our research questions, are beyond the scope of the study. For example, we were not able to conduct a cost study, and so cannot speak directly to the effects of or need for financing afterschool programs. In addition, as a study focused on programs, we were not able to look in depth at local infrastructure, which can provide important support to individual afterschool programs.
2005 United Way of Massachusetts Bay 5
II. Description of the MARS Study and Sample In order to answer our research questions, we needed to collect information on programs as well as the individual children and youth who attend the programs. We visited each program in our sample of 78 afterschool programs in the fall of 2003 and again in the spring of 2004, conducting interviews with program directors in the fall and interviews as well as observations in the spring. The interviews focused on program goals and characteristics, while the observations captured program quality. In addition, we collected data on school attendance, program attendance, and child and family characteristics from both programs and schools. To capture youth outcomes, we utilized the Survey of Afterschool Youth Outcomes (SAYO) already being used by state-funded 21st Century Community Learning Center grantees in Massachusetts in their self-evaluations. The SAYO is a brief survey of questions about an individual student, conducted in the fall and again in the spring. It includes a version completed for each youth by an afterschool staff person (SAYO-S) as well as a teacher (SAYO-T). The SAYO collects information on a range of both academic and non-academic outcomes. To better understand the perspective of youth on their afterschool programs, we conducted a survey of youth in 16 participating middle school programs. Appendix A provides further information on the major measures used in the MARS study.
The MARS Sample The diverse statewide sample of 78 programs in the MARS study included 58 programs located in urban areas, 14 programs located in suburban areas, and 6 programs located in rural areas or small towns. The following 10 Massachusetts public school districts collaborated with the MARS data collection: Boston, Fall River, Framingham, Greenfield, Holyoke, Lowell, Northampton, South Hadley, Turners Falls and Worcester. Four of these districts, Greenfield, Northampton, South Hadley and Turners Falls, participated in collaboration with the Hampshire Education Collaborative (HEC). To be eligible for the MARS study, programs needed to meet the following criteria: have been in operation for two years or more; serve either elementary or middle school youth or both; have regularly enrolled youth who attend at least four days per week (i.e., not drop-in); and be funded by either the Massachusetts Office of Child Care Services (OCCS) and classified as a Tier 4 program, supported by the Massachusetts Department of Education’s 21st Century Community Learning Centers (CCLC), and/or supported by a local United Way agency. Program Models While a wide range of programs were included, we chose not to include single-focus programs such as sports, arts, or academic remediation project, or programs primarily serving high school students. The majority of the programs in the sample could be categorized as either school-age child care programs or academic enrichment programs, which share certain characteristics but grew out of different concerns that mold them to this day. School-age child care programs, many of which date to the 1980’s, aim to provide general developmental support for children of working families. While many are located in community centers, it is also common for school-age child care programs to be located in schools, where they are run under the auspices of a community-based agency. School-age child care programs are usually open five days per week, as well as school vacations and holidays.
2005 United Way of Massachusetts Bay 6

Academic enrichment programs, most of which are relatively new, are focused on increasing the school success of youth. They are usually located in a school, and often depend on school paraprofessionals and teachers for the core of their staff. They are typically open fewer hours than school-age child care programs, and typically are closed for school holidays and vacations. Table 2 summarizes some of the key differences between these two afterschool program prototypes. Table 2. Prototypes of Two Models for Afterschool Programs
School-Age Child Care Academic Enrichment
Major Goals • Provide caring supervision for
children of working families • Support child development
• Improve academic achievement • Decrease gaps in academic
achievement Accountability Framework
• Licensing • Accreditation
• State standards-based tests • 21st CCLC evaluations
Staff • Child care staff, college students
• Teachers, paraprofessionals
Funding • Parent fees • Child Care Development Fund
(OCCS)
• State and federal grants, especially 21st CCLC (DOE)
• Local district support (in-kind)
The final sample included a wide variety of programs. Programs received funding from their local United Way, the Office of Child Care Services, and the Department of Education’s 21st CCLC grants, with some programs receiving funding from more than one of these sources (see Table 3 We used latent profile modeling to categorize programs as either school-age child care or academic enrichment models. While about three-quarters were best described as school-age child care, over one in five programs were categorized as academic enrichment. Sixty of the 78 programs in the study served elementary school youth (most of which were school-age child care programs), 15 were middle schools (most of which were academic enrichment), and three had youth ranging from grades K-8. The sample included programs operated by YMCA, Boys & Girls Clubs, Citizen Schools, faith-based organizations, and others. Most programs in the sample were administered by community-based organizations but located in schools, reflecting the partnerships common in the afterschool field. While the sample of programs selected to participate in MARS is very diverse, it does not include all types of afterschool programs in Massachusetts. For example, the study does not include programs that focus primarily on sports, academic remediation, music and arts, and does not include drop-in or high school programs. There were also differences within the sample regarding their alignment with the observation and outcomes tools: A subset of programs in the study—those receiving funding through the Massachusetts 21st Century Community Learning Centers grant program—had been required to report on selected SAYO outcomes for the previous three years.
2005 United Way of Massachusetts Bay 7

Table 3. Program Description
Number (N)
Percentage (%)
Funding Sources DOE 27 35 OCCS 39 50 United Way 46 59 Program Model School-age child care 62 79 Academic achievement 16 21 Age Group Served Elementary 60 77 Middle 15 19 Mixed 3 4
Auspice (Administration) Community-based organization 57 73
Faith-based organization 18 23 School 31 40 Location Schools 55 71
Community 23 29 While there were a total of 4,892 children and youth enrolled in October 2003 in MARS programs, an estimated 6,100 children and youth were enrolled in the programs at some point during 2003-04. The additional enrollment was primarily due to children/youth registering for a particular semester or specific course in the academic enrichment programs, rather than from turnover in yearlong programs. In the academic enrichment programs children/youth are more likely to enroll for a particular semester or session, or for two or three days per week, whereas school-age child care programs tend to enroll children and youth five days per week year round. The afterschool programs in the MARS sample reported an average enrollment of 63 children/youth in October 2003, with a range from 14 to over 300. The average enrollment for the 60 programs that serve children in grades K-5 was 53, whereas the average enrollment for the 18 programs that serve middle school youth was 96. Staffing Afterschool programs utilize a range of paid and unpaid staff, including community volunteers, high school student tutors, regular day teachers, and various specialists. Across the sample of 78 programs in MARS, there were a total of 675 paid staff, for an average of 8.7 paid staff per program. Forty-eight percent of paid staff were reported to have a bachelor degree or higher degree, and an additional 7 percent of paid staff were reported having a two-year associate degree. Low salaries and the fact that most staff positions are part-time limit the number of qualified candidates who are attracted to these positions. There is a wide range of pay for staff of the MARS sample programs, reflecting the variations in program models, staffing and resources (see
2005 United Way of Massachusetts Bay 8
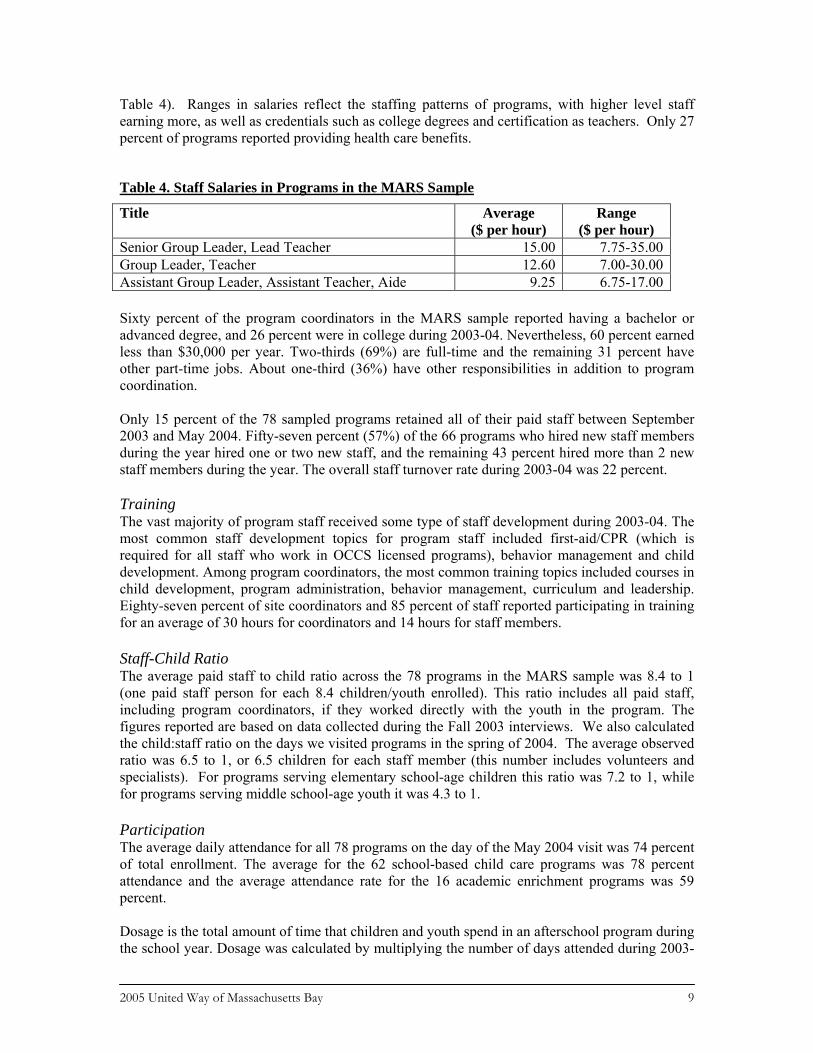
Table 4). Ranges in salaries reflect the staffing patterns of programs, with higher level staff earning more, as well as credentials such as college degrees and certification as teachers. Only 27 percent of programs reported providing health care benefits.
Table 4. Staff Salaries in Programs in the MARS Sample
Title Average ($ per hour)
Range ($ per hour)
Senior Group Leader, Lead Teacher 15.00 7.75-35.00Group Leader, Teacher 12.60 7.00-30.00Assistant Group Leader, Assistant Teacher, Aide 9.25 6.75-17.00 Sixty percent of the program coordinators in the MARS sample reported having a bachelor or advanced degree, and 26 percent were in college during 2003-04. Nevertheless, 60 percent earned less than $30,000 per year. Two-thirds (69%) are full-time and the remaining 31 percent have other part-time jobs. About one-third (36%) have other responsibilities in addition to program coordination. Only 15 percent of the 78 sampled programs retained all of their paid staff between September 2003 and May 2004. Fifty-seven percent (57%) of the 66 programs who hired new staff members during the year hired one or two new staff, and the remaining 43 percent hired more than 2 new staff members during the year. The overall staff turnover rate during 2003-04 was 22 percent. Training The vast majority of program staff received some type of staff development during 2003-04. The most common staff development topics for program staff included first-aid/CPR (which is required for all staff who work in OCCS licensed programs), behavior management and child development. Among program coordinators, the most common training topics included courses in child development, program administration, behavior management, curriculum and leadership. Eighty-seven percent of site coordinators and 85 percent of staff reported participating in training for an average of 30 hours for coordinators and 14 hours for staff members. Staff-Child Ratio The average paid staff to child ratio across the 78 programs in the MARS sample was 8.4 to 1 (one paid staff person for each 8.4 children/youth enrolled). This ratio includes all paid staff, including program coordinators, if they worked directly with the youth in the program. The figures reported are based on data collected during the Fall 2003 interviews. We also calculated the child:staff ratio on the days we visited programs in the spring of 2004. The average observed ratio was 6.5 to 1, or 6.5 children for each staff member (this number includes volunteers and specialists). For programs serving elementary school-age children this ratio was 7.2 to 1, while for programs serving middle school-age youth it was 4.3 to 1. Participation The average daily attendance for all 78 programs on the day of the May 2004 visit was 74 percent of total enrollment. The average for the 62 school-based child care programs was 78 percent attendance and the average attendance rate for the 16 academic enrichment programs was 59 percent. Dosage is the total amount of time that children and youth spend in an afterschool program during the school year. Dosage was calculated by multiplying the number of days attended during 2003-
2005 United Way of Massachusetts Bay 9
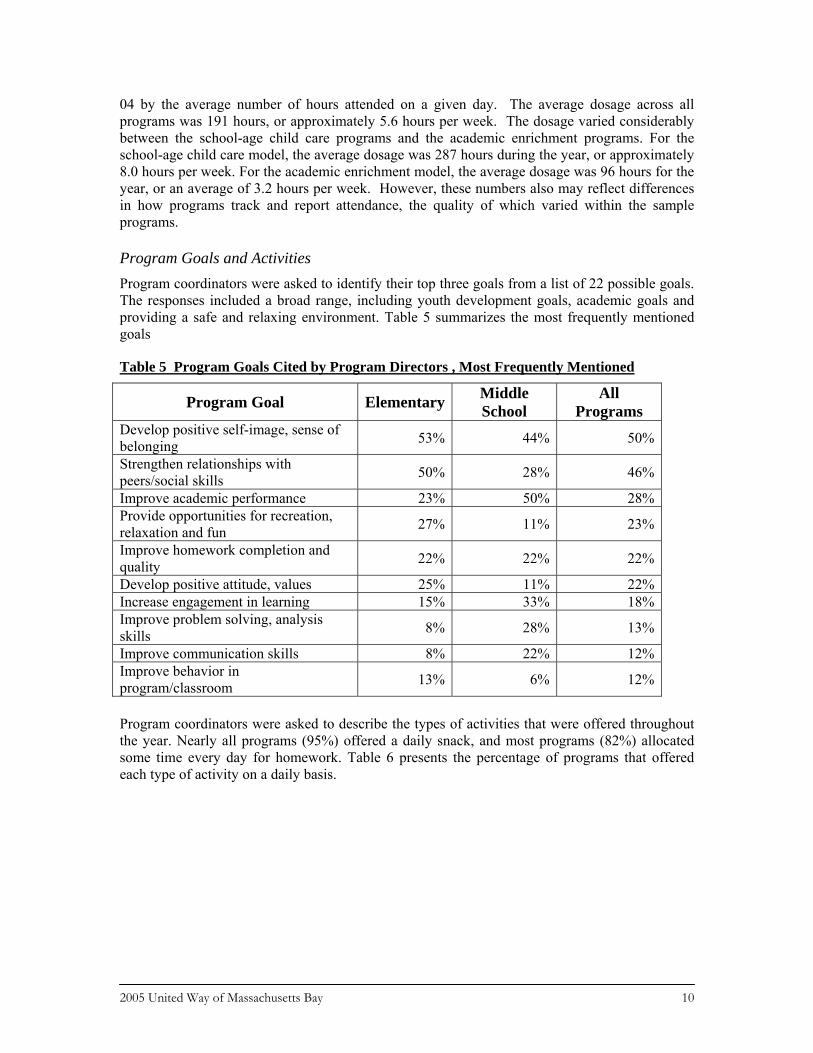
04 by the average number of hours attended on a given day. The average dosage across all programs was 191 hours, or approximately 5.6 hours per week. The dosage varied considerably between the school-age child care programs and the academic enrichment programs. For the school-age child care model, the average dosage was 287 hours during the year, or approximately 8.0 hours per week. For the academic enrichment model, the average dosage was 96 hours for the year, or an average of 3.2 hours per week. However, these numbers also may reflect differences in how programs track and report attendance, the quality of which varied within the sample programs. Program Goals and Activities Program coordinators were asked to identify their top three goals from a list of 22 possible goals. The responses included a broad range, including youth development goals, academic goals and providing a safe and relaxing environment. Table 5 summarizes the most frequently mentioned goals
Table 5 Program Goals Cited by Program Directors , Most Frequently Mentioned
Program Goal Elementary Middle School
All Programs
Develop positive self-image, sense of belonging 53% 44% 50%
Strengthen relationships with peers/social skills 50% 28% 46%
Improve academic performance 23% 50% 28%Provide opportunities for recreation, relaxation and fun 27% 11% 23%
Improve homework completion and quality 22% 22% 22%
Develop positive attitude, values 25% 11% 22%Increase engagement in learning 15% 33% 18%Improve problem solving, analysis skills 8% 28% 13%
Improve communication skills 8% 22% 12%Improve behavior in program/classroom 13% 6% 12%
Program coordinators were asked to describe the types of activities that were offered throughout the year. Nearly all programs (95%) offered a daily snack, and most programs (82%) allocated some time every day for homework. Table 6 presents the percentage of programs that offered each type of activity on a daily basis.
2005 United Way of Massachusetts Bay 10
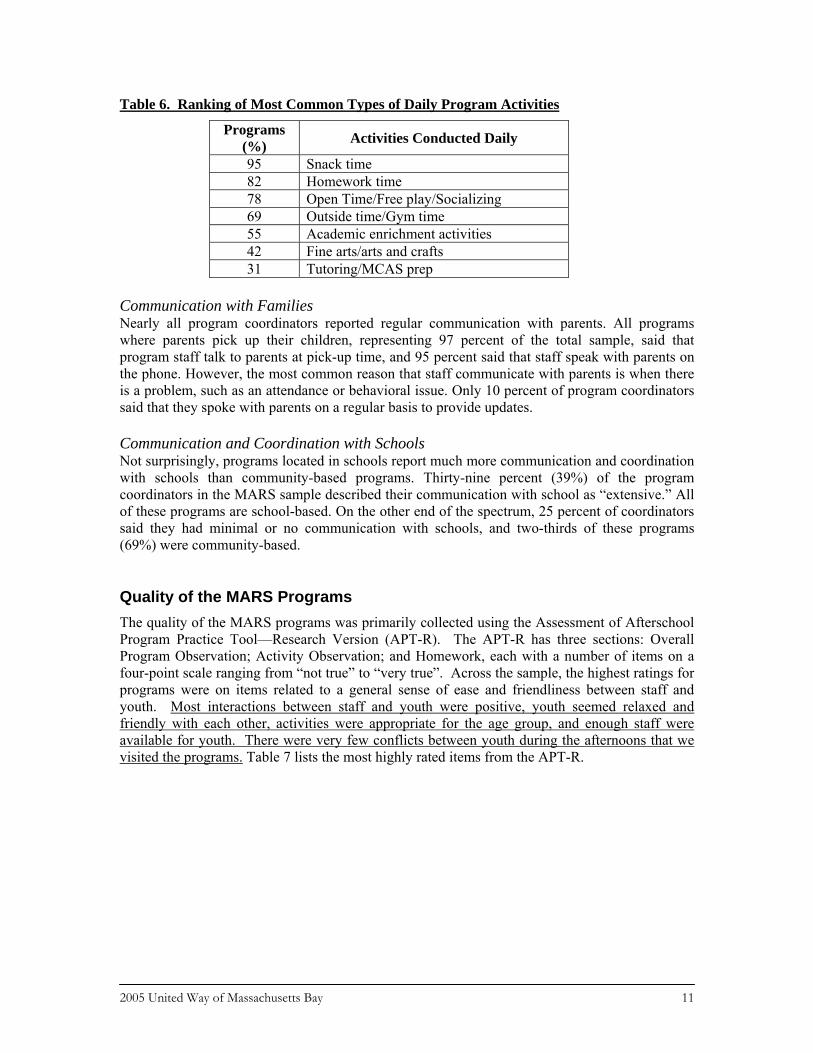
Table 6. Ranking of Most Common Types of Daily Program Activities
Programs (%) Activities Conducted Daily
95 Snack time 82 Homework time 78 Open Time/Free play/Socializing 69 Outside time/Gym time 55 Academic enrichment activities 42 Fine arts/arts and crafts 31 Tutoring/MCAS prep
Communication with Families Nearly all program coordinators reported regular communication with parents. All programs where parents pick up their children, representing 97 percent of the total sample, said that program staff talk to parents at pick-up time, and 95 percent said that staff speak with parents on the phone. However, the most common reason that staff communicate with parents is when there is a problem, such as an attendance or behavioral issue. Only 10 percent of program coordinators said that they spoke with parents on a regular basis to provide updates. Communication and Coordination with Schools Not surprisingly, programs located in schools report much more communication and coordination with schools than community-based programs. Thirty-nine percent (39%) of the program coordinators in the MARS sample described their communication with school as “extensive.” All of these programs are school-based. On the other end of the spectrum, 25 percent of coordinators said they had minimal or no communication with schools, and two-thirds of these programs (69%) were community-based.
Quality of the MARS Programs The quality of the MARS programs was primarily collected using the Assessment of Afterschool Program Practice Tool—Research Version (APT-R). The APT-R has three sections: Overall Program Observation; Activity Observation; and Homework, each with a number of items on a four-point scale ranging from “not true” to “very true”. Across the sample, the highest ratings for programs were on items related to a general sense of ease and friendliness between staff and youth. Most interactions between staff and youth were positive, youth seemed relaxed and friendly with each other, activities were appropriate for the age group, and enough staff were available for youth. There were very few conflicts between youth during the afternoons that we visited the programs. Table 7 lists the most highly rated items from the APT-R.
2005 United Way of Massachusetts Bay 11

Table 7. Items from APT-R with Highest Mean Scores (Scale of 1-4)
Item Mean Rating
Program Practices/Environment There is an established arrival routine that seems familiar to staff and youth 3.8 Appropriate physical space for activity 3.8 Activity is age-appropriate 3.7 Appropriate physical space for youth to comfortably do homework 3.6 Youth appear relaxed 3.5
Staff Practices Staff use appropriate vocabulary 3.8 Staff appear to be familiar with youth 3.8 Staff are respectful and supportive of one another 3.6 Staff interpersonal communication do not interfere with program 3.6 Staff do not over-control the group 3.6 When youth ask for help with homework, staff respond in a timely manner 3.6 Staff are aware of children's arrival and departure 3.5 Staff appear relaxed and calm 3.5 Staff apply rules and limits fairly and consistently to youth 3.5 Despite the relatively positive atmosphere in most programs, there were also some indicators of quality that we did not see frequently. For example, staff did not generally engage youth in reflection, they tended not to ask open-ended questions in order to stimulate conversations, or make extensive use of positive reinforcement. The APT-R Activity ratings suggest that activities tended not to require prior preparation by staff, included limited direction or leadership by youth, and tended not to build on the diverse cultures of the children/youth in the program. We saw very few examples of what we term “intentional” learning activities that have clear learning objectives, actively engage youth in a process of guided learning, and include staff as facilitators of the learning process (although in some cases, intentional learning probably existed and simply wasn’t observable by the visitor). The APT-R staff ratings are consistent with the Activity ratings: while staff tend to effectively control activities and maintain calm, they tend not to engage with children and youth to elicit reflection, spark interest and facilitate learning. The Homework ratings suggest a similar pattern as the Activity and Overall Staff ratings: while staff tend to effectively manage homework time, they tend not to engage extensively with children/youth to encourage them and engage with them in learning. Table 8 lists the items with the lowest average ratings on the APT-R.
2005 United Way of Massachusetts Bay 12
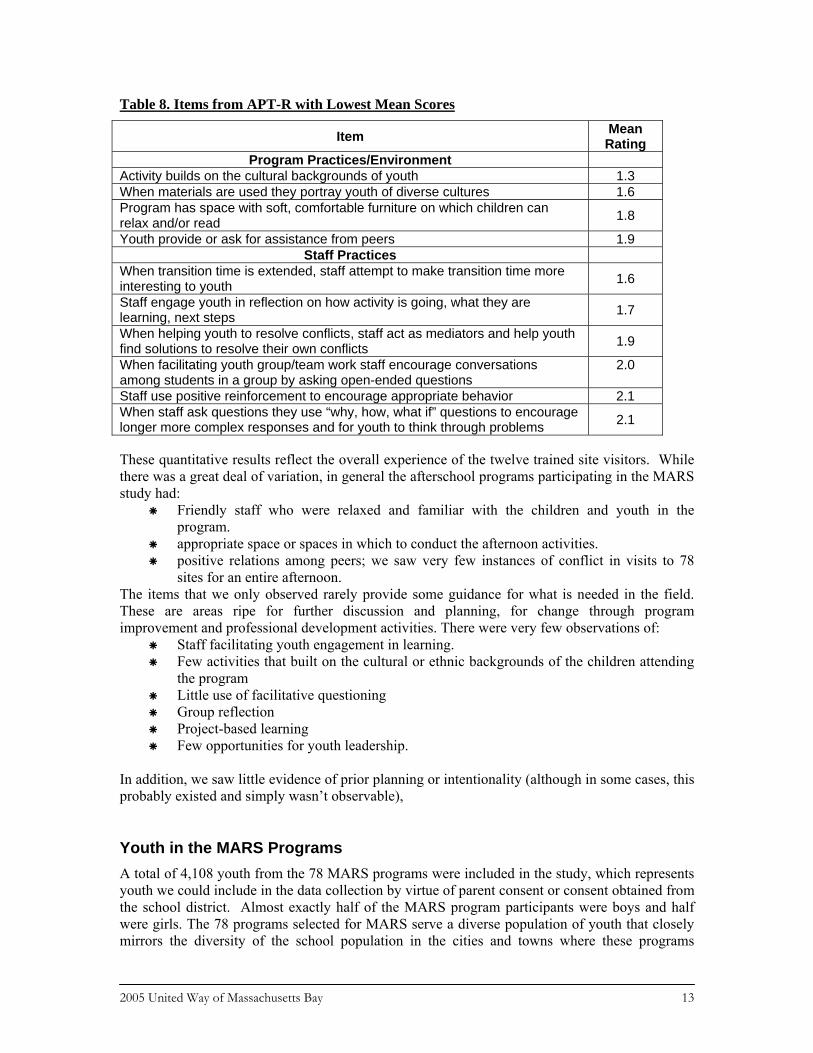
Table 8. Items from APT-R with Lowest Mean Scores
Item Mean Rating
Program Practices/Environment Activity builds on the cultural backgrounds of youth 1.3 When materials are used they portray youth of diverse cultures 1.6 Program has space with soft, comfortable furniture on which children can relax and/or read 1.8
Youth provide or ask for assistance from peers 1.9 Staff Practices
When transition time is extended, staff attempt to make transition time more interesting to youth 1.6
Staff engage youth in reflection on how activity is going, what they are learning, next steps 1.7
When helping youth to resolve conflicts, staff act as mediators and help youth find solutions to resolve their own conflicts 1.9
When facilitating youth group/team work staff encourage conversations among students in a group by asking open-ended questions
2.0
Staff use positive reinforcement to encourage appropriate behavior 2.1 When staff ask questions they use “why, how, what if” questions to encourage longer more complex responses and for youth to think through problems 2.1
These quantitative results reflect the overall experience of the twelve trained site visitors. While there was a great deal of variation, in general the afterschool programs participating in the MARS study had:
Friendly staff who were relaxed and familiar with the children and youth in the program.
appropriate space or spaces in which to conduct the afternoon activities. positive relations among peers; we saw very few instances of conflict in visits to 78
sites for an entire afternoon. The items that we only observed rarely provide some guidance for what is needed in the field. These are areas ripe for further discussion and planning, for change through program improvement and professional development activities. There were very few observations of:
Staff facilitating youth engagement in learning. Few activities that built on the cultural or ethnic backgrounds of the children attending
the program Little use of facilitative questioning Group reflection Project-based learning Few opportunities for youth leadership.
In addition, we saw little evidence of prior planning or intentionality (although in some cases, this probably existed and simply wasn’t observable),
Youth in the MARS Programs A total of 4,108 youth from the 78 MARS programs were included in the study, which represents youth we could include in the data collection by virtue of parent consent or consent obtained from the school district. Almost exactly half of the MARS program participants were boys and half were girls. The 78 programs selected for MARS serve a diverse population of youth that closely mirrors the diversity of the school population in the cities and towns where these programs
2005 United Way of Massachusetts Bay 13
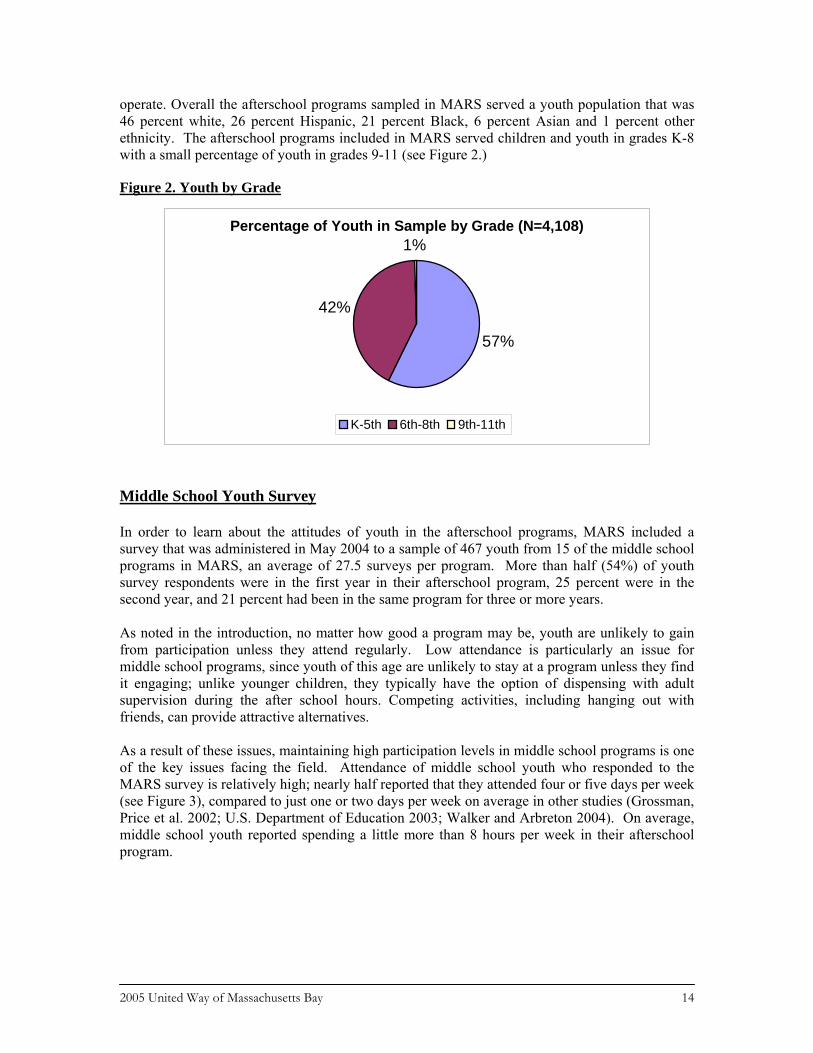
operate. Overall the afterschool programs sampled in MARS served a youth population that was 46 percent white, 26 percent Hispanic, 21 percent Black, 6 percent Asian and 1 percent other ethnicity. The afterschool programs included in MARS served children and youth in grades K-8 with a small percentage of youth in grades 9-11 (see Figure 2.)
Figure 2. Youth by Grade
Percentage of Youth in Sample by Grade (N=4,108)
57%
42%
1%
K-5th 6th-8th 9th-11th
Middle School Youth Survey In order to learn about the attitudes of youth in the afterschool programs, MARS included a survey that was administered in May 2004 to a sample of 467 youth from 15 of the middle school programs in MARS, an average of 27.5 surveys per program. More than half (54%) of youth survey respondents were in the first year in their afterschool program, 25 percent were in the second year, and 21 percent had been in the same program for three or more years. As noted in the introduction, no matter how good a program may be, youth are unlikely to gain from participation unless they attend regularly. Low attendance is particularly an issue for middle school programs, since youth of this age are unlikely to stay at a program unless they find it engaging; unlike younger children, they typically have the option of dispensing with adult supervision during the after school hours. Competing activities, including hanging out with friends, can provide attractive alternatives. As a result of these issues, maintaining high participation levels in middle school programs is one of the key issues facing the field. Attendance of middle school youth who responded to the MARS survey is relatively high; nearly half reported that they attended four or five days per week (see Figure 3), compared to just one or two days per week on average in other studies (Grossman, Price et al. 2002; U.S. Department of Education 2003; Walker and Arbreton 2004). On average, middle school youth reported spending a little more than 8 hours per week in their afterschool program.
2005 United Way of Massachusetts Bay 14

Figure 3. Days Per Week of Attendance, Youth Survey Report
Days Per Week of Attendance, Middle School Youth Report
0 5 10 15 20 25 30
5 Days Per Week
4 Days Per Week
3 Days Per Week
2 Days Per Week
1 Day Per Week
Percent
Middle school students are unlikely to remain in a program where they are unhappy. As expected, therefore, youth were generally positive about their afterschool program. Nearly two-thirds (63%) said they liked the program “a lot,” and 32 percent said they liked it “somewhat.” Only five percent said they did not like the program at all. We asked middle school youth open-ended questions about what they like most and least about their program and then categorized their responses (see Figure 4). Youth reported liking the social aspects of the program and the activities best. Nearly one in five also mentioned the homework help they received at the program as a positive. When asked what they liked least, one-third of youth said they liked everything. Among the others, homework time and the staff were the most common complaints. While only 15 percent of youth mentioned negative feelings about the staff, this response, coupled with the lack of positive responses about the staff suggests that this might be an area for further investigation in middle school programs.
2005 United Way of Massachusetts Bay 15
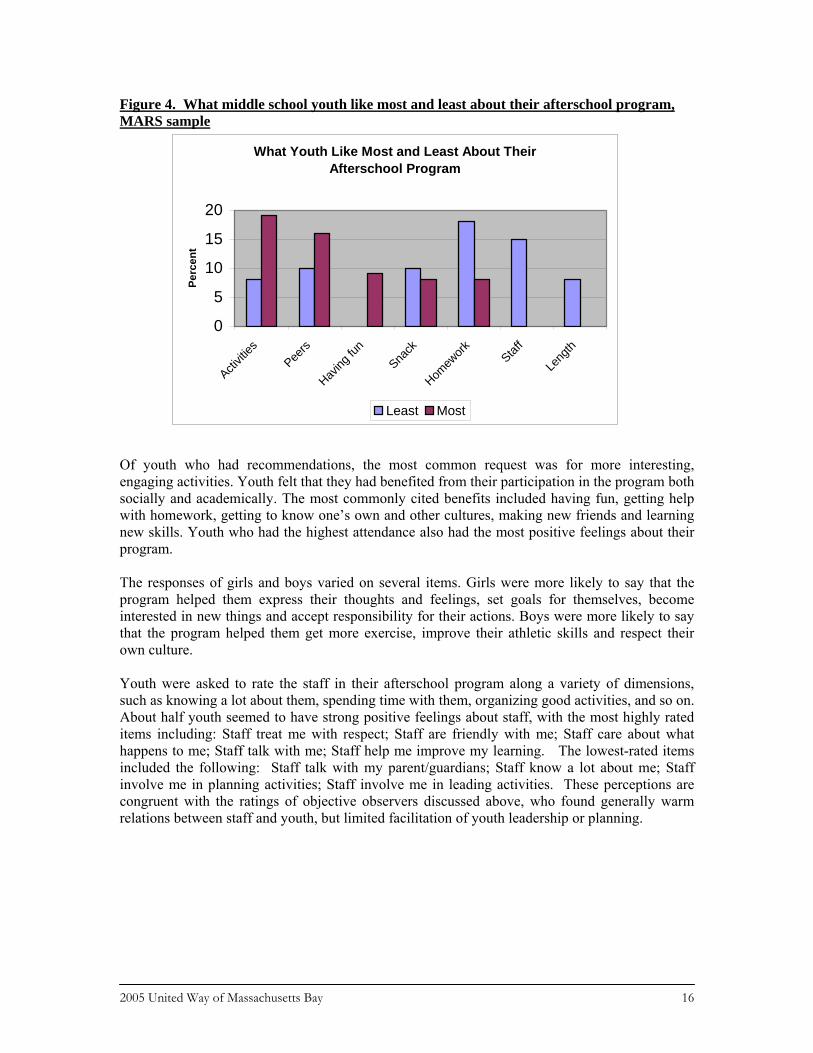
Figure 4. What middle school youth like most and least about their afterschool program, MARS sample
What Youth Like Most and Least About Their Afterschool Program
0
5
10
15
20
Activit
iesPee
rs
Having
fun
Snack
Homew
ork Staff
Leng
th
Perc
ent
Least Most
Of youth who had recommendations, the most common request was for more interesting, engaging activities. Youth felt that they had benefited from their participation in the program both socially and academically. The most commonly cited benefits included having fun, getting help with homework, getting to know one’s own and other cultures, making new friends and learning new skills. Youth who had the highest attendance also had the most positive feelings about their program. The responses of girls and boys varied on several items. Girls were more likely to say that the program helped them express their thoughts and feelings, set goals for themselves, become interested in new things and accept responsibility for their actions. Boys were more likely to say that the program helped them get more exercise, improve their athletic skills and respect their own culture. Youth were asked to rate the staff in their afterschool program along a variety of dimensions, such as knowing a lot about them, spending time with them, organizing good activities, and so on. About half youth seemed to have strong positive feelings about staff, with the most highly rated items including: Staff treat me with respect; Staff are friendly with me; Staff care about what happens to me; Staff talk with me; Staff help me improve my learning. The lowest-rated items included the following: Staff talk with my parent/guardians; Staff know a lot about me; Staff involve me in planning activities; Staff involve me in leading activities. These perceptions are congruent with the ratings of objective observers discussed above, who found generally warm relations between staff and youth, but limited facilitation of youth leadership or planning.
2005 United Way of Massachusetts Bay 16

III. Program Characteristics and Program Quality Quality Indicators The MARS study represents an extremely rich database of information on afterschool programs, both in terms of their characteristics and their quality, which can serve as a benchmark for future studies. We summarized the results of the APT observation items into five key Quality Indicators: (1) Staff Engagement with Youth, (2) Youth Engagement in the Program, (3) Challenging, Engaging Activities, (4) Quality Homework Time, and (5) Communication with Families. We conducted factor analyses to develop indicators that best represented unique and important aspects of overall program quality. Each Quality Indicator captures the results of a number of different, related items. Since the rest of this and the following chapter focus on the Quality Indicators, it is important to understand their meaning. The Quality Indicators are listed with examples of the key items that were combined through their factor loadings for the analysis.
Staff Engagement with Youth (actively engaged in activities with youth, appear to enjoy work, give positive cues, encouraging, relaxed, listen to youth, interactions are positive and respectful)
Youth Engagement (respectful of each other, responsive to staff, positive behavior, relaxed, listen to each other and cooperate with each other, positive with staff)
High Quality, Challenging Activities (appropriate for youth, instructions are clear, challenging, stimulates thinking, critical/higher order thinking, part of larger project, evidence of prior preparation, enough materials and supplies)
Quality Homework Time (staff provide individual help, staff focus on youth, staff are encouraging, staff help youth think through problems)
Family Relationships at Pick-up Time (staff greet parents when picking up child; chat with parents, acknowledge youth when they leave, parents and staff express positive nonverbal cues)
In addition, we created a structural indicator related to the environment, Appropriate Space, which included environmental items related to comfortable heat, ventilation, noise, and light levels, well organized, clean, furniture in good repair, materials in good order, and other similar items. All of the Quality Indicators had high reliability scores (see Table 9), meaning that they do a good job of representing the various items from which they are created.1
1 Internal Consistency Reliability tests the consistency of the items making up a scale through a statistic known as Cronbach’s alpha. Scores of .6 or over are generally considered acceptable, scores of .8 or over are considered high.
2005 United Way of Massachusetts Bay 17
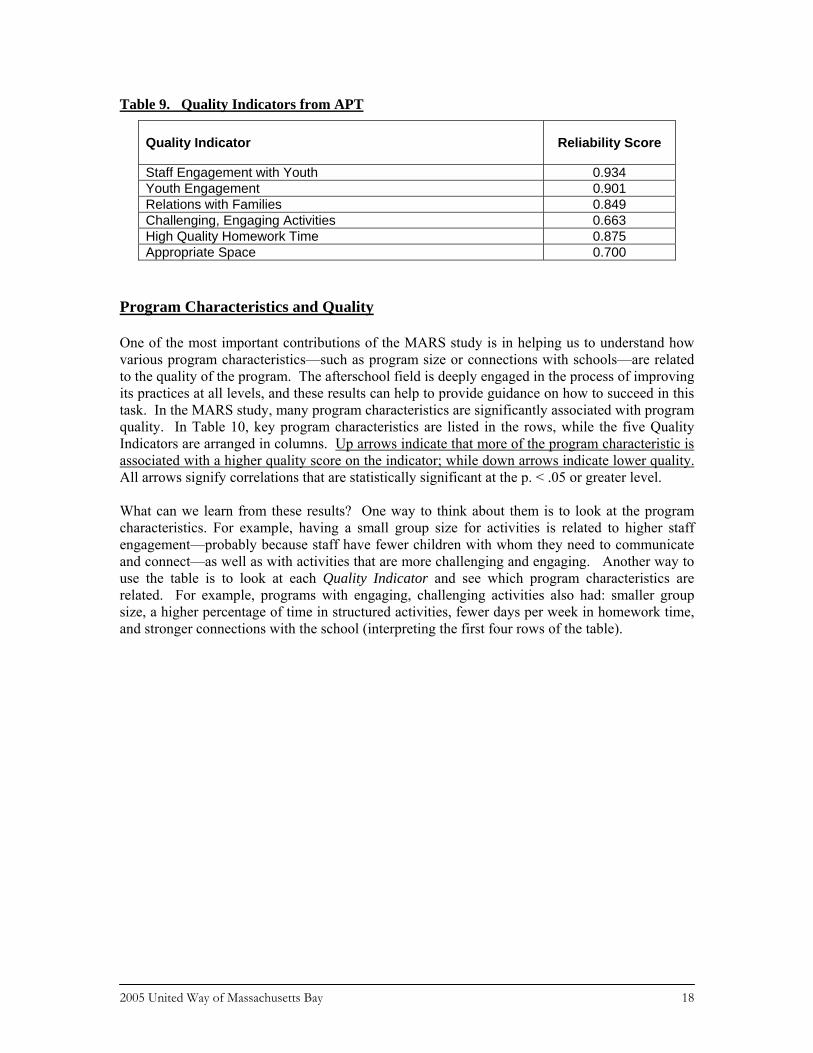
Table 9. Quality Indicators from APT
Quality Indicator Reliability Score
Staff Engagement with Youth 0.934 Youth Engagement 0.901 Relations with Families 0.849 Challenging, Engaging Activities 0.663 High Quality Homework Time 0.875 Appropriate Space 0.700
Program Characteristics and Quality One of the most important contributions of the MARS study is in helping us to understand how various program characteristics—such as program size or connections with schools—are related to the quality of the program. The afterschool field is deeply engaged in the process of improving its practices at all levels, and these results can help to provide guidance on how to succeed in this task. In the MARS study, many program characteristics are significantly associated with program quality. In Table 10, key program characteristics are listed in the rows, while the five Quality Indicators are arranged in columns. Up arrows indicate that more of the program characteristic is associated with a higher quality score on the indicator; while down arrows indicate lower quality. All arrows signify correlations that are statistically significant at the p. < .05 or greater level. What can we learn from these results? One way to think about them is to look at the program characteristics. For example, having a small group size for activities is related to higher staff engagement—probably because staff have fewer children with whom they need to communicate and connect—as well as with activities that are more challenging and engaging. Another way to use the table is to look at each Quality Indicator and see which program characteristics are related. For example, programs with engaging, challenging activities also had: smaller group size, a higher percentage of time in structured activities, fewer days per week in homework time, and stronger connections with the school (interpreting the first four rows of the table).
2005 United Way of Massachusetts Bay 18
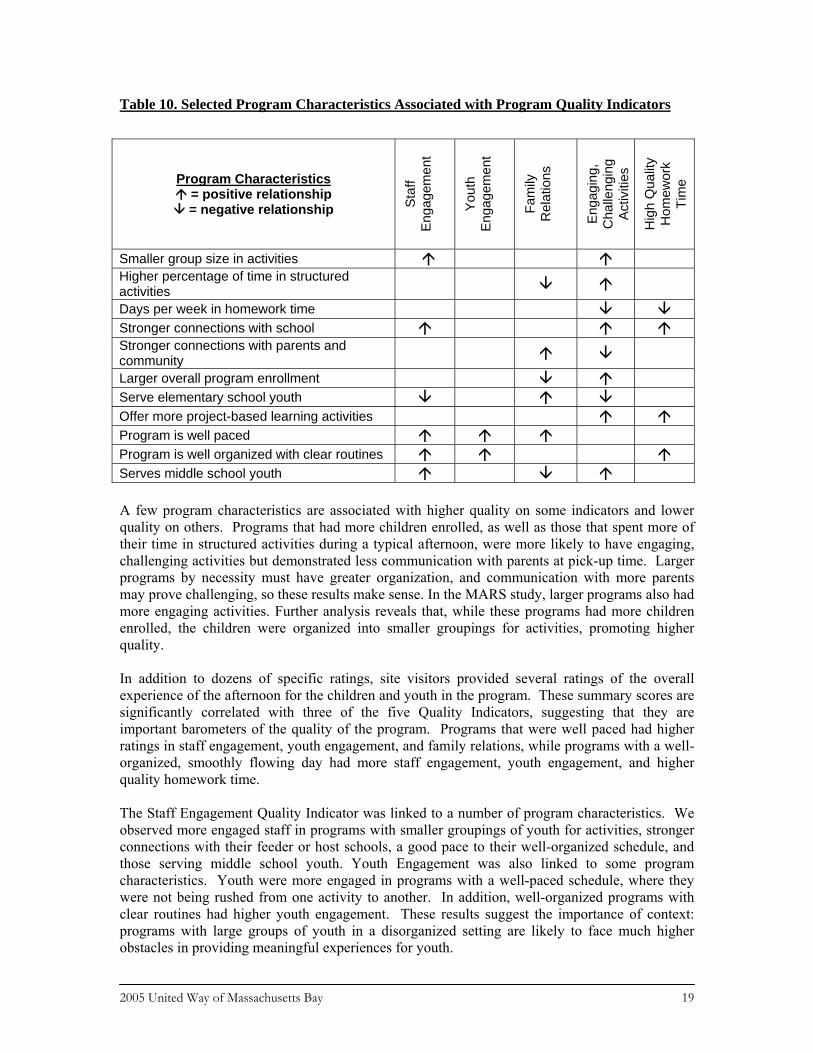
Table 10. Selected Program Characteristics Associated with Program Quality Indicators
Program Characteristics = positive relationship = negative relationship St
aff
Eng
agem
ent
You
th
Eng
agem
ent
Fam
ily
Rel
atio
ns
Eng
agin
g,
Cha
lleng
ing
Act
iviti
es
Hig
h Q
ualit
y H
omew
ork
Tim
e
Smaller group size in activities Higher percentage of time in structured activities Days per week in homework time Stronger connections with school Stronger connections with parents and community Larger overall program enrollment Serve elementary school youth Offer more project-based learning activities Program is well paced Program is well organized with clear routines Serves middle school youth A few program characteristics are associated with higher quality on some indicators and lower quality on others. Programs that had more children enrolled, as well as those that spent more of their time in structured activities during a typical afternoon, were more likely to have engaging, challenging activities but demonstrated less communication with parents at pick-up time. Larger programs by necessity must have greater organization, and communication with more parents may prove challenging, so these results make sense. In the MARS study, larger programs also had more engaging activities. Further analysis reveals that, while these programs had more children enrolled, the children were organized into smaller groupings for activities, promoting higher quality. In addition to dozens of specific ratings, site visitors provided several ratings of the overall experience of the afternoon for the children and youth in the program. These summary scores are significantly correlated with three of the five Quality Indicators, suggesting that they are important barometers of the quality of the program. Programs that were well paced had higher ratings in staff engagement, youth engagement, and family relations, while programs with a well-organized, smoothly flowing day had more staff engagement, youth engagement, and higher quality homework time. The Staff Engagement Quality Indicator was linked to a number of program characteristics. We observed more engaged staff in programs with smaller groupings of youth for activities, stronger connections with their feeder or host schools, a good pace to their well-organized schedule, and those serving middle school youth. Youth Engagement was also linked to some program characteristics. Youth were more engaged in programs with a well-paced schedule, where they were not being rushed from one activity to another. In addition, well-organized programs with clear routines had higher youth engagement. These results suggest the importance of context: programs with large groups of youth in a disorganized setting are likely to face much higher obstacles in providing meaningful experiences for youth.
2005 United Way of Massachusetts Bay 19
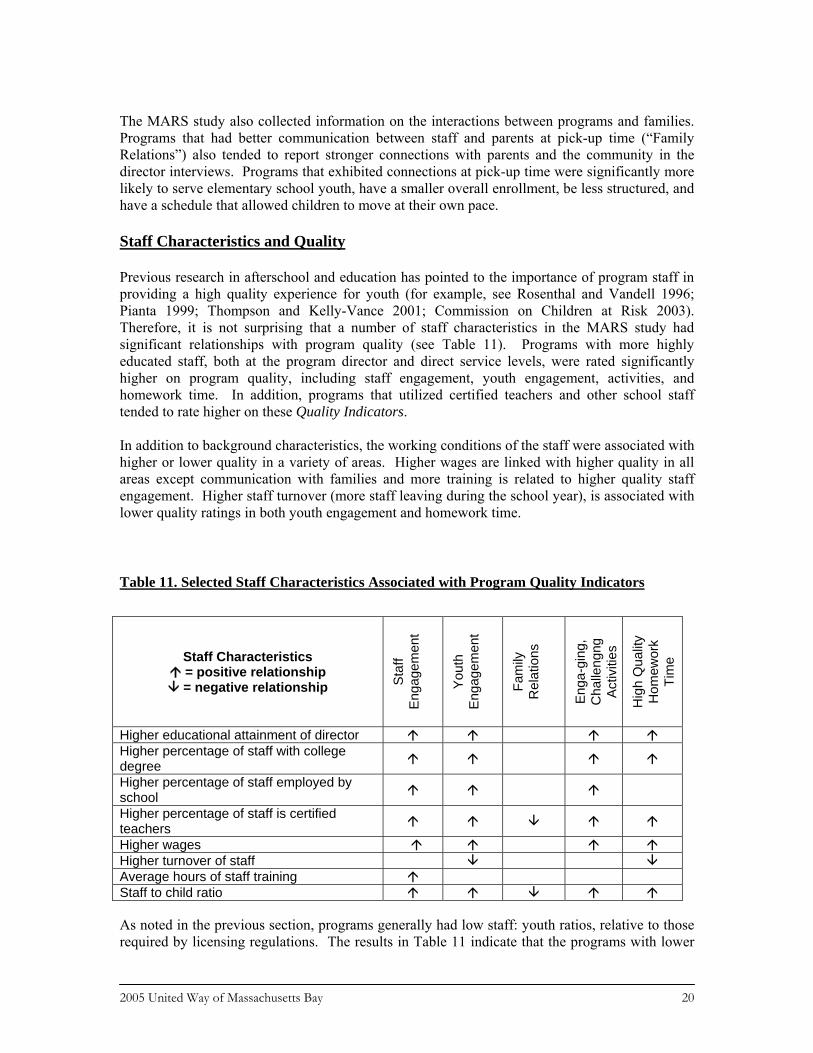
The MARS study also collected information on the interactions between programs and families. Programs that had better communication between staff and parents at pick-up time (“Family Relations”) also tended to report stronger connections with parents and the community in the director interviews. Programs that exhibited connections at pick-up time were significantly more likely to serve elementary school youth, have a smaller overall enrollment, be less structured, and have a schedule that allowed children to move at their own pace. Staff Characteristics and Quality Previous research in afterschool and education has pointed to the importance of program staff in providing a high quality experience for youth (for example, see Rosenthal and Vandell 1996; Pianta 1999; Thompson and Kelly-Vance 2001; Commission on Children at Risk 2003). Therefore, it is not surprising that a number of staff characteristics in the MARS study had significant relationships with program quality (see Table 11). Programs with more highly educated staff, both at the program director and direct service levels, were rated significantly higher on program quality, including staff engagement, youth engagement, activities, and homework time. In addition, programs that utilized certified teachers and other school staff tended to rate higher on these Quality Indicators. In addition to background characteristics, the working conditions of the staff were associated with higher or lower quality in a variety of areas. Higher wages are linked with higher quality in all areas except communication with families and more training is related to higher quality staff engagement. Higher staff turnover (more staff leaving during the school year), is associated with lower quality ratings in both youth engagement and homework time.
Table 11. Selected Staff Characteristics Associated with Program Quality Indicators
Staff Characteristics = positive relationship = negative relationship St
aff
Eng
agem
ent
You
th
Eng
agem
ent
Fam
ily
Rel
atio
ns
Eng
a-gi
ng,
Cha
lleng
ng
Act
iviti
es
Hig
h Q
ualit
y H
omew
ork
Tim
e
Higher educational attainment of director Higher percentage of staff with college degree
Higher percentage of staff employed by school
Higher percentage of staff is certified teachers
Higher wages Higher turnover of staff Average hours of staff training Staff to child ratio As noted in the previous section, programs generally had low staff: youth ratios, relative to those required by licensing regulations. The results in Table 11 indicate that the programs with lower
2005 United Way of Massachusetts Bay 20

ratios are also implementing higher quality programs, as indicated by staff engagement, youth engagement, activities, and homework indicators. These results are congruent with those in previous literature on afterschool programs as well as extensive research in the early childhood field (for example, Helburn 1995; Beckett, Hawken et al. 2001; Clements, Reynolds et al. 2004). A low staff: youth ratio enables staff to be able to build relationships with young people, individualize their facilitation of activities, and work individually or in small groups as needed. Looking at Table 11, a question emerges about the staff characteristics that show a different pattern for some quality indicators than others. While certified teachers and lower staff:child ratios seemed to promote quality on many indicators, programs that had more certified teachers or fewer children for each adult staff member (lower ratio) tended to have less contact with parents at pickup time (Family Relations). While we can’t completely explain this from the data, we can understand it better in light of the finding that programs with lower ratios also had higher program enrollment and less communication with parents.
2005 United Way of Massachusetts Bay 21

IV. Program Participation and Youth Outcomes In the previous section, we discussed the relationship between program characteristics and program quality. The MARS study also asks: What difference does quality make for youth? To answer this question, we used the Survey of Afterschool Youth Outcomes (SAYO), developed for the Massachusetts Department of Education’ 21st Century Community Learning Center grantees in 2001 (see Appendix B).2 This measure collects pre and post data on a variety of academic and youth development outcomes of afterschool program participation that have been documented in previous studies (see Huang, Gribbons et al. 2000; Fiester, White et al. 2001; Grossman, Price et al. 2002; Scott-Little, Hamann et al. 2002; Warren, Feist et al. 2002; Mahoney and Zigler 2003; Miller 2003; Witt, King et al. 2003; Harvard Family Research Project 2004; Kane 2004; Walker and Arbreton 2004; Bodilly and Beckett 2005). See Table 12 for a list of SAYO Outcomes.
Table12. Outcomes Measured by the Survey of Afterschool Youth Outcomes (SAYO)
Outcome SAYO-S (Staff)
SAYO-T (Teacher)
Academic Performance (8 categories) Homework Completion & Effort Behavior in the Program/Classroom Initiative Engagement in Learning Analysis and Problem Solving Communication Skills Relations with Adults Relations with Peers
Over the course of the 2003-2004 school year, the average scores increased on all outcomes (individual children went down in their scores, but aggregated across programs, they were positive). The greatest positive change was in teacher ratings of problem-solving and analysis skills, followed by teacher ratings of homework completion and quality, as well as staff ratings of initiative and relations with adults. We used a fairly complex statistical approach, called “multilevel modeling,” to control for children’s pre-test scores as well as a set of demographic characteristics.3 The goal of this approach was to separate out the influence of program quality/program characteristics from other possible causes of the change in SAYO outcomes. Our analysis indicated that, while change in SAYO-T scores (provided by teachers) varied by child background characteristics, they did not vary by program characteristics or program quality. In other words, while children’s scores on the SAYO-T increased over the course of the year, we could not establish links between the changes in outcomes and the quality of the afterschool programs the children attended.
2 Further information on the development of the SAYO is available at www.doe.mass.edu/as/reports/asost_03.pdf 3 Child-level covariates in the model include the effects of race and ethnicity (White, Asian, Black, and Hispanic), language proficiency (English only, Bilingual, Spanish only, Other Non-English), gender, eligibility for subsidized school lunch, and grade level.
2005 United Way of Massachusetts Bay 22

However, we did find connections between program quality and changes on the SAYO-S surveys completed by program staff. This difference between the teacher and staff ratings may be due to the closer relationship between outcomes observed by program staff and children’s experiences in the program. For example, the quality of a program and children’s behavior in the program are conceptually closely linked; while program activities and performance on academic outcomes such as math and English are likely to have a less direct connection. Therefore, the models assessing the effects of program quality were tested for only those child outcomes rated by after-school staff on the SAYO.
Program Characteristics and Youth Outcomes The past section looked at the connections between program characteristics and program quality, and found a number of significant relationships. Now we move on to see whether program characteristics have any direct relationship with youth outcomes. This is a more complex and distant relationship, since youth outcomes are likely to be affected by a host of other factors as well, from school experiences to individual personality characteristics. Table 13 depicts the relationship between selected program characteristics and youth outcomes measured by the SAYO-S. In the analyses of the MARS data, a few program characteristics focused on the strength and quality of the relationship between the program and schools were related to youth outcomes (see Table 13). In Table 13, the SAYO-S outcomes are listed in the columns across the top and the program characteristics are in the rows at the left. Up arrows indicate that more of the program characteristic is associated with a larger positive change in the youth outcome, that is, a positive relationship at a statistically significant level (p. < .05). The results in Table 13 indicate that strong relationships with teachers and principals of a school, probably facilitated by location at the school, may be helpful in promoting positive outcomes for youth. Interestingly, some of our other measures of relations with schools, including the extent of communication with the school, having academic achievement or homework improvement as goals, and having more methods for communication with schools, were not related to changes in youth outcomes. Program location in a school also has a significant link to two youth outcomes—Relations with Peers and Initiative. While it is not shown in the table, program location was also related to Relations with Adults and Behavior in the program (at a level just under statistical significance, or p <.10). Keep in mind that location in a school does not mean that a program is operated by the school. In our study, most school-based programs were operated by other organizations, often community-based or national youth-serving agencies.
2005 United Way of Massachusetts Bay 23
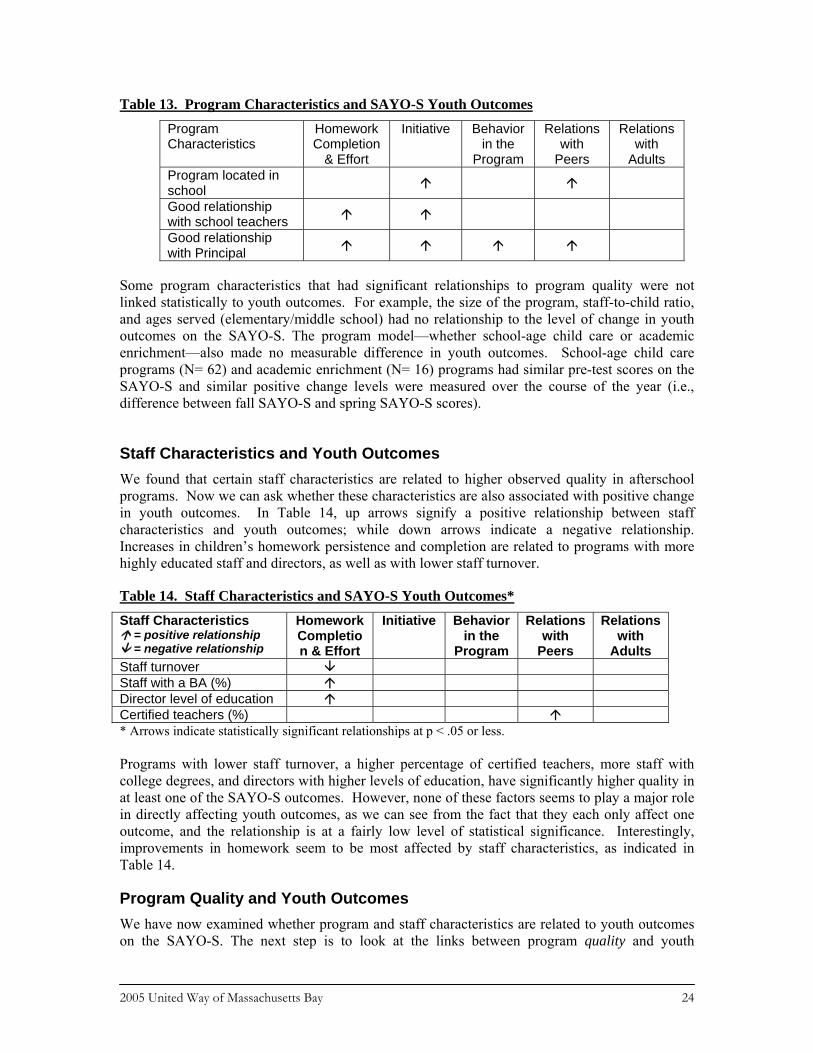
Table 13. Program Characteristics and SAYO-S Youth Outcomes
Program Characteristics
Homework Completion
& Effort
Initiative Behavior in the
Program
Relations with
Peers
Relations with
Adults Program located in school
Good relationship with school teachers
Good relationship with Principal
Some program characteristics that had significant relationships to program quality were not linked statistically to youth outcomes. For example, the size of the program, staff-to-child ratio, and ages served (elementary/middle school) had no relationship to the level of change in youth outcomes on the SAYO-S. The program model—whether school-age child care or academic enrichment—also made no measurable difference in youth outcomes. School-age child care programs (N= 62) and academic enrichment (N= 16) programs had similar pre-test scores on the SAYO-S and similar positive change levels were measured over the course of the year (i.e., difference between fall SAYO-S and spring SAYO-S scores).
Staff Characteristics and Youth Outcomes We found that certain staff characteristics are related to higher observed quality in afterschool programs. Now we can ask whether these characteristics are also associated with positive change in youth outcomes. In Table 14, up arrows signify a positive relationship between staff characteristics and youth outcomes; while down arrows indicate a negative relationship. Increases in children’s homework persistence and completion are related to programs with more highly educated staff and directors, as well as with lower staff turnover.
Table 14. Staff Characteristics and SAYO-S Youth Outcomes*
Staff Characteristics = positive relationship = negative relationship
Homework Completion & Effort
Initiative Behavior in the
Program
Relations with
Peers
Relations with
Adults Staff turnover Staff with a BA (%) Director level of education Certified teachers (%) * Arrows indicate statistically significant relationships at p < .05 or less. Programs with lower staff turnover, a higher percentage of certified teachers, more staff with college degrees, and directors with higher levels of education, have significantly higher quality in at least one of the SAYO-S outcomes. However, none of these factors seems to play a major role in directly affecting youth outcomes, as we can see from the fact that they each only affect one outcome, and the relationship is at a fairly low level of statistical significance. Interestingly, improvements in homework seem to be most affected by staff characteristics, as indicated in Table 14.
Program Quality and Youth Outcomes We have now examined whether program and staff characteristics are related to youth outcomes on the SAYO-S. The next step is to look at the links between program quality and youth
2005 United Way of Massachusetts Bay 24
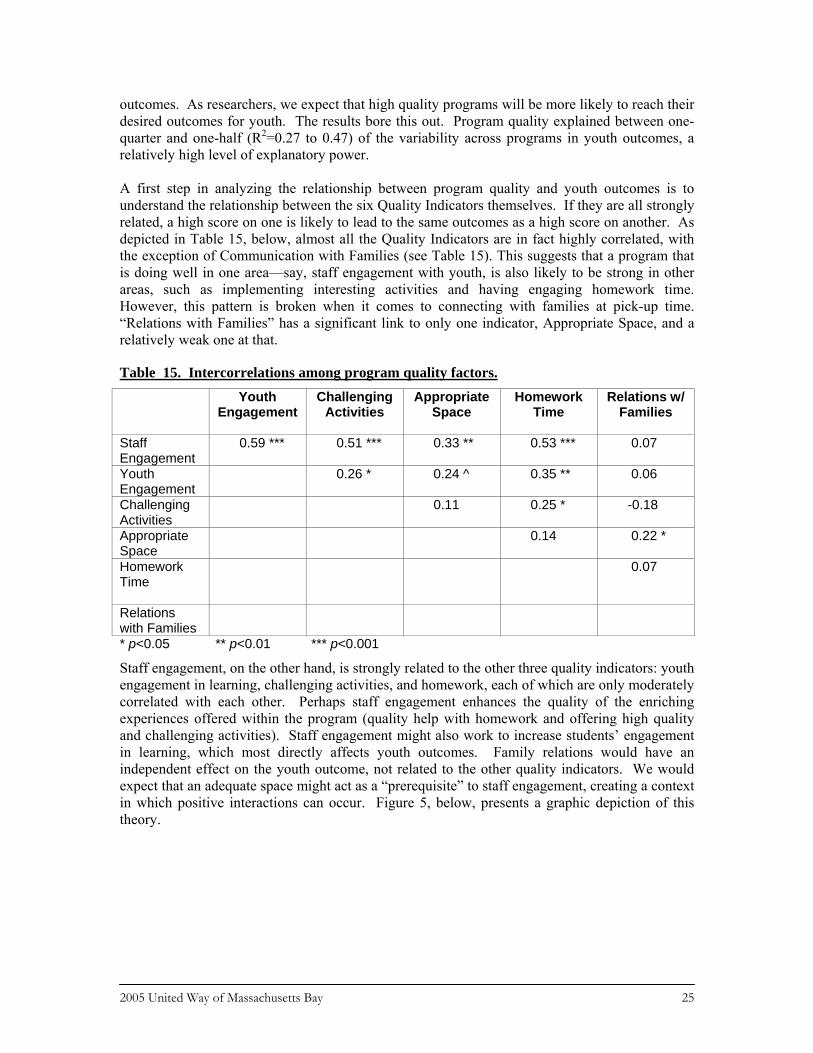
outcomes. As researchers, we expect that high quality programs will be more likely to reach their desired outcomes for youth. The results bore this out. Program quality explained between one-quarter and one-half (R2=0.27 to 0.47) of the variability across programs in youth outcomes, a relatively high level of explanatory power. A first step in analyzing the relationship between program quality and youth outcomes is to understand the relationship between the six Quality Indicators themselves. If they are all strongly related, a high score on one is likely to lead to the same outcomes as a high score on another. As depicted in Table 15, below, almost all the Quality Indicators are in fact highly correlated, with the exception of Communication with Families (see Table 15). This suggests that a program that is doing well in one area—say, staff engagement with youth, is also likely to be strong in other areas, such as implementing interesting activities and having engaging homework time. However, this pattern is broken when it comes to connecting with families at pick-up time. “Relations with Families” has a significant link to only one indicator, Appropriate Space, and a relatively weak one at that.
Table 15. Intercorrelations among program quality factors. Youth
Engagement Challenging
Activities Appropriate
Space Homework
Time
Relations w/ Families
Staff Engagement
0.59 *** 0.51 *** 0.33 ** 0.53 *** 0.07
Youth Engagement
0.26 * 0.24 ^ 0.35 ** 0.06
Challenging Activities
0.11 0.25 * -0.18
Appropriate Space
0.14 0.22 *
Homework Time
0.07
Relations with Families
* p<0.05 ** p<0.01 *** p<0.001
Staff engagement, on the other hand, is strongly related to the other three quality indicators: youth engagement in learning, challenging activities, and homework, each of which are only moderately correlated with each other. Perhaps staff engagement enhances the quality of the enriching experiences offered within the program (quality help with homework and offering high quality and challenging activities). Staff engagement might also work to increase students’ engagement in learning, which most directly affects youth outcomes. Family relations would have an independent effect on the youth outcome, not related to the other quality indicators. We would expect that an adequate space might act as a “prerequisite” to staff engagement, creating a context in which positive interactions can occur. Figure 5, below, presents a graphic depiction of this theory.
2005 United Way of Massachusetts Bay 25

Figure 5. Path model of the relationship between Quality Indicators and Youth Outcomes
Adequate
Space Staff
Engagement Youth
Engagement
Positive Change in Youth
Outcomes Engaging Activities
Communication with families at pickup time
Quality Homework
Time
We tested this theory with each of the SAYO-S outcomes. The results indicate that the theory was generally borne out. A path model for each of the five SAYO-S outcomes indicated that appropriate space led to positive staff engagement, which in turn led to positive youth engagement, challenging activities, and high quality homework time (see Appendix C for figures depicting the paths for the five SAYO-S outcomes). In every case, youth engagement was strongly linked to the SAYO outcome. The line from the other quality indicators to youth outcomes was more indirect; challenging activities and quality homework were not directly linked to positive changes in youth outcomes in the MARS data set. This result is likely due to the lack of variation in our data in these areas. As noted elsewhere in this report, we saw only a few examples of challenging, engaging activities during our observations. Homework time was similarly lacking in variation—only a few programs scored either very high or very low in this area, resulting in a lack of statistical power to show relationships to the youth outcomes. Further research in this area may be helpful in identifying the links between quality activities or homework time and positive results for youth. As seen in Figure 5, we did not expect Family Relations to be linked to the other Quality Indicators, and this too was borne out by the analysis. However, family relations had a positive but not significant effect on four of the SAYO-S outcomes, and a positive, statistically significant effect on changes in Relations with Adults. This finding is notable in light of the importance of positive relations with adults in supporting youth success in education and development in general. We know from decades of research on resiliency that strong relations with caring adults are key to healthy development, including educational success (Rutter 1987; Werner 1993; Blum, Beuhring et al. 2000; Commission on Children at Risk 2003). In the MARS study, observer’s ratings of the interactions between staff and family members, primarily at pick-up time, predicted improvement in the relationships that young people had with adults. Despite the fact that the items on the SAYO-S are focused on relations between youth and staff in the program, the way that staff members interact with other adults in the children’s lives seems to have an impact. This finding suggests that programs that operate in isolation—while they may succeed in providing positive activities in a healthy environment—may not attain their goals for youth unless they also reach out to parents.
2005 United Way of Massachusetts Bay 26

What can we learn from these results? The MARS findings suggest that youth engagement is key to positive outcomes for youth in afterschool programs. While other aspects of quality may promote youth engagement in the program, or in some cases, be directly linked to youth outcomes, we clearly need to pay particular attention to this Quality Indicator. What do we mean by “youth engagement?” Youth Engagement includes peer interactions, youth interactions with adults, as well as youth experience in the program (see page 16). Additional support for this finding comes from the youth survey. Youth ratings of their programs are significantly (p<.05) related to the staff ratings of youth on the SAYO-S on all five outcomes (Homework, Behavior, Initiative, Relationships With Adults and Relationships With Peers). There is also a positive, though less pronounced, relationship between the program ratings by youth and staff’s ratings of change in the youth scores from fall to spring.
2005 United Way of Massachusetts Bay 27
V. Lessons from MARS What can we learn from this research? What are the “take-aways” for providers, funders, policymakers, and others? First, as researchers, we must caution that no single study should be viewed as the definitive answer to important questions in the field; results of this study must be viewed in the context of previous research. Where our findings support those results, we share increased confidence in their message, and where they differ, we explore possible explanations. Comparison to Previous Studies There are just a few earlier studies in the afterschool field that set out to investigate the relationship between program characteristics and youth outcomes. In their 2001 meta-analysis of research on program quality, researchers from the RAND Corporation (Beckett, Hawken et al. 2001) found just two studies—both by Vandell and her colleagues—that met their criteria for scientifically acceptable methods. Based on these studies and other research, the authors developed a list of 15 Quality Indicators associated with positive child outcomes (Beckett, Hawken et al. 2001; Bodilly and Beckett 2005). Table 16 indicates the program practices and level of support for factors included in the MARS study. “Level of Support” reflects the strength of previous research in this area, a function of the number and quality of studies examining each feature as well as their results. The third column indicates the results of our analysis of each factor in the MARS study. While many of Beckett’s findings are based on just a few studies that do not meet high scientific standards, we can see that the results, in general, are similar to those of MARS. Staff characteristics are key to quality in afterschool programs. Our study found an especially strong relationship between education and quality, as has research on early childhood programs. The parallels between our findings and those of prior studies regarding program characteristics are striking, with strong support for the importance of flexibility (and pacing, in MARS), emotional climate, and low ratios. The only difference is total enrollment: previous research has found a correlation between large programs and low quality, whereas in the MARS study, larger programs tended to have higher quality. This contradiction may be explained by our differentiation between overall program size and group size for activities. In the MARS study, larger programs had smaller groups for activities than smaller programs, and this small group size is related to higher quality programming.
2005 United Way of Massachusetts Bay 28

Table 16. Comparing MARS Findings with Previous Research
Practice Relationship to
Quality Found in Previous Research*
Relationship to Quality Found
in MARS Staff Characteristics Training Moderate Limited
Education Moderate Strong Compensation Moderate Moderate Turnover rate Limited Moderate Experience Limited None Program Characteristics Flexibility of programming Strong Strong
Emotional climate Strong Strong Child-to-staff ratio Strong Strong Total Enrollment Moderate Moderate** Age-appropriate activities Moderate Moderate
Space availability Moderate Moderate Continuity and complementarity with day school programs
Moderate Moderate
Involvement of families Moderate Moderate * Based on Beckett, Hawken, et al., 2001 ** Previous studies found a negative association between program size and quality, whereas in the MARS larger programs had better quality. The results of MARS are quite compatible with prior studies that have made the connection between program features and youth outcomes. This gives us confidence in the results as well as a stronger base from which to move toward program improvement and policy development. At the same time, MARS is positioned to contribute significant new knowledge to the field, by virtue of the number of programs involved, the breadth across a state, the depth of information collected on program quality and characteristics, and the ability to link program quality to youth outcomes that have been identified in the literature as key to academic and developmental success. Lessons from the MARS study It is stating the obvious to say that no single study, taking place over the course of a single academic year, can provide definitive answers to the many questions we have about afterschool programs. On the other hand, at a time of increasing interest and investment, the results of MARS add to our understanding and form a foundation for future work in this area. We know that, in general, MARS supports the limited prior research in the field. What can we learn from the MARS study? What follows are some key issues for consideration: Workforce issues are important to quality.
Staff make a difference in program quality, and staff who have a strong educational background and appropriate training are key to program quality. At the same time, given current wages and working conditions, many programs can not attract such staff, or even if recruited, lose a significant portion of staff each year.
2005 United Way of Massachusetts Bay 29

A highly qualified coordinator or program director is key to setting the tone for a program that promotes youth engagement, staff engagement, and the quality of activities and homework.
Most programs in the MARS sample had very low staff-to-child ratios, typically between 1:7 and 1:9. We found clear links between low ratios and high quality, as has previous research in the field. At the same time, where ratios are very low, programs may want to consider the trade-off between paying higher salaries and having additional staff.
Communication with families is connected to youth outcomes. One of the key youth outcomes—relations with adults—was positively associated with
the quality of family relations we observed at pick-up time. Programs rated high on this component of the APT also tended to cite parent, community and volunteer support as strengths of their programs. This finding suggests that all afterschool providers could benefit from paying attention to their relationships with the families of the youth in their programs.
Many programs could improve the quality of their activities. Most of the activities we observed tended to be short-term in nature and seemed only
minimally related to program goals. Most did not have a clear connection to larger themes, curricula, or projects and did not require higher level or critical thinking on the part of children and youth. While staff were available, they did not facilitate youth engagement by asking questions, posing challenges, or extending the ideas of the children. We saw a range of programs, including some who epitomized many of these features, but they were the exception rather than the rule. In addition, we did not see much evidence, either in materials or the activities, of an effort to integrate children’s cultural and ethnic backgrounds into activities.
We saw little evidence of practices that develop youth leadership skills, promote autonomy in youth, or support peer-to-peer learning strategies. This finding is supported by the perceptions of middle school youth, who gave programs their lowest ratings in the areas of providing opportunities to plan or lead activities.
Positive outcomes for youth are the result of a pathway leading to back youth engagement in the program, which in turn is a result of staff engagement with youth.
Programs that want to support positive outcomes for participants need to have staff who can connect well with youth, interacting with them in a positive and respectful manner.
Staff who engage with youth in positive ways will be supporting the engagement of participating youth in the program and with each other. Youth engagement is the strongest predictor of positive outcomes.
The MARS study offers many useful insights into what afterschool programs look like, approaches to providing high quality experiences for youth, and the connections between high quality and improved outcomes for the young people attending these programs. The results may be useful to programs, policy makers, and others in the field. MARS is one of the only studies that looks at the relationships between program characteristics and program quality and identifies the key indicators that help produce positive outcomes for youth. Unlike previous studies that compare program participation and non-participation, MARS looks at the types of experiences and relationships that children have during their participation in afteschool programs, and how the quality of these experiences and relationships relate to youth outcomes. MARS also contributes to the literature by deepening our understanding of how youth participation leads to a variety of youth outcomes.
2005 United Way of Massachusetts Bay 30

2005 United Way of Massachusetts Bay 31

VI. References Baker, D. and P. A. Witt (1996). Evaluation of the impact of two after-school recreation
programs. Journal of Park and Recreation Administration. 14: 23-44. Barton, P. E. (2003). Parsing the Achievement Gap: Baselines for Tracking Progress.
Princeton, NJ, Educational Testing Service: 1-37. Beckett, M., A. Hawken, et al. (2001). Accountability for after-school care: Devising
standards and measuring adherence to them. Santa Monica, CA, RAND Corporation.
Benard, B. (1996). Resilience research: A foundation for youth development. Benson, P. L. and R. N. Saito (2000). The scientific foundations of youth development.
Youth development: Issues, challenges and directions. G. Walker and N. Jafee. Philadelphia, Public/Private Ventures: 125-148.
Bissell, J. S., C. T. Cross, et al. (2003). A statement released by members of the Scientific Advisory Board for the 21st Century Community Learning Center Evaluation.
Blum, R. W., T. Beuhring, et al. (2000). Protecting teens: Beyond race, income, and family structure. Minneapolis, MN, Center for Adolescent Health, University of Minnesota.
Bodilly, S. and M. Beckett (2005). Making out-of-school time matter: Evidence for an action agenda. Santa Monica, CA, RAND Corporation.
Boggiano, A. K. and T. S. Pittman (1992). Achievement and motivation: A social-developmental perspective. Cambridge, England, Cambridge University Press.
Carlisi, A. M. (1996). The 3:00 Project Program Evaluation. Decatur, GA, Georgia School-Age Care Association.
Catalano, R. F., M. L. Berglund, et al. (1998). Positive youth development in the United States: Research findings on evaluations of positive youth development programs. Seattle, WA, Social Development Research Group, University of Washington.
Clark, R. M. (1988). Critical factors in why disadvantaged students succeed or fail in school. Academy of Educational Development: 1-19.
Clements, M. A., A. J. Reynolds, et al. (2004). "Site-level predictors of children's school and social competence in the Chicago Child-Parent Centers." Early Childhood Research Quarterly 19: 273-296.
Commission on Children at Risk (2003). Hardwired to connect: The new scientific case for authoritative communities. New York, Institute for American Values.
Connell, J. P., M. B. Spencer, et al. (1994). Educational risk and resilience in African American youth: Context, self, action, and outcomes in school. Child Development. 65: 493-506.
Corbett, D. and B. Wilson (2002). "Do students care about learning?: What urban students say about good teaching." Educational Leadership 60(1): 18-22.
Csikszentmihalyi, M. and J. Nakamura (1989). The dynamics of intrinsic motivation: A study of adolescents. Research on motivation in education. C. Ames and R. Ames. San Diego, CA, Academic Press. 3: 45-71.
Danielson, C. (2002). Enhancing student achievement: A framework for school improvement. Alexandria, Virginia, Association for Supervision and Curriculum Development: 1-141.
2005 United Way of Massachusetts Bay 32
Department of Education (1998). Focus on learning: Promising strategies for improving student achievement. Washington, DC, Department of Education.
Eccles, J. S. and J. A. Gootman (2002). Community programs to promote youth development. Washington, DC, National Academy Press.
Eccles, J. S. and C. Midgley (1989). Stage-environment fit: Developmentally appropriate classrooms for young adolescents. Research on motivation in education: Goals and cognitions. C. Ames and R. Ames. San Diego, Academic Press. 3: 139-186.
Eccles, J. S., A. Wigfield, et al. (2000). Motivation to succeed. Handbook of child psychology- Fifth edition. W. Damon, John Wiley and Sons. 3: 1017-1095.
Elias, M. J. (2003). Academic and social-emotional learning. Brussels, Belgium, International Academy of Education (IAE): 1-31.
Espino, J., L. Fabiano, et al. (2004). Citizen Schools: Evidence from two student cohorts on the use of community resources to promote youth development. Washington, DC, Policy Studies Associates.
Fiester, L., R. N. White, et al. (2001). Evaluation results from the TASC after-school program's second year: Summary of findings. Washington, DC, Policy Studies Associates.
Granger, R. C. and T. J. Kane (2004). Improving the quality of after-school programs. New York, W.T. Grant Foundation.
Grossman, J. B., M. L. Price, et al. (2002). Multiple choices after school: Findings from the Extended-Service Schools Initiative, Public/Private Ventures: 69.
Hamilton, L. S. and S. P. Klein (1998). Achievement test score gains among participants in the Foundations School Age Enrichment Program: 1-16.
Hamilton, L. S., V. Le, et al. (1999). Foundations School-Age Enrichment Program: Evaluation of student achievement. Santa Monica, CA, Rand Education.
Harvard Family Research Project (2004). Understanding and Measuring Evidence in Out-of-School Time Programs. Issues and Opportunities in Out-of-School Time Evaluation, Harvard Family Research Project: 1-12.
Helburn, S. (1995). Cost, quality, and child outcomes in child care centers, University of Colorado at Denver: 336-343.
Huang, D. (2001). An after-school evaluation system for middle and high school programs. National Association of Secondary School Principals Bulletin. 85: 45-61.
Huang, D., B. Gribbons, et al. (2000). A decade of results: The impact of the LA's best after school enrichment program on subsequent student achievement and performance. Los Angeles, CA, UCLA Center for the Study of Evaluation: 1-21.
Johnson, L. J., D. Zorn, et al. (1999). 1998-99 school year program evaluation: Urban school initiative school age child care expansion. Cincinnati, OH, University of Cincinnati: 1-60.
Jordan, W. J. and S. M. Nettles (1999). How students invest their time out of school: Effects on school engagement, perceptions of life changes, and achievement. Baltimore, MD, Center for Research on the Education of Students Placed at Risk (CRESPAR). Report No. 29: 1-21, A-1-8.
Kane, T. J. (2004). The impact of after-school programs: Interpreting the results of four recent evaluations. Los Angeles, William T. Grant Foundation.
2005 United Way of Massachusetts Bay 33
Klem, A. M. and J. P. Connell (2004). "Relationships Matter: Linking Teacher Support to Student Engagement and Achievement." Journal of School Health 74(7): 262-273.
Larson, R. W. (2000). Toward a psychology of positive youth development. American Psychologist. 55: 170-183.
Learning Point Associates (2004). All students reaching the top: Strategies for closing academic achievement gaps. Naperville, Illinois, Learning Point Associates: 1-41.
Lee, V. E., J. B. Smith, et al. (NA). Social support, academic press, and student achievement: A view from the middle grades in Chicago. Chicago, Chicago Annenberg Research Project.
Leffert, N., R. Saito, et al. (1996). Making the case: Measuring the impact of youth development programs: 1-29.
Libbey, H. P. (2004). "Measuring Student Relationships at School: Attachment, Bonding, Connectedness, and Engagement." Journal of School Health 74(7): 274-283.
Mahoney, J. L. and H. Lord (2005). "An ecological analysis of after-school program participation and the development of academic performance and motivational attributes for disadvantaged children." Child Development 76(4): 811-825.
Mahoney, J. L. and E. F. Zigler (2003). The national evaluation of the 21st-Century Community Learning Centers: A critical analysis of the first-year findings. New Haven, CT, Yale University.
Marshall, N., C. G. Coll, et al. (1997). After-school time and children's behavioral adjustment. Merrill-Palmer Quarterly. 43: 497-514.
Marzano, R. (2003). What works in schools: Translating research into action. Alexandria, VA, Association for Supervision and Curriculum Development.
McLaughlin, M. W., M. A. Irby, et al. (1994). Urban sanctuaries: Neighborhood organizations in the lives and futures of inner-city youth. San Francisco, Jossey-Bass.
Miller, B. M. (2003). Critical hours: Afterschool programs and educational success. Quincy, Massachusetts, Nellie Mae Education Foundation.
National Institute of Child Health and Human Development (1998). Why children succeed or fail at reading, author.
National Institute of Child Health and Human Development Early Child Care Research Network (2004). "Are child developmental outcomes related to before-and after-school care arrangements? Results from the NICHD Study of Early Child Care." Child Development 75(1): 280-295.
Nettles, S. M. and F. P. Robinson (1998). Exploring the dynamics of resilience in an elementary school. Center for Research on the Education of Students Placed At Risk (CRESPAR). Report no. 26: 1-31.
Pianta, R. C. (1999). Enhancing relationships between children and teachers. Washington, DC, American Psychological Association.
Pierce, K. M., J. V. Hamm, et al. (1999). Experiences in after-school programs and children's adjustment in first-grade classrooms. Child Development. 70: 756-767.
Pittman, K. and M. Irby (1996). Preventing problems or promoting development: Competing priorities or inseparable goals? Baltimore, International Youth Foundation.
2005 United Way of Massachusetts Bay 34
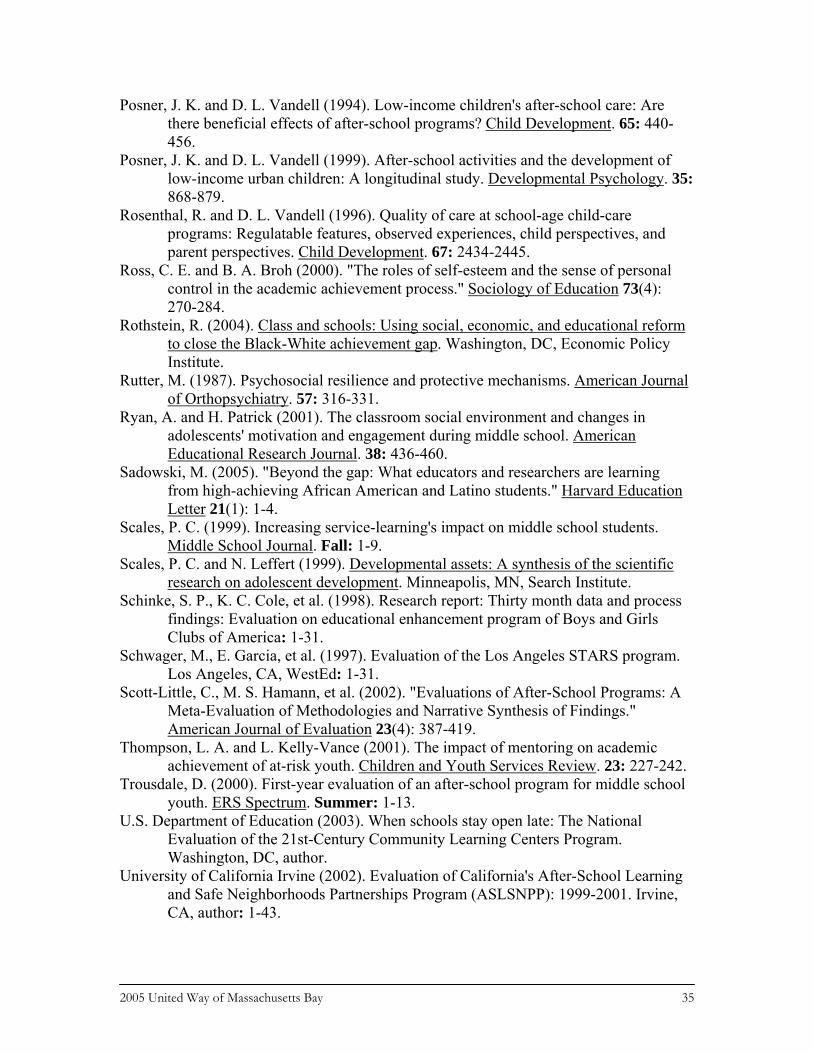
Posner, J. K. and D. L. Vandell (1994). Low-income children's after-school care: Are there beneficial effects of after-school programs? Child Development. 65: 440-456.
Posner, J. K. and D. L. Vandell (1999). After-school activities and the development of low-income urban children: A longitudinal study. Developmental Psychology. 35: 868-879.
Rosenthal, R. and D. L. Vandell (1996). Quality of care at school-age child-care programs: Regulatable features, observed experiences, child perspectives, and parent perspectives. Child Development. 67: 2434-2445.
Ross, C. E. and B. A. Broh (2000). "The roles of self-esteem and the sense of personal control in the academic achievement process." Sociology of Education 73(4): 270-284.
Rothstein, R. (2004). Class and schools: Using social, economic, and educational reform to close the Black-White achievement gap. Washington, DC, Economic Policy Institute.
Rutter, M. (1987). Psychosocial resilience and protective mechanisms. American Journal of Orthopsychiatry. 57: 316-331.
Ryan, A. and H. Patrick (2001). The classroom social environment and changes in adolescents' motivation and engagement during middle school. American Educational Research Journal. 38: 436-460.
Sadowski, M. (2005). "Beyond the gap: What educators and researchers are learning from high-achieving African American and Latino students." Harvard Education Letter 21(1): 1-4.
Scales, P. C. (1999). Increasing service-learning's impact on middle school students. Middle School Journal. Fall: 1-9.
Scales, P. C. and N. Leffert (1999). Developmental assets: A synthesis of the scientific research on adolescent development. Minneapolis, MN, Search Institute.
Schinke, S. P., K. C. Cole, et al. (1998). Research report: Thirty month data and process findings: Evaluation on educational enhancement program of Boys and Girls Clubs of America: 1-31.
Schwager, M., E. Garcia, et al. (1997). Evaluation of the Los Angeles STARS program. Los Angeles, CA, WestEd: 1-31.
Scott-Little, C., M. S. Hamann, et al. (2002). "Evaluations of After-School Programs: A Meta-Evaluation of Methodologies and Narrative Synthesis of Findings." American Journal of Evaluation 23(4): 387-419.
Thompson, L. A. and L. Kelly-Vance (2001). The impact of mentoring on academic achievement of at-risk youth. Children and Youth Services Review. 23: 227-242.
Trousdale, D. (2000). First-year evaluation of an after-school program for middle school youth. ERS Spectrum. Summer: 1-13.
U.S. Department of Education (2003). When schools stay open late: The National Evaluation of the 21st-Century Community Learning Centers Program. Washington, DC, author.
University of California Irvine (2002). Evaluation of California's After-School Learning and Safe Neighborhoods Partnerships Program (ASLSNPP): 1999-2001. Irvine, CA, author: 1-43.
2005 United Way of Massachusetts Bay 35

Vandell, D. L. (2003). Playing by the rules: The 21st CCLC evaluation violates established research standards. Madison, Wisconsin, University of Wisconsin.
Vandell, D. L. and M. A. Corasaniti (1985). The relation between third graders' after school care and social, academic, and emotional functioning. Child Development: 1-26.
Vandell, D. L., K. Dadisman, et al. (2005). Child developmental outcomes associated with supervised versus unsupervised after-school hours: A study of promising after-school programs. Madison, University of Wisconsin and Policy Studies Associates.
Walker, K. E. and A. Arbreton (2004). After-School Pursuits: An Examination of Outcomes in the San Francisco Beacon Initiative. Philadelphia, PA, Public/Private Ventures: 1-117.
Warren, C., M. Feist, et al. (2002). A place to grow: Evaluation of the New York City Beacons. New York City, Academy for Educational Development.
Wentzel, K. R. and A. Wigfield (1998). Academic and social motivational influences on students' academic performance. Educational Psychology Review. 10: 155-175.
Werner, E. E. (1993). Risk, resilience, and recovery: Perspectives from the Kauai Longitudinal Study. Development and Psychopathology. 5: 503-515.
Witt, P. A., T. King, et al. (2003). Fort Worth After School: Third year evaluation. College Station, TX, Texas A&M University: 1-75.
2005 United Way of Massachusetts Bay 36
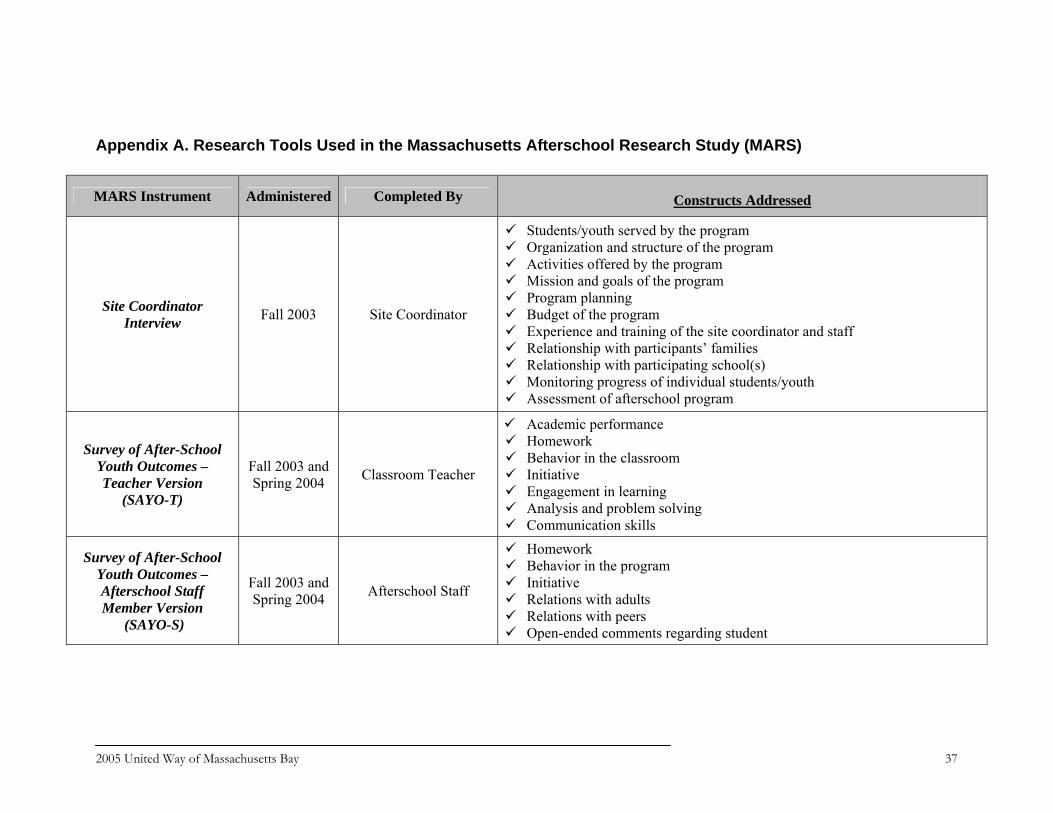
Appendix A. Research Tools Used in the Massachusetts Afterschool Research Study (MARS)
MARS Instrument Administered Completed By Constructs Addressed
Site Coordinator Interview Fall 2003 Site Coordinator
Students/youth served by the program Organization and structure of the program Activities offered by the program Mission and goals of the program Program planning Budget of the program Experience and training of the site coordinator and staff Relationship with participants’ families Relationship with participating school(s) Monitoring progress of individual students/youth Assessment of afterschool program
Survey of After-School Youth Outcomes – Teacher Version
(SAYO-T)
Fall 2003 and Spring 2004 Classroom Teacher
Academic performance Homework Behavior in the classroom Initiative Engagement in learning Analysis and problem solving Communication skills
Survey of After-School Youth Outcomes – Afterschool Staff Member Version
(SAYO-S)
Fall 2003 and Spring 2004 Afterschool Staff
Homework Behavior in the program Initiative Relations with adults Relations with peers Open-ended comments regarding student
2005 United Way of Massachusetts Bay 37

Youth Survey Spring 2004 Participating Middle School Students
Experience in afterschool program Satisfaction with afterschool program Relations with staff Relations with peers Impact of program on youth development outcomes Impact of program on learning and academic engagement
Assessment of Afterschool Program
Practices Tool-Research Version (APT-R)
Spring 2004 MARS Researchers
Observation of Individual Staff 1.) Staff promote a positive and supportive environment 2.) Relationships between staff and youth Observation of Program Activities 1.) Activities offered 2.) Type and delivery of activities 3.) Timing and organization of activities 4.) Staff practice during specific activities 5.) Homework time 6.) Staff practices during homework time 7.) Nature of youth participation 8.) Youth participation in skill-building 9.) Youth participation in overall program 10.) Youth: staff relations 11.) Youth: youth relations 12.) Staff instructional practices Observation of Overall Program 1.) Staff: family relations 2.) Physical environment 3.) Supervision and safety 4.) Arrival and departure 5.) Overall schedule
2005 United Way of Massachusetts Bay 38

2005 United Way of Massachusetts Bay 39

Appendix B. Survey of Afterschool Youth Outcomes: Staff Version
The Massachusetts Department of Education Survey of After-School Youth Outcomes
After-school Staff Version (SAYO-S)
After-School Staff Member Version Developed by: Beth M. Miller, Ph.D. and Wendy B. Surr, M.A. National Institute on Out-of-School Time Center for Research on Women Wellesley College Wellesley, MA 02481
40

1. Homework
Please circle the number that best describes how often this student:
Never
Rarely Some-times
Usually
Always N/A ( √ )
a. Persists on task even when experiencing difficulty with homework assignment. 1 2 3 4 5
b. Seeks appropriate help from staff in order to understand assignments. 1 2 3 4 5
c. Appears to work on assignments until they are completed. 1 2 3 4 5
d. Strives to give assignments special thought, creativity, or effort. 1 2 3 4 5
2. Behavior in the Program Please circle the number that best describes how often this student:
Never
Rarely Some-times
Usually
Always N/A ( √ )
a. Follows rules/procedures for program. 1 2 3 4 5 b. Is able to accept responsibility for own
actions. 1 2 3 4 5
c. Behaves appropriately during instruction or group time. 1 2 3 4 5
d. Is able to transition well from one activity to another. 1 2 3 4 5
3. Initiative (After-School Staff) Please circle the number that indicates how often this student: Never Rarely Some-
times Usually Always N/A ( √ )
a. Sets goals for self. 1 2 3 4 5 b. Takes initiative to get the information and
resources needed to accomplish tasks. 1 2 3 4 5
c. When encounters a problem, makes own effort to devise and try out possible solutions.
1 2 3 4 5
d. Demonstrates (verbally or by actions) motivation to succeed academically. 1 2 3 4 5
e. Selects activities that will build his/her skills. 1 2 3 4 5
2005 United Way of Massachusetts Bay 41
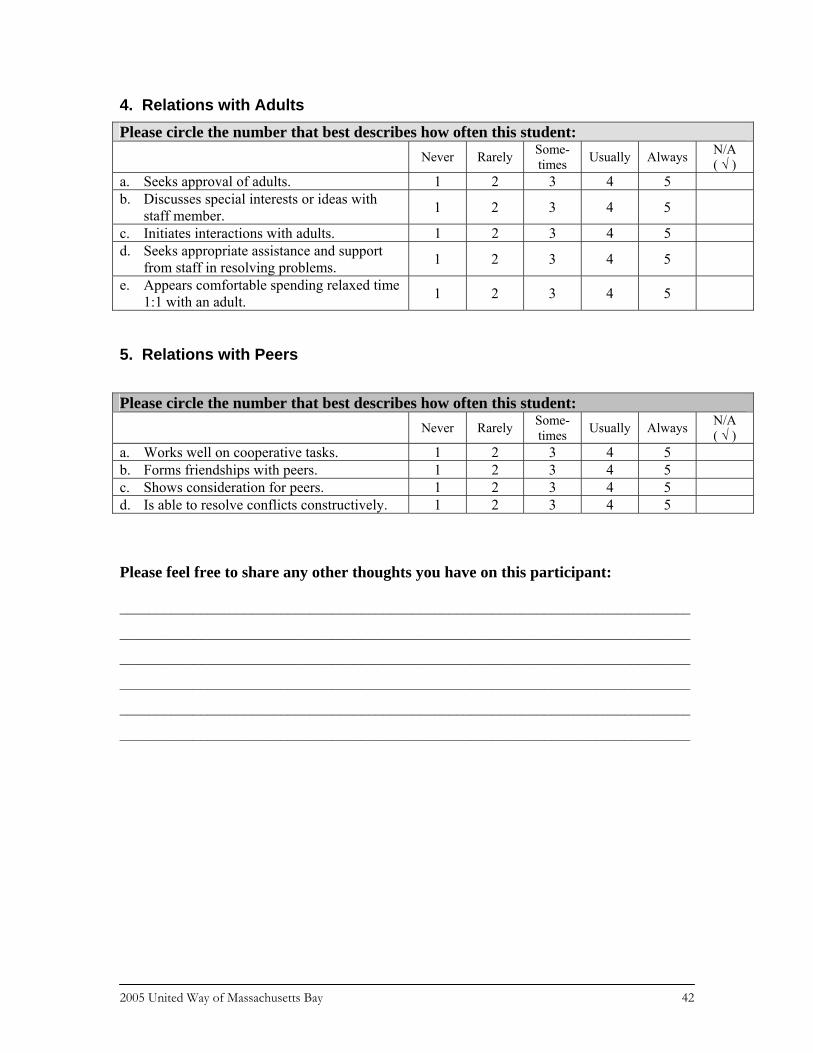
4. Relations with Adults Please circle the number that best describes how often this student:
Never
Rarely Some-times
Usually
Always N/A ( √ )
a. Seeks approval of adults. 1 2 3 4 5 b. Discusses special interests or ideas with
staff member. 1 2 3 4 5
c. Initiates interactions with adults. 1 2 3 4 5 d. Seeks appropriate assistance and support
from staff in resolving problems. 1 2 3 4 5
e. Appears comfortable spending relaxed time 1:1 with an adult. 1 2 3 4 5
5. Relations with Peers
Please circle the number that best describes how often this student:
Never
Rarely Some-times
Usually
Always N/A ( √ )
a. Works well on cooperative tasks. 1 2 3 4 5 b. Forms friendships with peers. 1 2 3 4 5 c. Shows consideration for peers. 1 2 3 4 5 d. Is able to resolve conflicts constructively. 1 2 3 4 5 Please feel free to share any other thoughts you have on this participant: ______________________________________________________________________________
______________________________________________________________________________
______________________________________________________________________________
______________________________________________________________________________
______________________________________________________________________________
______________________________________________________________________________
2005 United Way of Massachusetts Bay 42
Appendix C. Path Models for Quality Indicators and Youth Outcomes I. Relations with Peers
HomeworkR2=0.29
Staff Engagement
R2=0.09
ChallengingActivities R2=0.30
Youth Engagement
R2=0.36
Relations w/ Families
Students’ Improvement
in their Relations with Peers R2=0.34
Appropriate Space
-0.12 *
0.62 ***
0.54 ***
-0.01
0.30 ** 0.60 ***
0.55 ***
-0.03NW=2218 NB=73
2005 United Way of Massachusetts Bay 43

II. Relations with Adults
HomeworkR2=0.29
Staff Engagement
R2=0.09
ChallengingActivities R2=0.30
Youth Engagement
R2=0.36
Relations w/ Families
Students’ Improvement
in their Relations with Adults
R2=0.16
Appropriate Space
0.02
0.21
0.54 ***
0.15
0.30 ** 0.60 ***
0.55 ***
0.25 ^NW=2221 NB=73
III. Behavior in the Program
HomeworkR2=0.29
Staff Engagement
R2=0.09
ChallengingActivities R2=0.30
Youth Engagement
R2=0.36
Relations w/ Families
Students’ Improvement
in their BehaviorR2=0.19
Appropriate Space
0.01
0.41 **
0.54 ***
0.04
0.30 ** 0.60 ***
0.55 ***
0.07NW=2225 NB=73
2005 United Way of Massachusetts Bay 44

IV. Initiative and Problem Solving
HomeworkR2=0.29
Staff Engagement
R2=0.09
ChallengingActivities R2=0.30
Youth Engagement
R2=0.36
Relations w/ Families
Students’ Improvement
in their InitiativeR2=0.23
Appropriate Space
-0.15
0.42 **
0.54 ***
0.11
0.30 ** 0.60 ***
0.55 ***
0.20NW=2220 NB=73
V. Homework
HomeworkR2=0.29
Staff Engagement
R2=0.09
ChallengingActivities R2=0.30
Youth Engagement
R2=0.36
Relations w/ Families
Students’ Improvement
in their HomeworkR2=0.31
Appropriate Space
-0.02
0.50 ***
0.54 ***
0.12
0.30 ** 0.60 ***
0.55 ***
0.12NW=1941 NB=73
2005 United Way of Massachusetts Bay 45

A report of the Massachusetts After-School Research Study (MARS)
This project was developed and funded by United Way of Massachusetts Bay, the BarrFoundation and the Nellie Mae Education Foundation in partnership with the MassachusettsDepartment of Education and the Massachusetts Office of Child Care Services.The Report was prepared by Beth M. Miller, Ph.D., Senior Research Advisor to the National Institute on Out-of-School Time.
November 2005
Pathways to Success for Youth:What Counts in After-School