mass media and public policy - documents & … · mass media and public policy global ... role...
TRANSCRIPT

Policy Research Working Paper 6362
Mass Media and Public Policy
Global Evidence from Agricultural Policies
Alessandro Olper Johan Swinnen
The World BankDevelopment Economics Vice PresidencyPartnerships, Capacity Building UnitFebruary 2013
WPS6362P
ublic
Dis
clos
ure
Aut
horiz
edP
ublic
Dis
clos
ure
Aut
horiz
edP
ublic
Dis
clos
ure
Aut
horiz
edP
ublic
Dis
clos
ure
Aut
horiz
edP
ublic
Dis
clos
ure
Aut
horiz
edP
ublic
Dis
clos
ure
Aut
horiz
edP
ublic
Dis
clos
ure
Aut
horiz
edP
ublic
Dis
clos
ure
Aut
horiz
ed

Produced by the Research Support Team
Abstract
The Policy Research Working Paper Series disseminates the findings of work in progress to encourage the exchange of ideas about development issues. An objective of the series is to get the findings out quickly, even if the presentations are less than fully polished. The papers carry the names of the authors and should be cited accordingly. The findings, interpretations, and conclusions expressed in this paper are entirely those of the authors. They do not necessarily represent the views of the International Bank for Reconstruction and Development/World Bank and its affiliated organizations, or those of the Executive Directors of the World Bank or the governments they represent.
Policy Research Working Paper 6362
Mass media play a crucial role in information distribution and in the political market and public policy making. Theory predicts that information provided by the mass media reflects the media’s incentives to provide news to different groups in society and affects these groups’ influence in policy making. The paper use data on agricultural policy from 69 countries spanning a wide range of development stages and media markets to test these predictions. The empirical results are consistent with theoretical hypotheses that public support for
This paper is a product of the Partnerships, Capacity Building Unit, Development Economics Vice Presidency. It is part of a larger effort by the World Bank to provide open access to its research and make a contribution to development policy discussions around the world. Policy Research Working Papers are also posted on the Web at http://econ.worldbank.org. The authors may be contacted at [email protected] and [email protected].
agriculture is affected by the mass media. In particular, an increase in media (television) diffusion is associated with policies that benefit the majority to a greater extent and is correlated with a reduction in agriculture taxation in poor countries and a reduction in the subsidization of agriculture in rich countries, ceteris paribus. The empirical results are consistent with the hypothesis that increased competition in commercial media reduces transfers to special interest groups and contributes to more efficient public policies.

Mass Media and Public Policy:
Global Evidence from Agricultural Policies
Alessandro Olper and Johan Swinnen1
JEL classification: D72, D83, Q18
Keywords: Mass Media; Information; Agricultural Protection; Political Economy Sector Board: Public Sector Governance (PSM)
1 Alessandro Olper is an associate professor at the University of Milano, Italy, and a researcher at Centre for Institution and Economic Performance; his email address is [email protected]. Jo Swinnen is a professor of economics and director of Centre for Institution and Economic Performance at the University of Leuven, Belgium, and visiting professor at Stanford University, United States. His email address is [email protected].
This work was supported by the KU Leuven Research Council (Methusalem project). The authors would like to thank the participants in several conferences and meetings, the editor, and three anonymous referees for the World Bank Economic Review for useful comments and suggestions.

2
There is a rapidly growing body of literature on the economics of the mass media. This
literature has led to a series of important new hypotheses and insights in an area that has
been long neglected by economists.2 An important strand of this literature concerns the
role of mass media in political markets and its effect on public policy making. Most of
this literature on the relationship between the mass media and public policy is theoretical.
A few empirical studies have attempted to assess the effect of media on policy outcomes.
Some key findings from this literature suggest that access to mass media empowers
people politically and, as such, increases the benefits they receive from government
programs (Strömberg and Snyder 2008). This influence has been found for different types
of government programs and different countries, such as unemployment relief in the
United States (Strömberg 2004b), public food provision and disaster relief in India
(Besley and Burgess 2001, 2002), and educational spending in Uganda and Madagascar
(Reinikka and Svensson 2005; Francken et al. 2009). All of these studies measure the
effect within a single country, which has the benefit of holding many other factors fixed
but has the potential disadvantage of limited variation in policy and media.
Our paper seeks to contribute to this empirical literature by analyzing the impact
of mass media on policy making for a specific type of policy across a wide variety of
countries and years. We use a new dataset from the World Bank that includes measures
of agricultural subsidization and taxation for a much wider set of countries and a longer
period of time than has been previously available (Anderson and Valenzuela 2008). We
use these data as the dependent variable.
2 See McCluskey and Swinnen (2010) and Pratt and Strömberg (2011) for
reviews.

3
Agricultural policy (subsidization or taxation) is an excellent policy instrument to
study the impact of media on policy choice across a wide variation of countries for both
empirical and theoretical reasons. Empirically, agricultural policy is an important policy
for governments in both rich and poor countries. In poor countries where agriculture is a
very important share of the economy and food is a major consumption item, the
importance of agriculture as a public policy issue is obvious. However, in rich countries,
agricultural policy remains disproportionately important compared to the relatively small
share of agriculture in terms of economic output. For example in the European Union, the
Common Agricultural Policy continues to absorb 40 percent of the entire European
Union budget. Another symptom of the continued importance of agricultural policy for
rich countries is the impasse in the current WTO negotiations, where disagreements over
agricultural policies threaten to undermine the entire WTO agreement.
Another empirical factor is the substantial ad hoc and case study evidence that
mass media can play an important role in influencing agricultural policy. Several studies
have highlighted the important role of mass media in influencing voters and government
policy on key recent agricultural and food policies, such as the use of genetically
modified organisms (Curtiss et al. 2006; Marks, et al. 2003; Vigani and Olper 2012),
policy reactions to food safety crises (Swinnen et al. 2005; Verbeke et al. 2000), and
trade disputes (Kuzyk and McCluskey 2006; Swinnen and Francken 2006).
Agricultural policy is also an interesting case from a theoretical perspective. The
literature on the political economy of agricultural policy identifies group size (the number
of farmers versus the number of food consumers in the economy) as an important causal
factor. Group size is argued to play an important role because it affects collective action

4
costs (based on Olson 1965) and affects the per capita costs and benefits of agricultural
policy, which, in turn, affects political outcomes in the presence of voter information
costs (based on Downs 1957) or when political activities are proportional to the size of
potential policy costs and benefits (Swinnen 1994). Recent papers in the media
economics literature claim that the mass media can play an important role in public
policy by altering these political economy mechanisms (Stromberg 2001, 2004a; Kuzyk
and Mc Cluskey, 2006). Oberholzer-Gee and Waldfogel (2005) argue that the link
between group size and political mobilization depends on the structure of media markets.
In a series of influential papers, Strömberg (2001, 2004a) has shown that competition
among mass media outlets leads to the provision of more news/information to large
groups such as taxpayers and dispersed consumer interests, altering the trade-off in
political competition and thus influencing public policy. He refers to this outcome as
“mass media-competition-induced political bias.”
The purpose of our paper is to evaluate whether the mass media have an impact
on the political economy of agricultural policies by exploiting taxation and subsidization
data from 69 countries that were observed from 1960 to 2004. The paper also contributes
to an emerging body of literature analyzing whether the diffusion of free and independent
media are key ingredients in more efficient public policies. Besley and Burgess (2001,
2002) use a political agency model to demonstrate that a more informed and politically
active electorate increases the incentives for a government to be responsive. Prat and
Strömberg (2005) find for Sweden that people who begin watching commercial television
(TV) news programs increase their political knowledge and participation. Overall, this
and other evidence (such as Besley and Burgess 2001, 2002; Francken et al. 2009, 2011;

5
Reinikka and Svensson 2005; Strömberg and Snyder 2008) support the notion that the
mass media reduce the power of special interest lobbies relative to unorganized interests.
The paper also contributes to the literature on the political economy of agricultural
policies. There is extensive literature, both theoretical and empirical, on the determinants
of agricultural policy making (see de Gorter and Swinnen 2002 and Swinnen 2010 for
surveys), but no previous study has examined the role of the media in this process. Our
paper is the first to do so.
Our analysis, which exploits both cross-country and time-series variation in the
data, indicates that the mass media may have a substantive impact on public agricultural
policy. In the developing world, agricultural taxation is reduced by the presence of mass
media outlets, whereas agricultural support is reduced in developed countries. Our results
thus suggest that competition in the media market reduces policy distortions in
agricultural markets.
I. CONCEPTUAL FRAMEWORK
In this section, we first present a conceptual framework based on Strömberg’s
(2004a) theory of mass media and political competition. Then, we discuss the main
implications of the model in light of the worldwide characteristics and regularities of
agricultural policies, and we identify testable hypotheses regarding the effect of mass
media competition on agricultural policy outcomes.
The basic theory
In Strömberg’s (2004a) model, mass media outlets affect public policy because
they provide the channel through which politicians convey campaign promises to the

6
electorate. Political parties make binding announcements regarding the amount of public
money they plan to spend on various government programs. The two parties propose
public spending with the objective of maximizing their vote shares within a given budget
constraint.
Commercial media3 are the only channel through which the parties’ platforms are
announced to the voters. Media firms allocate a certain quantity of information on
political platforms and proposed spending levels with the objective of maximizing their
audiences (number of readers/viewers), all of which are voters. Voters purchase media
products (e.g., newspapers) and adjust their expectations of how much the parties will
spend on the basis of information provided by the media. They then vote for one of the
parties. The party that wins the election implements the promised spending plan.
Voters value news related to political platforms in the media because it allows
them to maximize the benefits they receive from government programs. It is assumed that
readers (voters) use the news they receive from the media to decide on private action,
which affects the value they realize from a government program. More precise news
about future policies makes it more likely that readers will take the correct private
actions. For example, early news about changes in agricultural subsidies help farmers to
produce the correct crops to realize the full value of these subsidies.
3 In his theoretical derivations, Stromberg (2004a) refers to the media as
“newspapers” but explains that for the purposes of the main points of his analysis, the
cost and revenue structures of TV and radio are similar in the relevant aspects.

7
Voters purchase the media product that provides them with the most information
on the government programs they value, conditional on other (exogenous) characteristics,
such as ideological preferences.
The media maximize expected profits. They have two types of costs: “first copy
costs,” or the cost of producing one unit of news space, and “reproduction and
distribution costs,” or the average cost of reproducing and delivering the media product to
a certain audience. This cost function is consistent with the notion that there are roughly
constant long-run marginal costs in distributing TV and radio news (or in printing and
delivering newspapers). The revenue of the media includes the price they can charge for
their product plus the price per reader/viewer paid by advertisers. This structure of the
media industry implies that different groups receive different media coverage. News
items of interest to small groups and groups with limited attractiveness for advertisers
receive less coverage.
This bias in the mass media’s news coverage translates into policy bias. As media
coverage of different issues changes, the efficiency with which politicians can reach
different groups with campaign promises also changes. If a party promises a group that
receives very little news coverage that it will raise spending, only a small fraction of the
voters who would benefit become aware of the promise. Therefore, a spending promise to
this group will not win many votes for the party. Consequently, this group of voters will
not attract many favorable policies. Instead, promising to raise spending for groups that
attract substantial media coverage (for example, because they are large groups or because
the groups are more valuable to advertisers) will lead to a stronger voter response and
thus to policies that are more favorable to these groups.

8
Implications for agricultural policy
What does this theory imply for the impact of mass media on agricultural policy?4
The most important stylized fact about agricultural policy is the so-called development
paradox, the policy switch from the taxation to the subsidization of agriculture associated
with economic development (Anderson and Hayami, 1986; Anderson, 2009). The classic
interpretation of this pattern is that when a country becomes richer, farm groups,
compared to consumer and taxpayer groups, become more effective in collective action
situations as the number of farmers declines and development reduces communication
and transportation costs. Both factors reduce organizational costs and free rider problems
in collective action situations (Olson, 1965). Moreover, because the per capita cost
experienced by the rest of society falls with fewer farmers, the opposition of taxpayers
and consumers to (agricultural) subsidies decreases as the number of farmers decreases as
a result of economic development (Becker 1983; Swinnen 1994; Anderson 1995).
The model developed here suggests that the relationship between agricultural
policy and economic development will be affected by the introduction of media
competition in the political market. Voter preferences and government policies will be
affected by how the media industry provides information to citizens.
4 Stromberg’s (2004a) basic model has a fixed budget constraint. This assumption
is later relaxed (see section 3.2 and footnote 16 of his paper) to allow for government
programs, such as taxes and subsidies, which influence the budget itself. Endogenizing
the government budget in this extended model does not affect the main results (or our
hypotheses).

9
One key prediction of the model is that, ceteris paribus, government transfers such
as agricultural protection should be biased toward large groups as an effect of media
competition. Because the agricultural group (the number of farmers) is relatively large in
poor countries and relatively small in richer ones, an important implication of the model
is that, ceteris paribus, the effect of media competition on agricultural policy should
differ in poor versus rich countries. More specifically, we expect that the impact on
agricultural protection induced by mass media competition should be positive in poor
countries and negative in rich countries. Thus, we can formulate the following empirical
prediction.
Hypothesis 1 (Group size effect): Mass media competition-induced political bias will
reduce agricultural protection in rich (developed) countries but will increase agricultural
protection in poor (developing) countries, ceteris paribus.
Another prediction of the model is that, ceteris paribus, government transfers will
be biased toward groups that are more attractive to advertisers. Stromberg (2004a) refers
to the case of the show Gunsmoke, which was cancelled despite its high ratings because
its audience was perceived as “too old and too rural” to be of much interest to advertisers.
The implication for agricultural protection is not obvious because “being
attractive to advertisers” may apply to many things, including age (young people are
more easily influenced by advertisements than older people), income (richer people have
more money to spend), and so forth. The latter argument would imply that mass media

10
competition would induce government transfers to be biased toward relatively richer
groups who have more income to spend and are therefore more attractive to advertisers.
Nevertheless, the implication for agricultural protection is not trivial. The
relationship between economic development and the rural-urban income gap is the
subject of some debate. Recent papers have argued that this relationship is nonlinear,
with a relatively small gap in very poor countries (as incomes in both urban and rural
areas are very low), urban incomes rising relative to rural incomes when countries grow,
and the income gap narrowing again at high income levels (see Hayami 2007; McMillan
and Rodrik, 2011). This nonlinear relationship would also follow if the spread of TV
were uneven between urban and rural areas, reflecting the differences in income (demand
for TVs). There would be a relatively small gap in very poor countries (as TV distribution
in both urban and rural areas is very low) and a rise in urban TV distribution relative to
rural TV distribution when countries grow, with the gap in TV distribution narrowing
again at high income levels. In either case, this channel would add a nonlinear
relationship between average incomes and media effects, with a prourban media bias
effect that would be strongest at medium income levels.
However, a problem with using observed (sectoral) income to document this
nonlinear relationship between the rural-urban income gap and overall income is that the
observed sectoral income levels are obviously affected by the policies themselves. With
occasionally very large subsidies or taxes, these policy transfers clearly affect the relative
income measures. With transfers going from rural to urban areas in poor countries (and
vice versa in rich countries), we would expect the pretransfer rural-urban income ratio to
be higher (lower) than that observed in poor (rich) countries. In medium income

11
countries, the transfers are relatively lower; thus, the observed income ratio is closer to
the pretransfer ratio.
This situation would imply that the expected “advertiser-value effect” of media
competition on agricultural protection should be as follows: small in (very) poor
countries, because pretransfer rural and urban incomes are similar, and low and negative
in rich and emerging countries, where pretransfer urban incomes are much higher than
rural incomes. Thus, we can formulate the following empirical prediction (conditional on
an observed nonlinear relationship between the rural-urban income ratio and economic
development).
Hypothesis 2 (Advertiser value effect): Mass media competition-induced political bias
will reduce agricultural protection in rich (developed) and emerging countries and will
have little effect in poor (developing) countries, ceteris paribus.
In combination, these two effects imply that the total media effect will increase
agricultural protection (or reduce agricultural taxation) in poor countries owing to the
group size effect, reduce agricultural protection in emerging countries owing to the
advertiser value effect, and more strongly reduce agricultural protection in rich countries
owing to the reinforcement of group size and advertiser value effects.
The next sections present the data and empirical strategy used to test the
hypotheses
.
12
II. DATA AND EMPIRICAL SPECIFICATION
We test our predictions on annual observations from a sample of approximately
70 developing and developed countries from all continents. Overall, we employ a panel
of more than 2,000 observations, but the panel structure is unbalanced. Specifically, for a
few developed countries, the starting year is approximately 1960; for the majority of the
sample, the starting year is approximately 1970; and for transition countries, it is
approximately 1992. The last year of observations is 2004. Table S.1 (in the supplemental
appendix, available at http://wber.oxfordjournals.org/) reports the full list of countries
with data and the 1970 and 2002 values of key policy and media variables.
Dependent variables
Our dependent variables are measures of agricultural protection. As an indicator
of agricultural taxation and subsidization, we use the relative rate of assistance (RRA) to
agriculture, taken from the Agricultural Distortions Database from the World Bank (see
Anderson and Valenzuela 2008 for details). The RRA index is calculated as the ratio
between the agricultural and nonagricultural nominal rates of assistance:
RRA = [(1 + NRAag)/(1 + NRAnonag) − 1],
where NRAag is the nominal rate of assistance to agriculture and NRAnonag is the nominal
assistance to nonagricultural sectors. The NRAag measures total transfers to agriculture as
a percentage of the undistorted unit value. It is positive when agriculture is subsidized,
negative when it is taxed, and zero when net transfers are zero. The NRAag at the
agricultural level is obtained as the weighted average of assistance at the product level
using the undistorted value of production as a weight. It includes a wide range of policies,
such as the assistance provided by all tariff and nontariff trade measures applied to

13
agricultural products and any domestic price-distorting measures. In addition, the price
equivalent of any direct interventions on inputs is included.
One advantage of using RRA (instead of NRA) as the dependent variable is that,
especially in developing countries, an important indirect source of agricultural taxation is
trade protection for the manufacturing sector as a component of import-substitution
policies. Thus, RRA is a more useful indicator in an international comparison of the
extent to which a country’s policy regime has an anti- or proagricultural bias. However,
as a robustness check and to assess whether changes in agricultural policy or industrial
protection are important elements in the media-protection relationship, we ran a series of
additional regressions using the NRA as the dependent variable.
Mass media variables
To test our hypotheses, we use the penetration of TV sets as an indicator. More
specifically, our variable is the natural logarithm of TV sets per 100 inhabitants, based on
data from the Arthur S. Banks Cross National Time-Series Data Archive, supplemented
by UNESCO Statistics on TV and data from the International Telecommunication Union
(2010).5
5 Both the Arthur Banks and the International Telecommunication Union data are
based on data originally collected by UNESCO. These data are collected annually from 1970
onward. From 1960 to 1970, the data were collected every five years. Thus, for that period,
we only use data for 1960, 1965, and 1970 without any interpolation. A potential limitation
of these data lies in the fact that some countries have a licensing scheme whereby TV sets (or
radios) must be registered. Because households may have more than one TV receiver or may
not register, the number of licensed receivers may understate the true number of TVs and

14
The rationale for using this proxy is that, although the share of informed voters is
not observed, we can observe the share of media users. Because both move together, it is
sufficient to examine the levels and changes in the share of media users to test the effect
of media bias (see Strömberg 2004b). Moreover, in our specific context, another
justification for the use of these indicators is derived from Strömberg’s (2004a, p. 266)
argument that “the emergence of broadcast media increased the proportion of rural and
low-education media consumers as it became less expensive to distribute radio waves
than newspapers to remote areas, and as these groups preferred audible and visual
entertainment to reading. As politicians could reach rural and low-education voters more
efficiently, the model predicts an expansion in programs that benefits these voters.”
Income and group size variables
The hypotheses advanced in section II imply that the relationship between the
media variable and RRA (NRA) is conditional on the level of development (income),
partially due to group size effects. As an indicator of development (income), we use real
per capita GDP in purchasing power parity (gdppc) taken from the Penn World Tables.6
The most direct indicator of (relative) group size is the share of agricultural employment,
emps, based on FAO data. However, as is well known, both are strongly correlated
because the agricultural employment share decreases with economic development.
Therefore, gdppc is itself an indicator of relative group size. radios. Our identification strategy exploits the within-country variation in the data (see
section 5). As long as the number of licenses and of TVs/radios display similar growth paths,
this limitation of the data should not pose a major problem.
6 Specifically, we use the variable rgdpch from the Penn World Tables, version 6.3.

15
In our basic specifications, we use gdppc as the primary indicator for the
conditional effect of media on agricultural protection because the employment share data
are of poor quality, which precludes a consistent comparison across countries and over
time, especially for developing countries (see Timmer and de Vries 2007 for a
discussion). One reason for the poor quality is the differences in national definitions of
“agricultural labor.” Another reason is that the yearly “observations” in the FAO labor
statistics are linear interpolations between census data collected once every decade. We
understand that there are also problems with the measurement of gdppc because national
accounts data are noisy over short time horizons (see Deaton 2005), but we believe the
data problems are less important for gdppc than for emps. However, we perform a series
of robustness checks using emps as indicator.
Both variables (the level of development and employment share) are also included
as control variables because both have been identified as major determinants of
agricultural protection outside the media effect.
Other control variables
In addition to the variables discussed above, in the empirical specifications, we
include controls that are likely to affect the level of agricultural protection, as suggested
by previous studies. Standard control variables in studies on the political economy of
agricultural policies are indicators of comparative advantage, trade status, terms of trade
effects, and political institutions (see Olper 2007; Swinnen 2010; Olper and Raimondi
2012). To control for comparative advantage, we include agricultural land per capita,
landpc, and the agricultural export share, exps, measured as net exports over production.
These two variables are based on data from FAO and the World Bank’s Agricultural

16
Distortions Database. Because of the possibility that governments set agricultural
protection to exploit terms of trade effects, we also control for country size using the log
of population, logpop. We proxy for political institutions by adding the Polity2 index of
democracy taken from the Polity IV database (Marshall and Jaeggers 2007).7
In addition to these standard control variables, we use a series of covariates to
check the robustness of our findings. They include two different indicators of
(aggregated) openness: the ratio of trade to GDP from the Penn World Tables and the
Sachs-Warner index of openness as defined by Wacziarg and Welch (2008).8 We use
government consumption to GDP from the Penn World Tables as a proxy for government
size. Finally, because economic crises may trigger policy reforms, we add two lags of a
crisis variable measured with a dummy equal to one for every year that the real GDP per
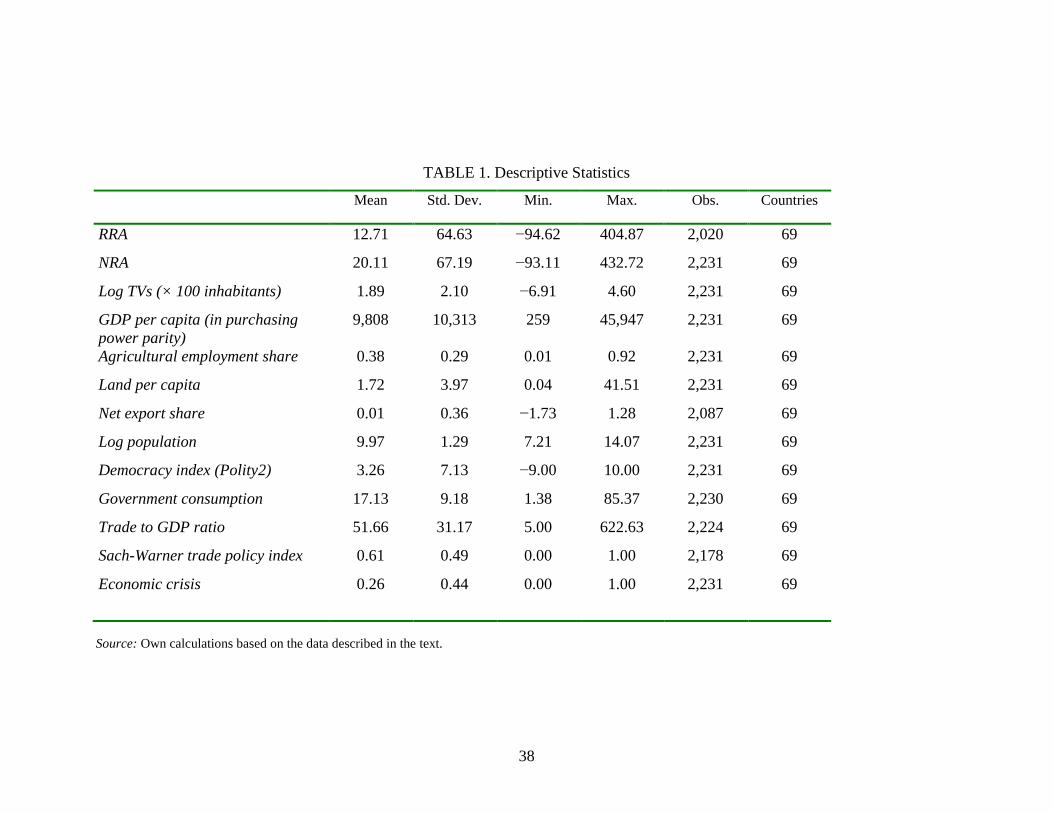
capita growth rate is negative (zero otherwise). Table 1 presents summary statistics for
the variables described above.
7 The Polity2 index assigns a value ranging from −10 (autocracy) to +10
(democracy) to each country and year, with higher values associated with stronger
democracies.
8 Wacziarg and Welch (2008) updated the Sachs and Warner index and exploited its
time dimension. The index is equal to one when a country is considered open and zero
otherwise. Thus, it captures reforms in the overall trade policy.

17
III. DESCRIPTIVE STATISTICS AND ANALYSIS
Figures 1 and 2 present trends in the agricultural policy indicators (RRA and NRA)
and the media variable (number of TVs per 100 inhabitants) for the period from 1970 to
2004 for selected countries. Table S.1 in the online appendix presents the figures for 1970
and 2002 for all countries in the dataset. The figures reveal that there is substantive
variation in all indicators both over time and between countries.
Figure 1 illustrates the stylized fact that RRA and NRA are higher in rich countries
(Canada and Germany) than in poor countries (India and Kenya). Support for farmers
was particularly high in Germany, with an RRA between 50 percent and 100 percent for
much of the period. The level of taxation faced by farmers was particularly severe in
India before 1980, with RRA figures of approximately 50 percent. Figure 1 also shows
that the variation in NRA and RRA between countries has declined over time, with
agricultural taxation declining (RRA increasing) in poor countries and agricultural
subsidies for agriculture falling (RRA decreasing) in rich countries. On average, the RRA
for the full sample increased from approximately 0 percent in the 1970s to approximately
20 percent in the 1980s, subsequently declining to approximately 10 percent in 2000 (the
NRA values differ, but the patterns are similar).
Figure 2 illustrates the differences in TV penetration across countries and over
time. The number of TVs increased everywhere over time, but, not surprisingly, the
numbers are much higher in rich countries than in poor ones. The number of TVs
increased from approximately 35 per 100 inhabitants in 1970 to approximately 60 in
Germany and 75 in Canada by 2000. In the poor countries, the number of TVs was nearly

18
zero until the mid-1980s. It remains very low in Kenya. The increase is somewhat more
rapid in India, reaching approximately 10 per 100 inhabitants in 2000.
A comparison of figures 1 and 2 suggests a different relationship between
agricultural policies and the spread of mass media in rich and poor countries: for poor
countries (such as Kenya), the RRA increased over the 1970–2004 period, and mass
media also grew. In contrast, for rich countries (such as Germany), the RRA declined,
whereas mass media continued to grow.
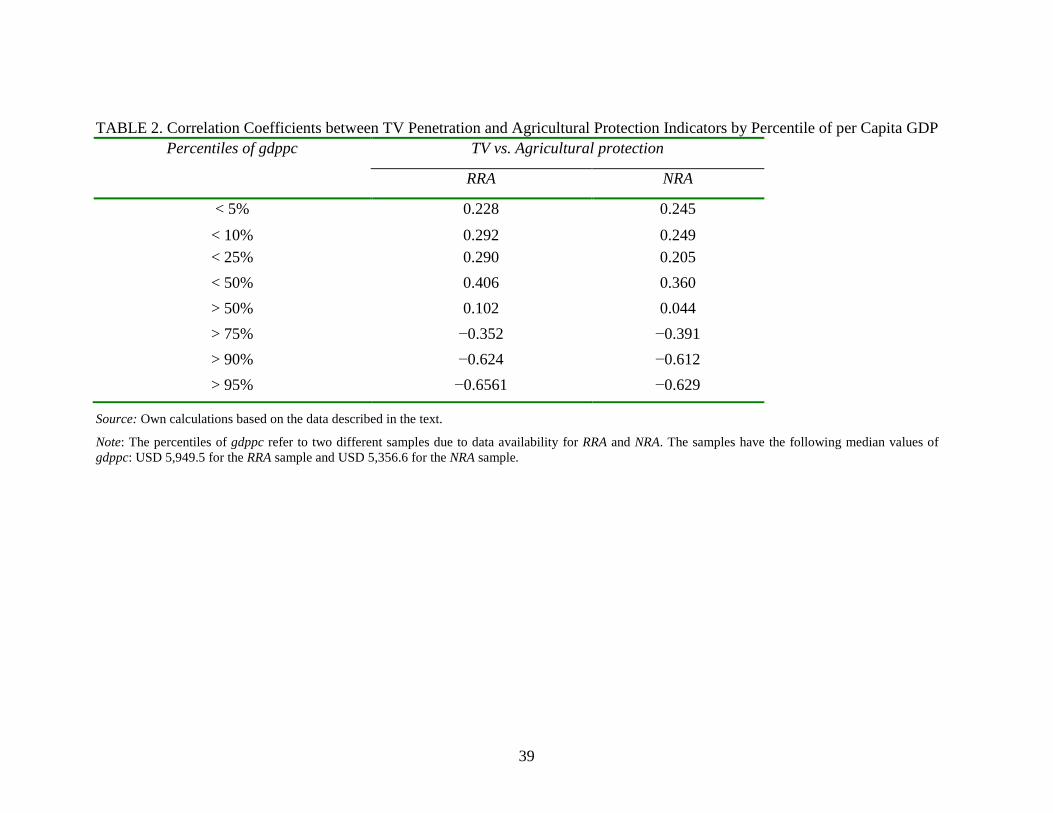
To further analyze this relationship between mass media and agricultural policies,
table 2 reports simple pair-wise correlations between the media variable and the
agricultural protection indicators for different levels of development (organized as
percentiles of per capita GDP). The pair-wise correlations are consistent with the
suggestions from figures 1 and 2. The correlation coefficient is approximately +0.30 for
percentiles below the median (<50 percent). For per capita GDP values above the 75th
percentile, the correlation becomes negative, and increasingly so, reaching a value below
−0.60 at the 95th percentile. These correlations are consistent with hypotheses 1 and 2:
there is a different relationship between agricultural policies and the spread of mass
media in rich and poor countries. For poor countries, the spread of mass media is
associated with an increase in RRA (NRA), whereas in rich countries, the growth of mass
media is associated with a decline in RRA (NRA).
Of course, these are merely descriptive statistics. For a more formal analysis, we
now turn to an econometric analysis.

19
IV. ECONOMETRIC STRATEGY AND IDENTIFICATION ISSUES
Our hypotheses suggest that in countries with low gdppc, the media variables, and
RRA should be positively related, and when gdppc is high, there should be an inverse
relationship between these variables. A priori, we do not know at what level of gdppc the
relationship changes sign. By using a general specification, we can derive the gdppc
value at the turning point, if any, from the estimated coefficients:
(1) ,
where RRAit measures the relative rate of assistance in country i and year t, mit-1 refers to
the one-year lagged media variable, and xit-1 is a vector of additional controls. Taking the
partial derivative of RRA with respect to the media variable, we obtain
.
Given our hypotheses, we expect that α1 > 0 and α2 < 0, such that α1 + α2 gdppc is
positive (negative) as gdppc is higher (lower) than gdppc*, with gdppc* = α1/–α2 the
level of development at which our media-protection relationship changes sign. We refer
to this as the “turning point.” Note that a key requirement for the predictions to hold is
that gdppc* should lie within the range of gdppc values in the dataset.
Regarding identification, our main concern is omitted variable bias. If the media
variables are correlated with unobserved determinants of the protection level, our
estimates will be inconsistent. Note that, a priori, the direction of the bias is not
predictable. Therefore, our basic specification always includes a set of country (ηi) and
year fixed effects (ϑt):
ititititititit xgdppcgdppcmmRRA εβαααα +++×++= −−−−− 113112110 )(
gdppcm
RRA21 αα +=
∂∂

20
(2) .
However, this approach does not allow us to properly isolate the causal effect of
increased mass media consumption for two main reasons. First, country fixed effects do
not control for unobservable, country-specific, time-varying factors correlated with both
the media and agricultural protection. Second, potential measurement errors in the gdppc
indicator may introduce further endogeneity problems (Deaton 2005). Indeed, the
correlation between gdppc and the media variables may bias the estimated media
coefficients (and the interaction term between the media and gdppc), a problem
exacerbated by the fixed effects transformation (Wooldridge 2002). Thus, to make our
identification assumption more credible, we adopt two additional strategies.
First, given our specific concern regarding (omitted) time-varying factors
correlated with both media variables and protection, in addition to the time dummies, we
include continent-year interaction effects to control for changes over time that affect
countries within a region similarly.9 In addition, as discussed in the data section, beyond
the traditional determinants of agricultural protection that have been found relevant in
previous studies, we include several other covariates, such as indicators of trade
openness, trade policy reforms, government consumption, and economic crises, to
increase the similarity between the countries.
9 These interaction effects capture any regional differences in the agricultural
protection dynamic. We also tested a second specification in which we included continent-
specific polynomial terms over time, and the results were qualitatively and quantitatively
similar.
ittiitititititit xgdppcgdppcmmRRA εϑηβααα +++++×+= −−−−− 11311211 )(

21
Second, to directly address measurement error problems and other forms of
endogeneity, we also employ dynamic panel methods. Specifically, we use the system
generalized methods of moment (SYS-GMM), developed by Arellano and Bover (1995)
and Blundell and Bond (1998). By estimating a system of equations in first differences
and levels and employing instruments, this approach should allow for consistent
estimations even in the presence of measurement errors and other forms of endogeneity
(see Bond et al. 2001). Our SYS-GMM dynamic panel model has the following
specification:
(3a)
(3b) ,
where ∆ denotes first differences, that is, ∆yit = yit – yit-1, RRAit-1 is the lagged dependent
variable and υit is a disturbance term. In estimating the system of equations (3a)–(3b), the
(endogenous) lagged dependent variable is instrumented by its t – 2, t – 3, and longer
lags, using the lagged levels for the first-differences equation (3a) and the lagged
differences for the level equation (3b). Similarly, to address endogeneity in other
explanatory variables (such as the media variable and its interaction with gdppc), they
can be instrumented by their respective t – 2, t – 3, and longer lags. The validity of a
particular assumption can then be tested using standard generalized methods of moment
tests of overidentifying restrictions. In summary, the SYS-GMM specification should
allow for greater flexibility, improved control for omitted time-varying factors through
ittit
itititititit
xbgdppcagdppcmamaRRAaRRA
υϑ ++∆++∆+×∆+∆+∆=∆
−
−−−−−
1
141131211
')(
ittit
itititititit
xbgdppcagdppcmamaRRAaaRRA
υϑ +++++×+++=
−
−−−−−
1
1411312110
')(

22
the lagged dependent variable and, finally, greater consistency even in the presence of
endogenous regressors. However, it is important to stress that this estimator does not
resolve endogeneity problems due to omitted variables with persistent effects, such as
when the TV trend is correlated with the RRA (NRA) trend, as a result of an omitted
(possibly time-invariant) variable.
V. REGRESSION RESULTS
This section presents the results of our econometric analyses. We present first the
results of the static model and afterward the dynamic panel results. We evaluate the
robustness of the results by testing whether the results are sensitive to country and time
coverage and to the use of different indicators for key variables.
Static model
Table 3 reports the static fixed effects results of different specifications based on
equation (2), with columns (1)–(4) using RRA and (5)–(6) using NRA as the dependent
variable. In every regression, the standard errors are corrected for heteroskedasticity and
autocorrelation of unknown form and are clustered within countries.
The results in column 1 show that the simple fixed effects specification, without
controls apart from gdppc, yields statistically significant coefficients (p-value < 0.01) for
both the linear effect and the interaction effect of TV penetration with gdppc. The
positive sign for the linear term and the negative sign for the interaction effect are
consistent with hypotheses 1 and 2. The penetration of TV is associated with a higher
RRA at low levels of development but with a lower RRA at higher levels. In regression

23
(1), the turning point for the relationship is a per capita GDP level of USD 6,013. This
number is virtually identical to the sample median value, which is equal to USD 5,949.
Columns (2) and (3) report regressions that control for the standard agricultural
protection covariates (agricultural employment share, comparative advantage, country
size, and the quality of democracy) and additional variables, such as trade openness,
government consumption to GDP, and crises indicators.
In column (4), we add a set of continent-year interaction effects to control for
differences in regional protection dynamics. The different specifications yield consistent
results both in terms of coefficients and the significance of the media variables.
Columns (5) and (6) report the results of regressions analogous to columns (3) and
(4) but using the nominal rate of assistance (NRA) as the dependent variable instead of
RRA. The estimated media coefficients are very similar, and the results are thus robust to
using different indicators of agricultural support.
To put the estimates into perspective, we illustrate the size of the media effects
using the Philippines and Taiwan as examples. These two countries have average per
capita GDP values in the period covered by the analysis of USD 1,854 and USD 9,987,
respectively, which are significantly lower and higher than the critical turning point of the
estimated relationship. Using the estimated coefficients of the full model (column (4)), a
10 percent increase in the share of households with TVs would be associated with a 4.8
percent increase in agricultural protection in the Philippines, but the same increase would
24
reduce the Taiwan’ agricultural protection by 6.4 percent.10 This finding suggests that if
there is a causal affect, its magnitude could be substantial.
In a working paper version of this article (Olper and Swinnen 2012), we presented
similar regressions using radio penetration as media variable. When using radio
penetration as an indicator, the patterns of the results are similar to those obtained using
TV, but the significance levels of the media variables are lower and less robust. More
specifically, including additional controls, the radio penetration linear term is positively
and significantly correlated with protection, but the interaction term with per capita GDP,
while still negative, is no longer statistically significant. A possible interpretation of these
results is that radio is a more important news source in poor countries, whereas TV
matters most in emerging and rich countries.
Dynamic panel model
As discussed in section IV, the results obtained from the (static) fixed effects
model may still suffer from endogeneity bias, particularly as a result of measurement
errors. To account for this problem, table 4 reports the results of dynamic panel estimates
that control for persistency in agricultural protection. To avoid problems resulting from
the use of an excessive number of instruments in the SYS-GMM estimator, the
specification only controls for the standard covariates (as in column (2) of table 3).11
10 Both elasticities are evaluated at the mean value of the RRA distribution, equal to 12.7
percent.
11 Note that this does not substantially affect our results because the autoregressive term
largely absorbs these omitted terms (see Roodman, 2009).

25
Columns (1) and (2) report the results using ordinary least squares (OLS) and
least squares with dummy variables. The OLS and least squares with dummy variables
results serve as benchmarks for the evaluation of the SYS-GMM specification and should
be upward and downward biased compared to the SYS-GMM, respectively. In the SYS-
GMM estimates, the media variables and per-capita GDP are treated as endogenous
variables and instrumented with their t − 2 and higher lagged values. The SYS-GMM
results for RRA and NRA are presented in columns (3) and (4). As expected, the
magnitude of the coefficient on lagged RRA is above the estimated least squares with
dummy variables value and below the estimated OLS value (and similar for NRA).
Moreover, neither the basic Hansen test of overidentifying restrictions nor the Difference-
in-Hansen test, related to the additional instruments used by the level equation, detects
any problem with instrumental validity. These observations all suggest that our
instruments are valid and informative and the SYS-GMM estimator is consistent.
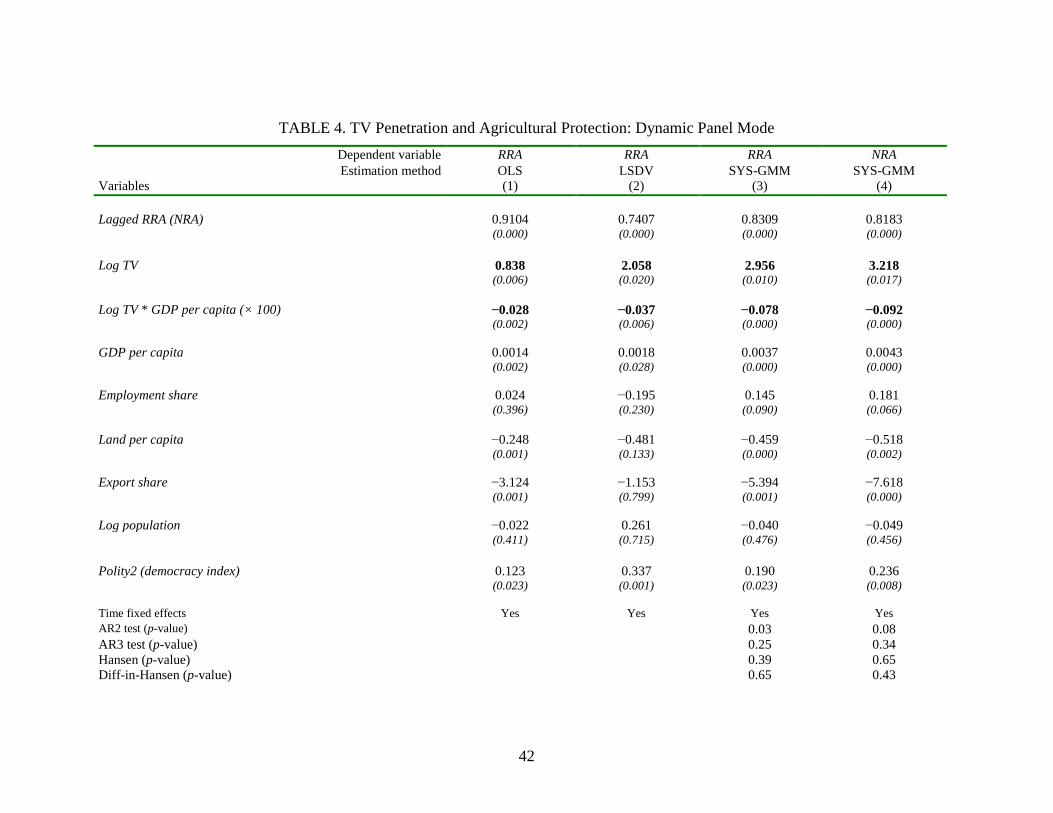
The estimated coefficients of TV penetration presented in columns (3) and (4) are
significant and consistent with hypotheses 1 and 2 in the SYS-GMM regressions. These
estimated coefficients measure short-term correlations. To compare them with the static
results, one should use the long-run correlations, which can be obtained by dividing the
estimated coefficients by one minus the autoregressive coefficient. We obtain values
equal to 17.46 for the linear term and −0.0046 for the interaction with income level and
similar values for the NRA specification. Thus, the magnitudes of the estimated (long-
run) media correlations in the dynamic SYS-GMM model are (in absolute value)
approximately two times higher than those of the static model (see columns (3) and (5) of
table 3). This result is consistent with the presence of attenuation bias due to

26
measurement errors in the variables. This problem is exacerbated in the fixed effect
specification but is efficiently accounted for in the generalized methods of moment
approach (see Wooldridge, 2002, p. 313).12
Further robustness tests
We performed a series of additional robustness tests to further check our results,
testing whether the results are sensitive to country and time coverage and to the use of
different indicators for the group size effect and development.
Columns (1)–(4) of table 5 report sensitivity analyses for the media-protection
relationship with different ranges of countries and periods. One problem with our results
may be that both the structural adjustment programs of the 1980s and the beginning of
the GATT Uruguay Round in the mid-1980s caused an effect that interfered with our
media-protection relationship: a reduction in agricultural taxation in developing countries
and a reduction in agricultural protection in developed countries. Columns (1) and (2)
examine this possibility by running the model using only observations before and after
1985, respectively. Although the magnitude of the estimated relationship is different in
both periods (approximately three times larger in magnitude after 1985),13 the
relationship is also estimated with high precision for years before 1985, suggesting that
the abovementioned confounding effects do not drive the results. 12 Note that when comparing the SYS-GMM and the static fixed effects results, at least in
terms of the magnitude of the media effect, these may also differ because the two models
differ not only in terms of the estimator used but also in terms of the covariates included.
13 One likely reason for this difference is that the expansion of TVs in developing
and emerging countries did not begin before the early 1980s.

27
Another possibility is that our nonlinear media-protection relationship is driven by
some group of sensitive observations related to a particular group of poor or rich
countries. To check this possibility, in columns (3) and (4), we excluded from the
regressions observations for countries with a gdppc lower than USD 1,000 and higher
than USD 25,000, respectively.14 The results remain consistent and significant, although
the sizes of the coefficients change somewhat. Dropping observations for the poorest
countries increases the magnitude of the estimated relationship; dropping observations for
the richest countries reduces the estimated effects compared to the benchmark SYS-
GMM regression in Column (3) of table 4. These results are consistent with hypothesis 2
(advertiser value effect), suggesting that farmers in the poorest developing countries may
be too poor to attract advertisers and media coverage. The findings may also be
consistent with an unbalanced increase in media diffusion between rural and urban areas.
If rural areas have some lag in media penetration compared to urban areas, the media
protection relationship will be weaker in the poorest countries.
In column (5), we simultaneously exclude observations for the three richest (the
United States, Norway, and Switzerland) and the three poorest countries (Mozambique,
Ethiopia, and Zimbabwe) from the regression. Once again, the results are very robust.
Columns (6) and (7) of table 5 present an additional robustness check using the
agricultural employment share (emps) to interact with the media effect. For both RRA and
14 Note that the results are fairly robust to the use of other gdppc thresholds. For
example, by excluding observations with gdppc values below USD 5,000 or higher than
USD 20,000 and thus working with approximately half of the sample, the media-
protection relationship is still statistically significant.

28
NRA, all key variables have signs consistent with our hypotheses. Although the
regression results with emps are less stable than those with gdppc (likely as a result of
severe measurement errors in the emps variable), the key conclusions are robust to a
change in the structural variable.15
Finally, as discussed in the conceptual framework section, there may be additional
nonlinearity in the relationship between media coverage and policies resulting from a
nonlinear relationship between economic growth and the rural-urban income gap and the
relative urban-rural gap in TV distribution, which would affect the value of both groups
to advertisers and thus the channel through which the mass media affect agricultural
protection. To test for this, we added an additional interaction effect between TV and the
square of gdppc to the model specifications. In some specifications, this additional media
15 There are well-known problems with the agricultural employment data, which
are generally linear interpolations between a few observations (often one per decade) and
suffer from serious measurement errors (see Timmer and de Vries, 2007). The model
specification tests reported at the bottom of the table indicate a well-specified SYS-GMM
model for the RRA regression but not for the NRA regression, where the Hansen test
rejects the null of the validity of the additional overidentifying restrictions. However, the
autocorrelation tests indicate that the model is well specified. Considering the strong
measurement errors in the employment data and that Hansen tests have weak power, such
results are unsurprising.

29
interaction term is significant and negative, consistent with the hypothesis. However, the
results are less robust than those without the additional nonlinear term. These results are
presented in Olper and Swinnen (2012).
VI. CONCLUSIONS
This paper provides evidence of the relationship between mass media competition
and agricultural protection for a large group of countries. Strömberg’s (2004a) theory
predicts that information provided by the mass media, reflecting the media’s incentives to
provide news to different groups in society, affects government policy making and who
benefits from government policies. The theory predicts that mass media competition will
induce a policy bias toward large groups and groups that are more valuable to advertisers;
these groups are more informed because the mass media target them.
We apply this theory to agricultural policy. This results in the hypotheses that (a)
given the changing role of the agricultural sector due to economic development, the
impact of mass media competition on agricultural policy will differ between poor and
rich countries, ceteris paribus, and (b) this effect is contrary to the so-called development
paradox of agricultural policies. Thus, the traditional change in agricultural policy from
taxation to subsidization that is associated with economic development will be smoothed
in the presence of mass media competition. We hypothesize that this is due to a
combination of the group size effect, with larger groups being more attractive to the
media, and the advertiser value effect, with richer groups being more attractive audiences
for the media.
We use data on agricultural policy from 69 countries spanning a wide range of
development stages and media markets to test these predictions. Our empirical results are

30
consistent with the theoretical hypotheses. We find a significant and robust correlation
between public support for agriculture and TV penetration, which is conditional on the
structure of the economy. In particular, an increase in media penetration is correlated
with policies that benefit the majority to a greater extent; it is correlated with a reduction
in agricultural taxation in poor countries and a reduction in agricultural subsidies in rich
countries, ceteris paribus.
These results are robust to the use of different indicators of agricultural policies,
different media variables and different control variables and estimation techniques.

31
REFERENCES
Anderson, K. 1995. “Lobbying Incentives and the Pattern of Protection in Rich and Poor
Countries.” Economic Development and Cultural Change 43(2): 401-23.
Anderson, K. 2009. “Five Decades of Distortions to Agricultural Incentives.” In Distortions
to Agricultural Incentives, ed. Kym Anderson, 3–64. Washington, DC: The World Bank.
Anderson, K., and Y. Hayami. 1986. The Political Economy of Agricultural Protection.
Sydney: Allen and Unwin.
Anderson, K., and E. Valenzuela. 2008. “Estimates of Distortions to Agricultural Incentives,
1955 to 2007.” Washington DC: The World Bank. (www.worldbank.org/agdistortions).
Arellano, M., and O. Bover. 1995. “Another Look at the Instrumental Variable Estimation of
Error-Components Models.” Journal of Econometrics 68: 29–51.
Becker, G. S. 1983. “A Theory of Competition among Pressure Groups for Political
Influence.” Quarterly Journal of Economics 98: 371–400.
Besley, T., and R. Burgess. 2001. “Political Agency, Government Responsiveness and the
Role of the Media.” European Economic Review 45: 629–640.
Besley, T., and R. Burgess. 2002. The Political Economy of Government Responsiveness:
“Theory and Evidence from India.” The Quarterly Journal of Economics 117(4): 1415–
1451.

32
Blundell, R. W., and S. R. Bond. 1998. “Initial Conditions and Moment Restrictions in
Dynamic Panel Data Model.” Journal of Econometrics 87: 115–143.
Bond, S., Hoeffler, A., and J. Temple. 2001. “GMM Estimation of Empirical Growth Model.”
CEPR Discussion Papers 3048.
Curtis, K., J.J. McCluskey, and J. Swinnen. 2008. “Differences in Global risk Perceptions of
Biotechnology and the Political Economy of the Media.” International Journal of Global
Environmental Issues 8 (1/2): 77–89.
Deaton, A. 2005. “Measuring Poverty in a Growing World (or Measuring Growth in a Poor
World).”Review of Economics and Statistics 87 (1):1–19.
De Gorter, H. and J. Swinnen. 2002. “Political Economy of Agricultural Policy”. In
Handbook of Agricultural Economics Vol. 2B, eds. B. Gardner and G. Rausser, 1893 –
1943. Amsterdam: Elsevier.
Downs, A. 1957. An Economic Theory of Democracy. New York: Harper and Row.
Francken, N., B. Minten, and J. Swinnen. 2009. “Media, Monitoring, and Capture of Public
Funds: Evidence from Madagascar.” World Development 37 (1): 242–255.
International Telecommunication Union (ITU). 2010. World Telecommunication Indicators
2009. Geneva: ITU. (Available online at http://www.itu.int/)
Kuzyk, P., and J.J. McCluskey. 2006. “The Political Economy of the Media: Coverage of the
U.S.-Canadian Lumber Trade Dispute.” World Economy 29 (5): 637–654.

33
McMillan, M.S., and D. Rodrik. 2011. Globalization, Structural Change and Productivity
Growth. NBER Working Paper 17143.
Marks, L. A., N. Kalaitzandonakes, and S. S. Vickner. 2003. “Evaluating Consumer
Response to GM Foods: Some Methodological Considerations.” Current Agriculture,
Food & Resource Issues 4: 80–94.
Marshall, Monty G., and K. Jaggers. 2007. Polity IV Project: Dataset Users’ Manual.
Arlington: Polity IV Project.
McCluskey, J., and J. Swinnen. 2010. “Media Economics and the Political Economy of
Information”. In The Oxford Handbook of Business and Government, eds. David Coen,
Wyn Grant, and Graham Wilson, 643–662. Oxford: Oxford University Press.
Oberholzer-Gee, R., and J. Waldfogel. 2005. “Strengh in Numbers: Group Size and Political
Mobilization.” Journal of Law and Economics 48: 73–91.
Olper, A. 2007. “Land Inequality, Government Ideology and Agricultural Protection.” Food
Policy 32: 67–83.
Olper, A. and V. Raimondi. In press. “Electoral rules, forms of government and redistributive
policy: Evidence from agriculture and food policies.” Journal of Comparative
Economics (2012) http://dx.doi.org/10.1016/j.jce.2012.03.002.
Olper, A., and J. Swinnen. 2012. “Mass Media and Public Policy: Global Evidence from
Agricultural Policies.” LICOS Discussion Paper 320.
Olson, M. Jr. 1965. The Logic of Collective Action. Public Goods and the Theory of Groups.
Cambridge: Harvard University Press.

34
Prat, A., and D. Strömberg. 2005. “Commercial Television and Voter Information.” CEPR
Discussion Papers, no. 4989.
Prat, A. and D. Strömberg. 2011. “The Political Economy of Mass Media.” CEPR Discussion
Papers, No. 8246.
Reinikka, R., and J. Svensson. 2005. “Fighting Corruption to Improve Schooling: Evidence
from a Newspaper Campaign in Uganda.” European Economic Review 3 (2–3): 259–267.
Roodman, D. 2009. “A Note on the Theme of Too Many Instruments.” Oxford Bulletin of
Economics and Statistics 71 (1): 135–158.
Strömberg, D. 2001. “Mass Media and Public Policy.” European Economic Review 45: 652–
663.
Strömberg, D. 2004a. “Mass Media Competition, Political Competition, and Public Policy.”
Review of Economic Studies 71: 265–284.
Strömberg, D. 2004b. “Radio’s Impact on Public Spending.” Quarterly Journal of Economics
119: 189–221.
Strömberg, D., and J.M. Snyder. 2008. “The Media’s Influence on Public Policy Decisions.”
In Information and Public Choice. From Media Markets to Policy Making, ed. Islam, R.,
17–31. Washington, DC: The World Bank.
Swinnen, J. 1994. “A Positive Theory of Agricultural Protection.” American Journal of
Agricultural Economics 76 (1): 1–14.

35
Swinnen, J. 2010. “The Political Economy of Agricultural Distortions: The Literature to
Date.” In Political Economy of Distortions to Agricultural Incentives, ed. Kym Anderson,
81–104. Cambridge: Cambridge University Press.
Swinnen, J., and N. Francken. 2006. “Summits, Riots, and Media Attention: The Political
Economy of Information on Trade and Globalization.” The World Economy 29 (5): 637-
654
Swinnen, J., J. McCluskey, and N. Francken. 2005. “Food Safety, the Media, and the
Information Market.” Agricultural Economics 32 (1): 175–188.
Timmer, M. P., and G. J. de Vries. 2007. A Cross-Country Database for Sectoral
Employment and Productivity in Asia and Latin America, 1950-2005. Groningen Growth
and Development Centre Research Memorandum, GD-98, Groningen: University of
Groningen.
Verbeke W., R.W.Ward, and J. Viaene. 2000. “Probit Analysis of Fresh Meat Consumption
in Belgium: Exploring BSE and Television Communication Impact.” Agribusiness 16:
215–234.
Vigani, M., and A. Olper. 2012. “GMO Standards, Endogenous Policy and the Market for
Information.” LICOS Discussion Paper No. 306/2012.
Wacziarg, R., and K.H. Welch. 2008. “Trade liberalization and growth: New evidence.” The
World Bank Economic Review 22(2): 187–231.
Wooldridge, J. M. 2002. Econometric Analysis of Cross Section and Panel Data. Cambridge,
MIT Press.

36
Figure 1. Indicators of agricultural policies (RRA, NRA) in selected countries (1970–2004). Three-year moving averages of both RRA and NRA.
Source: Own calculations based on data from the Agridistortions databases (World Bank).
-50
050
100
-100
RR
A
1970 1980 1990 2000
Sample mean Canada GermanyIndia Kenya
NR
A
1970 1980 1990 2000
Sample mean Canada GermanyIndia Kenya

37
Figure 2. Indicators of mass media: TVs per 100 inhabitants in selected countries (1970–2004).
Source: Own calculations based on the data described in the text.
020
4060
80TV
1970 1980 1990 2000year
Sample mean Canada GermanyIndia Kenya
38
TABLE 1. Descriptive Statistics
Mean Std. Dev. Min. Max. Obs. Countries
RRA 12.71 64.63 −94.62 404.87 2,020 69
NRA 20.11 67.19 −93.11 432.72 2,231 69
Log TVs (× 100 inhabitants) 1.89 2.10 −6.91 4.60 2,231 69
GDP per capita (in purchasing power parity)
9,808 10,313 259 45,947 2,231 69
Agricultural employment share 0.38 0.29 0.01 0.92 2,231 69
Land per capita 1.72 3.97 0.04 41.51 2,231 69
Net export share 0.01 0.36 −1.73 1.28 2,087 69
Log population 9.97 1.29 7.21 14.07 2,231 69
Democracy index (Polity2) 3.26 7.13 −9.00 10.00 2,231 69
Government consumption 17.13 9.18 1.38 85.37 2,230 69
Trade to GDP ratio 51.66 31.17 5.00 622.63 2,224 69
Sach-Warner trade policy index 0.61 0.49 0.00 1.00 2,178 69
Economic crisis 0.26 0.44 0.00 1.00 2,231 69
Source: Own calculations based on the data described in the text.
39
TABLE 2. Correlation Coefficients between TV Penetration and Agricultural Protection Indicators by Percentile of per Capita GDP Percentiles of gdppc TV vs. Agricultural protection
RRA NRA
< 5% 0.228 0.245
< 10% 0.292 0.249 < 25% 0.290 0.205 < 50% 0.406 0.360 > 50% 0.102 0.044 > 75% −0.352 −0.391 > 90% −0.624 −0.612 > 95% −0.6561 −0.629
Source: Own calculations based on the data described in the text.
Note: The percentiles of gdppc refer to two different samples due to data availability for RRA and NRA. The samples have the following median values of gdppc: USD 5,949.5 for the RRA sample and USD 5,356.6 for the NRA sample.

40
TABLE 3. Effect of TV Penetration on Agricultural Protection Dependent variable RRA RRA RRA RRA NRA NRA
Variables (1) (2) (3) (4) (5) (6)
Log TV 8.839 6.912 8.358 8.131 9.433 8.025
(0.005) (0.012) (0.003) (0.004) (0.004) (0.014)
Log TV * GDP per capita (× 100) −0.147 −0.122 −0.138 −0.125 −0.177 −0.148 (0.006) (0.006) (0.004) (0.003) (0.001) (0.001)
GDP per capita 0.007 0.006 0.008 0.008 0.010 0.009 (0.018) (0.024) (0.008) (0.010) (0.009) (0.013)
Employment share −1.200 −1.054 −0.909 −1.426 −1.247 (0.050) (0.081) (0.163) (0.015) (0.037)
Land per capita −1.622 −2.033 −1.712 −3.076 −2.905 (0.137) (0.069) (0.223) (0.047) (0.085)
Export share −10.885 −9.133 −8.974 −15.993 −12.964 (0.264) (0.354) (0.476) (0.134) (0.335)
Log population −0.071 −0.132 0.159 −0.096 −0.059 (0.765) (0.574) (0.629) (0.733) (0.848)
Polity2 (democracy index) 0.951 0.926 0.831 1.314 1.224 (0.002) (0.001) (0.004) (0.001) (0.001)
Government consumption 0.537 0.630 0.176 0.320 (0.217) (0.137) (0.726) (0.544)
Trade to GDP 0.014 −0.038 −0.007 −0.029 (0.772) (0.510) (0.884) (0.607)
Sachs-Warner trade policy index 20.975 17.553 18.127 16.444 (0.000) (0.001) (0.000) (0.001)
Lagged_1 crisis −0.090 0.847 0.382 1.185 (0.956) (0.601) (0.815) (0.463)

41
Lagged_2 crisis 1.007 2.072 0.780 1.871 (0.427) (0.121) (0.536) (0.166)
Time fixed effects Yes Yes Yes Yes Yes Yes Country fixed effects Yes Yes Yes Yes Yes Yes Continental-years interaction effects No No No Yes No Yes Observations 2,025 1,996 1,935 1,935 2,001 2,001 Countries 69 69 67 67 69 69 Adj. R2 0.857 0.865 0.871 0.880 0.858 0.866 Critical GDP per capita 6,013 5,666 6,057 6,504 5,330 5,422
Source: Own calculations based on the data described in the text.
Note: OLS regressions; p-values based on robust standard errors clustered by countries in parentheses; all controls entered with one year lagged; continental (Asia, Africa, Latin America) and year interaction effects included as indicated (see text).
42
TABLE 4. TV Penetration and Agricultural Protection: Dynamic Panel Mode Dependent variable RRA RRA RRA NRA Estimation method OLS LSDV SYS-GMM SYS-GMM
Variables (1) (2) (3) (4)
Lagged RRA (NRA) 0.9104 0.7407 0.8309 0.8183 (0.000) (0.000) (0.000) (0.000)
Log TV 0.838 2.058 2.956 3.218 (0.006) (0.020) (0.010) (0.017)
Log TV * GDP per capita (× 100) −0.028 −0.037 −0.078 −0.092 (0.002) (0.006) (0.000) (0.000)
GDP per capita 0.0014 0.0018 0.0037 0.0043 (0.002) (0.028) (0.000) (0.000)
Employment share 0.024 −0.195 0.145 0.181 (0.396) (0.230) (0.090) (0.066)
Land per capita −0.248 −0.481 −0.459 −0.518 (0.001) (0.133) (0.000) (0.002)
Export share −3.124 −1.153 −5.394 −7.618 (0.001) (0.799) (0.001) (0.000)
Log population −0.022 0.261 −0.040 −0.049 (0.411) (0.715) (0.476) (0.456)
Polity2 (democracy index) 0.123 0.337 0.190 0.236 (0.023) (0.001) (0.023) (0.008)
Time fixed effects Yes Yes Yes Yes AR2 test (p-value) 0.03 0.08 AR3 test (p-value) 0.25 0.34 Hansen (p-value) 0.39 0.65 Diff-in-Hansen (p-value) 0.65 0.43

43
Instruments 82 82 Observations 1,984 1,984 1,984 2,058 Countries 69 69 69 69 R2 0.94 0.94 Critical GDP per capita 2,992 5,563 3,790 3,498
Source: Own calculations based on the data described in the text.
Note: p-values based on robust standard errors clustered by countries in parentheses; SYS-GMM based on xtabond2 in Stata, with instruments structured with lag (3) for RRA (NRA), and lag (2) for the media variables and gdppc; Additional instruments used for the level equation are the t – 3 first difference of the RRA (NRA) and the t – 2 first difference for media variables and gdppc; the collapse option is also used to control for instrument proliferation. LSDV represents least squares with dummy variables.

44
TABLE 5. Robustness Checks: SYS-GMM Regressions over Different Samples Dependent variable RRA RRA RRA RRA RRA RRA NRA
Interaction with gdppc gdppc gdppc gdppc gdppc emp emp Variables (1) (2) (3) (4) (5) (6) (7) Lagged RRA (NRA) 0.893 0.796 0.838 0.877 0.799 0.909 0.895
(0.000) (0.000) (0.000) (0.000) (0.000) (0.000) (0.000)
Log TV 1.478 6.313 3.604 1.966 2.073 −2.306 −3.094 (0.025) (0.011) (0.050) (0.004) (0.016) (0.104) (0.028)
Log TV * GDP per capita (or emps) 0.029 0.093 0.088 0.038 0.084 3.996 5.277 (0.001) (0.005) (0.000) (0.002) (0.001) (0.011) (0.001)
GDP per capita 0.0014 0.0044 0.0041 0.0018 0.0039 0.0022 0.0032 (0.002) (0.004) (0.000) (0.005) (0.001) (0.027) (0.002)
Other controls Yes Yes Yes Yes Yes Yes Yes Time dummies Yes Yes Yes Yes Yes Yes Yes AR2 test (p-value) 0.35 0.01 0.04 0.04 0.07 0.03 0.08 AR3 test (p-value) 0.10 0.27 0.25 0.25 0.61 0.37 0.52 Hansen (p-value) 0.96 0.22 0.92 0.30 0.91 0.10 0.02 Instruments 69 70 76 79 84 69 69 Observations 834 1,206 1,720 1,698 1,785 1,984 2,058 Countries 55 68 63 69 63 69 69
Sample < 1985 > 1985 gdppc > USD
1,000 gdppc < USD
25,000 Richer/poorest
excluded All All
Critical GDP per capita (emps) 5,097 6,788 4,096 5,173 2,468 (0.58) (0.59)
Source: Own calculations based on the data described in the text.
Note: Each column reports a regression for a specific countries/years sample with characteristics indicated at the bottom of the table: < (>) 1985 means that the regression is run for data before or after 1985; gdppc > 1,000 (< 25,000) means that the regression considered only countries/years data with gdppc higher

45
(lower) than 1,000 (25,000) international U.S. dollars; richer/poorest excluded are excluding the three richest and poorest countries from the regression (namely, the United States, Norway, and Switzerland and Mozambique, Ethiopia, and Zimbabwe). The p-values in parentheses are based on robust standard errors clustered by countries; SYS-GMM is based on xtabond2 in Stata, with instruments structured with lag (3) for RRA and lag (2) for media variables and gdppc (emps); additional instruments used for the level equation are the t – 3 first difference of the RRA and the t – 2 first difference for media variables and gdppc; the collapse option is used to control for instrument proliferation. Additional controls included in every regression are emps, landpc, exps, log(pop), and Polity2, all lagged one year, and year fixed effects.

Mass Media and Public Policy:
Global Evidence from Agricultural Policies
Online Appendix
By Alessandro Olper and Johan Swinnen
Table S.1 Agricultural policy and media variables in 1970 and 2002 by country
Notes: the table reports countries covered by the analysis; the (circa) 1970 and 2002 values of TV per 100 inhabitants, relative rate of assistance (RRA), and the nominal rate of assistance (NRA); na means that there are no data for this specific country in 1970 or 2002. Source: Own calculations based on the data described in the text.
Year Year
Country RRA NRA TV RRA NRA TV Country RRA NRA TV RRA NRA TV
Argentina -42.50 -21.78 14.70 -25.49 -23.96 38.15 Malaysia -12.30 -7.13 1.20 0.42 2.14 16.75Australia -2.77 17.51 21.67 -1.45 0.02 91.09 Mali na -46.74 na na -8.93 1.31Austria 10.65 16.29 25.40 40.96 41.35 55.67 Mexico -9.02 -3.12 6.72 10.94 17.23 28.82Bangladesh -46.27 -20.82 0.03 -14.21 3.55 0.75 Morocco -19.30 -12.49 1.10 na -0.64 21.32Benin na -30.57 0.19 na -15.94 4.30 Mozambique -85.45 -86.54 0.00 0.29 24.77 0.64Brazil -32.70 -9.19 6.60 -3.23 -0.71 45.28 Netherlands 92.87 112.50 23.70 43.00 45.72 55.82Bulgaria na na na -15.68 -11.79 49.51 New Zealand -22.40 4.30 23.50 -1.84 1.79 58.64Burkina Faso na -27.84 0.01 na -14.19 1.28 Nicaragua -11.65 -8.10 2.98 -8.16 -7.83 6.93Cameroon -43.42 -11.62 1.48 -16.77 -2.75 3.59 Nigeria -5.40 -1.57 0.14 -6.63 -6.28 6.86Canada 6.98 7.82 33.30 22.20 13.75 72.61 Norway 198.24 273.24 24.50 222.19 221.97 85.61Chad na -38.81 0.00 na -15.28 0.13 Pakistan -56.87 44.83 0.20 -16.49 -7.18 17.12Chile -4.79 -2.24 5.30 0.45 5.84 26.45 Philippines -14.37 5.05 1.10 17.79 27.41 18.42China -60.22 -53.27 0.08 -1.25 -1.17 34.83 Poland na na na 4.30 5.39 43.29Colombia -33.41 -14.27 3.90 34.03 40.92 28.82 Portugal -29.20 -25.36 4.30 26.87 23.48 63.78Cote d'Ivoire -45.09 -37.42 0.28 -34.14 -27.16 4.78 Romania na na na 40.02 42.11 40.73Czech Republic na na na 20.91 20.43 53.55 Rep. of South Afr. 1.88 1.46 0.31 -6.43 -6.03 17.22Denmark 30.23 36.55 37.15 34.87 35.07 88.11 Russia na na na 9.20 7.89 62.00Dominican Rep. -21.89 -14.34 2.50 -1.25 2.66 10.16 Senegal -29.01 -20.71 0.03 -17.77 -7.64 3.71Ecuador -22.30 -21.78 2.51 11.64 27.94 30.95 Slovakia na na na 6.92 18.03 50.55Egypt -66.28 -50.97 1.60 -39.27 -23.86 23.45 Slovenia na na na 76.89 73.04 38.70Estonia na na na 22.30 21.11 78.44 Spain 0.11 3.98 12.20 24.67 21.10 74.60Ethiopia -46.70 -9.97 0.03 -25.66 -10.43 0.60 Srilanka -52.84 -19.12 0.17 -3.13 16.61 12.10Finland 67.61 81.19 23.00 39.80 41.58 73.95 Sudan -41.95 -47.03 0.30 -12.58 -9.62 26.38France 64.27 85.75 21.60 26.04 30.24 63.68 Sweden 87.84 99.62 31.20 41.81 43.82 61.18Germany 89.68 105.29 35.75 39.28 40.05 59.75 Switzerland 352.98 419.79 24.20 176.90 195.36 56.87Ghana -32.24 -28.30 0.20 -0.93 0.70 12.77 Taiwan 4.72 20.94 3.80 61.78 164.25 43.31Hungary na na na 34.15 29.83 42.51 Tanzania -73.38 -50.15 0.03 -31.36 -19.61 2.11India -37.45 7.67 0.01 18.96 25.96 8.49 Thailand -29.09 -19.78 0.69 -1.03 5.36 29.16Indonesia -27.65 -1.98 0.07 5.23 15.40 16.62 Togo na -28.15 0.02 na -18.85 3.21Ireland 16.04 27.68 15.20 68.89 74.87 38.81 Turkey -36.35 9.60 0.28 18.15 18.01 34.11Italy 54.60 64.08 18.20 27.73 24.30 46.71 Uganda -30.43 -6.07 0.09 -16.77 0.57 2.62Japan 51.87 91.45 34.09 127.57 142.40 73.76 UK 9.68 32.62 33.06 42.24 42.79 77.37Kenya -27.05 -22.61 0.27 -1.77 -0.56 2.50 Ukraine na na na -15.59 -15.80 55.72Korea South 38.43 64.04 1.30 168.06 220.90 38.17 USA 3.06 8.03 41.30 14.83 9.23 90.38Latvia na na na 31.82 32.80 53.48 Vietnam na na 0.44 5.03 14.17 20.30Lithuania na na na 36.93 32.84 42.38 Zambia -39.90 -25.08 0.40 -29.22 -19.10 2.90Madagascar -10.73 -1.99 0.06 -15.76 -3.75 2.55 Zimbabwe -56.92 -38.07 0.90 -87.87 -85.19 3.43
1970 2002 1970 2002