masco 10-k2006
TRANSCRIPT
UNITED STATES SECURITIES AND EXCHANGE COMMISSIONWashington, DC 20549
FORM 10-KANNUAL REPORT PURSUANT TO SECTION 13 OR 15(d) OF
THE SECURITIES EXCHANGE ACT OF 1934
For the Fiscal Year Ended December 31, 2006 Commission File Number 1-5794
MASCO CORPORATION(Exact name of Registrant as Specified in its Charter)
Delaware 38-1794485(State of Incorporation) (I.R.S. Employer Identification No.)
21001 Van Born Road, Taylor, Michigan(Address of Principal Executive Offices)
48180(Zip Code)
Registrant’s telephone number, including area code: 313-274-7400
Securities Registered Pursuant to Section 12(b) of the Act:
Title of Each ClassName of Each Exchange
On Which Registered
Common Stock, $1.00 par valueZero Coupon Convertible Senior
Notes Due 2031Zero Coupon Convertible Senior
Notes Series B Due 2031
New York Stock Exchange, Inc.
New York Stock Exchange, Inc.
New York Stock Exchange, Inc.
Securities Registered Pursuant to Section 12(g) of the Act:None
Indicate by check mark if the registrant is a well-known seasoned issuer, as defined in Rule 405 of the SecuritiesAct. Yes ¥ No n
Indicate by check mark if the registrant is not required to file reports pursuant to Section 13 or Section 15(d) of theAct. Yes n No ¥
Indicate by check mark whether the Registrant: (1) has filed all reports required to be filed by Section 13 or 15(d) ofthe Securities Exchange Act of 1934 during the preceding 12 months, and (2) has been subject to such filingrequirements for the past 90 days. Yes ¥ No n
Indicate by check mark if disclosure of delinquent filers pursuant to Item 405 of Regulation S-K is not containedherein, and will not be contained, to the best of Registrant’s knowledge, in definitive proxy or informationstatements incorporated by reference in Part III of this Form 10-K or any amendment to this Form 10-K. ¥
Indicate by check mark whether the Registrant is a large accelerated filer, an accelerated filer, or a non-acceleratedfiler (See definition of “accelerated filer and large accelerated filer” in Rule 12b-2 of the Exchange Act).
Large accelerated filer ¥ Accelerated filer n Non-accelerated filer n
Indicate by check mark whether the registrant is a shell company (as defined in Rule 12b-2 of the ExchangeAct). Yes n No ¥
The aggregate market value of the Registrant’s Common Stock held by non-affiliates of the Registrant on June 30,2006 (based on the closing sale price of $29.64 of the Registrant’s Common Stock, as reported by the New York StockExchange on such date) was approximately $11,656,135,000.
Number of shares outstanding of the Registrant’s Common Stock at January 31, 2007:
391,600,000 shares of Common Stock, par value $1.00 per share
DOCUMENTS INCORPORATED BY REFERENCE
Portions of the Registrant’s definitive Proxy Statement to be filed for its 2007 Annual Meeting of Stockholdersare incorporated by reference into Part III of this Form 10-K.
Masco Corporation2006 Annual Report on Form 10-K
TABLE OF CONTENTS
Item Page
PART I1. Business . . . . . . . . . . . . . . . . . . . . . . . . . . . . . . . . . . . . . . . . . . . . . . . . . . . . . . . . . . . . . . . . . . 2
1A. Risk Factors . . . . . . . . . . . . . . . . . . . . . . . . . . . . . . . . . . . . . . . . . . . . . . . . . . . . . . . . . . . . . . . 61B. Unresolved Staff Comments . . . . . . . . . . . . . . . . . . . . . . . . . . . . . . . . . . . . . . . . . . . . . . . . . . 8
2. Properties . . . . . . . . . . . . . . . . . . . . . . . . . . . . . . . . . . . . . . . . . . . . . . . . . . . . . . . . . . . . . . . . . 83. Legal Proceedings . . . . . . . . . . . . . . . . . . . . . . . . . . . . . . . . . . . . . . . . . . . . . . . . . . . . . . . . . . 94. Submission of Matters to a Vote of Security Holders. . . . . . . . . . . . . . . . . . . . . . . . . . . . . . . 9
Supplementary Item. Executive Officers of the Registrant . . . . . . . . . . . . . . . . . . . . . . . . . . 9
PART II5. Market for Registrant’s Common Equity, Related Stockholder Matters and Issuer
Purchases of Equity Securities . . . . . . . . . . . . . . . . . . . . . . . . . . . . . . . . . . . . . . . . . . . . . . . . 106. Selected Financial Data . . . . . . . . . . . . . . . . . . . . . . . . . . . . . . . . . . . . . . . . . . . . . . . . . . . . . . 117. Management’s Discussion and Analysis of Financial Condition and Results of
Operations . . . . . . . . . . . . . . . . . . . . . . . . . . . . . . . . . . . . . . . . . . . . . . . . . . . . . . . . . . . . . . . . 127A. Quantitative and Qualitative Disclosures About Market Risk . . . . . . . . . . . . . . . . . . . . . . . . 31
8. Financial Statements and Supplementary Data . . . . . . . . . . . . . . . . . . . . . . . . . . . . . . . . . . . 329. Changes in and Disagreements with Accountants on Accounting and Financial
Disclosure. . . . . . . . . . . . . . . . . . . . . . . . . . . . . . . . . . . . . . . . . . . . . . . . . . . . . . . . . . . . . . . . . 769A. Controls and Procedures . . . . . . . . . . . . . . . . . . . . . . . . . . . . . . . . . . . . . . . . . . . . . . . . . . . . . 769B. Other Information . . . . . . . . . . . . . . . . . . . . . . . . . . . . . . . . . . . . . . . . . . . . . . . . . . . . . . . . . . 76
PART III10. Directors, Executive Officers and Corporate Governance . . . . . . . . . . . . . . . . . . . . . . . . . . . 7611. Executive Compensation . . . . . . . . . . . . . . . . . . . . . . . . . . . . . . . . . . . . . . . . . . . . . . . . . . . . . 7612. Security Ownership of Certain Beneficial Owners and Management and Related
Stockholder Matters . . . . . . . . . . . . . . . . . . . . . . . . . . . . . . . . . . . . . . . . . . . . . . . . . . . . . . . . . 7613. Certain Relationships and Related Transactions, and Director Independence . . . . . . . . . . . 7714. Principal Accountant Fees and Services . . . . . . . . . . . . . . . . . . . . . . . . . . . . . . . . . . . . . . . . . 77
PART IV15. Exhibits and Financial Statement Schedule . . . . . . . . . . . . . . . . . . . . . . . . . . . . . . . . . . . . . . 78
Signatures. . . . . . . . . . . . . . . . . . . . . . . . . . . . . . . . . . . . . . . . . . . . . . . . . . . . . . . . . . . . . . . . . 82
FINANCIAL STATEMENT SCHEDULESchedule II. Valuation and Qualifying Accounts . . . . . . . . . . . . . . . . . . . . . . . . . . . . . . . . . . 83
1
PART I
Item 1. Business.
Masco Corporation manufactures, distributes and installs home improvement and building prod-ucts, with emphasis on brand name products and services holding leadership positions in their markets.The Company is among the largest manufacturers in North America of brand-name consumer productsdesigned for the home improvement and new home construction markets. The Company’s operationsconsist of five business segments that are based on similarities in products and services. The followingtable sets forth, for the three years ended December 31, 2006, the contribution of the Company’s segmentsto net sales and operating profit. Additional financial information concerning the Company’s operationsby segment, as well as general corporate expense, as of and for the three years ended December 31, 2006,is set forth in Note P to the Company’s Consolidated Financial Statements included in Item 8 of thisReport.
2006 2005 2004
Net Sales (1)(In Millions)
Cabinets and Related Products . . . . . . . . . . . . . . . . . . $ 3,286 $ 3,324 $ 3,065Plumbing Products . . . . . . . . . . . . . . . . . . . . . . . . . . . . 3,296 3,176 3,057Installation and Other Services . . . . . . . . . . . . . . . . . . 3,158 3,063 2,771Decorative Architectural Products . . . . . . . . . . . . . . . . 1,777 1,681 1,610Other Specialty Products . . . . . . . . . . . . . . . . . . . . . . . 1,261 1,325 1,280
Total . . . . . . . . . . . . . . . . . . . . . . . . . . . . . . . . . . . . . . $12,778 $12,569 $11,783
2006 2005 2004
Operating Profit (1)(2)(3)(4)
Cabinets and Related Products . . . . . . . . . . . . . . . . . . . $ 122 $ 515 $ 519Plumbing Products . . . . . . . . . . . . . . . . . . . . . . . . . . . . 280 367 370Installation and Other Services . . . . . . . . . . . . . . . . . . . 344 382 358Decorative Architectural Products . . . . . . . . . . . . . . . . 357 252 269Other Specialty Products . . . . . . . . . . . . . . . . . . . . . . . 225 229 225
Total . . . . . . . . . . . . . . . . . . . . . . . . . . . . . . . . . . . . . . $1,328 $1,745 $1,741
(1) Amounts exclude discontinued operations.
(2) Operating profit is before general corporate expense and gains on sale of corporate fixedassets, net.
(3) Operating profit is before income regarding the Behr litigation settlement of $1 million,$6 million and $30 million in 2006, 2005 and 2004, respectively, pertaining to the DecorativeArchitectural Products segment.
(4) Operating profit includes goodwill impairment charges as follows: For 2006 – Cabinets andRelated Products – $316 million; Plumbing Products – $1 million; and Decorative Archi-tectural Products – $14 million. For 2005 – Plumbing Products – $7 million; DecorativeArchitectural Products – $26 million; and Other Specialty Products – $36 million. For 2004 –Plumbing Products – $25 million; Decorative Architectural Products – $62 million; andOther Specialty Products – $25 million.
Except as the context otherwise indicates, the terms “Masco” and the “Company” refer to MascoCorporation and its consolidated subsidiaries.
2

Cabinets and Related Products
In North America, the Company manufactures and sells economy, stock, semi-custom, assembledand ready-to-assemble cabinetry for kitchen, bath, storage, home office and home entertainmentapplications in a broad range of styles and price points. In Europe, the Company manufactures andsells assembled and ready-to-assemble kitchen, bath, storage, home office and home entertainmentcabinetry. These products are sold under a number of trademarks including KRAFTMAID», MILL’SPRIDE» and TVILUM-SCANBIRKTM primarily to dealers and home centers, and under the namesBLUESTONETM, MERILLAT», MOORESTM and QUALITY CABINETS» primarily to distributors anddirectly to builders for both the home improvement and new home construction markets.
The cabinet manufacturing industry in the United States and Europe is highly competitive, withseveral large and hundreds of smaller competitors. The Company believes that it is the largest man-ufacturer of kitchen and bath cabinetry in North America based on 2006 sales volume. Significant NorthAmerican competitors include American Woodmark, Aristokraft, Diamond, Homecrest, Omega andSchrock.
The Company is significantly increasing the manufacturing capacity of North American assembledcabinet operations.
Plumbing Products
In North America, the Company manufactures and sells a wide variety of faucet and showeringdevices under several brand names. The most widely known of these are the DELTA», PEERLESS»,BRIZO», BRASSTECH» and NEWPORT BRASS» single and double handle faucets used in kitchen andlavatory sinks and in bath and shower applications. The Company’s faucets are sold by manufacturers’representatives and Company sales personnel to major retail accounts and to distributors who sell thefaucets to plumbers, building contractors, remodelers, smaller retailers and others. Showerheads,handheld showers and valves are sold under the brand names ALSONS», DELTA, PEERLESS andPLUMB SHOP». The Company manufactures kitchen and bath faucets, showering devices and variousother plumbing products for European markets under the brand names AXORTM, BRISTANTM,DAMIXA», GUMMERSTM, HANSGROHE» and NEWTEAMTM, which are sold through multiple distri-bution channels. In addition, AXOR and HANSGROHE products are sold in North America and the FarEast through retailers and wholesalers.
Masco believes that its faucet operations are among the leaders in sales in the North Americanmarket, with American Standard, Kohler, Moen and Price Pfister as major brand competitors. TheCompany also has several major competitors, including Friedrich Grohe, among the European manu-facturers of faucets and accessories, primarily in Germany and Italy. The Company also faces significantcompetition from private label products (including house brands sold by certain of the Company’scustomers). Many of the faucet and showering device products with which the Company’s productscompete are manufactured in Asia. As part of the Company’s strategy for its products, the Company’sNorth American businesses have been reducing the volume of products manufactured domestically andincreasing the manufacturing and sourcing of products from Asia.
Other plumbing products manufactured and sold by the Company include AQUA GLASS» andMIROLIN» acrylic and gelcoat bath and shower units, which are sold primarily to wholesale plumbingdistributors and major retail accounts for the home improvement and new home construction markets.Bath and shower enclosure units, shower trays and laundry tubs are manufactured and sold under thebrand name AMERICAN SHOWER & BATHTM. These products are sold to home centers, hardwarestores and mass merchandisers for the “do-it-yourself” market. The Company’s spas are manufacturedand sold under HOT SPRING», CALDERA» and other trademarks directly to independent dealers.Other plumbing products for the international market include HUPPE» and BREUERTM shower enclo-sures sold by the Company through wholesale channels and home centers primarily in Germany andwestern Europe. HERITAGETM ceramic and acrylic bath fixtures and faucets are principally sold in the
3

United Kingdom directly to selected retailers. GLASSTM and PHAROTM acrylic bathtubs and steamshower enclosures are sold in Europe.
Also included in the Plumbing Products segment are brass and copper plumbing system compo-nents and other plumbing specialties, which are sold to plumbing, heating and hardware wholesalersand to home centers, hardware stores, building supply outlets and other mass merchandisers. Theseproducts are marketed in North America for the wholesale trade under the BRASSCRAFT» andBRASSTECH trademarks and for the “do-it-yourself” market under the MASTER PLUMBER» andPLUMB SHOP trademarks and are also sold under private label.
Installation and Other Services
The Company’s Installation and Other Services segment sells installed building products anddistributes building products, primarily to the new home construction industry in North America.Historically, the Company has concentrated on the installation and distribution of insulation, whichcomprised approximately 15 percent of the Company’s consolidated net sales for each of the years endedDecember 31, 2006, 2005 and 2004. Our offering of installed building products includes insulation,cabinetry, fireplaces, gutters and garage doors. Collaboration with other Company businesses hasincreased installed sales of Company products, such as cabinets, bath accessories, windows and paint.Distributed products include insulation, insulation accessories, cabinetry, roofing, gutters and drywall.Net sales of non-insulation products (both installed and distributed) in 2006 represented approximately41 percent of the segment’s net sales. Installed products are sold primarily to custom home builders andproduction home builders by over 280 installation branch locations throughout most of the United Statesand in Canada. Distributed products are sold primarily to contractors and dealers by over 60 distributioncenters throughout the United States.
The Company’s competitors in this segment include several regional contractors and lumber yards,as well as numerous local contractors.
Decorative Architectural Products
The Company manufactures architectural coatings including paints, specialty paint products,stains, varnishes and waterproofing products. The products are sold under the brand names BEHR»
and KILZ» and various other brand names, as well as private labels in the United States and Canadaprimarily to the “do-it-yourself” market through home centers and other retailers. Net sales of archi-tectural coatings comprised approximately 11 percent of the Company’s consolidated net sales for eachof the years ended December 31, 2006, 2005 and 2004, respectively. Competitors in the architecturalcoatings market include large international brands such as Benjamin Moore, Glidden, Pittsburgh Paint,Sherwin-Williams and Valspar, as well as many regional and national competitors.
The Company maintains customer kiosks in all of the approximately 2,000 The Home Depot storesthroughout the United States and Canada. These COLOR SOLUTIONSTM centers include the COLORSMART BY BEHR» computerized color-matching system that enables consumers to design and coor-dinate their paint selection. The BEHR brand is sold through The Home Depot.
The Decorative Architectural Products segment also includes LIBERTY» cabinet, decorative doorand builders’ hardware, which is manufactured for the Company and sold to home centers, otherretailers, original equipment manufacturers and wholesale markets. Key competitors in North Americainclude Amerock, Belwith, Umbra and Stanley. AVOCETTM builders’ hardware products, including locksand door and window hardware, are manufactured and sold to home centers and other retailers,builders and original equipment door and window manufacturers primarily in the United Kingdom.
Decorative bath hardware and shower accessories are sold under the brand names FRANKLINBRASS» and DECOR BATHWARE» to distributors, home centers and other retailers. Competitorsinclude Moen and Globe Union.
4
Other Specialty Products
The Company manufactures and sells windows and patio doors under the MILGARD» brand namedirectly to the new home construction and home improvement markets, principally in the westernUnited States. The Company fabricates and sells vinyl windows and sunrooms under various regionalbrand names for the United Kingdom building trades. The Company extrudes and sells vinyl framecomponents and tempers glass for windows, patio doors and sunrooms for the European buildingtrades. Competitors in the North American window and door market include Andersen, Pella, Jeld-Wenand Simonton, as well as numerous regional competitors.
The Company manufactures and sells a complete line of manual and electric staple gun tackers,staples and other fastening tools under the brand names ARROW» and POWERSHOT». These productsare sold through various distribution channels including wholesalers, home centers and other retailers.The principal North American competitor in this product line is Stanley.
The Company also manufactures residential hydronic radiators and heat convectors under thebrand names BRUGMAN», SUPERIATM, THERMICTM and VASCO», which are sold to the Europeanwholesale market from operations in Belgium, The Netherlands and Poland.
Discontinued Operations
As part of its strategic planning, the Company continues to review all of its businesses to determinewhich businesses may not be core to the Company’s long-term growth strategy. In 2004, the Companydetermined that several European businesses were not core to the Company’s long-term growth strategyand, accordingly, embarked on a plan of disposition that was completed in early 2005. In addition, theCompany sold two businesses in 2005 and one business in 2006. The businesses sold during 2004, 2005and 2006 were included in discontinued operations and had combined 2004 net sales of approximately$640 million. Additional information is set forth in “Management’s Discussion and Analysis of FinancialCondition and Results of Operations” included in Item 7 of this Report.
Additional Information
• Over 80 percent of the Company’s net sales are generated by operations in North America(primarily in the United States). International operations comprise the balance and are locatedprincipally in Belgium, China, Denmark, Germany, The Netherlands and the United Kingdom.See Note P to the Company’s consolidated financial statements included in Item 8 of this Reportfor additional information.
• Financial information concerning the Company’s export sales and the net sales and operatingprofit attributable to the Company’s North American and International operations are included inItem 8 of this Report in Note P to the Company’s consolidated financial statements. Net sales andthe value of long-lived assets attributable to the Company’s operations in the United States andEurope are also reflected in Note P.
• The Company generally experiences stronger sales during the second and third calendar quar-ters, corresponding with the peak season for new home construction and remodeling.
• The Company does not consider backlog orders to be material.
• Compliance with federal, state and local regulations relating to the discharge of materials into theenvironment, or otherwise relating to the protection of the environment, is not expected to resultin material capital expenditures by the Company or to have a material adverse effect on theCompany’s earnings or competitive position.
• See Item 1A, “Risk Factors,” for a discussion of the importance of major customers, competitiveconditions and certain other business risks and uncertainties that may affect our operations.
5

Available Information
The Company’s website is www.masco.com. The Company’s periodic reports and all amendmentsto those reports required to be filed or furnished pursuant to Section 13(a) or Section 15(d) of theSecurities Exchange Act of 1934 are available free of charge through its website. The Company willcontinue to post its periodic reports on Form 10-K and Form 10-Q and its current reports on Form 8-K andany amendments to those documents to its website as soon as reasonably practicable after those reportsare filed with or furnished to the Securities and Exchange Commission. Material contained on theCompany’s website is not incorporated by reference into this Report on Form 10-K.
Patents and Trademarks
The Company holds United States and foreign patents covering its various design features and valveconstructions used in certain of its faucets and holds numerous other patents and patent applications,licenses, trademarks and trade names. As a manufacturer of brand-name consumer products, theCompany views its trademarks and other proprietary rights as important, but does not believe thatthere is any reasonable likelihood of a loss of such rights that would have a material adverse effect on theCompany’s present business as a whole.
Employees
At December 31, 2006, the Company employed approximately 57,000 people. Satisfactory relationshave generally prevailed between the Company and its employees.
Item 1A. Risk Factors.
There are a number of business risks and uncertainties that may affect our Company. These risks anduncertainties could cause future results to differ from past performance or expected results, includingresults described in statements elsewhere in this Report that constitute “forward-looking statements”under the Private Securities Litigation Reform Act of 1995. The impact on our Company of certain ofthese risk factors is discussed below under Item 7, “Management’s Discussion and Analysis of FinancialCondition and Results of Operations.” Additional risks and uncertainties not presently known to us, orthat we currently believe to be immaterial, also may adversely impact our Company. Should any risks oruncertainties develop into actual events, these developments could have material adverse effects on ourbusiness, financial condition and results of operations. These risks and uncertainties include, but are notlimited to, the following, which we consider to be most relevant to our specific business activities.
A significant portion of our business relies on residential construction activity.
Our results of operations are affected by levels of home improvement and residential constructionactivity, including repair, remodeling and new home construction, principally in North America andEurope. Significant factors that impact demand for home improvement and residential constructioninclude interest rates, energy costs, consumer confidence, general and regional economic conditions,weather conditions and natural disasters. The ability of contractors and builders to supply constructionprojects and the timing of such projects, and thereby their purchases of our products and services, can beaffected significantly by the availability of building materials and skilled labor. Demographic factors,such as changes in population growth and household formation, affect levels of home improvement andresidential construction over the longer term. We have increased our emphasis on new product devel-opment in recent years and we have reduced our prior focus on growth through acquisitions and areconcentrating instead on organic growth. Consequently, our financial performance will, in part, reflectour success in implementing our growth strategies in our existing markets and in introducing newproducts or entering new geographic markets. See “Management’s Discussion and Analysis of FinancialCondition and Results of Operations” under Item 7 of this Report for discussion of the impact ofresidential construction activities on the Company’s operating results.
We rely on key customers.
The size and importance of individual customers has increased because customers in our majordistribution channels have consolidated. Larger customers can effect significant changes in their volume
6

of purchases and can otherwise significantly affect the terms and conditions on which we do business.These customers are increasing their purchases of products directly from manufacturers for sale asprivate label and house brand merchandise. As some of our customers expand their markets andtargeted customers, conflicts occur and in some instances we may also become their competitor. Sales ofour home improvement and building products to home center retailers are substantial. In 2006, sales tothe Company’s largest customer, The Home Depot, were $2.5 billion (approximately 20 percent of netsales). Although builders, dealers and other retailers represent other channels of distribution for theCompany’s products, the loss of a substantial portion of our sales to The Home Depot would have amaterial adverse impact on the Company.
We face significant competition in the U.S. and global markets.
The major markets for our products and services are highly competitive and in recent years globalcompetition has increased significantly. Competition in home improvement and building product lines isbased largely on performance, quality, brand reputation, style, delivery, customer service, exclusivityand price. Competition in the markets for our service businesses is based primarily on price, customerservice, scope of capabilities, installation quality and financial strength. Although the relative impor-tance of such factors varies between customers and among product categories, price is often a primaryfactor. Home center retailers, which have historically concentrated their sales efforts on retail consumersand small contractors, may in the future intensify their marketing efforts directly to professionalhomebuilders. Our ability to maintain our leadership positions in the markets we serve and to growthe businesses depends to a large extent upon our success in maintaining our relationships with majorcustomers, managing our cost structure and introducing new products that appeal to changing con-sumer preferences.
Our operating results are affected by the cost and availability of labor and materials.
When we incur cost increases for raw materials, such as copper, brass and particle board, and forenergy and other commodities, it may be difficult for us to completely offset the impact with priceincreases on a timely basis due to outstanding commitments to customers, competitive considerationsand our customers’ resistance to accepting such price increases. Some of our operations, including theInstallation and Other Services segment, encounter shortages or unusual price increases in raw materials,including insulation, from time to time. A substantial decrease in the availability of raw materials fromsuppliers or the loss of key supplier arrangements could adversely impact our results of operations.
Although the availability of qualified employees is important throughout the entire Company, this isparticularly applicable to our Installation and Other Services segment, because of its labor-intensiveinstallation business. Significant changes in federal, state and local regulations addressing immigrationand wages, as well as collective bargaining arrangements affecting wages and working conditions, couldadversely affect the performance of our businesses.
International developments have an increasing impact on our business.
Over 17 percent of our sales are derived outside of North America (principally in Europe) and aretransacted in currencies other than U.S. dollars (principally European euros and Great Britain pounds).Our international business faces risks associated with changes in political, monetary, economic and socialenvironments, local labor conditions and practices, the laws, regulations and policies of foreign gov-ernments, cultural differences and differences in enforcement of contract and intellectual property rights.U.S. laws affecting activities of U.S. companies abroad, including tax laws and laws regulating variousbusiness practices, also impact our international business. Our international operating results have beenadversely influenced in the past when compared to our North American results, in part due to relativesoftness in the European markets and competitive pricing pressures on certain products.
Increasingly, we are sourcing products from outside North America, principally in Asia, and sellingproducts in international markets. Differing international business practices, shipping and deliveryrequirements, and laws and regulations applicable to our business in these markets have raised the
7

complexity of managing our supply chain logistics and the potential for interruptions in our productionscheduling.
Our operating results can fluctuate based on changes in currency exchange rates, which presentsdifficulty in comparing operating performance from period to period.
We have financial commitments and investments in financial assets, including assets that are notreadily marketable and involve financial risk.
We have maintained investments in marketable securities and a number of private equity funds.Since there is no active trading market for investments in private equity funds, they are for the most partilliquid. These investments, by their nature, can also have a relatively higher degree of business risk,including financial leverage, than other financial investments. Future changes in market conditions, thefuture performance of the underlying investments or new information provided by private equity fundmanagers could affect the recorded values of such investments and the amounts realized upon liqui-dation. In addition, we have commitments that require us to contribute additional capital to these privateequity funds upon receipt of a capital call from the private equity fund.
Product liability claims and other litigation could be costly.
Increasingly, homebuilders, including our customers, are subject to construction defect and homewarranty claims in the ordinary course of their business. Our contractual commitments to thesecustomers typically include the agreement to indemnify them against liability for the performance ofour products or services or the performance of other products that we install.
We are also subject to product safety regulations, recalls and direct claims for product liability,including putative class actions. Product liability claims can result in significant liability and, regardlessof the ultimate outcome, can be costly to defend. Also, we increasingly rely on other manufacturers toprovide us with products or components for products we sell. Because we do not have direct control overthe quality of such products, we are exposed to the risks relating to the quality of such products and tolimitations on our recourse against such suppliers.
See Note T to the consolidated financial statements included in Item 8 of this Report for additionalinformation about litigation involving our businesses.
Item 1B. Unresolved Staff Comments.
None.
Item 2. Properties.
The table below lists the Company’s principal North American properties for segments other thanInstallation and Other Services.
Business Segment ManufacturingWarehouse and
Distribution
Cabinets and Related Products . . . . . . . . . . . . . . . 19 32Plumbing Products . . . . . . . . . . . . . . . . . . . . . . . . . 30 12Decorative Architectural Products . . . . . . . . . . . . . 10 12Other Specialty Products . . . . . . . . . . . . . . . . . . . . 16 8
Totals . . . . . . . . . . . . . . . . . . . . . . . . . . . . . . . . . . 75 64
Most of the Company’s North American manufacturing facilities range in size from single buildingsof approximately 10,000 square feet to complexes that exceed 1,000,000 square feet. The Company ownsmost of its North American manufacturing facilities, none of which are subject to significant encum-brances. A substantial number of our warehouse and distribution facilities are leased.
8

In addition, the Company’s Installation and Other Services segment operates over 280 localinstallation branch locations and over 60 local distribution centers in North America, the majority ofwhich are leased.
The table below lists the Company’s principal properties outside of North America.
Business Segment ManufacturingWarehouse and
Distribution
Cabinets and Related Products . . . . . . . . . . . . . . . . . . 4 25Plumbing Products . . . . . . . . . . . . . . . . . . . . . . . . . . . . 28 35Decorative Architectural Products . . . . . . . . . . . . . . . . 3 3Other Specialty Products . . . . . . . . . . . . . . . . . . . . . . . 15 8
Totals . . . . . . . . . . . . . . . . . . . . . . . . . . . . . . . . . . . . . 50 71
Most of these international facilities are located in Belgium, China, Denmark, Germany, TheNetherlands and the United Kingdom. The Company generally owns its international manufacturingfacilities, none of which are subject to significant encumbrances, and leases its warehouse and distri-bution facilities.
The Company’s corporate headquarters are located in Taylor, Michigan and are owned by theCompany. The Company owns an additional building near its corporate headquarters that is used by ourcorporate research and development department.
Each of the Company’s operating divisions assesses the manufacturing, distribution and otherfacilities needed to meet its operating requirements. The Company’s buildings, machinery and equip-ment have been generally well maintained and are in good operating condition. As noted, the Companyis significantly increasing the manufacturing capacity of North American assembled cabinet operations,but otherwise, generally, the Company’s facilities have sufficient capacity and are adequate for itsproduction and distribution requirements.
Item 3. Legal Proceedings.
Information regarding legal proceedings involving the Company is set forth in Note T to theCompany’s consolidated financial statements included in Item 8 of this Report.
Item 4. Submission of Matters to a Vote of Security Holders.
Not applicable.
Supplementary Item. Executive Officers of the Registrant(Pursuant to Instruction 3 to Item 401(b) of Regulation S-K).
Name Position Age
ExecutiveOfficerSince
Richard A. Manoogian . . . . Chairman of the Board and Chief Executive Officer 70 1962Alan H. Barry . . . . . . . . . . . President and Chief Operating Officer 64 2003Daniel R. Foley . . . . . . . . . . Vice President – Human Resources 65 1996Eugene A. Gargaro, Jr. . . . . Vice President and Secretary 64 1993John R. Leekley . . . . . . . . . . Senior Vice President and General Counsel 63 1979John G. Sznewajs. . . . . . . . . Vice President – Corporate Development and Treasurer 39 2005Timothy Wadhams . . . . . . . Senior Vice President and Chief Financial Officer 58 2001
Executive officers, who are elected by the Board of Directors, serve for a term of one year or less. Eachelected executive officer has been employed in a managerial capacity with the Company for at least fiveyears. Mr. Barry was elected to his present position in April 2003. He had previously served as a GroupPresident of the Company since 1996. Mr. Sznewajs was elected to his current position in August 2005. Hehad previously served as Vice President – Business Development since 2003 and before that time servedin various capacities in the Business Development Department from 1996 to 2003.
9
PART II
Item 5. Market for Registrant’s Common Equity, Related Stockholder Matters and Issuer Purchasesof Equity Securities.
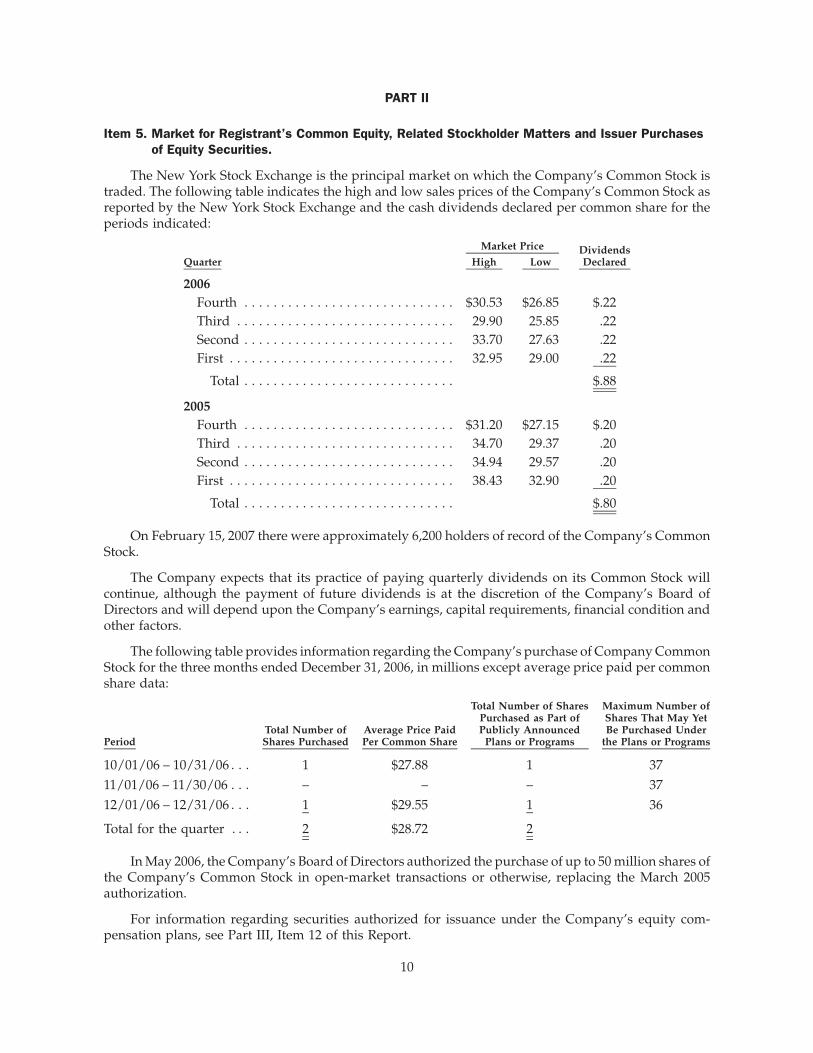
The New York Stock Exchange is the principal market on which the Company’s Common Stock istraded. The following table indicates the high and low sales prices of the Company’s Common Stock asreported by the New York Stock Exchange and the cash dividends declared per common share for theperiods indicated:
Quarter High LowDividendsDeclared
Market Price
2006Fourth . . . . . . . . . . . . . . . . . . . . . . . . . . . . . $30.53 $26.85 $.22Third . . . . . . . . . . . . . . . . . . . . . . . . . . . . . . 29.90 25.85 .22Second . . . . . . . . . . . . . . . . . . . . . . . . . . . . . 33.70 27.63 .22First . . . . . . . . . . . . . . . . . . . . . . . . . . . . . . . 32.95 29.00 .22
Total . . . . . . . . . . . . . . . . . . . . . . . . . . . . . $.88
2005Fourth . . . . . . . . . . . . . . . . . . . . . . . . . . . . . $31.20 $27.15 $.20Third . . . . . . . . . . . . . . . . . . . . . . . . . . . . . . 34.70 29.37 .20Second . . . . . . . . . . . . . . . . . . . . . . . . . . . . . 34.94 29.57 .20First . . . . . . . . . . . . . . . . . . . . . . . . . . . . . . . 38.43 32.90 .20
Total . . . . . . . . . . . . . . . . . . . . . . . . . . . . . $.80
On February 15, 2007 there were approximately 6,200 holders of record of the Company’s CommonStock.
The Company expects that its practice of paying quarterly dividends on its Common Stock willcontinue, although the payment of future dividends is at the discretion of the Company’s Board ofDirectors and will depend upon the Company’s earnings, capital requirements, financial condition andother factors.
The following table provides information regarding the Company’s purchase of Company CommonStock for the three months ended December 31, 2006, in millions except average price paid per commonshare data:
PeriodTotal Number ofShares Purchased
Average Price PaidPer Common Share
Total Number of SharesPurchased as Part ofPublicly Announced
Plans or Programs
Maximum Number ofShares That May YetBe Purchased Under
the Plans or Programs
10/01/06 – 10/31/06 . . . 1 $27.88 1 3711/01/06 – 11/30/06 . . . – – – 3712/01/06 – 12/31/06 . . . 1 $29.55 1 36
Total for the quarter . . . 2 $28.72 2
In May 2006, the Company’s Board of Directors authorized the purchase of up to 50 million shares ofthe Company’s Common Stock in open-market transactions or otherwise, replacing the March 2005authorization.
For information regarding securities authorized for issuance under the Company’s equity com-pensation plans, see Part III, Item 12 of this Report.
10

Item 6. Selected Financial Data.
2006 2005 2004 2003 2002(Dollars In Millions, Except Per Common Share Data)
Net sales (1) . . . . . . . . . . . . . . . . . . . . . . . . . . . . . . $12,778 $12,569 $11,783 $10,318 $ 8,596Operating profit (1),(2),(4),(5),(6),(7) . . . . . . . . . . . . $ 1,126 $ 1,567 $ 1,584 $ 1,445 $ 1,228Income from continuing operations
(1),(2),(3),(4),(5),(6),(7),(8) . . . . . . . . . . . . . . . . . . . $ 458 $ 866 $ 944 $ 767 $ 520Per share of common stock:
Income from continuing operations:Basic . . . . . . . . . . . . . . . . . . . . . . . . . . . . . . . . . $ 1.16 $ 2.05 $ 2.12 $ 1.60 $ 1.07Diluted . . . . . . . . . . . . . . . . . . . . . . . . . . . . . . . $ 1.15 $ 2.01 $ 2.07 $ 1.56 $ 1.01
Dividends declared . . . . . . . . . . . . . . . . . . . . . . . $ 0.88 $ 0.80 $ 0.68 $ 0.60 $ 0.55Dividends paid . . . . . . . . . . . . . . . . . . . . . . . . . . $ 0.86 $ 0.78 $ 0.66 $ 0.58 $ 0.541⁄2Income from continuing operations as a % of:
Net sales. . . . . . . . . . . . . . . . . . . . . . . . . . . . . . 4% 7% 8% 7% 6%Shareholders’ equity (9) . . . . . . . . . . . . . . . . . 9% 16% 17% 14% 13%
At December 31:Total assets. . . . . . . . . . . . . . . . . . . . . . . . . . . . . . $12,325 $12,559 $12,541 $12,173 $12,050Long-term debt . . . . . . . . . . . . . . . . . . . . . . . . . . $ 3,533 $ 3,915 $ 4,187 $ 3,848 $ 4,316Shareholders’ equity . . . . . . . . . . . . . . . . . . . . . . $ 4,471 $ 4,848 $ 5,423 $ 5,456 $ 5,294
(1) Amounts exclude discontinued operations.
(2) The year 2006 includes non-cash impairment charges for goodwill aggregating $331 million after tax($331 million pre-tax), income of $1 million after tax ($1 million pre-tax) regarding the Behr litigationsettlement.
(3) The year 2006 includes a $3 million after tax ($5 million pre-tax) charge for the adoption of SFASNo. 123R recognized as a cumulative effect of a change in accounting.
(4) The year 2005 includes non-cash impairment charges for goodwill aggregating $69 million after tax($69 million pre-tax) and income of $4 million after tax ($6 million pre-tax) regarding the Behrlitigation settlement.
(5) The year 2004 includes non-cash impairment charges for goodwill aggregating $104 million after tax($112 million pre-tax) and income of $19 million after tax ($30 million pre-tax) regarding the Behrlitigation settlement.
(6) The year 2003 includes non-cash impairment charges for goodwill aggregating $47 million after tax($53 million pre-tax) and income of $45 million after tax ($72 million pre-tax) regarding the Behrlitigation settlement.
(7) The year 2002 includes a net charge of $92 million after tax ($147 million pre-tax) regarding the Behrlitigation settlement.
(8) The year 2002 includes non-cash impairment charges for goodwill aggregating $92 million after tax($117 million pre-tax) recognized as a cumulative effect of a change in accounting.
(9) Based on shareholders’ equity as of the beginning of the year.
11

Item 7. Management’s Discussion and Analysis of Financial Condition and Results of Operations.
The financial and business analysis below provides information which the Company believes isrelevant to an assessment and understanding of its consolidated financial position, results of operationsand cash flows. This financial and business analysis should be read in conjunction with the consolidatedfinancial statements and related notes.
The following discussion and certain other sections of this Report contain statements reflecting theCompany’s views about its future performance and constitute “forward-looking statements” under thePrivate Securities Litigation Reform Act of 1995. These views involve risks and uncertainties that aredifficult to predict and, accordingly, the Company’s actual results may differ materially from the resultsdiscussed in such forward-looking statements. Readers should consider that various factors, includingthose discussed in Item 1A “Risk Factors” of this Report, the “Executive Level Overview,” “CriticalAccounting Policies and Estimates” and “Outlook for the Company” sections, may affect the Company’sperformance. The Company undertakes no obligation to update publicly any forward-looking state-ments as a result of new information, future events or otherwise.
Executive Level Overview
The Company manufactures, distributes and installs home improvement and building products.These products are sold to the home improvement and home construction markets through massmerchandisers, hardware stores, home centers, builders, distributors and other outlets for consumersand contractors.
Factors that affect the Company’s results of operations include the levels of home improvement andresidential construction activity principally in North America and Europe (including repair and remod-eling and new home construction), the importance of and the Company’s relationships with keycustomers (including The Home Depot, which represented approximately 20 percent of the Company’snet sales in 2006), the Company’s ability to maintain its leadership positions in its U.S. and global marketsin the face of increasing competition, the Company’s ability to effectively manage its overall coststructure and the cost and availability of labor and materials. The Company’s international businessfaces political, monetary, economic and other risks that vary from country to country, as well asfluctuations in currency exchange rates. Further, the Company has financial commitments and invest-ments in financial assets that are not readily marketable and that involve financial risk. In addition,product liability claims and other litigation could be costly. These and other factors are discussed in moredetail in Item 1A “Risk Factors” of this Report.
Critical Accounting Policies and Estimates
The Company’s discussion and analysis of its financial condition and results of operations are basedupon the Company’s consolidated financial statements, which have been prepared in accordance withaccounting principles generally accepted in the United States of America. The preparation of thesefinancial statements requires the Company to make certain estimates and assumptions that affect thereported amounts of assets and liabilities, disclosure of any contingent assets and liabilities at the date ofthe financial statements and the reported amounts of revenues and expenses during the reportingperiods. The Company regularly reviews its estimates and assumptions, which are based upon historicalexperience and various other factors that are believed to be reasonable under the circumstances, theresults of which form the basis for making judgments about the carrying values of certain assets andliabilities that are not readily apparent from other sources. Actual results may differ from these estimatesand assumptions.
The Company believes that the following critical accounting policies are affected by significantjudgments and estimates used in the preparation of its consolidated financial statements.
12
Revenue Recognition and Receivables
The Company recognizes revenue as title to products and risk of loss is transferred to customers orwhen services are rendered. The Company records revenue for unbilled services performed based uponestimates of labor incurred in the Installation and Other Services segment; such amounts are recorded inReceivables. The Company records estimated reductions to revenue for customer programs and incen-tive offerings, including special pricing and co-operative advertising arrangements, promotions andother volume-based incentives. Allowances for doubtful accounts receivable are maintained for esti-mated losses resulting from the inability of customers to make required payments.
Inventories
Inventories are recorded at the lower of cost or net realizable value with expense estimates made forobsolescence or unsaleable inventory equal to the difference between the recorded cost of inventoriesand their estimated market value based upon assumptions about future demand and market conditions.On an ongoing basis, the Company monitors these estimates and records adjustments for differencesbetween estimates and actual experience. Historically, actual results have not significantly deviated fromthose determined using these estimates.
Financial Investments
The Company has maintained investments in marketable securities and a number of private equityfunds, which aggregated $72 million and $211 million, respectively, at December 31, 2006. Investments inmarketable securities are carried at fair value, and unrealized gains and losses (that are deemed to betemporary) are recognized, net of tax effect, through shareholders’ equity, as a component of othercomprehensive income. The Company records an impairment charge to earnings when an investmenthas experienced a decline in value that is deemed to be other-than-temporary.
The Company’s investments in private equity funds and other private investments are carried atcost and are evaluated for potential impairment when impairment indicators are present, or when anevent or change in circumstances has occurred, that may have a significant adverse affect on the fairvalue of the investment. Impairment indicators the Company considers include the following: whetherthere has been a significant deterioration in earnings performance, asset quality or business prospects; asignificant adverse change in the regulatory, economic or technological environment; a significantadverse change in the general market condition or geographic area in which the investment operates;and, any bona fide offers to purchase for less than the carrying value. Since there is no active tradingmarket for these investments, they are for the most part illiquid. These investments, by their nature, canalso have a relatively higher degree of business risk, including financial leverage, than other financialinvestments. Future changes in market conditions, the future performance of the underlying investmentsor new information provided by private equity fund managers could affect the recorded values of suchinvestments and the amounts realized upon liquidation.
In November 2000, the Company reduced its common equity ownership in Metaldyne Corporation(“Metaldyne”) (formerly MascoTech, Inc.) through a recapitalization merger with an affiliate of Heart-land Industrial Partners, L.P. (“Heartland”), a private equity fund in which the Company had aremaining investment of $17 million at December 31, 2006 (representing less than five percent of thefund). The Company in that transaction retained six percent of the common equity of Metaldyne. AtDecember 31, 2006, the Company also held preferred stock of Metaldyne, which accrues dividends at theannual rate of 15 percent. Additionally, the Company owned an approximate 10 percent investment inTriMas Corporation (“TriMas”) common stock. Investments in Metaldyne and TriMas are accounted foron the cost basis.
During 2006, based upon a review of new information from the Heartland fund concerning fundinvestments and the continued deterioration of conditions in the automotive supplier and transportationproducts markets served by Metaldyne and TriMas, the Company determined that the decline in theestimated value of certain of its financial investments was other-than-temporary. Accordingly, in the
13

second quarter of 2006, the Company recognized a non-cash, pre-tax impairment charge aggregating$78 million for its investments in Metaldyne ($40 million), TriMas ($6 million), the Heartland fund($29 million) and another fund ($3 million) which invested in automotive and transportation-relatedsuppliers, including Metaldyne and TriMas. Additionally, based upon the Company’s review, theCompany considered the decline in the fair value of certain of its other private equity fund investmentsand other investments to be other-than-temporary and, accordingly, recognized impairment charges of$13 million and $15 million in 2006 and 2005, respectively. In the fourth quarter of 2006, the Companyreceived new information related to its TriMas investment and determined that the additional decline inthe estimated value for this investment was other-than-temporary. Accordingly, in the fourth quarter of2006, the Company recognized an additional non-cash, pre-tax impairment charge of $10 million relatedto its investment in TriMas.
On January 11, 2007, the acquisition of Metaldyne by Asahi Tec Corporation, a Japanese automotivesupplier, was finalized. The combined fair value of Asahi Tec common and preferred stock received inexchange for the Company’s investment in Metaldyne (common and preferred stock) approximates$74 million and the Company’s carrying value of the Metaldyne investment was $57 million atDecember 31, 2006. As a result, a gain of approximately $17 million will be recognized in the firstquarter of 2007. Any unrealized gains or losses subsequent to January 11, 2007, will be recognized, net oftax, through shareholders’ equity, as a component of other comprehensive income, in the Company’sconsolidated balance sheet beginning in the first quarter of 2007.
Goodwill and Other Intangible Assets
The Company records the excess of purchase cost over the fair value of net tangible assets ofacquired companies as goodwill or other identifiable intangible assets. In accordance with Statement ofFinancial Accounting Standards (“SFAS”) No. 142 “Goodwill and Other Intangible Assets,” in the fourthquarter of each year, or as an event occurs or circumstances change that would more likely than notreduce the fair value of a reporting business unit below its carrying amount, the Company completes theimpairment testing of goodwill utilizing a discounted cash flow method. Determining market valuesusing a discounted cash flow method requires the Company to make significant estimates and assump-tions, including long-term projections of cash flows, market conditions and appropriate discount rates.The Company’s judgments are based upon historical experience, current market trends, consultationswith external valuation specialists and other information. While the Company believes that the estimatesand assumptions underlying the valuation methodology are reasonable, different estimates and assump-tions could result in a different outcome. In estimating future cash flows, the Company relies oninternally generated five-year forecasts for sales and operating profits, including capital expenditures,and generally a one to three percent long-term assumed annual growth rate of cash flows for periodsafter the five-year forecast. The Company generally develops these forecasts based upon, among otherthings, recent sales data for existing products, planned timing of new product launches, estimatedhousing starts and repair and remodeling estimates for existing homes.
In the fourth quarter of 2006, the Company estimated that future discounted cash flows projected formost of its reporting business units were greater than the carrying values. Any increases in estimateddiscounted cash flows would have no impact on the reported value of goodwill.
If the carrying amount of a reporting business unit exceeds its fair value, the Company measures thepossible goodwill impairment based upon an allocation of the estimate of fair value of the reportingbusiness unit to all of the underlying assets and liabilities of the reporting business unit, including anypreviously unrecognized intangible assets. The excess of the fair value of a reporting business unit overthe amounts assigned to its assets and liabilities is the implied fair value of goodwill. An impairment lossis recognized to the extent that a reporting business unit’s recorded goodwill exceeds the implied fairvalue of goodwill. This test for 2006 indicated that goodwill principally related to certain Europeanbusiness units was impaired.
14
The Company recognized non-cash, pre-tax impairment charges for goodwill of $331 million($331 million, after tax) in 2006. The pre-tax impairment charges recorded in 2006 were as follows:Cabinets and Related Products – $316 million; Plumbing Products – $1 million; and Decorative Archi-tectural Products – $14 million. These charges, principally related to the Company’s European manu-facturer of ready-to-assemble cabinets (Tvilum-Scanbirk), reflect the long-term outlook for that businessunit, including declining demand for certain products, as well as decreased operating profit margins.
The impairment charge for goodwill related to Tvilum-Scanbirk resulted from two significantchanges impacting the business unit throughout the year, but particularly in the fourth quarter of 2006.First, there was a fundamental shift in the European ready-to-assemble raw materials supply market; thechange affected the cost structure for raw materials. Second, the Company determined that the businessunit’s ability to increase selling prices and maintain revenue growth into the future has become morelimited. In the fourth quarter of 2006, as part of the annual goodwill impairment testing, the Companydetermined that these changes and the impact on operating profit and operating profit margins werepermanent in nature.
The Company reviews its other indefinite-lived intangible assets for impairment annually or asevents occur or circumstances change that indicate the assets may be impaired without regard to thereporting unit. The Company considers the implications of both external (e.g., market growth, compe-tition and local economic conditions) and internal (e.g., product sales, profit margins and expectedproduct growth) factors and their potential impact on cash flows related to the intangible asset in both thenear- and long-term.
Intangible assets with finite useful lives are amortized over their estimated useful lives. TheCompany evaluates the remaining useful lives of amortizable identifiable intangible assets at eachreporting period to determine whether events and circumstances warrant a revision to the remainingperiods of amortization.
Employee Retirement Plans
Accounting for defined-benefit pension plans involves estimating the cost of benefits to be providedin the future, based upon vested years of service, and attributing those costs over the time period eachemployee works. Pension costs and obligations of the Company are developed from actuarial valuations.Inherent in these valuations are key assumptions regarding inflation, expected return on plan assets,mortality rates, compensation increases and discount rates for obligations and expenses. The Companyconsiders current market conditions, including changes in interest rates, in selecting these assumptions.Changes in assumptions used could result in changes to reported pension costs and obligations withinthe Company’s consolidated financial statements in any given period.
In 2006, the Company increased its discount rate for obligations to an average of 5.50 percent from5.25 percent. The discount rate for obligations was based on the expected duration of each defined-benefit pension plan’s liabilities matched to the December 31, 2006 Citigroup Pension Discount Curve.Such rates for the Company’s defined-benefit pension plans ranged from 4.00 percent to 6.00 percent,with the most significant portion of the liabilities having a discount rate for obligations of 5.50 percent orhigher. The assumed asset return was primarily 8.50 percent, reflecting the expected long-term return onplan assets.
In September 2006, the Financial Accounting Standards Board (“FASB”) issued SFAS No. 158,“Employers’ Accounting for Defined Benefit Pension and Other Postretirement Plans, an amendment ofFASB Statements No. 87, 88, 106 and 132R,” (“SFAS No. 158”). Among other things, SFAS No. 158requires companies to prospectively recognize a net liability or asset and to report the funded status oftheir defined-benefit pension and other postretirement benefit plans on their balance sheets, with anoffsetting adjustment to accumulated other comprehensive income; such recognition did not affect theCompany’s consolidated statements of income. The adoption of SFAS No. 158 was effective for the yearended December 31, 2006, and the effect was included in the Company’s consolidated balance sheet.
15
The Company’s underfunded amount for its qualified defined-benefit pension plans, the differencebetween the projected benefit obligation and plan assets, decreased to $186 million at December 31, 2006from $231 million at December 31, 2005, primarily due to asset returns above projections; in accordancewith SFAS No. 158, the 2006 unfunded amount has been recognized on the Company’s consolidatedbalance sheet at December 31, 2006. Qualified domestic pension plan assets in 2006 had a net return ofapproximately 11 percent equal to average returns of 11 percent for the largest 1,000 Plan Benchmark.
The Company’s projected benefit obligation for its unfunded non-qualified defined-benefit pensionplans was $144 million at December 31, 2006 compared with $143 million at December 31, 2005; inaccordance with SFAS No. 158, the 2006 unfunded amount has been recognized on the Company’sconsolidated balance sheet at December 31, 2006.
The Company expects pension expense for its qualified defined-benefit pension plans to decrease by$9 million in 2007 compared with 2006. If the Company assumed that the future return on plan assets wasone-half percent lower than the assumed asset return, the 2007 pension expense would only decrease by$6 million. The Company expects pension expense for its non-qualified defined-benefit pension plans todecrease by $1 million in 2007 compared with 2006.
Stock-Based Compensation
The Company’s 2005 Long Term Stock Incentive Plan (the “2005 Plan”) replaced the 1991 Long TermStock Incentive Plan (the “1991 Plan”) in May 2005 and provides for the issuance of stock-basedincentives in various forms. At December 31, 2006, outstanding stock-based incentives were in theform of restricted long-term stock awards, stock options, phantom stock awards and stock appreciationrights. Additionally, the Company’s 1997 Non-Employee Directors Stock Plan (the “1997 Plan”) providesfor the payment of part of the compensation to non-employee Directors in Company common stock.
The Company elected to begin recording expense for stock options granted or modified subsequentto January 1, 2003. Effective January 1, 2006, the Company adopted SFAS No. 123R, “Share-BasedPayment,” (“SFAS No. 123R”) using the Modified Prospective Application (“MPA”) method. The MPAmethod requires the Company to recognize expense for unvested stock options that were awarded priorto January 1, 2003 through the remaining vesting periods. The MPA method does not require therestatement of prior-year information. In accordance with SFAS No. 123R, the Company utilized theshortcut method to determine the tax windfall pool associated with stock options at December 31, 2006.
For 2006, the Company recognized additional pre-tax expense of $15 million ($9 million or $.02 percommon share, after tax), related to the adoption of SFAS No. 123R. In addition, during 2006, theCompany recognized expense of $3 million (net of income tax benefit of $2 million) as a cumulative effectof accounting change, net, related to the adoption of SFAS No. 123R and the change from the intrinsicvalue method to the fair value method of accounting for stock appreciation rights.
Restricted Long-Term Stock Awards
Long-term stock awards are granted to key employees and non-employee Directors of the Companyand do not cause net share dilution inasmuch as the Company continues the practice of repurchasing andretiring an equal number of shares on the open market. There was $195 million (9 million commonshares) of total unrecognized compensation expense related to unvested stock awards at December 31,2006, which was included as a reduction of common stock and retained earnings. Effective January 1,2006, such expense is being recognized ratably over the shorter of the vesting period of the stock awards,typically 10 years (except for stock awards held by grantees age 66 or older, which vest over five years), orthe length of time until the grantee becomes retirement-eligible at age 65. For stock awards granted priorto January 1, 2006, such expense is being recognized over the vesting period of the stock awards, typically10 years, or for executive grantees that are, or will become, retirement-eligible during the vesting period,the expense is being recognized over five years, or immediately upon a grantee’s retirement. Pre-taxcompensation expense for the annual vesting of long-term stock awards was $52 million for 2006.
16
Stock Options
Stock options are granted to key employees and non-employee Directors of the Company. Theexercise price equals the market price of the Company’s common stock at the grant date. These optionsgenerally become exercisable (vest ratably) over five years beginning on the first anniversary from thedate of grant and expire no later than 10 years after the grant date. The 2005 Plan does not permit thegranting of restoration stock options, except for restoration options resulting from options granted underthe 1991 Plan. Restoration stock options become exercisable six months from the date of grant.
The Company measures compensation expense for stock options using a Black-Scholes optionpricing model. For stock options granted subsequent to January 1, 2006, such expense is being recognizedratably over the shorter of the vesting period of the stock options, typically five years, or the length oftime until the grantee becomes retirement-eligible at age 65. The expense for unvested stock options atJanuary 1, 2006 is based upon the grant date fair value of those options as calculated using a Black-Scholes option pricing model for pro forma disclosures under SFAS No. 123. For stock options grantedprior to January 1, 2006, such expense is being recognized ratably over the vesting period of the stockoptions, typically five years, or immediately upon a grantee’s retirement.
The fair value of stock options was estimated at the grant date using a Black-Scholes option pricingmodel with the following assumptions for 2006: risk-free interest rate – 4.89%, dividend yield – 3.1%,volatility factor – 34.0% and expected option life – 7 years. For SFAS No. 123R calculation purposes, theweighted average grant date fair value of option shares, including restoration options, granted in 2006was $8.24 per option share.
If the Company increased its assumptions for the risk-free interest rate and the volatility factor by50 percent, the expense related to the fair value of stock options granted in 2006 would increase47 percent. If the Company decreased its assumptions for the risk-free interest rate and the volatilityfactor by 50 percent, the expense related to the fair value of stock options granted in 2006 would decrease59 percent.
Income Taxes
The Company has considered potential sources of future foreign taxable income in assessing theneed for establishing a valuation allowance against its deferred tax assets related to its after-tax foreigntax credit carryforward of $61 million at December 31, 2006. Should the Company determine that itwould not be able to realize all or part of its deferred tax assets in the future, a valuation allowance wouldbe recorded in the period such determination is made.
Other Commitments and Contingencies
Certain of the Company’s products and product finishes and services are covered by a warranty to befree from defects in material and workmanship for periods ranging from one year to the life of the product.At the time of sale, the Company accrues a warranty liability for estimated costs to provide products, partsor services to repair or replace products in satisfaction of warranty obligations. The Company’s estimate ofcosts to service its warranty obligations is based upon historical experience and expectations of futureconditions. To the extent that the Company experiences any changes in warranty claim activity or costsassociated with servicing those claims, its warranty liability is adjusted accordingly.
A significant portion of the Company’s business is at the consumer retail level through home centersand major retailers. A consumer may return a product to a retail outlet that is a warranty return.However, certain retail outlets do not distinguish between warranty and other types of returns when theyclaim a return deduction from the Company. The Company’s revenue recognition policy takes intoaccount this type of return when recognizing revenue, and deductions are recorded at the time of sale.
The Company is subject to lawsuits and pending or asserted claims (including income taxes) withrespect to matters generally arising in the ordinary course of business. Liabilities and costs associated withthese matters require estimates and judgments based upon the professional knowledge and experience of
17

management and its legal counsel. When estimates of the Company’s exposure for lawsuits and pending orasserted claims meet the criteria for recognition under SFAS No. 5, “Accounting for Contingencies,”amounts are recorded as charges to earnings. The ultimate resolution of any such exposure to the Companymay differ due to subsequent developments. See Note T to the Company’s consolidated financial state-ments for information regarding certain legal proceedings involving the Company.
Corporate Development Strategy
In past years, acquisitions have enabled the Company to build strong positions in the markets itserves and have increased the Company’s importance to its customers. The Company’s focus includesthe rationalization of its business units, including consolidations, as well as pursuing synergies amongthe Company’s business units. The Company expects to maintain a more balanced growth strategy withemphasis on organic growth, share repurchases and fewer acquisitions with increased emphasis on cashflow and return on invested capital. As part of its strategic planning, the Company continues to review allof its businesses to determine which businesses may not be core to the Company’s long-term growthstrategy.
In 2004, the Company determined that several European business units were not core to theCompany’s long-term growth strategy and, accordingly, embarked on a plan of disposition (the“2004 Plan”). During 2004, in separate transactions, the Company completed the sale of its Jung Pumpen,The Alvic Group, Alma Kuchen, E. Missel and SKS Group business units in Europe. During 2005, inseparate transactions, the Company completed the sale of its Gebhardt Consolidated, GMU Group andAran Group business units in Europe, as well as its Zenith Products business unit in North America.
In 2006, the Company completed the sale of Computerized Security Systems (“CSS”). This dispo-sition was completed pursuant to the Company’s determination that this business unit was not core tothe Company’s long-term growth strategy. CSS supplies electronic locksets primarily to hospitalitymarkets in the United States and Europe and was included in the Other Specialty Products segment. As aresult of the sale, the Company reclassified the net sales and results of operations related to CSS todiscontinued operations. Total gross proceeds from the sale were $92 million; the Company recognized apre-tax net gain (included in discontinued operations) on the disposition of CSS of $51 million.
The sales, results of operations and the gains from the 2006, 2005 and 2004 discontinued operationsare included in income (loss) from discontinued operations, net, in the consolidated statements ofincome.
In accordance with SFAS No. 144, “Accounting for the Impairment or Disposal of Long-LivedAssets,” the Company accounted for the business units which were sold in 2006, 2005 and 2004, except asnoted below, as discontinued operations. There were no businesses held for sale at December 31, 2006.
During 2006, the Company completed the sale of Gamco Products, General Accessory, CambridgeBrass and Faucet Queens, relatively small businesses, the results of which are included in continuingoperations through the date of sale. These businesses had combined net sales and operating profit of$16 million and $5 million, respectively, in 2006 through the respective dates of sale and combined netsales and operating profit of $55 million and $12 million, respectively, in 2005. Gross proceeds from thesale of these businesses were $72 million; the Company recognized a net gain of $1 million in 2006included in other, net, in continuing operations.
Liquidity and Capital Resources
Historically, the Company has largely funded its growth through cash provided by a combination ofits operations, long-term bank debt and the issuance of notes in the financial markets, and by the issuanceof Company common stock, including issuances for certain mergers and acquisitions.
Bank credit lines are maintained to ensure the availability of funds. At December 31, 2006, theCompany had a $2.0 billion 5-Year Revolving Credit Agreement with a group of banks syndicated in the
18
United States and internationally, which expires in February 2011. This agreement allows for borrowingsdenominated in U.S. dollars or European euros with interest payable based upon various floating-rateoptions as selected by the Company.
The 5-Year Revolving Credit Agreement, as amended, contains limitations on additional borrow-ings; at December 31, 2006, the Company had additional borrowing capacity, subject to availability, of upto $1.7 billion. The 5-Year Revolving Credit Agreement, as amended, also contains a requirement formaintaining a certain level of net worth; at December 31, 2006, the Company’s net worth exceeded suchrequirement by $1.1 billion.
At December 31, 2006, the amount of debt and equity securities issuable under the Company’sunallocated shelf registration statement with the Securities and Exchange Commission was $500 million.
The Company had cash and cash investments of $1,958 million at December 31, 2006 as a result ofstrong cash flows from operations, proceeds from the disposition of certain businesses and financialinvestments, and the issuance of fixed-rate debt.
The Company has maintained investments in marketable securities and a number of private equityfunds, principally as part of its tax planning strategies, as any gains enhance the utilization of tax capitallosses, including significant capital losses resulting from the exit of certain businesses over the pastseveral years. The Company determined that the longer maturity of private equity funds would beadvantageous to the Company and complement the Company’s investment in more liquid, publiclytraded marketable securities to balance risk. Since the Company has significantly reduced tax capitallosses in part by generating capital gains from investments and other sources, the Company has and willcontinue to reduce its investments in financial assets.
In 2006, the Company increased its quarterly common stock dividend 10 percent to $.22 per commonshare. This marks the 48th consecutive year in which dividends have been increased.
Maintaining high levels of liquidity and cash flow are among the Company’s financial strategies.The Company’s total debt as a percent of total capitalization increased to 53 percent at December 31, 2006from 49 percent at December 31, 2005. On October 3, 2006, the Company issued $1 billion of fixed-rate6.125% notes due 2016 in anticipation of the 2007 debt maturities, including the put option related to theZero Coupon Convertible Senior Notes. Repurchases and retirement of Company common stock alsocontributed to the increase in the total debt to total capitalization ratio. The Company’s working capitalratio was 1.5 to 1 and 1.8 to 1 at December 31, 2006 and 2005, respectively. The decline in the workingcapital ratio is primarily due to the reclassification to current liabilities of $823 million of Zero CouponConvertible Senior Notes, as a result of the put option date of January 20, 2007, $300 million of floating-rate notes due March 2007 and $300 million of 4.625% notes due August 2007.
On January 20, 2007, holders of $1.8 billion (94 percent) principal amount at maturity of the ZeroCoupon Convertible Senior Notes (“Notes”) required the Company to repurchase their Notes at a cashvalue of $825 million. As a result of this repurchase, a $93 million deferred income tax liability will bepayable in June 2007. Subsequent to the repurchase, there were outstanding $108 million principalamount at maturity of such Notes with an accreted value of $51 million, which has been included in long-term debt at December 31, 2006, as the next put option date is July 20, 2011. The Company may, at anytime on or after January 25, 2007, redeem all or part of the Notes at their accreted value.
The derivatives used by the Company during 2006 consist of interest rate swaps entered into in 2004,for the purpose of effectively converting a portion of fixed-rate debt to variable-rate debt. Generally,under interest rate swap agreements, the Company agrees with a counterparty to exchange the differencebetween fixed-rate and variable-rate interest amounts calculated by reference to an agreed notionalprincipal amount. The derivative contracts are with two major creditworthy institutions, therebyminimizing the risk of credit loss. The interest rate swap agreements are designated as fair-valuehedges, and the interest rate differential on interest rate swaps used to hedge existing debt is recognizedas an adjustment to interest expense over the term of the agreement. For fair-value hedge transactions,
19

changes in the fair value of the derivative and changes in the fair value of the item hedged are recognizedin determining earnings.
The average variable interest rates are based upon the London Interbank Offered Rate (“LIBOR”)plus fixed adjustment factors. The average effective rate for 2006 on the interest rate swaps was 6.787%.At December 31, 2006, the interest rate swap agreements covered a notional amount of $850 million of theCompany’s fixed-rate debt due July 15, 2012 at an interest rate of 5.875%. The hedges are considered100 percent effective because all of the critical terms of the derivative financial instruments match thoseof the hedged item. Accordingly, no gain or loss on the value of the hedges was recognized in theCompany’s consolidated statements of income for the years ended December 31, 2006 and 2005. In 2006,the Company recognized an increase in interest expense of $8 million related to this swap agreement, dueto increasing interest rates.
Certain of the Company’s European operations also entered into foreign currency forward contractsfor the purpose of managing exposure to currency fluctuations, primarily related to the European euroand the Great Britain pound.
Cash Flows
Significant sources and (uses) of cash in the past three years are summarized as follows, in millions:2006 2005 2004
Net cash from operating activities . . . . . . . . . . . . . . . . . . . . . . . . $1,208 $1,374 $1,454Increase (decrease) in debt, net . . . . . . . . . . . . . . . . . . . . . . . . . . 151 407 (13)Proceeds from disposition of:
Businesses, net of cash disposed . . . . . . . . . . . . . . . . . . . . . . . 160 278 172Property and equipment . . . . . . . . . . . . . . . . . . . . . . . . . . . . . . 16 37 37
Proceeds from financial investments, net . . . . . . . . . . . . . . . . . . 71 193 330Issuance of Company common stock . . . . . . . . . . . . . . . . . . . . . 28 33 58Tax benefit from exercise of stock options. . . . . . . . . . . . . . . . . . 18 – –Acquisition of businesses, net of cash acquired . . . . . . . . . . . . . (28) (25) (16)Capital expenditures. . . . . . . . . . . . . . . . . . . . . . . . . . . . . . . . . . . (388) (282) (310)Cash dividends paid . . . . . . . . . . . . . . . . . . . . . . . . . . . . . . . . . . (349) (339) (302)Purchase of Company common stock . . . . . . . . . . . . . . . . . . . . . (854) (986) (943)Effect of exchange rates . . . . . . . . . . . . . . . . . . . . . . . . . . . . . . . . 18 (5) 29Proceeds from settlement of swaps . . . . . . . . . . . . . . . . . . . . . . . – – 55Other, net . . . . . . . . . . . . . . . . . . . . . . . . . . . . . . . . . . . . . . . . . . . (57) (15) (52)
Cash (decrease) increase . . . . . . . . . . . . . . . . . . . . . . . . . . $ (6) $ 670 $ 499
The Company’s cash and cash investments decreased $6 million to $1,958 million at December 31,2006, from $1,964 million at December 31, 2005.
Net cash provided by operations of $1.2 billion consisted primarily of net income adjusted for non-cash and certain other items, including depreciation and amortization expense of $244 million, net gainon disposition of businesses of $51 million, net gain on disposition of financial investments of $31 million,a $331 million charge for the impairment of goodwill, a $101 million charge for the impairment offinancial investments and other non-cash items, including stock-based compensation expense, amor-tization expense related to in-store displays and interest expense on the Zero Coupon Convertible SeniorNotes, as well as a net increase in working capital of $57 million.
The Company continues to emphasize balance sheet management, including working capitalmanagement and cash flow generation. Days sales in accounts receivable were 50 days at December 31,2006 compared with 48 days at December 31, 2005, and days sales in inventories were 49 days at
20
December 31, 2006 compared with 46 days at December 31, 2005. Accounts payable days improved to39 days from 36 days at December 31, 2006 and 2005, respectively. Working capital (defined as accountsreceivable and inventories less accounts payable) as a percent of sales was 16.1 percent and 15.9 percentat December 31, 2006 and 2005, respectively.
Net cash used for financing activities was $1.0 billion, and included cash outflows of $349 million forcash dividends paid, $827 million for the retirement of notes and $854 million for the acquisition andretirement of 29 million shares of Company common stock in open-market transactions. Cash providedby financing activities primarily included $988 million from the issuance of notes (net of issuance costs)and $28 million from the issuance of Company common stock, primarily from the exercise of stockoptions.
At December 31, 2006, the Company had remaining Board of Directors’ authorization to repurchaseup to an additional 36 million shares of its common stock in open-market transactions or otherwise. InJanuary 2007, the Company repurchased an additional one million shares of Company common stockand expects to continue its share repurchase program throughout 2007.
Net cash used for investing activities was $226 million, and included $388 million for capitalexpenditures and $28 million for acquisitions. Cash provided by investing activities included $160 mil-lion of net proceeds from the disposition of businesses and $71 million from the net sale of financialinvestments.
The Company continues to invest in automating its manufacturing operations and increasing itscapacity and its productivity to more efficiently produce and to improve customer service. Capitalexpenditures for 2006 were $388 million, compared with $282 million for 2005 and $310 million for 2004;for 2007, capital expenditures, excluding any potential 2007 acquisitions, are expected to approximate$300 million. Depreciation and amortization expense for 2006 totaled $244 million, compared with$241 million for 2005 and $237 million for 2004; for 2007, depreciation and amortization expense,excluding any potential 2007 acquisitions, is expected to approximate $255 million. Amortizationexpense totaled $14 million, $28 million and $26 million in 2006, 2005 and 2004, respectively.
Costs of environmental responsibilities and compliance with existing environmental laws andregulations have not had, nor in the opinion of the Company are they expected to have, a material effecton the Company’s capital expenditures, financial position or results of operations.
The Company believes that its present cash balance and cash flows from operations are sufficient tofund its near-term working capital and other investment needs. The Company believes that its longer-term working capital and other general corporate requirements will be satisfied through cash flows fromoperations and, to the extent necessary, from bank borrowings, future financial market activities andproceeds from asset sales.
Consolidated Results of Operations
The Company reports its financial results in accordance with generally accepted accounting prin-ciples (“GAAP”) in the United States. However, the Company believes that certain non-GAAP perfor-mance measures and ratios used in managing the business may provide users of this financialinformation with additional meaningful comparisons between current results and results in priorperiods. Non-GAAP performance measures and ratios should be viewed in addition to, and not asan alternative for, the Company’s reported results.
Sales and Operations
Net sales for 2006 were $12.8 billion, representing an increase of two percent over 2005. Excludingresults from acquisitions and the effect of currency translation, net sales increased one percent compared
21
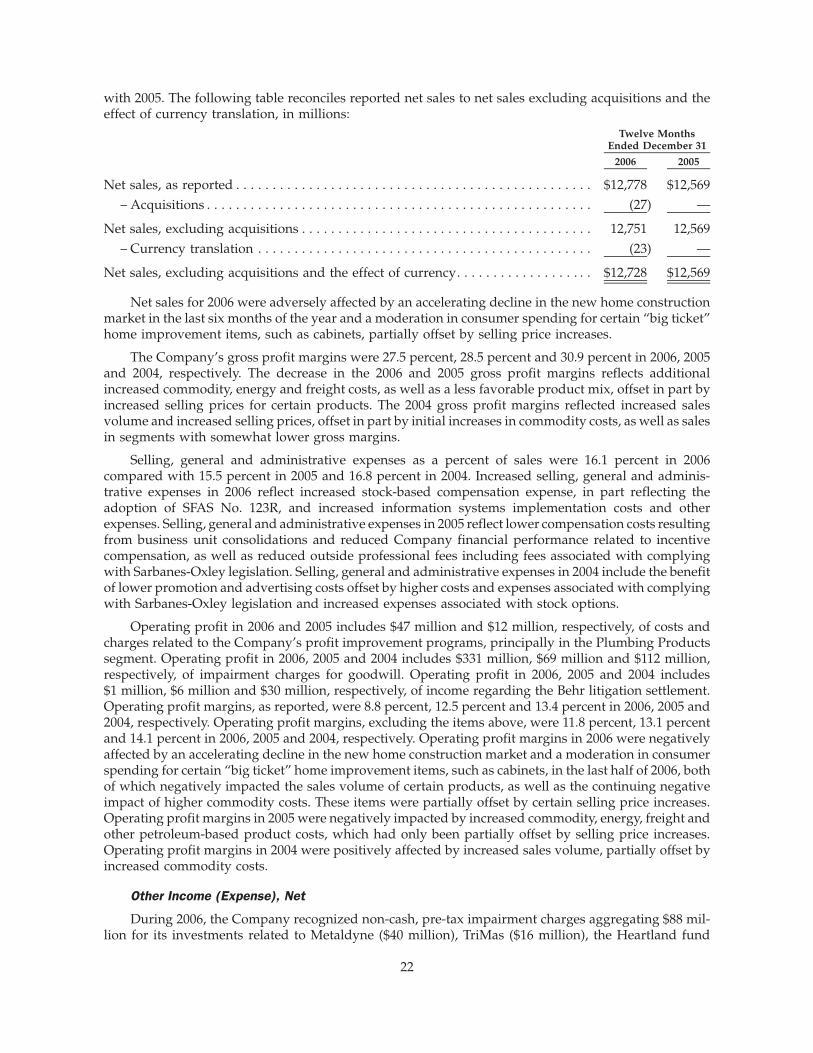
with 2005. The following table reconciles reported net sales to net sales excluding acquisitions and theeffect of currency translation, in millions:
2006 2005
Twelve MonthsEnded December 31
Net sales, as reported . . . . . . . . . . . . . . . . . . . . . . . . . . . . . . . . . . . . . . . . . . . . . . . . . $12,778 $12,569– Acquisitions . . . . . . . . . . . . . . . . . . . . . . . . . . . . . . . . . . . . . . . . . . . . . . . . . . . . . (27) —
Net sales, excluding acquisitions . . . . . . . . . . . . . . . . . . . . . . . . . . . . . . . . . . . . . . . . 12,751 12,569– Currency translation . . . . . . . . . . . . . . . . . . . . . . . . . . . . . . . . . . . . . . . . . . . . . . (23) —
Net sales, excluding acquisitions and the effect of currency. . . . . . . . . . . . . . . . . . . $12,728 $12,569
Net sales for 2006 were adversely affected by an accelerating decline in the new home constructionmarket in the last six months of the year and a moderation in consumer spending for certain “big ticket”home improvement items, such as cabinets, partially offset by selling price increases.
The Company’s gross profit margins were 27.5 percent, 28.5 percent and 30.9 percent in 2006, 2005and 2004, respectively. The decrease in the 2006 and 2005 gross profit margins reflects additionalincreased commodity, energy and freight costs, as well as a less favorable product mix, offset in part byincreased selling prices for certain products. The 2004 gross profit margins reflected increased salesvolume and increased selling prices, offset in part by initial increases in commodity costs, as well as salesin segments with somewhat lower gross margins.
Selling, general and administrative expenses as a percent of sales were 16.1 percent in 2006compared with 15.5 percent in 2005 and 16.8 percent in 2004. Increased selling, general and adminis-trative expenses in 2006 reflect increased stock-based compensation expense, in part reflecting theadoption of SFAS No. 123R, and increased information systems implementation costs and otherexpenses. Selling, general and administrative expenses in 2005 reflect lower compensation costs resultingfrom business unit consolidations and reduced Company financial performance related to incentivecompensation, as well as reduced outside professional fees including fees associated with complyingwith Sarbanes-Oxley legislation. Selling, general and administrative expenses in 2004 include the benefitof lower promotion and advertising costs offset by higher costs and expenses associated with complyingwith Sarbanes-Oxley legislation and increased expenses associated with stock options.
Operating profit in 2006 and 2005 includes $47 million and $12 million, respectively, of costs andcharges related to the Company’s profit improvement programs, principally in the Plumbing Productssegment. Operating profit in 2006, 2005 and 2004 includes $331 million, $69 million and $112 million,respectively, of impairment charges for goodwill. Operating profit in 2006, 2005 and 2004 includes$1 million, $6 million and $30 million, respectively, of income regarding the Behr litigation settlement.Operating profit margins, as reported, were 8.8 percent, 12.5 percent and 13.4 percent in 2006, 2005 and2004, respectively. Operating profit margins, excluding the items above, were 11.8 percent, 13.1 percentand 14.1 percent in 2006, 2005 and 2004, respectively. Operating profit margins in 2006 were negativelyaffected by an accelerating decline in the new home construction market and a moderation in consumerspending for certain “big ticket” home improvement items, such as cabinets, in the last half of 2006, bothof which negatively impacted the sales volume of certain products, as well as the continuing negativeimpact of higher commodity costs. These items were partially offset by certain selling price increases.Operating profit margins in 2005 were negatively impacted by increased commodity, energy, freight andother petroleum-based product costs, which had only been partially offset by selling price increases.Operating profit margins in 2004 were positively affected by increased sales volume, partially offset byincreased commodity costs.
Other Income (Expense), Net
During 2006, the Company recognized non-cash, pre-tax impairment charges aggregating $88 mil-lion for its investments related to Metaldyne ($40 million), TriMas ($16 million), the Heartland fund
22

($29 million) and another fund ($3 million) which invested in automotive and transportation-relatedsuppliers, including Metaldyne and TriMas. Additionally, during 2006, based upon the Company’sreview, the Company considered the decline in the fair value of certain of its other private equity fundinvestments and other investments to be other-than-temporary and, accordingly, recognized impairmentcharges of $13 million.
Other, net, for 2006 included $4 million of realized gains, net, from the sale of marketable securities,$10 million of dividend income and $27 million of income from other investments, net. Other, net, for2006 also included currency transaction gains of $14 million and other miscellaneous items.
During 2005, the Company recognized an impairment charge of $30 million primarily related to itsinvestment in Furniture Brands International common stock. Also during 2005, based upon theCompany’s review of its private equity funds, the Company considered the decline in the fair valueof certain of its private equity fund investments to be other-than-temporary and, accordingly, recognizedan impairment charge of $15 million.
Other, net, for 2005 included $30 million of realized gains, net, from the sale of marketable securities,$16 million of dividend income and $68 million of income from other investments, net. Other, net, for2005 also included currency transaction losses of $25 million and other miscellaneous items.
During 2004, the Company recognized an impairment charge of $21 million related to its investmentin Furniture Brands International common stock.
Other, net, for 2004 included $50 million of realized gains, net, from the sale of marketable securities,$27 million of dividend income and $42 million of income from other investments, net. Other, net, for2004 also included currency transaction gains of $26 million and other miscellaneous items.
Interest expense was $240 million, $247 million and $217 million in 2006, 2005 and 2004, respectively.The decrease in interest expense in 2006 is primarily the result of the repayment of $800 million of6.75% notes in March 2006, partially offset by the issuance of $1 billion of 6.125% notes in October 2006, aswell as the impact of increasing interest rates. The increase in interest expense in 2005 is primarily due tothe issuance of fixed-rate notes in June 2005, as well as the impact of increasing interest rates.
Income and Earnings Per Common Share from Continuing Operations
Income and diluted earnings per common share from continuing operations for 2006 were $461 millionand $1.15 per common share, respectively. Income from continuing operations for 2006 included non-cash,pre-tax impairment charges for goodwill of $331 million ($331 million or $.83 per common share, after tax).Income and diluted earnings per common share from continuing operations for 2005 were $866 million and$2.01 per common share, respectively. Income from continuing operations for 2005 included non-cash,pre-tax impairment charges for goodwill of $69 million ($69 million or $.16 per common share, after tax)and income regarding the litigation settlement of $6 million pre-tax ($4 million or $.01 per common share,after tax). Income and diluted earnings per common share from continuing operations for 2004 were$944 million and $2.07 per common share, respectively. Income from continuing operations for 2004included non-cash, pre-tax impairment charges for goodwill of $112 million ($104 million or $.23 percommon share, after tax) and income regarding the litigation settlement of $30 million pre-tax ($19 millionor $.04 per common share, after tax).
The Company’s effective tax rate for income from continuing operations was 46 percent in 2006 and37 percent in both 2005 and 2004. The increased effective tax rate in 2006 is primarily due to an increase inimpairment charges for goodwill not being deductible for tax purposes. The Company estimates that itseffective tax rate should approximate 35 to 36 percent for 2007.
23

Outlook for the Company
The Company’s 2006 results were adversely affected by an accelerating decline in the new homeconstruction market and a moderation in consumer spending for certain “big ticket” home improvementitems, such as cabinets, and the continuing negative impact of higher commodity costs, partially offset byprofit improvement programs and selling price increases.
New home construction has declined dramatically in the last 12 months due to previous excessivespeculative buying, rapidly rising home prices in recent years reducing the affordability and lessattractive mortgage terms. Housing starts declined by 13 percent in 2006 compared with 2005 toapproximately 1.8 million units. Late in 2006, housing starts declined even further to an annual runrate of approximately 1.5 million to 1.6 million units, which is more than 20 percent below the 2005 levels.Even with the recent decline in single-family housing starts, the inventory of unsold new homes hasincreased to unprecedented levels.
The Company is proactively managing its business for the current difficult economic times in ourmarkets by pursuing a variety of initiatives to further reduce costs and improve operating profits.Initiatives already started include headcount reductions, sourcing programs, restructuring of certainbusinesses including consolidations, manufacturing rationalization and other profit improvement pro-grams. While the Company’s earnings outlook for 2007 incudes costs related to these initiatives, as wellas start-up costs related to plant capacity additions, system implementation costs, higher interestexpense and as yet unrecovered commodity cost increases, the Company believes that implementingthese initiatives should improve the Company’s earnings outlook for 2008 and beyond.
The Company remains committed to its long-term growth strategy, concentrating on organic salesgrowth, improving return on invested capital and generating significant returns to shareholders. Wecontinue to drive our growth initiatives, including leveraging installation services, developing newchannels of distribution, pursuing new markets in emerging economies and emphasizing new productdevelopment.
24

Business Segment and Geographic Area Results
The following table sets forth the Company’s net sales and operating profit information by businesssegment and geographic area, dollars in millions.
2006 2005 2004
2006vs.
2005
2005vs.
2004
Percent Change
Net Sales:Cabinets and Related Products . . . . . . . . . . . . . . . . $ 3,286 $ 3,324 $ 3,065 (1)% 8%Plumbing Products . . . . . . . . . . . . . . . . . . . . . . . . . 3,296 3,176 3,057 4% 4%Installation and Other Services . . . . . . . . . . . . . . . . 3,158 3,063 2,771 3% 11%Decorative Architectural Products . . . . . . . . . . . . . . 1,777 1,681 1,610 6% 4%Other Specialty Products . . . . . . . . . . . . . . . . . . . . . 1,261 1,325 1,280 (5)% 4%
Total . . . . . . . . . . . . . . . . . . . . . . . . . . . . . . . . $12,778 $12,569 $11,783 2% 7%
North America . . . . . . . . . . . . . . . . . . . . . . . . . . . . $10,537 $10,440 $ 9,673 1% 8%International, principally Europe . . . . . . . . . . . . . . . 2,241 2,129 2,110 5% 1%
Total . . . . . . . . . . . . . . . . . . . . . . . . . . . . . . . . $12,778 $12,569 $11,783 2% 7%
2006 2006 (B) 2005 2005 (B) 2004 2004 (B)
Operating Profit: (A)Cabinets and Related Products . . . . . . . . . . . . . . . . $ 122 $ 438 $ 515 $ 515 $ 519 $ 519Plumbing Products . . . . . . . . . . . . . . . . . . . . . . . . . 280 281 367 374 370 395Installation and Other Services . . . . . . . . . . . . . . . . 344 344 382 382 358 358Decorative Architectural Products . . . . . . . . . . . . . . 357 371 252 278 269 331Other Specialty Products . . . . . . . . . . . . . . . . . . . . . 225 225 229 265 225 250
Total . . . . . . . . . . . . . . . . . . . . . . . . . . . . . . . . $1,328 $ 1,659 $ 1,745 $ 1,814 $1,741 $1,853
North America . . . . . . . . . . . . . . . . . . . . . . . . . . . . $1,417 $ 1,428 $ 1,567 $ 1,567 $1,608 $1,608International, principally Europe . . . . . . . . . . . . . . . (89) 231 178 247 133 245
Total . . . . . . . . . . . . . . . . . . . . . . . . . . . . . . . . 1,328 1,659 1,745 1,814 1,741 1,853General corporate expense, net . . . . . . . . . . . . . . . . (203) (203) (192) (192) (194) (194)Gains on sale of corporate fixed assets, net . . . . . . . — — 8 8 7 7Income regarding litigation settlement . . . . . . . . . . . 1 1 6 6 30 30
Total operating profit . . . . . . . . . . . . . . . . . . . . . . . . . . $1,126 $ 1,457 $ 1,567 $ 1,636 $1,584 $1,696
2006 2006 (B) 2005 2005 (B) 2004 2004 (B)
Operating Profit Margin: (A)Cabinets and Related Products . . . . . . . . . . . . . . . . 3.7% 13.3% 15.5% 15.5% 16.9% 16.9%Plumbing Products . . . . . . . . . . . . . . . . . . . . . . . . . 8.5% 8.5% 11.6% 11.8% 12.1% 12.9%Installation and Other Services . . . . . . . . . . . . . . . . 10.9% 10.9% 12.5% 12.5% 12.9% 12.9%Decorative Architectural Products . . . . . . . . . . . . . . 20.1% 20.9% 15.0% 16.5% 16.7% 20.6%Other Specialty Products . . . . . . . . . . . . . . . . . . . . . 17.8% 17.8% 17.3% 20.0% 17.6% 19.5%
North America . . . . . . . . . . . . . . . . . . . . . . . . . . . . 13.4% 13.6% 15.0% 15.0% 16.6% 16.6%International, principally Europe . . . . . . . . . . . . . . . (4.0)% 10.3% 8.4% 11.6% 6.3% 11.6%Total . . . . . . . . . . . . . . . . . . . . . . . . . . . . . . . . . . . 10.4% 13.0% 13.9% 14.4% 14.8% 15.7%
Total operating profit margin, as reported . . . . . . . . . . . 8.8% N/A 12.5% N/A 13.4% N/A
(A) Before: general corporate expense, net, gains on sale of corporate fixed assets, net, and income regarding the Behr litigationsettlement (related to the Decorative Architectural Products segment).
(B) Excluding impairment charges for goodwill. The 2006 impairment charges for goodwill were as follows: Cabinets and RelatedProducts – $316 million; Plumbing Products – $1 million; and Decorative Architectural Products – $14 million. The 2005impairment charges for goodwill were as follows: Plumbing Products – $7 million; Decorative Architectural Products –$26 million; and Other Specialty Products – $36 million. The 2004 impairment charges for goodwill were as follows: PlumbingProducts – $25 million; Decorative Architectural Products – $62 million; and Other Specialty Products – $25 million. Thesecharges principally related to certain of the Company’s European business units.
25
Business Segment Results Discussion
Changes in operating profit margins in the following Business Segment and Geographic AreaResults discussion exclude general corporate expense, net, gains on sale of corporate fixed assets, net,income regarding the litigation settlement, and impairment charges for goodwill in 2006, 2005 and 2004.
Profit Improvement Programs
As part of its profit improvement programs, the Company has been focused on the rationalization ofits Plumbing Products segment. As a result, in 2005, the Company incurred approximately $12 millionpre-tax of charges related to headcount reductions and the discontinuance of a product line. In addition,the Company announced a plant closure in the Plumbing Products segment in January 2006. During2006, the Company incurred $39 million pre-tax of costs and charges (primarily accelerated depreciationand severance expense) related to this plant closure and other profit improvement programs in thePlumbing Products segment.
The Company originally estimated that costs and charges for profit improvement programs relatedto its Plumbing Products segment would approximate $70 million pre-tax compared with the actualcharges of $39 million pre-tax. The reduced amount reflects the fourth quarter sale of a manufacturingfacility in the Plumbing Products segment which was originally planned for closure.
In addition, in 2006, the Company incurred $8 million pre-tax of costs and charges (including thewrite-down of inventories and accelerated depreciation) related to the closure of a relatively smallready-to-assemble cabinet manufacturing facility in the Cabinets and Related Products segment.
Cabinets and Related Products
Net sales of Cabinets and Related Products decreased in 2006 primarily due to lower sales ofready-to-assemble cabinets in North American and Europe, which more than offset certain selling priceincreases and sales volume increases of assembled cabinets in North America in the first half of 2006. Aweaker U.S. dollar in 2006 also had a positive effect on the translation of local currencies of Europeanoperations included in this segment. The 2005 sales increases in this segment were primarily attributableto increased sales volume in the new construction market, as well as certain selling price increases.
The operating profit margins in this segment include the negative effect of $8 million of costs andcharges related to the closure of a relatively small ready-to-assemble cabinet manufacturing facility in2006. Excluding such charges, the operating profit margin was 13.6 percent in 2006. Operating profitmargins in this segment were negatively affected by a decline in sales volume in the last half of 2006, aswell as increased commodity, freight and plant start-up costs, offset in part by selling price increases.Operating profit margins in this segment were also negatively affected by lower European operatingresults, particularly due to lower sales volume of ready-to-assemble cabinets and increased commoditycosts. Operating profit margins in 2005 reflect increased commodity and freight costs and manufacturingand distribution inefficiencies in North America, as well as a shift to a less favorable product mix, whichoffset the positive impact of higher unit sales volume. Operating profit margins in 2004 reflect thepositive impact of higher unit sales volume, as well as certain profit improvement initiatives.
Plumbing Products
Net sales of Plumbing Products increased in 2006 primarily due to increased sales volume of certainEuropean operations, as well as increased sales volume through the Company’s North Americanwholesale distribution channel. These results were offset in part by declining sales volume to certainretail customers. A weaker U.S. dollar in 2006 also had a positive effect on the translation of localcurrencies of European operations included in this segment. Net sales of Plumbing Products increased in2005 principally due to increased sales through the Company’s wholesale distribution channel and theincreased sales of certain European operations included in this segment.
26

The operating profit margins in this segment were adversely affected by costs and charges aggre-gating $39 million and $12 million in 2006 and 2005, respectively, related to certain profit improvementinitiatives; excluding such charges, operating profit margins in this segment would have been 9.7 percentand 12.2 percent in 2006 and 2005, respectively. Operating profit margins in this segment in 2006 werenegatively affected by increased commodity costs, as well as a less favorable product mix and decliningsales volume to certain retail customers. The operating profit margins in 2005 were adversely affected byincreased commodity costs, which were not offset by selling price increases and a less favorable productmix, which more than offset increased sales volume in the wholesale distribution channel. The operatingprofit margins in 2004 reflect an increase in European sales, as well as increased material costs and anincrease in sales volume.
The Company’s Plumbing Products segment continues to be negatively impacted by importcompetition, as well as a product mix shift towards lower-margin faucets within the North Americanretail channels. As part of the Company’s strategic review of its businesses, the Company determinedthat in order to remain competitive, it is necessary to increase off-shore sourcing at lower costs, whileconsolidating and reducing manufacturing operations in North America. Consistent with this deter-mination, in January 2006, the Company announced a North American plant closure in this segment;costs associated with this plant closure are included in the profit improvement costs above.
Installation and Other Services
Net sales of Installation and Other Services increased in 2006 primarily due to increased salesvolume of non-insulation products and selling price increases in the first half of 2006. However, thecontinued slowdown in the new home construction market significantly reduced sales in the second halfof 2006 compared with 2005, particularly in the fourth quarter. Net sales in this segment increased in 2005primarily due to increased selling prices, as well as increased sales volume of non-insulation productsand continued strength in the new home construction market.
The 2006 operating profit margin decline in this segment was primarily attributable to increasedsales volume of generally lower-margin, non-insulation products, as well as increased operating costs tosupport the segment’s continued growth in non-insulation products, new product development andtechnology initiatives. The slight decline in operating profit margins in 2005 was primarily attributable tocontinued increases in sales of generally lower-margin, non-insulation products, as well as the time lag inimplementing selling price increases related to material cost increases, partially offset by the favorableimpact of higher sales volume. The decline in operating profit margins in 2004 reflect an increase in salesof non-insulation products.
While the Company experienced constrained availability of fiberglass insulation through the firsthalf of 2006 due to planned availability programs implemented by its vendors, the continued slowdownin new residential construction has now resulted in fiberglass insulation becoming readily available tothe Company. At the current time, the Company believes that it will be able to source adequate quantitiesof insulation materials to meet its needs during 2007.
Decorative Architectural Products
Net sales of Decorative Architectural Products increased in 2006 primarily due to selling priceincreases of paints and stains. Net sales in this segment increased in 2005 primarily due to increased salesvolume for paints and stains.
The operating profit margins in this segment improved in 2006 due to increased selling prices ofpaints and stains, which partially offset commodity cost increases experienced in late 2004 and during2005. The operating profit margins in this segment in 2005 were negatively impacted by increasedmaterial and freight costs, which were not completely offset by increased selling prices related to paintsand stains. The operating profit margins in 2004 include the effect of increased sales volume of paints andstains and increased sales volume and improved operating performance of the Company’s decorativehardware businesses, offset in part by increased material and promotion costs.
27
Other Specialty Products
Net sales of Other Specialty Products decreased in 2006 principally due to lower sales volume ofwindows and doors, resulting from a slowdown in the new home construction market, particularly in theWestern United States. A weaker U.S. dollar in 2006 had a positive effect on the translation of localcurrencies of European operations included in this segment. Net sales of Other Specialty Productsincreased in 2005 principally due to increased sales volume and certain selling price increases of doorsand windows to the North American new home construction markets, which were partially offset byreduced sales of European operations included in this segment.
The operating profit margins in this segment declined in 2006 due to lower sales volume of windowsand doors, which offset improved European operating results. Operating profit margins in this segmentin 2005 were negatively affected by increased commodity costs and the lower results of Europeanoperations, reflecting charges related to profit improvement initiatives, offset in part by reduced state usetax expense. The operating profit margins in 2004 were primarily attributable to increased sales volumeof windows.
Geographic Area Results Discussion
North America
Net sales from North American operations increased slightly in 2006 benefiting from relativelystronger market conditions in the first half of 2006, as well as increased selling prices. An acceleratingdecline in the new home construction market and a moderation in consumer spending reduced salesvolume in the second half of 2006 particularly for assembled cabinets, windows and doors and sales ofinsulation products. Net sales from North American operations increased in 2005 primarily due tostrength in the new home construction market and increased sales volume of cabinets, installation salesof insulation and non-insulation products, and sales of vinyl and fiberglass windows and patio doors, aswell as increased selling prices for certain products.
Operating profit margins include charges related to the Company’s profit improvement programs,principally in the Plumbing Products segment, of $45 million and $12 million in 2006 and 2005,respectively. Excluding such charges, operating profit margins from North American operations were14.0 percent and 15.1 percent in 2006 and 2005, respectively. The operating profit margin decline in NorthAmerican operations is primarily due to sales volume declines in the second half of 2006 of ready-to-as-semble cabinets, windows and doors and the installation of insulation products, as well as increasedcommodity costs, partially offset by selling price increases. Operating profit margins in 2005 werenegatively impacted by continued increases in commodity, energy, freight and other petroleum-basedproduct costs, which were only partially offset by selling price increases, and increased sales volume ofcabinets, installation services and windows and patio doors to the new home construction market.Operating profit margins in 2004 were positively affected by increases in sales volume of assembledcabinets, faucets, paints and stains, vinyl and fiberglass windows and patio doors and installed sales ofinsulation and non-insulation products. Operating profit margins in 2004 were negatively impacted byincreased commodity costs, which offset lower sales promotion costs.
International, Principally Europe
Net sales from International operations increased in 2006 primarily due to increased sales ofplumbing products, which more than offset lower sales volume of ready-to-assemble cabinets. A weakerU.S. dollar had a positive effect on the translation of European results in 2006, increasing European netsales in 2006 by one percent. Net sales from International operations increased in 2005 primarily due toincreased local currency sales of exported plumbing products and ready-to-assemble cabinets, offset inpart by declining sales of windows and other plumbing products.
Operating profit margins in 2006 were negatively affected by the lower operating results forEuropean ready-to-assemble cabinets, which more than offset the positive effect of increased sales
28

volume of plumbing products and improved operating results of other European operations. Operatingprofit margins in 2005 were negatively affected by increased commodity costs and costs associated withcertain profit improvement initiatives, as well as a less favorable product mix. Operating profit marginsin 2004 were positively affected by increases in sales volume of plumbing products, ready-to-assemblecabinets and windows.
Other Matters
Commitments and Contingencies
Litigation
Information regarding legal proceedings involving the Company is set forth in Note T to theconsolidated financial statements.
Other Commitments
With respect to the Company’s investments in private equity funds, the Company had, at Decem-ber 31, 2006, commitments to contribute up to $60 million of additional capital to such funds, repre-senting the Company’s aggregate capital commitment to such funds less capital contributions made todate. The Company is contractually obligated to make additional capital contributions to its privateequity funds upon receipt of a capital call from the private equity fund. The Company has no control overwhen or if the capital calls will occur. Capital calls are funded in cash and generally result in an increasein the carrying value of the Company’s investment in the private equity fund when paid.
The Company enters into contracts, which include reasonable and customary indemnifications thatare standard for the industries in which it operates. Such indemnifications include claims made againstbuilders by homeowners for issues relating to the Company’s products and workmanship. In conjunc-tion with divestitures and other transactions, the Company occasionally provides reasonable andcustomary indemnifications relating to various items, including: the enforceability of trademarks; legaland environmental issues; provisions for sales returns; and asset valuations. The Company has never hadto pay a material amount related to these indemnifications, and evaluates the probability that amountsmay be incurred and appropriately records an estimated liability when probable.
29

Contractual Obligations
The following table provides payment obligations related to current contracts at December 31, 2006,in millions:
Less than1 Year
2-3Years
4-5Years
More than5 Years Total
Payments Due by Period
Debt (A) . . . . . . . . . . . . . . . . . . . . . . . . . . . . . . $1,447 $125 $ 54 $3,354 $4,980Interest (B) . . . . . . . . . . . . . . . . . . . . . . . . . . . . 217 403 399 1,198 2,217Operating leases . . . . . . . . . . . . . . . . . . . . . . . . 108 122 64 64 358Currently payable income taxes . . . . . . . . . . . 61 — — — 61Defined-benefit plans . . . . . . . . . . . . . . . . . . . . 29 23 27 75 154Private equity funds (C) . . . . . . . . . . . . . . . . . 20 20 20 — 60Acquisition-related commitments . . . . . . . . . . 2 4 — — 6Post-retirement obligations . . . . . . . . . . . . . . . 1 1 1 4 7Purchase commitments (D) . . . . . . . . . . . . . . . 273 25 2 — 300
Total . . . . . . . . . . . . . . . . . . . . . . . . . . . . . . . . . $2,158 $723 $567 $4,695 $8,143
(A) The Company has included $825 million related to the Zero Coupon Convertible Senior Notes(“Notes”), which was the accreted value on January 20, 2007; such Notes were redeemed on theput date according to the terms of the Notes. The remaining accreted value of $51 million isincluded in 4-5 years, as the next put option date is July 20, 2011.
(B) The Company assumed that all debt would be held to maturity, except for the Zero Couponconvertible Senior Notes.
(C) There is no schedule for the capital commitments to the private equity funds; such allocationwas estimated by the Company.
(D) Excludes contracts that do not require volume commitments and open or pending purchaseorders.
Recently Issued Accounting Pronouncements
In September 2006, the Securities and Exchange Commission released Staff Accounting Bulle-tin No. 108, “Quantifying Financial Statement Misstatements,” (“SAB 108”). Historically, the Companyevaluated financial statement misstatements using an “iron-curtain” method, which primarily focusedon the effect of correcting the period-end balance sheet with less emphasis on the reversing effects ofprior-year errors on the statement of income. SAB 108 clarified that the evaluation of financial statementmisstatements must be made based upon all relevant quantitative and qualitative factors; this is referredto as a “dual approach.” SAB 108 is effective for the year ended December 31, 2006. The adoption ofSAB 108 did not have an effect on the Company’s consolidated financial statements.
In September 2006, the FASB issued SFAS No. 157, “Fair Value Measurements,” (“SFAS No. 157”).SFAS No. 157 defines fair value, establishes a framework for measuring fair value and expandsdisclosures about fair value measurements. The adoption of SFAS No. 157 is effective January 1,2008. The Company is currently evaluating the impact that the provisions of SFAS No. 157 will haveon its consolidated financial statements.
In July 2006, the FASB issued FASB Interpretation No. 48, “Accounting for Uncertainty in IncomeTaxes – an Interpretation of FASB Statement 109,” (“FIN No. 48”). FIN No. 48 allows the recognition ofonly those income tax benefits that have a greater than 50 percent likelihood of being sustained uponexamination by the taxing authorities. FIN No. 48 also provides guidance on classification, interest and
30

penalties, accounting in interim periods, disclosure and transition. The adoption of FIN No. 48 is effectiveJanuary 1, 2007.
Historically, the Company has established reserves for tax contingencies in accordance withSFAS No. 5, “Accounting for Contingencies,” (“SFAS No. 5”). Under this standard, reserves for taxcontingencies are established when it is probable that an additional tax may be owed and the amount canbe reasonably estimated. FIN No. 48 establishes a lower threshold for recognizing reserves for income taxcontingencies on uncertain tax positions than the thresholds under SFAS No. 5. Therefore, although theCompany has not completed its evaluation of the impact of FIN No. 48 on its consolidated financialstatements, it currently estimates that its reserves for income tax contingencies net of any federal taxbenefit will increase by approximately $25 million to $45 million, as of the date of adoption. Thecumulative effect of applying FIN No. 48 will be recorded as a reduction to beginning retained earningsin 2007. The Company believes that, in future years, there will be a greater potential for volatility in itseffective tax rate because this lower threshold allows changes in the income tax environment to affect thetax reserve computation to a greater degree than SFAS No. 5.
In addition, the Company expects to reclassify the majority of its reserves for income tax contin-gencies from current to non-current liabilities in accordance with the provisions of FIN No. 48.
Item 7A. Quantitative and Qualitative Disclosures About Market Risk.
The Company has considered the provisions of Financial Reporting Release No. 48, “Disclosure ofAccounting Policies for Derivative Financial Instruments and Derivative Commodity Instruments, andDisclosure of Quantitative and Qualitative Information about Market Risk Inherent in DerivativeFinancial Instruments, Other Financial Instruments and Derivative Commodity Instruments.”
The Company is exposed to the impact of changes in interest rates and foreign currency exchangerates in the normal course of business and to market price fluctuations related to its marketable securitiesand other investments. The Company has limited involvement with derivative financial instruments anduses such instruments to the extent necessary to manage exposure to fluctuations in interest rates andforeign currency fluctuations. See Note F to the consolidated financial statements for additional infor-mation regarding the Company’s derivative instruments.
The derivatives used by the Company for the year ended December 31, 2006 consist of interest rateswap agreements entered into in 2004 for the purpose of effectively converting a portion of fixed-ratedebt to variable-rate debt. The Company, including certain European operations, also entered intoforeign currency forward contracts to manage exposure to currency fluctuations related primarily to theEuropean euro and the Great Britain pound.
At December 31, 2006, the Company performed sensitivity analyses to assess the potential loss in thefair values of market risk sensitive instruments resulting from a hypothetical change of 200 basis pointsin average interest rates, a 10 percent change in foreign currency exchange rates or a 10 percent decline inthe market value of the Company’s long-term investments. Based upon the analyses performed, suchchanges would not be expected to materially affect the Company’s consolidated financial position,results of operations or cash flows.
31

Item 8. Financial Statements and Supplementary Data.
Management’s Report on Internal Control over Financial Reporting
The management of Masco Corporation is responsible for establishing and maintaining adequateinternal control over financial reporting. Masco Corporation’s internal control over financial reporting isa process designed to provide reasonable assurance regarding the reliability of financial reporting andthe preparation of financial statements for external purposes in accordance with accounting principlesgenerally accepted in the United States of America.
The management of Masco Corporation assessed the effectiveness of the Company’s internal controlover financial reporting as of December 31, 2006 using the criteria set forth by the Committee ofSponsoring Organizations of the Treadway Commission (COSO) in “Internal Control – IntegratedFramework.” Based on this assessment, management has determined that the Company’s internalcontrol over financial reporting was effective as of December 31, 2006.
Management’s assessment of the effectiveness of Masco Corporation’s internal control over finan-cial reporting as of December 31, 2006 has been audited by PricewaterhouseCoopers LLP, an indepen-dent registered public accounting firm, as stated in their report which expressed unqualified opinions onmanagement’s assessment and the effectiveness of Masco Corporation’s internal control over financialreporting as of December 31, 2006. Additionally, PricewaterhouseCoopers LLP expressed an unqualifiedopinion on the Company’s 2006 consolidated financial statements. This report appears under Item 8.Financial Statements and Supplementary Data under the heading Report of Independent RegisteredPublic Accounting Firm.
32

REPORT OF INDEPENDENT REGISTERED PUBLIC ACCOUNTING FIRM
To the Board of Directors and Shareholdersof Masco Corporation:
We have completed integrated audits of Masco Corporation’s consolidated financial statements andof its internal control over financial reporting as of December 31, 2006, in accordance with the standardsof the Public Company Accounting Oversight Board (United States). Our opinions, based on our audits,are presented below.
Consolidated Financial Statements and Financial Statement Schedule
In our opinion, the consolidated financial statements listed in the index appearing underItem 15(a)(1) present fairly, in all material respects, the financial position of Masco Corporation andits subsidiaries at December 31, 2006 and 2005, and the results of their operations and their cash flows foreach of the three years in the period ended December 31, 2006 in conformity with accounting principlesgenerally accepted in the United States of America. In addition, in our opinion, the financial statementschedule listed in the index appearing under Item 15(a)(2) presents fairly, in all material respects, theinformation set forth therein when read in conjunction with the related consolidated financial state-ments. These financial statements and financial statement schedule are the responsibility of theCompany’s management. Our responsibility is to express an opinion on these financial statementsand financial statement schedule based on our audits. We conducted our audits of these statements inaccordance with the standards of the Public Company Accounting Oversight Board (United States).Those standards require that we plan and perform the audit to obtain reasonable assurance aboutwhether the financial statements are free of material misstatement. An audit of financial statementsincludes examining, on a test basis, evidence supporting the amounts and disclosures in the financialstatements, assessing the accounting principles used and significant estimates made by management,and evaluating the overall financial statement presentation. We believe that our audits provide areasonable basis for our opinion.
As discussed in Note M to the consolidated financial statements, the Company changed its methodof accounting for stock-based compensation in 2006. In addition, as discussed in Note N to theconsolidated financial statements, the Company changed its method of accounting for defined benefitpension and other postretirement benefit plans effective December 31, 2006.
Internal Control Over Financial Reporting
Also, in our opinion, management’s assessment, included in Management’s Report on InternalControl Over Financial Reporting appearing under Item 8, that the Company maintained effectiveinternal control over financial reporting as of December 31, 2006 based on criteria established in InternalControl – Integrated Framework issued by the Committee of Sponsoring Organizations of the TreadwayCommission (COSO), is fairly stated, in all material respects, based on those criteria. Furthermore, in ouropinion, the Company maintained, in all material respects, effective internal control over financialreporting as of December 31, 2006, based on criteria established in Internal Control – Integrated Frameworkissued by the COSO. The Company’s management is responsible for maintaining effective internalcontrol over financial reporting and for its assessment of the effectiveness of internal control overfinancial reporting. Our responsibility is to express opinions on management’s assessment and on theeffectiveness of the Company’s internal control over financial reporting based on our audit. We con-ducted our audit of internal control over financial reporting in accordance with the standards of thePublic Company Accounting Oversight Board (United States). Those standards require that we plan andperform the audit to obtain reasonable assurance about whether effective internal control over financialreporting was maintained in all material respects. An audit of internal control over financial reportingincludes obtaining an understanding of internal control over financial reporting, evaluating manage-ment’s assessment, testing and evaluating the design and operating effectiveness of internal control, and
33
performing such other procedures as we consider necessary in the circumstances. We believe that ouraudit provides a reasonable basis for our opinions.
A company’s internal control over financial reporting is a process designed to provide reasonableassurance regarding the reliability of financial reporting and the preparation of financial statements forexternal purposes in accordance with generally accepted accounting principles. A company’s internalcontrol over financial reporting includes those policies and procedures that (i) pertain to the maintenanceof records that, in reasonable detail, accurately and fairly reflect the transactions and dispositions of theassets of the company; (ii) provide reasonable assurance that transactions are recorded as necessary topermit preparation of financial statements in accordance with generally accepted accounting principles,and that receipts and expenditures of the company are being made only in accordance with authori-zations of management and directors of the company; and (iii) provide reasonable assurance regardingprevention or timely detection of unauthorized acquisition, use, or disposition of the company’s assetsthat could have a material effect on the financial statements.
Because of its inherent limitations, internal control over financial reporting may not prevent ordetect misstatements. Also, projections of any evaluation of effectiveness to future periods are subject tothe risk that controls may become inadequate because of changes in conditions, or that the degree ofcompliance with the policies or procedures may deteriorate.
PricewaterhouseCoopers LLPDetroit, MichiganFebruary 27, 2007
34
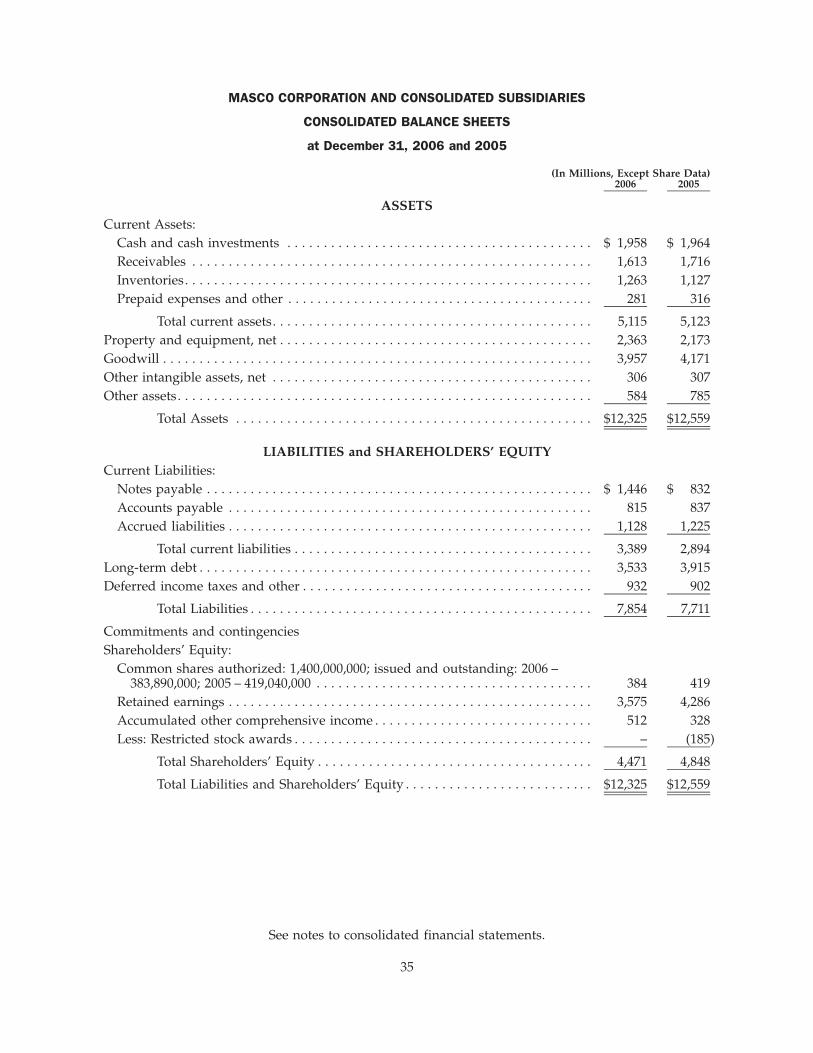
MASCO CORPORATION AND CONSOLIDATED SUBSIDIARIES
CONSOLIDATED BALANCE SHEETS
at December 31, 2006 and 2005
2006 2005(In Millions, Except Share Data)
ASSETSCurrent Assets:
Cash and cash investments . . . . . . . . . . . . . . . . . . . . . . . . . . . . . . . . . . . . . . . . . . $ 1,958 $ 1,964Receivables . . . . . . . . . . . . . . . . . . . . . . . . . . . . . . . . . . . . . . . . . . . . . . . . . . . . . . . 1,613 1,716Inventories. . . . . . . . . . . . . . . . . . . . . . . . . . . . . . . . . . . . . . . . . . . . . . . . . . . . . . . . 1,263 1,127Prepaid expenses and other . . . . . . . . . . . . . . . . . . . . . . . . . . . . . . . . . . . . . . . . . . 281 316
Total current assets. . . . . . . . . . . . . . . . . . . . . . . . . . . . . . . . . . . . . . . . . . . . 5,115 5,123Property and equipment, net . . . . . . . . . . . . . . . . . . . . . . . . . . . . . . . . . . . . . . . . . . . 2,363 2,173Goodwill . . . . . . . . . . . . . . . . . . . . . . . . . . . . . . . . . . . . . . . . . . . . . . . . . . . . . . . . . . . 3,957 4,171Other intangible assets, net . . . . . . . . . . . . . . . . . . . . . . . . . . . . . . . . . . . . . . . . . . . . 306 307Other assets. . . . . . . . . . . . . . . . . . . . . . . . . . . . . . . . . . . . . . . . . . . . . . . . . . . . . . . . . 584 785
Total Assets . . . . . . . . . . . . . . . . . . . . . . . . . . . . . . . . . . . . . . . . . . . . . . . . . $12,325 $12,559
LIABILITIES and SHAREHOLDERS’ EQUITYCurrent Liabilities:
Notes payable . . . . . . . . . . . . . . . . . . . . . . . . . . . . . . . . . . . . . . . . . . . . . . . . . . . . . $ 1,446 $ 832Accounts payable . . . . . . . . . . . . . . . . . . . . . . . . . . . . . . . . . . . . . . . . . . . . . . . . . . 815 837Accrued liabilities . . . . . . . . . . . . . . . . . . . . . . . . . . . . . . . . . . . . . . . . . . . . . . . . . . 1,128 1,225
Total current liabilities . . . . . . . . . . . . . . . . . . . . . . . . . . . . . . . . . . . . . . . . . 3,389 2,894Long-term debt . . . . . . . . . . . . . . . . . . . . . . . . . . . . . . . . . . . . . . . . . . . . . . . . . . . . . . 3,533 3,915Deferred income taxes and other . . . . . . . . . . . . . . . . . . . . . . . . . . . . . . . . . . . . . . . . 932 902
Total Liabilities . . . . . . . . . . . . . . . . . . . . . . . . . . . . . . . . . . . . . . . . . . . . . . . 7,854 7,711
Commitments and contingenciesShareholders’ Equity:
Common shares authorized: 1,400,000,000; issued and outstanding: 2006 –383,890,000; 2005 – 419,040,000 . . . . . . . . . . . . . . . . . . . . . . . . . . . . . . . . . . . . . . 384 419
Retained earnings . . . . . . . . . . . . . . . . . . . . . . . . . . . . . . . . . . . . . . . . . . . . . . . . . . 3,575 4,286Accumulated other comprehensive income . . . . . . . . . . . . . . . . . . . . . . . . . . . . . . 512 328Less: Restricted stock awards . . . . . . . . . . . . . . . . . . . . . . . . . . . . . . . . . . . . . . . . . – (185)
Total Shareholders’ Equity . . . . . . . . . . . . . . . . . . . . . . . . . . . . . . . . . . . . . . 4,471 4,848
Total Liabilities and Shareholders’ Equity . . . . . . . . . . . . . . . . . . . . . . . . . . $12,325 $12,559
See notes to consolidated financial statements.
35

MASCO CORPORATION AND CONSOLIDATED SUBSIDIARIES
CONSOLIDATED STATEMENTS OF INCOME
for the years ended December 31, 2006, 2005 and 2004
2006 2005 2004(In Millions, Except Per Common Share Data)
Net sales. . . . . . . . . . . . . . . . . . . . . . . . . . . . . . . . . . . . . . . . . . . . . . . . . . . $12,778 $12,569 $11,783Cost of sales . . . . . . . . . . . . . . . . . . . . . . . . . . . . . . . . . . . . . . . . . . . . . . . . 9,259 8,985 8,143
Gross profit . . . . . . . . . . . . . . . . . . . . . . . . . . . . . . . . . . . . . . . . . . . 3,519 3,584 3,640Selling, general and administrative expenses . . . . . . . . . . . . . . . . . . . . . . 2,063 1,954 1,974Income regarding litigation settlement . . . . . . . . . . . . . . . . . . . . . . . . . . . (1) (6) (30)Impairment charges for goodwill . . . . . . . . . . . . . . . . . . . . . . . . . . . . . . . 331 69 112
Operating profit . . . . . . . . . . . . . . . . . . . . . . . . . . . . . . . . . . . . . . . 1,126 1,567 1,584
Other income (expense), net:Interest expense . . . . . . . . . . . . . . . . . . . . . . . . . . . . . . . . . . . . . . . . . . . (240) (247) (217)Impairment charges for financial investments . . . . . . . . . . . . . . . . . . . (101) (45) (21)Other, net . . . . . . . . . . . . . . . . . . . . . . . . . . . . . . . . . . . . . . . . . . . . . . . . 115 127 188
(226) (165) (50)
Income from continuing operations before income taxes,minority interest and cumulative effect of accounting change,net . . . . . . . . . . . . . . . . . . . . . . . . . . . . . . . . . . . . . . . . . . . . . . . . 900 1,402 1,534
Income taxes . . . . . . . . . . . . . . . . . . . . . . . . . . . . . . . . . . . . . . . . . . . . . . . 412 514 571
Income from continuing operations before minority interest andcumulative effect of accounting change, net . . . . . . . . . . . . . . . 488 888 963
Minority interest . . . . . . . . . . . . . . . . . . . . . . . . . . . . . . . . . . . . . . . . . . . . 27 22 19
Income from continuing operations before cumulative effect ofaccounting change, net . . . . . . . . . . . . . . . . . . . . . . . . . . . . . . . . 461 866 944
Income (loss) from discontinued operations, net . . . . . . . . . . . . . . . . . . . 30 74 (51)Cumulative effect of accounting change, net . . . . . . . . . . . . . . . . . . . . . . (3) – –
Net income . . . . . . . . . . . . . . . . . . . . . . . . . . . . . . . . . . . . . . . . . . . $ 488 $ 940 $ 893
Earnings per common share:Basic:
Income from continuing operations before cumulative effect ofaccounting change, net . . . . . . . . . . . . . . . . . . . . . . . . . . . . . . . . . . $ 1.17 $ 2.05 $ 2.12
Income (loss) from discontinued operations, net . . . . . . . . . . . . . . . .08 .18 (.11)Cumulative effect of accounting change, net . . . . . . . . . . . . . . . . . . (.01) – –
Net income . . . . . . . . . . . . . . . . . . . . . . . . . . . . . . . . . . . . . . . . . . . . . $ 1.24 $ 2.23 $ 2.01
Diluted:Income from continuing operations before cumulative effect of
accounting change, net . . . . . . . . . . . . . . . . . . . . . . . . . . . . . . . . . . $ 1.15 $ 2.01 $ 2.07Income (loss) from discontinued operations, net . . . . . . . . . . . . . . . .08 .17 (.11)Cumulative effect of accounting change, net . . . . . . . . . . . . . . . . . . (.01) – –
Net income . . . . . . . . . . . . . . . . . . . . . . . . . . . . . . . . . . . . . . . . . . . . . $ 1.22 $ 2.19 $ 1.96
See notes to consolidated financial statements.
36

MASCO CORPORATION AND CONSOLIDATED SUBSIDIARIES
CONSOLIDATED STATEMENTS OF CASH FLOWS
for the years ended December 31, 2006, 2005 and 2004
2006 2005 2004(In Millions)
Cash Flows From (For) Operating Activities:Net income . . . . . . . . . . . . . . . . . . . . . . . . . . . . . . . . . . . . . . . . . . . . . . . . . . . . . . $ 488 $ 940 $ 893Depreciation and amortization . . . . . . . . . . . . . . . . . . . . . . . . . . . . . . . . . . . . . . . 244 241 237Deferred income taxes . . . . . . . . . . . . . . . . . . . . . . . . . . . . . . . . . . . . . . . . . . . . . . (42) 75 91(Gain) loss on disposition of businesses, net . . . . . . . . . . . . . . . . . . . . . . . . . . . . . (51) (63) 33Gain on disposition of investments, net . . . . . . . . . . . . . . . . . . . . . . . . . . . . . . . . . (31) (98) (92)Income regarding litigation settlement. . . . . . . . . . . . . . . . . . . . . . . . . . . . . . . . . . (1) (6) (30)Cumulative effect of accounting change, net . . . . . . . . . . . . . . . . . . . . . . . . . . . . . 3 – –Impairment charges:
Financial investments . . . . . . . . . . . . . . . . . . . . . . . . . . . . . . . . . . . . . . . . . . . . . 101 45 21Goodwill . . . . . . . . . . . . . . . . . . . . . . . . . . . . . . . . . . . . . . . . . . . . . . . . . . . . . . 331 69 168
Stock-based compensation . . . . . . . . . . . . . . . . . . . . . . . . . . . . . . . . . . . . . . . . . . . 100 71 74Minority interest . . . . . . . . . . . . . . . . . . . . . . . . . . . . . . . . . . . . . . . . . . . . . . . . . . 27 22 19Other items, net. . . . . . . . . . . . . . . . . . . . . . . . . . . . . . . . . . . . . . . . . . . . . . . . . . . 96 69 50Decrease (increase) in receivables . . . . . . . . . . . . . . . . . . . . . . . . . . . . . . . . . . . . . 106 (94) (114)Increase in inventories . . . . . . . . . . . . . . . . . . . . . . . . . . . . . . . . . . . . . . . . . . . . . . (126) (57) (138)(Decrease) increase in accounts payable and accrued liabilities, net . . . . . . . . . . . . (37) 160 242
Net cash from operating activities . . . . . . . . . . . . . . . . . . . . . . . . . . . . . . . . . 1,208 1,374 1,454Cash Flows From (For) Financing Activities:
Increase in debt . . . . . . . . . . . . . . . . . . . . . . . . . . . . . . . . . . . . . . . . . . . . . . . . . . . 21 33 33Payment of debt . . . . . . . . . . . . . . . . . . . . . . . . . . . . . . . . . . . . . . . . . . . . . . . . . . (31) (120) (73)Issuance of notes, net of issuance costs . . . . . . . . . . . . . . . . . . . . . . . . . . . . . . . . . 988 494 293Retirement of notes . . . . . . . . . . . . . . . . . . . . . . . . . . . . . . . . . . . . . . . . . . . . . . . . (827) – (266)Purchase of Company common stock . . . . . . . . . . . . . . . . . . . . . . . . . . . . . . . . . . (854) (986) (943)Issuance of Company common stock . . . . . . . . . . . . . . . . . . . . . . . . . . . . . . . . . . . 28 33 58Tax benefit from exercise of stock options . . . . . . . . . . . . . . . . . . . . . . . . . . . . . . . 18 – –Cash dividends paid . . . . . . . . . . . . . . . . . . . . . . . . . . . . . . . . . . . . . . . . . . . . . . . (349) (339) (302)Proceeds from settlement of swaps . . . . . . . . . . . . . . . . . . . . . . . . . . . . . . . . . . . . – – 55
Net cash for financing activities . . . . . . . . . . . . . . . . . . . . . . . . . . . . . . . . . . . (1,006) (885) (1,145)Cash Flows From (For) Investing Activities:
Capital expenditures . . . . . . . . . . . . . . . . . . . . . . . . . . . . . . . . . . . . . . . . . . . . . . . (388) (282) (310)Purchases of marketable securities. . . . . . . . . . . . . . . . . . . . . . . . . . . . . . . . . . . . . (142) (155) (349)Proceeds from disposition of:
Marketable securities . . . . . . . . . . . . . . . . . . . . . . . . . . . . . . . . . . . . . . . . . . . . . 174 301 629Businesses, net of cash disposed . . . . . . . . . . . . . . . . . . . . . . . . . . . . . . . . . . . . 160 278 172Property and equipment . . . . . . . . . . . . . . . . . . . . . . . . . . . . . . . . . . . . . . . . . . 16 37 37Other financial investments, net . . . . . . . . . . . . . . . . . . . . . . . . . . . . . . . . . . . . . 39 47 50
Acquisition of businesses, net of cash acquired . . . . . . . . . . . . . . . . . . . . . . . . . . . (28) (25) (16)Other, net . . . . . . . . . . . . . . . . . . . . . . . . . . . . . . . . . . . . . . . . . . . . . . . . . . . . . . . (57) (15) (52)
Net cash (for) from investing activities . . . . . . . . . . . . . . . . . . . . . . . . . . . . . . (226) 186 161Effect of exchange rate changes on cash and cash investments . . . . . . . . . . . . . . . . . 18 (5) 29Cash and Cash Investments:
(Decrease) increase for the year . . . . . . . . . . . . . . . . . . . . . . . . . . . . . . . . . . . . . . . (6) 670 499Cash at businesses held for sale . . . . . . . . . . . . . . . . . . . . . . . . . . . . . . . . . . . . . . – 38 (38)At January 1 . . . . . . . . . . . . . . . . . . . . . . . . . . . . . . . . . . . . . . . . . . . . . . . . . . . . . 1,964 1,256 795At December 31. . . . . . . . . . . . . . . . . . . . . . . . . . . . . . . . . . . . . . . . . . . . . . . . . . . $ 1,958 $1,964 $ 1,256
See notes to consolidated financial statements.
37
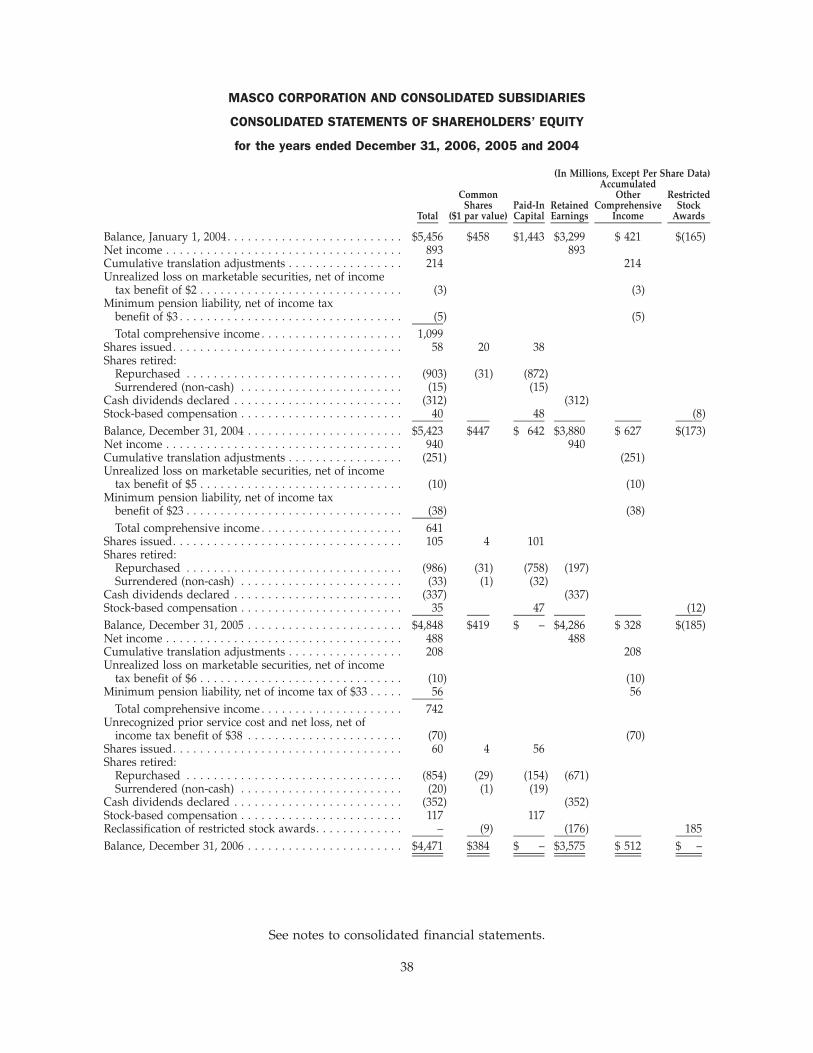
MASCO CORPORATION AND CONSOLIDATED SUBSIDIARIES
CONSOLIDATED STATEMENTS OF SHAREHOLDERS’ EQUITY
for the years ended December 31, 2006, 2005 and 2004
Total
CommonShares
($1 par value)Paid-InCapital
RetainedEarnings
AccumulatedOther
ComprehensiveIncome
RestrictedStock
Awards
(In Millions, Except Per Share Data)
Balance, January 1, 2004. . . . . . . . . . . . . . . . . . . . . . . . . . $5,456 $458 $1,443 $3,299 $ 421 $(165)Net income . . . . . . . . . . . . . . . . . . . . . . . . . . . . . . . . . . . 893 893Cumulative translation adjustments . . . . . . . . . . . . . . . . . 214 214Unrealized loss on marketable securities, net of income
tax benefit of $2 . . . . . . . . . . . . . . . . . . . . . . . . . . . . . . (3) (3)Minimum pension liability, net of income tax
benefit of $3 . . . . . . . . . . . . . . . . . . . . . . . . . . . . . . . . . (5) (5)Total comprehensive income . . . . . . . . . . . . . . . . . . . . . 1,099
Shares issued. . . . . . . . . . . . . . . . . . . . . . . . . . . . . . . . . . 58 20 38Shares retired:
Repurchased . . . . . . . . . . . . . . . . . . . . . . . . . . . . . . . . (903) (31) (872)Surrendered (non-cash) . . . . . . . . . . . . . . . . . . . . . . . . (15) (15)
Cash dividends declared . . . . . . . . . . . . . . . . . . . . . . . . . (312) (312)Stock-based compensation . . . . . . . . . . . . . . . . . . . . . . . . 40 48 (8)Balance, December 31, 2004 . . . . . . . . . . . . . . . . . . . . . . . $5,423 $447 $ 642 $3,880 $ 627 $(173)Net income . . . . . . . . . . . . . . . . . . . . . . . . . . . . . . . . . . . 940 940Cumulative translation adjustments . . . . . . . . . . . . . . . . . (251) (251)Unrealized loss on marketable securities, net of income
tax benefit of $5 . . . . . . . . . . . . . . . . . . . . . . . . . . . . . . (10) (10)Minimum pension liability, net of income tax
benefit of $23 . . . . . . . . . . . . . . . . . . . . . . . . . . . . . . . . (38) (38)Total comprehensive income . . . . . . . . . . . . . . . . . . . . . 641
Shares issued. . . . . . . . . . . . . . . . . . . . . . . . . . . . . . . . . . 105 4 101Shares retired:
Repurchased . . . . . . . . . . . . . . . . . . . . . . . . . . . . . . . . (986) (31) (758) (197)Surrendered (non-cash) . . . . . . . . . . . . . . . . . . . . . . . . (33) (1) (32)
Cash dividends declared . . . . . . . . . . . . . . . . . . . . . . . . . (337) (337)Stock-based compensation . . . . . . . . . . . . . . . . . . . . . . . . 35 47 (12)Balance, December 31, 2005 . . . . . . . . . . . . . . . . . . . . . . . $4,848 $419 $ – $4,286 $ 328 $(185)Net income . . . . . . . . . . . . . . . . . . . . . . . . . . . . . . . . . . . 488 488Cumulative translation adjustments . . . . . . . . . . . . . . . . . 208 208Unrealized loss on marketable securities, net of income
tax benefit of $6 . . . . . . . . . . . . . . . . . . . . . . . . . . . . . . (10) (10)Minimum pension liability, net of income tax of $33 . . . . . 56 56
Total comprehensive income . . . . . . . . . . . . . . . . . . . . . 742Unrecognized prior service cost and net loss, net of
income tax benefit of $38 . . . . . . . . . . . . . . . . . . . . . . . (70) (70)Shares issued. . . . . . . . . . . . . . . . . . . . . . . . . . . . . . . . . . 60 4 56Shares retired:
Repurchased . . . . . . . . . . . . . . . . . . . . . . . . . . . . . . . . (854) (29) (154) (671)Surrendered (non-cash) . . . . . . . . . . . . . . . . . . . . . . . . (20) (1) (19)
Cash dividends declared . . . . . . . . . . . . . . . . . . . . . . . . . (352) (352)Stock-based compensation . . . . . . . . . . . . . . . . . . . . . . . . 117 117Reclassification of restricted stock awards. . . . . . . . . . . . . – (9) (176) 185Balance, December 31, 2006 . . . . . . . . . . . . . . . . . . . . . . . $4,471 $384 $ – $3,575 $ 512 $ –
See notes to consolidated financial statements.
38

MASCO CORPORATION
NOTES TO CONSOLIDATED FINANCIAL STATEMENTS
A. ACCOUNTING POLICIES
Principles of Consolidation. The consolidated financial statements include the accounts of MascoCorporation and all majority-owned subsidiaries. All significant intercompany transactions have beeneliminated. The Company consolidates the assets, liabilities and results of operations of variable interestentities, for which the Company is the primary beneficiary, in accordance with Financial AccountingStandards Board (“FASB”) Interpretation No. 46 – Revised, “Consolidation of Variable Interest Entities.”
Use of Estimates and Assumptions in the Preparation of Financial Statements. The preparation of financialstatements in conformity with accounting principles generally accepted in the United States of Americarequires the Company to make certain estimates and assumptions that affect the reported amounts ofassets and liabilities and disclosure of any contingent assets and liabilities at the date of the financialstatements and the reported amounts of revenues and expenses during the reporting period. Actualresults may differ from these estimates and assumptions.
Revenue Recognition. The Company recognizes revenue as title to products and risk of loss istransferred to customers or when services are rendered, net of applicable provisions for discounts,returns and allowances. The Company records revenue for unbilled services performed based uponestimates of labor incurred in the Installation and Other Services segment; such amounts are recorded inReceivables. Amounts billed for shipping and handling are included in net sales, while costs incurred forshipping and handling are included in cost of sales.
Customer Promotion Costs. The Company records estimated reductions to revenue for customerprogram and incentive offerings, including special pricing and co-operative advertising arrangements,promotions and other volume-based incentives. In-store displays that are owned by the Company andused to market the Company’s products are included in other assets in the consolidated balance sheetsand are amortized using the straight-line method over the expected useful life of three years; relatedamortization expense is classified as a selling expense in the consolidated statements of income.
Foreign Currency. The financial statements of the Company’s foreign subsidiaries are measuredusing the local currency as the functional currency. Assets and liabilities of these subsidiaries aretranslated at exchange rates as of the balance sheet date. Revenues and expenses are translated at averageexchange rates in effect during the year. The resulting cumulative translation adjustments have beenrecorded in the other comprehensive income component of shareholders’ equity. Realized foreigncurrency transaction gains and losses are included in the consolidated statements of income in otherincome (expense), net.
Cash and Cash Investments. The Company considers all highly liquid investments with an initialmaturity of three months or less to be cash and cash investments.
Receivables. The Company does significant business with a number of customers, including certainhome centers. The Company monitors its exposure for credit losses and records related allowances fordoubtful accounts. Allowances are estimated based upon specific customer balances, where a risk ofdefault has been identified, and also include a provision for non-customer specific defaults based uponhistorical collection, return and write-off activity. A separate allowance is recorded for customerincentive rebates and is generally based upon sales activity. Receivables are presented net of certainallowances (including allowances for doubtful accounts) of $84 million and $78 million at December 31,2006 and 2005, respectively. Receivables include unbilled revenue related to the Installation and OtherServices segment of $40 million and $57 million at December 31, 2006 and 2005, respectively.
Property and Equipment. Property and equipment, including significant betterments to existingfacilities, are recorded at cost. Upon retirement or disposal, the cost and accumulated depreciation
39
A. ACCOUNTING POLICIES – (Continued)
are removed from the accounts and any gain or loss is included in the consolidated statements of income.Maintenance and repair costs are charged against earnings as incurred.
Depreciation. Depreciation expense is computed principally using the straight-line method over theestimated useful lives of the assets. Annual depreciation rates are as follows: buildings and landimprovements, 2 to 10 percent, and machinery and equipment, 5 to 33 percent. Depreciation expensewas $230 million, $208 million and $204 million in 2006, 2005 and 2004, respectively.
Goodwill and Other Intangible Assets. Statement of Financial Accounting Standards (“SFAS”) No. 142,“Goodwill and Other Intangible Assets,” requires goodwill and other intangible assets to be tested forimpairment annually and under certain circumstances. The Company performs such testing of goodwilland other indefinite-lived intangible assets in the fourth quarter of each year or as events occur orcircumstances change that would more likely than not reduce the fair value of a reporting business unitbelow its carrying amount. The Company compares the fair value of the reporting business units to thecarrying value of the reporting business units for goodwill impairment testing. Fair value is determinedusing a discounted cash flow method.
The Company reviews its other indefinite-lived intangible assets for impairment annually or asevents occur or circumstances change that indicate the assets may be impaired. The Company considersthe implications of both external (e.g., market growth, competition and local economic conditions) andinternal (e.g., product sales, profit margins and expected product growth) factors and their potentialimpact on cash flows related to the intangible asset in both the near- and long-term.
Intangible assets with finite useful lives are amortized using the straight-line method over theirestimated useful lives. The Company evaluates the remaining useful lives of amortizable identifiableintangible assets at each reporting period to determine whether events and circumstances warrant arevision to the remaining periods of amortization. See Note H for additional information regardingGoodwill and Other Intangible Assets.
Fair Value of Financial Instruments and Derivative Instruments. The carrying value of financial instru-ments reported in the consolidated balance sheets for current assets, current liabilities and long-termfloating-rate debt approximates fair value. The fair value of financial instruments that are carried as non-current investments is based principally upon information from investment fund managers and otherassumptions, on quoted market prices for those or similar investments, by estimating the fair value ofconsideration to be received or by discounting future cash flows using a discount rate that reflects the riskof the underlying investments. The fair value of the Company’s long-term fixed-rate debt instruments isbased principally upon quoted market prices for the same or similar issues or the current rates availableto the Company for debt with similar terms and remaining maturities. The aggregate market value ofnon-current investments and long-term debt at December 31, 2006 was approximately $246 million and$3,616 million, compared with the aggregate carrying value of $246 million and $3,533 million, respec-tively. The aggregate market value of non-current investments and long-term debt at December 31, 2005was approximately $367 million and $3,654 million, compared with the aggregate carrying value of$395 million and $3,915 million, respectively.
The Company uses derivative financial instruments to manage certain exposure to fluctuations inearnings and cash flows resulting from changes in foreign currency exchange rates and interest rates.Derivative financial instruments are recorded in the consolidated balance sheets as either an asset orliability measured at fair value. For each derivative instrument that is designated and qualifies as a fair-value hedge, the gain or loss on the derivative instrument, as well as the offsetting loss or gain on thehedged item attributable to the hedged risk, are recognized in determining current earnings during theperiod of the change in fair values. For derivative instruments not designated as hedging instruments,
40
MASCO CORPORATION
NOTES TO CONSOLIDATED FINANCIAL STATEMENTS — (Continued)

A. ACCOUNTING POLICIES – (Continued)
the gain or loss is recognized in determining current earnings during the period of the change in fairvalue.
Warranty. At the time of sale, the Company accrues a warranty liability for estimated costs toprovide products, parts or services to repair or replace products in satisfaction of warranty obligations.The Company’s estimate of costs to service its warranty obligations is based upon historical experienceand expectations of future conditions.
A significant portion of the Company’s business is at the consumer retail level through home centersand major retailers. A consumer may return a product to a retail outlet that is a warranty return.However, certain retail outlets do not distinguish between warranty and other types of returns when theyclaim a return deduction from the Company. The Company’s revenue recognition policy takes intoaccount this type of return when recognizing revenue, and deductions are recorded at the time of sale.
Product Liability. The Company provides for expenses associated with product liability obligationswhen such amounts are probable and can be reasonably estimated. The accruals are adjusted as newinformation develops or circumstances change that would effect the estimated liability.
Stock-Based Compensation. The Company elected to change its method of accounting for stock-basedcompensation and implemented the fair value method prescribed by SFAS No. 123, “Accounting forStock-Based Compensation,” effective January 1, 2003. The Company used the prospective method, asdefined by SFAS No. 148, “Accounting for Stock-Based Compensation – Transition and Disclosure – anamendment to SFAS No. 123,” for determining stock-based compensation expense. Accordingly, optionsgranted, modified or settled subsequent to January 1, 2003 were accounted for using the fair valuemethod, and options granted prior to January 1, 2003 were accounted for using the intrinsic valuemethod.
Effective January 1, 2006, the Company adopted SFAS No. 123R, “Share-Based Payment,”(“SFAS No. 123R”) using the Modified Prospective Application (“MPA”) method. The MPA methodrequires the Company to recognize expense for unvested stock options that were awarded prior toJanuary 1, 2003 through the remaining vesting periods. The MPA method does not require the restate-ment of prior-year information. In accordance with SFAS No. 123R, the Company utilized the shortcutmethod to determine the tax windfall pool associated with stock options at December 31, 2006.
41
MASCO CORPORATION
NOTES TO CONSOLIDATED FINANCIAL STATEMENTS — (Continued)
A. ACCOUNTING POLICIES – (Continued)
The following table illustrates the pro forma effect on net income and earnings per common share for2005 and 2004, as if the fair value method were applied to all previously issued stock options, in millions,except per common share amounts:
2005 2004
Net income, as reported . . . . . . . . . . . . . . . . . . . . . . . . . . . . . . . . . . . . $ 940 $ 893Add:
Stock-based employee compensation expense included inreported net income, net of tax . . . . . . . . . . . . . . . . . . . . . . . . . . . 47 48
Deduct:Stock-based employee compensation expense, net of tax . . . . . . . . (47) (48)Stock-based employee compensation expense determined under
the fair value method for stock options granted prior to 2003,net of tax . . . . . . . . . . . . . . . . . . . . . . . . . . . . . . . . . . . . . . . . . . . . (7) (12)
Pro forma net income . . . . . . . . . . . . . . . . . . . . . . . . . . . . . . . . . . $ 933 $ 881
Earnings per common share:Basic as reported . . . . . . . . . . . . . . . . . . . . . . . . . . . . . . . . . . . . . . . . $2.23 $2.01Basic pro forma . . . . . . . . . . . . . . . . . . . . . . . . . . . . . . . . . . . . . . . . . $2.21 $1.98
Diluted as reported . . . . . . . . . . . . . . . . . . . . . . . . . . . . . . . . . . . . . . $2.19 $1.96Diluted pro forma . . . . . . . . . . . . . . . . . . . . . . . . . . . . . . . . . . . . . . . $2.17 $1.93
Reclassifications. Certain prior-year amounts have been reclassified to conform to the 2006 presen-tation in the consolidated financial statements. The results of operations related to 2006, 2005 and 2004discontinued operations have been reclassified and separately stated in the accompanying consolidatedstatements of income for 2006, 2005 and 2004. In the Company’s consolidated statements of cash flows,the cash flows from discontinued operations are not separately classified.
Other Recently Issued Accounting Pronouncements. In September 2006, the Securities and ExchangeCommission released Staff Accounting Bulletin No. 108, “Quantifying Financial Statement Misstate-ments,” (“SAB 108”). Historically, the Company evaluated financial statement misstatements using an“iron-curtain” method, which primarily focused on the effect of correcting the period-end balance sheetwith less emphasis on the reversing effects of prior-year errors on the statement of income. SAB 108clarified that the evaluation of financial statement misstatements must be made based upon all relevantquantitative and qualitative factors; this is referred to as a “dual approach.” SAB 108 is effective for theyear ended December 31, 2006. The adoption of SAB 108 did not have an effect on the Company’sconsolidated financial statements.
In September 2006, the FASB issued SFAS No. 157, “Fair Value Measurements,” (“SFAS No. 157”).SFAS No. 157 defines fair value, establishes a framework for measuring fair value and expandsdisclosures about fair value measurements. The adoption of SFAS No. 157 is effective January 1,2008. The Company is currently evaluating the impact that the provisions of SFAS No. 157 will haveon its consolidated financial statements.
In July 2006, the FASB issued FASB Interpretation No. 48, “Accounting for Uncertainty in IncomeTaxes – an Interpretation of FASB Statement 109,” (“FIN No. 48”). FIN No. 48 allows the recognition ofonly those income tax benefits that have a greater than 50 percent likelihood of being sustained uponexamination by the taxing authorities. FIN No. 48 also provides guidance on classification, interest and
42
MASCO CORPORATION
NOTES TO CONSOLIDATED FINANCIAL STATEMENTS — (Continued)

A. ACCOUNTING POLICIES – (Concluded)
penalties, accounting in interim periods, disclosure and transition. The adoption of FIN No. 48 is effectiveJanuary 1, 2007.
Historically, the Company has established reserves for tax contingencies in accordance withSFAS No. 5, “Accounting for Contingencies,” (“SFAS No. 5”). Under this standard, reserves for taxcontingencies are established when it is probable that an additional tax may be owed and the amount canbe reasonably estimated. FIN No. 48 establishes a lower threshold for recognizing reserves for income taxcontingencies on uncertain tax positions than the thresholds under SFAS No. 5. Therefore, although theCompany has not completed its evaluation of the impact of FIN No. 48 on its consolidated financialstatements, it currently estimates that its reserves for income tax contingencies net of any federal taxbenefit will increase by approximately $25 million to $45 million, as of the date of adoption. Thecumulative effect of applying FIN No. 48 will be recorded as a reduction to beginning retained earningsin 2007. The Company believes that, in future years, there will be a greater potential for volatility in itseffective tax rate because this lower threshold allows changes in the income tax environment to affect thetax reserve computation to a greater degree than SFAS No. 5.
In addition, the Company expects to reclassify the majority of its reserves for income tax contin-gencies from current to non-current liabilities in accordance with the provisions of FIN No. 48.
B. DISCONTINUED OPERATIONS
SFAS No. 144, “Accounting for the Impairment or Disposal of Long-Lived Assets,” (“SFAS No. 144”)addresses the accounting and reporting for the impairment or disposal of long-lived assets. SFAS No. 144broadens the presentation of discontinued operations to include a component of the Company, whichcomprises operations and cash flows, that can be clearly distinguished from the rest of the Company. Inaccordance with SFAS No. 144, the Company has accounted for the business units which were sold in2006, 2005 and 2004, except as noted, as discontinued operations.
In 2004, the Company determined that several European business units were not core to theCompany’s long-term growth strategy and, accordingly, embarked on a plan of disposition (the“2004 Plan”). The discontinued operations were previously included in each of the Company’s segments,except the Installation and Other Services segment. In 2004, the Company recognized pre-tax charges of$139 million ($151 million including tax effect) for those European business units that were expected tobe divested at a loss. Any gains resulting from the dispositions were recognized when the transactionswere completed. During 2004, in separate transactions, the Company completed the sale of its JungPumpen, The Alvic Group, Alma Kuchen, E. Missel and SKS Group business units in Europe. Total grossproceeds from the dispositions of these companies were $199 million, including cash of $193 million andnotes receivable of $6 million. The Company recognized a pre-tax net gain (principally related to the saleof Jung Pumpen) on the dispositions of these businesses of $106 million.
During 2005, in separate transactions, the Company completed the sale of its Gebhardt Consolidatedand GMU Group business units in Europe, as part of the Company’s 2004 Plan, as well as its ZenithProducts and Aran Group businesses. Total gross proceeds from the sale of these businesses were$319 million; the Company recognized a pre-tax net gain (principally related to the sale of GebhardtConsolidated and Zenith Products) on the disposition of these businesses of $59 million. During 2005, theCompany recorded as gain on disposal of discontinued operations, approximately $4 million related tothe reversal of certain fee and expense accruals that were recorded in 2004, as part of the 2004 Plan. In2005, the Company also recorded as income from discontinued operations $3 million related to thereversal of severance accruals that were recorded in 2004.
43
MASCO CORPORATION
NOTES TO CONSOLIDATED FINANCIAL STATEMENTS — (Continued)

B. DISCONTINUED OPERATIONS – (Concluded)
In 2006, the Company completed the sale of Computerized Security Systems (“CSS”). This dispo-sition was completed pursuant to the Company’s determination that this business unit was not core tothe Company’s long-term growth strategy. CSS supplies electronic locksets primarily to hospitalitymarkets in the United States and Europe and was included in the Other Specialty Products segment. As aresult of the sale, the Company reclassified the net sales and results of operations related to CSS todiscontinued operations. Total gross proceeds from the sale were $92 million; the Company recognized apre-tax net gain on the disposition of CSS of $51 million.
Gains from the 2006, 2005 and 2004 discontinued operations discussed above were included inincome (loss) from discontinued operations, net, in the consolidated statements of income.
Selected financial information for the discontinued operations during the period owned by theCompany, were as follows, in millions:
2006 2005 2004
Net sales . . . . . . . . . . . . . . . . . . . . . . . . . . . . . . . . . . . . . . . . . . . . . . . . . . . . . . . . . $ 55 $315 $ 648
Income from discontinued operations . . . . . . . . . . . . . . . . . . . . . . . . . . . . . . . . . . $ 8 $ 49 $ 13Gain on disposal of discontinued operations, net . . . . . . . . . . . . . . . . . . . . . . . . . 50 63 106Impairment of assets held for sale . . . . . . . . . . . . . . . . . . . . . . . . . . . . . . . . . . . . . — — (139)
Income (loss) before income taxes . . . . . . . . . . . . . . . . . . . . . . . . . . . . . . . . . . . . . 58 112 (20)Income taxes . . . . . . . . . . . . . . . . . . . . . . . . . . . . . . . . . . . . . . . . . . . . . . . . . . . . . . (28) (38) (31)
Income (loss) from discontinued operations, net . . . . . . . . . . . . . . . . . . . . . . . $ 30 $ 74 $ (51)
Included in gain on disposal of discontinued operations, net, for 2006 was the gain related to CSS, aswell as additional expenses, net of gains reflecting the receipt of final purchase price payments, related tobusinesses disposed in 2005.
Included in income taxes above was income tax related to income from discontinued operations of$4 million, $15 million and $7 million in 2006, 2005 and 2004, respectively. Income (loss) before incometaxes above includes non-cash, pre-tax goodwill impairment charges of $56 million for 2004.
The unusual relationship between income taxes and income (loss) before income taxes in 2004(including the impairment charge for assets held for sale and the net gain on disposals) resultedprimarily from certain losses providing no current tax benefit and from the reversal of deferred taxassets of the discontinued operations which were no longer expected to be realized.
During 2006, the Company also completed the sale of Gamco Products, General Accessory, Cam-bridge Brass and Faucet Queens, relatively small businesses, the results of which are included incontinuing operations through the date of sale. These businesses had combined net sales and operatingprofit of $16 million and $5 million, respectively, in 2006 through the respective dates of sale andcombined net sales and operating profit of $55 million and $12 million, respectively, in 2005. GamcoProducts is a supplier of plumbing products in North America and was included in the PlumbingProducts segment. General Accessory is a supplier of bathroom accessories in North America and wasincluded in the Decorative Architectural Products segment. Cambridge Brass is a supplier of plumbingfittings in North America and was included in the Plumbing Products segment. Faucet Queens is asupplier of home hardware and repair products to food and drug stores in North America and wasincluded in the Other Specialty Products segment. Gross proceeds from the sale of these businesses were$72 million; the Company recognized a net gain of $1 million in 2006 included in other, net, in continuingoperations.
44
MASCO CORPORATION
NOTES TO CONSOLIDATED FINANCIAL STATEMENTS — (Continued)

C. ACQUISITIONS
During 2006, 2005 and 2004, the Company acquired several relatively small businesses (primarily inthe Installation and Other Services segment). The results of these acquisitions are included in theconsolidated financial statements from the respective dates of acquisition. The total net purchase price ofthese acquisitions was as follows, in millions:
2006 2005 2004
Cash, net . . . . . . . . . . . . . . . . . . . . . . . . . . . . . . . . . . . . . . . . . . . . . $28 $10 $ 8Assumed debt . . . . . . . . . . . . . . . . . . . . . . . . . . . . . . . . . . . . . . . . 9 2 2
Total. . . . . . . . . . . . . . . . . . . . . . . . . . . . . . . . . . . . . . . . . . . . . . . $37 $12 $10
Certain purchase agreements provided for the payment of additional consideration in either cash orCompany common stock, contingent upon whether certain conditions are met, including the operatingperformance of the acquired business and the price of the Company’s common stock. The Company paidan additional $15 million and $31 million (including $8 million in cash) of acquisition-related consid-eration, including amounts to satisfy share price guarantees, contingent consideration and other pur-chase price adjustments in 2005 and 2004, respectively, relating to previously acquired companies. AtDecember 31, 2006, the Company had additional consideration payable in cash of $6 million contingentupon the operating performance of the acquired businesses.
D. INVENTORIES
2006 2005At December 31
(In Millions)
Finished goods . . . . . . . . . . . . . . . . . . . . . . . . . . . . . . . . . . . . . . . . . $ 610 $ 525Raw material . . . . . . . . . . . . . . . . . . . . . . . . . . . . . . . . . . . . . . . . . . . 480 427Work in process . . . . . . . . . . . . . . . . . . . . . . . . . . . . . . . . . . . . . . . . . 173 175
Total . . . . . . . . . . . . . . . . . . . . . . . . . . . . . . . . . . . . . . . . . . . . . . . . $1,263 $1,127
Inventories, which include purchased parts, materials, direct labor and applied manufacturingoverhead, are stated at the lower of cost or net realizable value, with cost determined by use of the first-in,first-out method.
45
MASCO CORPORATION
NOTES TO CONSOLIDATED FINANCIAL STATEMENTS — (Continued)
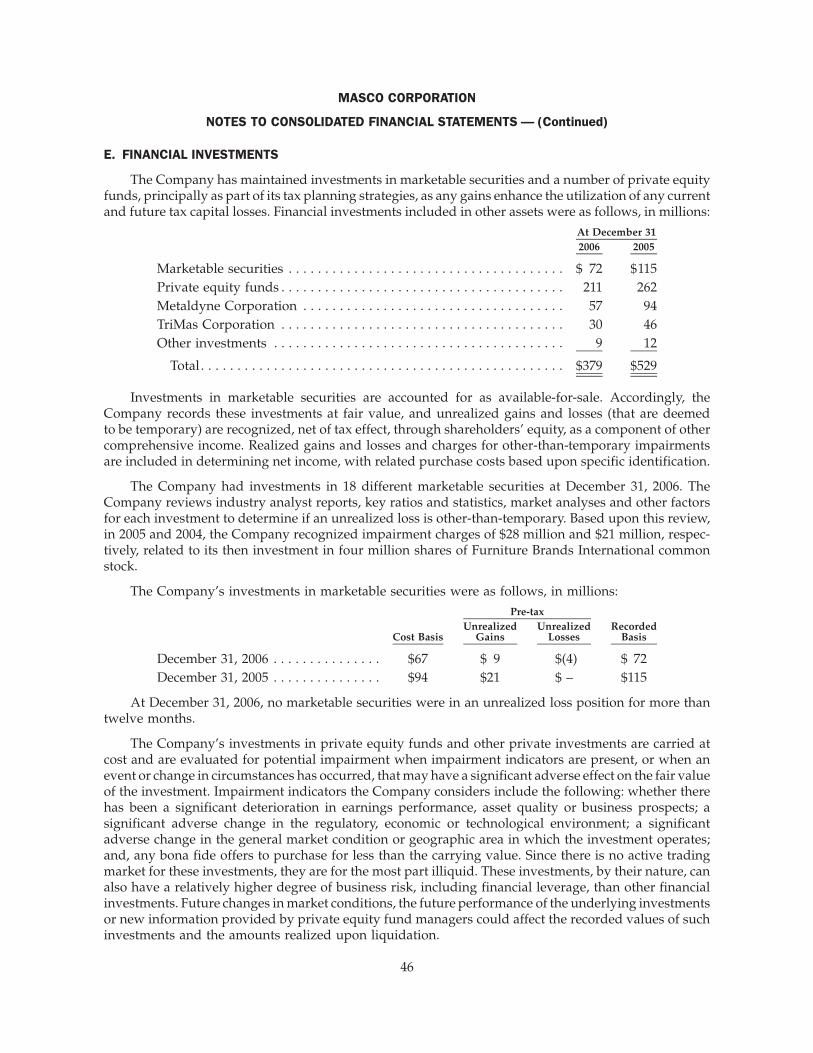
E. FINANCIAL INVESTMENTS
The Company has maintained investments in marketable securities and a number of private equityfunds, principally as part of its tax planning strategies, as any gains enhance the utilization of any currentand future tax capital losses. Financial investments included in other assets were as follows, in millions:
2006 2005At December 31
Marketable securities . . . . . . . . . . . . . . . . . . . . . . . . . . . . . . . . . . . . . . $ 72 $115Private equity funds . . . . . . . . . . . . . . . . . . . . . . . . . . . . . . . . . . . . . . . 211 262Metaldyne Corporation . . . . . . . . . . . . . . . . . . . . . . . . . . . . . . . . . . . . 57 94TriMas Corporation . . . . . . . . . . . . . . . . . . . . . . . . . . . . . . . . . . . . . . . 30 46Other investments . . . . . . . . . . . . . . . . . . . . . . . . . . . . . . . . . . . . . . . . 9 12
Total . . . . . . . . . . . . . . . . . . . . . . . . . . . . . . . . . . . . . . . . . . . . . . . . . . $379 $529
Investments in marketable securities are accounted for as available-for-sale. Accordingly, theCompany records these investments at fair value, and unrealized gains and losses (that are deemedto be temporary) are recognized, net of tax effect, through shareholders’ equity, as a component of othercomprehensive income. Realized gains and losses and charges for other-than-temporary impairmentsare included in determining net income, with related purchase costs based upon specific identification.
The Company had investments in 18 different marketable securities at December 31, 2006. TheCompany reviews industry analyst reports, key ratios and statistics, market analyses and other factorsfor each investment to determine if an unrealized loss is other-than-temporary. Based upon this review,in 2005 and 2004, the Company recognized impairment charges of $28 million and $21 million, respec-tively, related to its then investment in four million shares of Furniture Brands International commonstock.
The Company’s investments in marketable securities were as follows, in millions:
Cost BasisUnrealized
GainsUnrealized
LossesRecorded
Basis
Pre-tax
December 31, 2006 . . . . . . . . . . . . . . . $67 $ 9 $(4) $ 72December 31, 2005 . . . . . . . . . . . . . . . $94 $21 $ – $115
At December 31, 2006, no marketable securities were in an unrealized loss position for more thantwelve months.
The Company’s investments in private equity funds and other private investments are carried atcost and are evaluated for potential impairment when impairment indicators are present, or when anevent or change in circumstances has occurred, that may have a significant adverse effect on the fair valueof the investment. Impairment indicators the Company considers include the following: whether therehas been a significant deterioration in earnings performance, asset quality or business prospects; asignificant adverse change in the regulatory, economic or technological environment; a significantadverse change in the general market condition or geographic area in which the investment operates;and, any bona fide offers to purchase for less than the carrying value. Since there is no active tradingmarket for these investments, they are for the most part illiquid. These investments, by their nature, canalso have a relatively higher degree of business risk, including financial leverage, than other financialinvestments. Future changes in market conditions, the future performance of the underlying investmentsor new information provided by private equity fund managers could affect the recorded values of suchinvestments and the amounts realized upon liquidation.
46
MASCO CORPORATION
NOTES TO CONSOLIDATED FINANCIAL STATEMENTS — (Continued)

E. FINANCIAL INVESTMENTS – (Continued)
At December 31, 2006, the Company had investments in 49 private equity funds, split betweenbuyout funds and venture capital funds, with a carrying value of $211 million. The 31 buyout funds,which constitute approximately 75 percent of the invested value, invest in established businesses and,other than the Heartland fund, no buyout funds have a concentration in a particular sector that isundergoing a fundamental change, such as the automotive-related market. The 18 venture capital funds,which constitute approximately 25 percent of the invested value, invest in start-up or smaller establishedbusinesses, principally in the areas of information technology, bio-technology and healthcare. Of the 49funds there are seven funds with a carrying value greater than $10 million that aggregate $112 million ofcarrying value. It is not practicable for the Company to estimate a fair value because the private equityfunds have no quoted market price and sufficient information is not readily available for the Company toutilize a valuation model to determine a fair value for each fund.
In November 2000, the Company reduced its common equity ownership in Metaldyne Corporation(“Metaldyne”) (formerly MascoTech, Inc.) through a recapitalization merger with an affiliate of Heart-land Industrial Partners, L.P. (“Heartland”), a private equity fund in which the Company had aremaining investment of $17 million at December 31, 2006 (representing less than five percent of thefund). The Company in that transaction retained six percent of the common equity of Metaldyne. AtDecember 31, 2006, the Company also held preferred stock of Metaldyne, which accrues dividends at theannual rate of 15 percent. Additionally, the Company owned an approximate 10 percent investment inTriMas Corporation (“TriMas”) common stock. Investments in Metaldyne and TriMas are accounted foron the cost basis.
During 2006, based upon a review of new information from the Heartland fund concerning fundinvestments and the continued deterioration of conditions in the automotive supplier and transportationproducts markets served by Metaldyne and TriMas, the Company determined that the decline in theestimated value of certain of its financial investments was other-than-temporary. Accordingly, in thesecond quarter of 2006, the Company recognized a non-cash, pre-tax impairment charge aggregating$78 million for its investments in Metaldyne ($40 million), TriMas ($6 million), the Heartland fund($29 million) and another fund ($3 million) which invested in automotive and transportation-relatedsuppliers, including Metaldyne and TriMas. Additionally, based upon the Company’s review, theCompany considered the decline in the fair value of certain of its other private equity fund investmentsand other investments to be other-than-temporary and, accordingly, recognized impairment charges of$13 million and $15 million in 2006 and 2005, respectively. In the fourth quarter of 2006, the Companyreceived new information related to its TriMas investment and determined that the additional decline inthe estimated value for this investment was other-than-temporary. Accordingly, in the fourth quarter of2006, the Company recognized an additional non-cash, pre-tax impairment charge of $10 million relatedto its investment in TriMas.
In 2005, the Company reviewed its portfolio of private equity funds and determined that there wereimpairment indicators for three funds. As of December 31, 2005, the Company determined that thedeclines in value were temporary based upon a review of the fund reports, analysis of investments in thefunds, analyst reports, industry information, length of time the funds have been in existence, theremaining amounts of available capital commitments that the fund manager could utilize to support itsinvestments and the Company’s ability and intent to hold the investments in these funds for a reasonableperiod of time sufficient for the forecasted recovery of fair value.
47
MASCO CORPORATION
NOTES TO CONSOLIDATED FINANCIAL STATEMENTS — (Continued)

E. FINANCIAL INVESTMENTS – (Concluded)
The Company’s investments in private equity funds, for which fair value was determined, withunrealized losses were as follows, in millions:
Fair Value Less than 12 Months Over 12 MonthsUnrealized Loss
December 31, 2006 . . . . . . . . . . . . . . $ – $ – $–December 31, 2005 . . . . . . . . . . . . . . $43 $19 $9
The remaining private equity investments in 2006 and 2005 with an aggregate carrying value of$211 million and $191 million, respectively, were not evaluated for impairment, as there were noindicators of impairment or identified events or changes in circumstances that would have a significantadverse effect on the fair value of the investment.
Subsequent Event: On January 11, 2007, the acquisition of Metaldyne by Asahi Tec Corporation, aJapanese automotive supplier, was finalized. The combined fair value of Asahi Tec common andpreferred stock received in exchange for the Company’s investment in Metaldyne (common andpreferred stock) approximates $74 million and the Company’s carrying value of the Metaldyne invest-ment was $57 million at December 31, 2006. As a result, a gain of approximately $17 million will berecognized in the first quarter of 2007. Any unrealized gains or losses subsequent to January 11, 2007, willbe recognized, net of tax, through shareholders’ equity, as a component of other comprehensive income,in the Company’s consolidated balance sheet beginning in the first quarter of 2007.
Income from financial investments, net, included in other, net, within other income (expense), net,and impairment charges for financial investments were as follows, in millions:
2006 2005 2004
Realized gains from marketable securities . . . . . . . . . . . . . . . . $ 14 $ 39 $ 70Realized losses from marketable securities . . . . . . . . . . . . . . . (10) (9) (20)Dividend income from marketable securities . . . . . . . . . . . . . 3 4 14Income from other investments, net . . . . . . . . . . . . . . . . . . . . . 27 68 42Dividend income from other investments . . . . . . . . . . . . . . . . 7 12 13
Income from financial investments, net . . . . . . . . . . . . . . $ 41 $114 $119
Impairment charges:Metaldyne Corporation . . . . . . . . . . . . . . . . . . . . . . . . . . . . . $ (40) $ – $ –Private equity funds . . . . . . . . . . . . . . . . . . . . . . . . . . . . . . . (40) (15) –TriMas Corporation . . . . . . . . . . . . . . . . . . . . . . . . . . . . . . . . (16) – –Other investments . . . . . . . . . . . . . . . . . . . . . . . . . . . . . . . . . (5) – –Marketable securities . . . . . . . . . . . . . . . . . . . . . . . . . . . . . . . – (30) (21)
Total impairment charges . . . . . . . . . . . . . . . . . . . . . . . . . $(101) $(45) $ (21)
The impairment charges, related to the Company’s financial investments, recognized during 2006,2005 and 2004 were based upon then-current estimates for the fair value of certain financial investments;such estimates could change in the near-term based upon future events and circumstances.
48
MASCO CORPORATION
NOTES TO CONSOLIDATED FINANCIAL STATEMENTS — (Continued)

F. DERIVATIVES
During 2003, the Company entered into interest rate swap agreements for the purpose of effectivelyconverting a portion of fixed-rate debt to variable-rate debt. In 2004, the Company terminated twointerest rate swaps relating to $850 million of fixed-rate debt. These swap agreements were accounted foras fair value hedges. The gain of approximately $45 million from the termination of these swaps is beingamortized as a reduction of interest expense over the remaining term of the debt, through July 2012.
In early 2004, the Company entered into two new interest rate swap agreements for the purpose ofeffectively converting a portion of fixed-rate debt to variable-rate debt. The derivative contracts are withtwo major creditworthy institutions, thereby minimizing the risk of credit loss. The interest rate swapagreements are designated as fair-value hedges, and the interest rate differential on interest rate swapsused to hedge existing debt is recognized as an adjustment to interest expense over the term of theagreement. The average variable interest rates are based upon LIBOR plus fixed adjustment factors. Theaverage effective rate on the interest rate swaps was 6.787% in 2006. At December 31, 2006, the interestrate swap agreements covered a notional amount of $850 million of the Company’s fixed-rate debt dueJuly 15, 2012 with an interest rate of 5.875%. The hedges are considered 100 percent effective.
In 2006, the Company recognized an increase in interest expense of $8 million related to this swapagreement, due to increasing interest rates. The amount recognized as a reduction of interest expense was$3 million and $22 million in 2005 and 2004, respectively.
At December 31, 2006, the Company, including certain European operations, had entered intoforeign currency forward contracts with notional amounts of $72 million and $51 million to manageexposure to currency fluctuations in the European euro and the Great Britain pound, respectively. AtDecember 31, 2005, the Company, including certain European operations, had entered into foreigncurrency forward contracts with notional amounts of $12 million, $10 million and $4 million to manageexposure to currency fluctuations in the United States dollar, Great Britain pound and various othercurrencies, respectively. Based upon year-end market prices, no asset or liability was recorded atDecember 31, 2006 and 2005, as the forward prices were substantially the same as the contract prices.Gains (losses) related to these contracts are recorded in the Company’s consolidated statements ofincome in other income (expense), net. The counterparties to the Company’s forward contracts are majorfinancial institutions. In the unlikely event that the counterparties fail to meet the terms of the foreigncurrency forward contracts, the Company’s exposure is limited to the aggregate foreign currency ratedifferential with such institutions.
G. PROPERTY AND EQUIPMENT
2006 2005At December 31
(In Millions)
Land and improvements. . . . . . . . . . . . . . . . . . . . . . . . . . . . . . . . . . $ 205 $ 188Buildings . . . . . . . . . . . . . . . . . . . . . . . . . . . . . . . . . . . . . . . . . . . . . . 1,069 974Machinery and equipment . . . . . . . . . . . . . . . . . . . . . . . . . . . . . . . . 2,566 2,356
3,840 3,518Less: Accumulated depreciation . . . . . . . . . . . . . . . . . . . . . . . . . . . . 1,477 1,345
Total . . . . . . . . . . . . . . . . . . . . . . . . . . . . . . . . . . . . . . . . . . . . . . . . $2,363 $2,173
49
MASCO CORPORATION
NOTES TO CONSOLIDATED FINANCIAL STATEMENTS — (Continued)
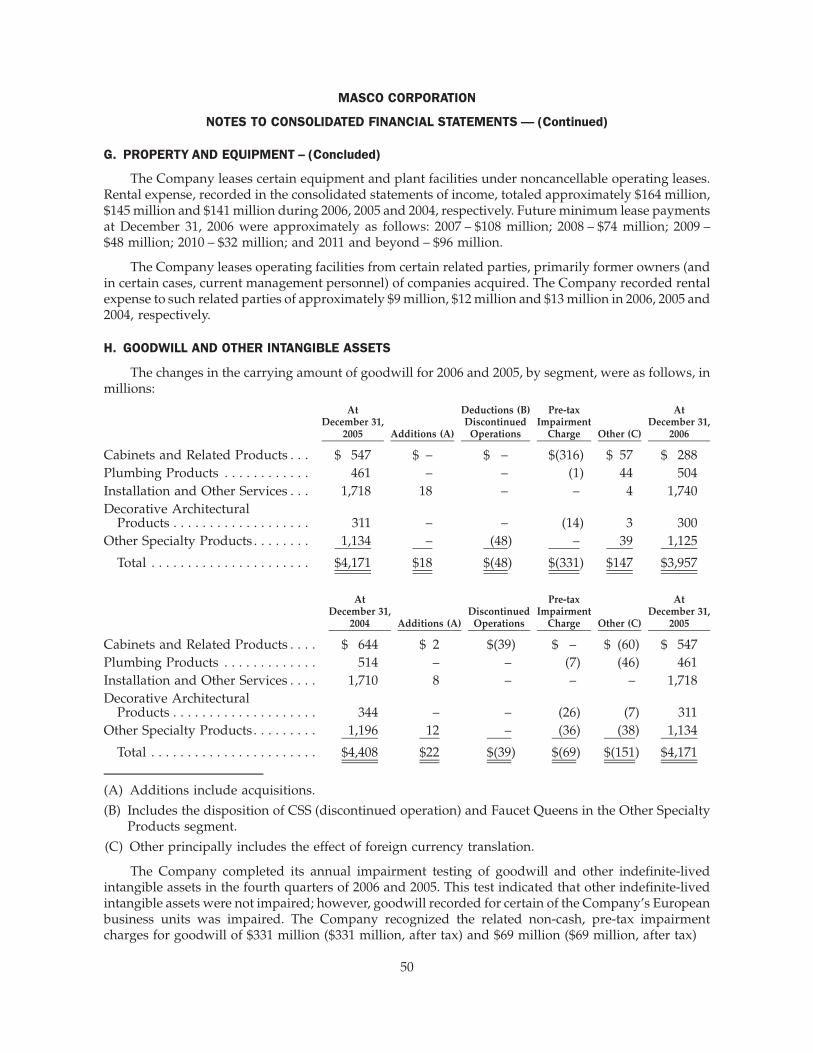
G. PROPERTY AND EQUIPMENT – (Concluded)
The Company leases certain equipment and plant facilities under noncancellable operating leases.Rental expense, recorded in the consolidated statements of income, totaled approximately $164 million,$145 million and $141 million during 2006, 2005 and 2004, respectively. Future minimum lease paymentsat December 31, 2006 were approximately as follows: 2007 – $108 million; 2008 – $74 million; 2009 –$48 million; 2010 – $32 million; and 2011 and beyond – $96 million.
The Company leases operating facilities from certain related parties, primarily former owners (andin certain cases, current management personnel) of companies acquired. The Company recorded rentalexpense to such related parties of approximately $9 million, $12 million and $13 million in 2006, 2005 and2004, respectively.
H. GOODWILL AND OTHER INTANGIBLE ASSETS
The changes in the carrying amount of goodwill for 2006 and 2005, by segment, were as follows, inmillions:
AtDecember 31,
2005 Additions (A)
Deductions (B)Discontinued
Operations
Pre-taxImpairment
Charge Other (C)
AtDecember 31,
2006
Cabinets and Related Products . . . $ 547 $ – $ – $(316) $ 57 $ 288Plumbing Products . . . . . . . . . . . . 461 – – (1) 44 504Installation and Other Services . . . 1,718 18 – – 4 1,740Decorative Architectural
Products . . . . . . . . . . . . . . . . . . . 311 – – (14) 3 300Other Specialty Products . . . . . . . . 1,134 – (48) – 39 1,125
Total . . . . . . . . . . . . . . . . . . . . . . $4,171 $18 $(48) $(331) $147 $3,957
AtDecember 31,
2004 Additions (A)Discontinued
Operations
Pre-taxImpairment
Charge Other (C)
AtDecember 31,
2005
Cabinets and Related Products . . . . $ 644 $ 2 $(39) $ – $ (60) $ 547Plumbing Products . . . . . . . . . . . . . 514 – – (7) (46) 461Installation and Other Services . . . . 1,710 8 – – – 1,718Decorative Architectural
Products . . . . . . . . . . . . . . . . . . . . 344 – – (26) (7) 311Other Specialty Products . . . . . . . . . 1,196 12 – (36) (38) 1,134
Total . . . . . . . . . . . . . . . . . . . . . . . $4,408 $22 $(39) $(69) $(151) $4,171
(A) Additions include acquisitions.
(B) Includes the disposition of CSS (discontinued operation) and Faucet Queens in the Other SpecialtyProducts segment.
(C) Other principally includes the effect of foreign currency translation.
The Company completed its annual impairment testing of goodwill and other indefinite-livedintangible assets in the fourth quarters of 2006 and 2005. This test indicated that other indefinite-livedintangible assets were not impaired; however, goodwill recorded for certain of the Company’s Europeanbusiness units was impaired. The Company recognized the related non-cash, pre-tax impairmentcharges for goodwill of $331 million ($331 million, after tax) and $69 million ($69 million, after tax)
50
MASCO CORPORATION
NOTES TO CONSOLIDATED FINANCIAL STATEMENTS — (Continued)

H. GOODWILL AND OTHER INTANGIBLE ASSETS – (Concluded)
for 2006 and 2005, respectively. The pre-tax impairment charge, recognized in 2006 in the Cabinets andRelated Products segment related to the Company’s European manufacturer of ready-to-assemblecabinets (Tvilum-Scanbirk); and reflects the long-term outlook for that business unit, including decliningdemand for certain products, as well as decreased operating profit margins.
Other indefinite-lived intangible assets were $246 million and $254 million at December 31, 2006 and2005, respectively, and principally included registered trademarks. The carrying value of the Company’sdefinite-lived intangible assets was $60 million at December 31, 2006 (net of accumulated amortization of$51 million) and $53 million at December 31, 2005 (net of accumulated amortization of $58 million) andprincipally included customer relationships and non-compete agreements, with a weighted averageamortization period of 13 years and 12 years in 2006 and 2005, respectively. Amortization expense relatedto the definite-lived intangible assets was $10 million, $22 million and $20 million in 2006, 2005 and 2004,respectively.
At December 31, 2006, amortization expense related to the definite-lived intangible assets duringeach of the next five years was as follows: 2007 – $10 million; 2008 – $8 million; 2009 – $7 million; 2010 –$7 million; and 2011 - $5 million.
I. OTHER ASSETS
2006 2005At December 31
(In Millions)
Financial investments (Note E) . . . . . . . . . . . . . . . . . . . . . . . . . . . . . . $379 $529In-store displays, net . . . . . . . . . . . . . . . . . . . . . . . . . . . . . . . . . . . . . . 72 81Debenture expense . . . . . . . . . . . . . . . . . . . . . . . . . . . . . . . . . . . . . . . 33 25Notes receivable . . . . . . . . . . . . . . . . . . . . . . . . . . . . . . . . . . . . . . . . . 14 14Prepaid benefit cost (Note N) . . . . . . . . . . . . . . . . . . . . . . . . . . . . . . . 1 43Other . . . . . . . . . . . . . . . . . . . . . . . . . . . . . . . . . . . . . . . . . . . . . . . . . . 85 93
Total . . . . . . . . . . . . . . . . . . . . . . . . . . . . . . . . . . . . . . . . . . . . . . . . . $584 $785
In-store displays are amortized using the straight-line method over the expected useful life of threeyears; the Company recognized amortization expense related to in-store displays of $55 million,$63 million and $51 million in 2006, 2005 and 2004, respectively.
51
MASCO CORPORATION
NOTES TO CONSOLIDATED FINANCIAL STATEMENTS — (Continued)

J. ACCRUED LIABILITIES
2006 2005At December 31
(In Millions)
Salaries, wages and commissions . . . . . . . . . . . . . . . . . . . . . . . . . . . $ 218 $ 201Insurance . . . . . . . . . . . . . . . . . . . . . . . . . . . . . . . . . . . . . . . . . . . . . . 207 194Advertising and sales promotion . . . . . . . . . . . . . . . . . . . . . . . . . . . 165 140Warranty (Note T) . . . . . . . . . . . . . . . . . . . . . . . . . . . . . . . . . . . . . . . 120 105Dividends payable . . . . . . . . . . . . . . . . . . . . . . . . . . . . . . . . . . . . . . 86 83Interest . . . . . . . . . . . . . . . . . . . . . . . . . . . . . . . . . . . . . . . . . . . . . . . . 76 74Employee retirement plans . . . . . . . . . . . . . . . . . . . . . . . . . . . . . . . . 49 216Income taxes . . . . . . . . . . . . . . . . . . . . . . . . . . . . . . . . . . . . . . . . . . . 61 61Property, payroll and other taxes . . . . . . . . . . . . . . . . . . . . . . . . . . . 46 57Litigation . . . . . . . . . . . . . . . . . . . . . . . . . . . . . . . . . . . . . . . . . . . . . . 8 10Other . . . . . . . . . . . . . . . . . . . . . . . . . . . . . . . . . . . . . . . . . . . . . . . . . 92 84
Total . . . . . . . . . . . . . . . . . . . . . . . . . . . . . . . . . . . . . . . . . . . . . . . . $1,128 $1,225
K. DEBT
2006 2005At December 31
(In Millions)
Notes and debentures:6.75%, due Mar. 15, 2006 . . . . . . . . . . . . . . . . . . . . . . . . . . . . . . . . $ – $ 8004.625%, due Aug. 15, 2007. . . . . . . . . . . . . . . . . . . . . . . . . . . . . . . 300 3005.75%, due Oct. 15, 2008 . . . . . . . . . . . . . . . . . . . . . . . . . . . . . . . . 100 1005.875%, due July 15, 2012 . . . . . . . . . . . . . . . . . . . . . . . . . . . . . . . 850 8507.125%, due Aug. 15, 2013. . . . . . . . . . . . . . . . . . . . . . . . . . . . . . . 200 2004.8%, due June 15, 2015 . . . . . . . . . . . . . . . . . . . . . . . . . . . . . . . . . 500 5006.125%, due Oct. 3, 2016 . . . . . . . . . . . . . . . . . . . . . . . . . . . . . . . . 1,000 –6.625%, due Apr. 15, 2018 . . . . . . . . . . . . . . . . . . . . . . . . . . . . . . . 114 1147.75%, due Aug. 1, 2029 . . . . . . . . . . . . . . . . . . . . . . . . . . . . . . . . 296 2966.5%, due Aug. 15, 2032 . . . . . . . . . . . . . . . . . . . . . . . . . . . . . . . . 300 300Zero Coupon Convertible Senior Notes due 2031 (accreted
value) . . . . . . . . . . . . . . . . . . . . . . . . . . . . . . . . . . . . . . . . . . . . . 874 848Floating-Rate Notes, due Mar. 9, 2007 . . . . . . . . . . . . . . . . . . . . . 300 300Notes payable to banks . . . . . . . . . . . . . . . . . . . . . . . . . . . . . . . . . – –Other . . . . . . . . . . . . . . . . . . . . . . . . . . . . . . . . . . . . . . . . . . . . . . . 145 139
4,979 4,747Less: Current portion . . . . . . . . . . . . . . . . . . . . . . . . . . . . . . . . . . . . 1,446 832
Total Long-term debt . . . . . . . . . . . . . . . . . . . . . . . . . . . . . . . . . $3,533 $3,915
All of the notes and debentures above are senior indebtedness and, other than the 6.625% notes due2018 and the 7.75% notes due 2029, are redeemable at the Company’s option.
52
MASCO CORPORATION
NOTES TO CONSOLIDATED FINANCIAL STATEMENTS — (Continued)
K. DEBT – (Continued)
During 2006, the Company retired $800 million of 6.75% notes due March 2006. During 2006, theCompany reclassified to current liabilities from long-term debt, $823 million of Zero Coupon SeniorConvertible Notes, as the next put option date was January 20, 2007, $300 million of floating-rate notesdue March 2007 and $300 million of 4.625% notes due August 2007. On October 3, 2006, the Companyissued $1 billion of fixed-rate 6.125% notes due 2016, resulting in net proceeds of $988 million. The Noteoffering was in anticipation of the 2007 debt maturities, including the put option related to the ZeroCoupon Convertible Senior Notes.
In July 2001, the Company issued $1.9 billion principal amount at maturity of Zero CouponConvertible Senior Notes due 2031 (“Old Notes”), resulting in gross proceeds of $750 million. Theissue price per Note was $394.45 per $1,000 principal amount at maturity, which represented a yield tomaturity of 3.125% compounded semi-annually. In December 2004, the Company completed anexchange of the outstanding Old Notes for Zero Coupon Convertible Senior Notes Series B due July2031 (“New Notes” or “Notes”). The Company exchanged the Notes as a result of EITF No. 04-08 thatwould have required the total number of shares underlying the Old Notes to be included in thecalculation of diluted earnings per common share, whether or not the Old Notes were convertibleaccording to their terms. At December 31, 2006, over 99 percent of the outstanding Notes were NewNotes.
The New Notes have substantially the same terms as the Old Notes, except for the form ofconsideration payable upon conversion. Upon conversion of the Old Notes, the Company would havedelivered shares of its common stock at the applicable conversion rate. Upon conversion of the NewNotes, the Company will pay the principal return, equal to the lesser of (1) the accreted value of the Notesin only cash, and (2) the conversion value, as defined, which will be settled in cash or shares of Companycommon stock, or a combination of both, at the option of the Company. Similar to the Old Notes, the NewNotes are convertible if the average price of Company common stock for the 20 days immediately prior tothe conversion date exceeds 1181⁄3%, declining by 1/3% each year thereafter, of the accreted value of theNew Notes ($467.03 per $1,000 principal amount at maturity as of December 31, 2006) divided by theconversion rate of 12.7317 shares for each $1,000 principal amount at maturity of the New Notes or$43.41 per common share at December 31, 2006. The New Notes, similar to the Old Notes, also becomeconvertible if the Company’s credit rating is reduced to below investment grade, or if certain actions aretaken by the Company.
Similar to the Old Notes, the Company will not pay interest in cash on the Notes prior to maturity,except in certain circumstances, including possible contingent interest payments that are not expected tobe material. Similar to the Old Notes, holders of the New Notes have the option to require that the Notesbe repurchased by the Company on January 20, 2007, July 20, 2011 and every five years thereafter.
At December 31, 2006, the Company had a $2.0 billion 5-Year Revolving Credit Agreement with agroup of banks syndicated in the United States and internationally, which expires in February 2011. Thisagreement allows for borrowings denominated in U.S. dollars or European euros with interest payablebased upon various floating-rate options as selected by the Company. There were no borrowings underthe 5-Year Revolving Credit Agreement at December 31, 2006 and 2005.
In February 2006, the Company amended the terms of the $2.0 billion 5-Year Revolving CreditAgreement; the amendment primarily affected the requirement for the Company to maintain certainlevels of net worth. At December 31, 2006, the Company’s net worth exceeded such requirement by$1.1 billion. The 5-Year Revolving Credit Agreement, as amended, also contains limitations on additionalborrowings; at December 31, 2006, the Company had additional borrowing capacity, subject to avail-ability, of up to $1.7 billion.
53
MASCO CORPORATION
NOTES TO CONSOLIDATED FINANCIAL STATEMENTS — (Continued)

K. DEBT – (Concluded)
At December 31, 2006, the maturities of long-term debt during each of the next five years were asfollows: 2007 – $1,447 million (including $825 million related to the Zero Coupon Senior ConvertibleNotes, the accreted value at the next put option date of January 20, 2007); 2008 – $112 million; 2009 –$13 million; 2010 – $2 million; and 2011 – $52 million.
At December 31, 2006, the amount of debt and equity securities issuable under the Company’sunallocated shelf registration statement with the Securities and Exchange Commission was $500 million.
Interest paid was $238 million, $246 million and $219 million in 2006, 2005 and 2004, respectively.
Subsequent Event: On January 20, 2007, holders of $1.8 billion (94 percent) principal amount atmaturity of the Zero Coupon Convertible Senior Notes (“Notes”) required the Company to repurchasetheir Notes at a cash value of $825 million. As a result of this repurchase, a $93 million deferred incometax liability will be payable in June 2007. Subsequent to the repurchase, there were outstanding$108 million principal amount at maturity of such Notes, with an accreted value of $51 million, whichhas been included in long-term debt at December 31, 2006, as the next put option date is July 20, 2011. TheCompany may, at any time on or after January 25, 2007, redeem all or part of the Notes at their accretedvalue.
L. MINORITY INTEREST
The Company owned 64 percent of Hansgrohe AG. The aggregate minority interest, net of divi-dends, of $108 million and $89 million at December 31, 2006 and 2005, respectively, was recorded indeferred income taxes and other liabilities on the Company’s consolidated balance sheets.
M. STOCK-BASED COMPENSATION
Effective January 1, 2003, the Company adopted SFAS No. 148. Accordingly, options granted,modified or settled subsequent to January 1, 2003 have been accounted for using the fair value methodand options granted prior to January 1, 2003 were accounted for using the intrinsic value method.
Effective January 1, 2006, the Company adopted SFAS No. 123R, using the Modified ProspectiveApplication (“MPA”) method. The MPA method requires the Company to recognize expense forunvested stock options that were awarded prior to January 1, 2003 through the remaining vestingperiods. The MPA method does not require the restatement of prior-year information. In accordance withSFAS No. 123R, the Company utilized the shortcut method to determine the tax windfall pool associatedwith stock options at December 31, 2006.
The Company’s 2005 Long Term Stock Incentive Plan (the “2005 Plan”) replaced the 1991 Long TermStock Incentive Plan (the “1991 Plan”) in May 2005 and provides for the issuance of stock-basedincentives in various forms. At December 31, 2006, outstanding stock-based incentives were in theform of restricted long-term stock awards, stock options, phantom stock awards and stock appreciationrights. Additionally, the Company’s 1997 Non-Employee Directors Stock Plan (the “1997 Plan”) providesfor the payment of part of the compensation to non-employee Directors in Company common stock.
54
MASCO CORPORATION
NOTES TO CONSOLIDATED FINANCIAL STATEMENTS — (Continued)

M. STOCK-BASED COMPENSATION – (Continued)
Pre-tax compensation expense and the related income tax benefit, related to these stock-based incentiveswere as follows, in millions:
2006 2005 2004
Restricted long-term stock awards . . . . . . . . . . . . . . . . . . . . . . . . . . . . . . . $ 52 $44 $39Stock options . . . . . . . . . . . . . . . . . . . . . . . . . . . . . . . . . . . . . . . . . . . . . . . . 46 29 21Phantom stock awards and stock appreciation rights . . . . . . . . . . . . . . . . 2 2 17
Total . . . . . . . . . . . . . . . . . . . . . . . . . . . . . . . . . . . . . . . . . . . . . . . . . . . . . $100 $75 $77
Income tax benefit . . . . . . . . . . . . . . . . . . . . . . . . . . . . . . . . . . . . . . . . . . . . $ 37 $28 $28
In 2006, the Company recognized pre-tax expense of $15 million ($9 million or $.02 per commonshare, after tax), related to the adoption of SFAS No. 123R. In addition, during 2006, the Companyrecognized expense of $3 million (net of income tax benefit of $2 million) as a cumulative effect ofaccounting change, net, related to the adoption of SFAS No. 123R and the change from the intrinsic valuemethod to the fair value method of accounting for stock appreciation rights.
At December 31, 2006, a total of 19,975,100 shares and 303,400 shares of Company common stockwere available under the 2005 Plan and the 1997 Plan, respectively, for the granting of stock options andother restricted long-term stock incentive awards.
Restricted Long-Term Stock Awards
Long-term stock awards are granted to key employees and non-employee Directors of the Companyand do not cause net share dilution inasmuch as the Company continues the practice of repurchasing andretiring an equal number of shares on the open market.
The Company’s long-term stock award activity was as follows, shares in millions:2006 2005 2004
Unvested stock award shares at January 1 . . . . . . . . . . . . . . . . . . . . . . . . . 9 10 10Weighted average grant date fair value . . . . . . . . . . . . . . . . . . . . . . . . . . $25 $23 $21Stock award shares granted . . . . . . . . . . . . . . . . . . . . . . . . . . . . . . . . . . . 2 2 2Weighted average grant date fair value . . . . . . . . . . . . . . . . . . . . . . . . . . $29 $36 $28Stock award shares vested . . . . . . . . . . . . . . . . . . . . . . . . . . . . . . . . . . . . 2 2 2Weighted average grant date fair value . . . . . . . . . . . . . . . . . . . . . . . . . . $24 $21 $20Stock award shares forfeited. . . . . . . . . . . . . . . . . . . . . . . . . . . . . . . . . . . – 1 –Weighted average grant date fair value . . . . . . . . . . . . . . . . . . . . . . . . . . $27 $24 $22
Unvested stock award shares at December 31 . . . . . . . . . . . . . . . . . . . . . . 9 9 10Weighted average grant date fair value . . . . . . . . . . . . . . . . . . . . . . . . . . $27 $25 $23
The Company continues to measure compensation expense for stock awards at the market price ofthe Company’s common stock at the grant date. Effective January 1, 2006, such expense is beingrecognized ratably over the shorter of the vesting period of the stock awards, typically 10 years (exceptfor stock awards held by grantees age 66 or older, which vest over five years), or the length of time untilthe grantee becomes retirement-eligible at age 65. For stock awards granted prior to January 1, 2006, suchexpense is being recognized over the vesting period of the stock awards, typically 10 years, or forexecutive grantees that are, or will become, retirement-eligible during the vesting period, the expense isbeing recognized over five years. At December 31, 2006, the Company had remaining $21 million of
55
MASCO CORPORATION
NOTES TO CONSOLIDATED FINANCIAL STATEMENTS — (Continued)

M. STOCK-BASED COMPENSATION – (Continued)
unrecognized compensation expense related to stock awards granted prior to January 1, 2006 to granteesthat will or have become retirement-eligible before such awards will have been fully expensed; suchexpense will be recognized over the next six years, or immediately upon a grantee’s retirement.
There was $185 million of unrecognized compensation expense, which was included as a reductionof shareholders’ equity, at December 31, 2005; such expense was reclassified to common stock andretained earnings on January 1, 2006 in accordance with SFAS No. 123R. At January 1, 2006, the Companyestimated a forfeiture rate for long-term stock awards and applied that rate to all previously expensedstock awards; such application did not result in a change in the expense to be recorded as a cumulativeeffect of accounting change. At December 31, 2006, there was $195 million of unrecognized compensationexpense related to unvested stock awards; such awards had a weighted average remaining vestingperiod of seven years.
The total market value (at the vesting date) of stock award shares which vested during 2006, 2005and 2004 was $51 million, $60 million and $45 million, respectively.
Stock Options
Stock options are granted to key employees and non-employee Directors of the Company. Theexercise price equals the market price of the Company’s common stock at the grant date. These optionsgenerally become exercisable (vest ratably) over five years beginning on the first anniversary from thedate of grant and expire no later than 10 years after the grant date. The 2005 Plan does not permit thegranting of restoration stock options, except for restoration options resulting from options previouslygranted under the 1991 Plan. Restoration stock options become exercisable six months from the date ofgrant.
The Company granted 4,317,000 of stock option shares, including restoration stock option shares,during 2006 with a grant date exercise price range of $26 to $33 per share. During 2006, 922,000 stockoption shares were forfeited (including options that expired unexercised).
56
MASCO CORPORATION
NOTES TO CONSOLIDATED FINANCIAL STATEMENTS — (Continued)

M. STOCK-BASED COMPENSATION – (Continued)
The Company’s stock option activity was as follows, shares in millions:
2006 2005 2004
Option shares outstanding at January1 . . . . . . . . . . . . . . . . . . . . . . . . . . . . . . 27 26 26Weighted average exercise price . . . . . $ 26 $ 25 $ 22
Option shares granted, includingrestoration options . . . . . . . . . . . . . . . . 4 4 6Weighted average exercise price . . . . . $ 27 $ 31 $ 31
Option shares exercised . . . . . . . . . . . . . 4 2 5Aggregate intrinsic value on date of
exercise (A) . . . . . . . . . . . . . . . . . . . . $ 27 million $ 32 million $ 69 millionWeighted average exercise price . . . . . $ 25 $ 20 $ 20
Option shares forfeited . . . . . . . . . . . . . . 1 1 1Weighted average exercise price . . . . . $ 30 $ 25 $ 23
Option shares outstanding atDecember 31 . . . . . . . . . . . . . . . . . . . . 26 27 26Weighted average exercise price . . . . . $ 26 $ 26 $ 25Weighted average remaining option
term (in years) . . . . . . . . . . . . . . . . . 6 6 6Option shares vested and expected to
vest at December 31. . . . . . . . . . . . . . . 26 27 26Weighted average exercise price . . . . . $ 26 $ 26 $ 25Aggregate intrinsic value (A) . . . . . . . $106 million $124 million $310 millionWeighted average remaining option
term (in years) . . . . . . . . . . . . . . . . . 6 6 6Option shares exercisable (vested) at
December 31 . . . . . . . . . . . . . . . . . . . . 15 16 10Weighted average exercise price . . . . . $ 25 $ 25 $ 24Aggregate intrinsic value (A) . . . . . . . $ 75 million $ 93 million $131 millionWeighted average remaining option
term (in years) . . . . . . . . . . . . . . . . . 5 4 4
(A) Aggregate intrinsic value is calculated using the Company’s stock price at each respective date, lessthe exercise price (grant date price) multiplied by the number of shares.
The Company measures compensation expense for stock options using a Black-Scholes optionpricing model. For stock options granted subsequent to January 1, 2006, such expense is being recognizedratably over the shorter of the vesting period of the stock options, typically five years, or the length oftime until the grantee becomes retirement-eligible at age 65. The expense for unvested stock options atJanuary 1, 2006 is based upon the grant date fair value of those options as calculated using a Black-Scholes option pricing model for pro forma disclosures under SFAS No. 123. For stock options grantedprior to January 1, 2006, such expense is being recognized ratably over the vesting period of the stockoptions, typically five years. At December 31, 2006, the Company had $16 million of unrecognizedcompensation expense related to stock options granted prior to January 1, 2006 to grantees that will orhave become retirement-eligible before such options will have been fully expensed; such expense will berecognized over the next four years, or immediately upon a grantee’s retirement.
57
MASCO CORPORATION
NOTES TO CONSOLIDATED FINANCIAL STATEMENTS — (Continued)
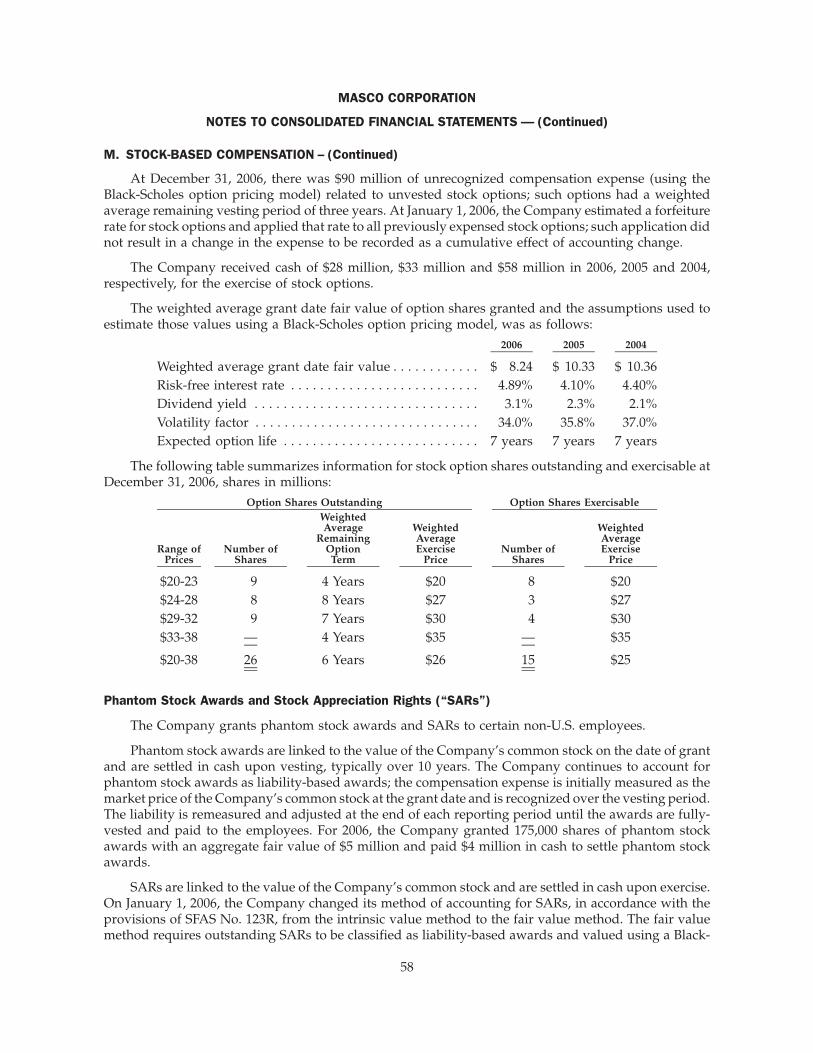
M. STOCK-BASED COMPENSATION – (Continued)
At December 31, 2006, there was $90 million of unrecognized compensation expense (using theBlack-Scholes option pricing model) related to unvested stock options; such options had a weightedaverage remaining vesting period of three years. At January 1, 2006, the Company estimated a forfeiturerate for stock options and applied that rate to all previously expensed stock options; such application didnot result in a change in the expense to be recorded as a cumulative effect of accounting change.
The Company received cash of $28 million, $33 million and $58 million in 2006, 2005 and 2004,respectively, for the exercise of stock options.
The weighted average grant date fair value of option shares granted and the assumptions used toestimate those values using a Black-Scholes option pricing model, was as follows:
2006 2005 2004
Weighted average grant date fair value . . . . . . . . . . . . $ 8.24 $ 10.33 $ 10.36Risk-free interest rate . . . . . . . . . . . . . . . . . . . . . . . . . . 4.89% 4.10% 4.40%Dividend yield . . . . . . . . . . . . . . . . . . . . . . . . . . . . . . . 3.1% 2.3% 2.1%Volatility factor . . . . . . . . . . . . . . . . . . . . . . . . . . . . . . . 34.0% 35.8% 37.0%Expected option life . . . . . . . . . . . . . . . . . . . . . . . . . . . 7 years 7 years 7 years
The following table summarizes information for stock option shares outstanding and exercisable atDecember 31, 2006, shares in millions:
Range ofPrices
Number ofShares
WeightedAverage
RemainingOptionTerm
WeightedAverageExercise
PriceNumber of
Shares
WeightedAverageExercise
Price
Option Shares Outstanding Option Shares Exercisable
$20-23 9 4 Years $20 8 $20$24-28 8 8 Years $27 3 $27$29-32 9 7 Years $30 4 $30$33-38 — 4 Years $35 — $35
$20-38 26 6 Years $26 15 $25
Phantom Stock Awards and Stock Appreciation Rights (“SARs”)
The Company grants phantom stock awards and SARs to certain non-U.S. employees.
Phantom stock awards are linked to the value of the Company’s common stock on the date of grantand are settled in cash upon vesting, typically over 10 years. The Company continues to account forphantom stock awards as liability-based awards; the compensation expense is initially measured as themarket price of the Company’s common stock at the grant date and is recognized over the vesting period.The liability is remeasured and adjusted at the end of each reporting period until the awards are fully-vested and paid to the employees. For 2006, the Company granted 175,000 shares of phantom stockawards with an aggregate fair value of $5 million and paid $4 million in cash to settle phantom stockawards.
SARs are linked to the value of the Company’s common stock and are settled in cash upon exercise.On January 1, 2006, the Company changed its method of accounting for SARs, in accordance with theprovisions of SFAS No. 123R, from the intrinsic value method to the fair value method. The fair valuemethod requires outstanding SARs to be classified as liability-based awards and valued using a Black-
58
MASCO CORPORATION
NOTES TO CONSOLIDATED FINANCIAL STATEMENTS — (Continued)
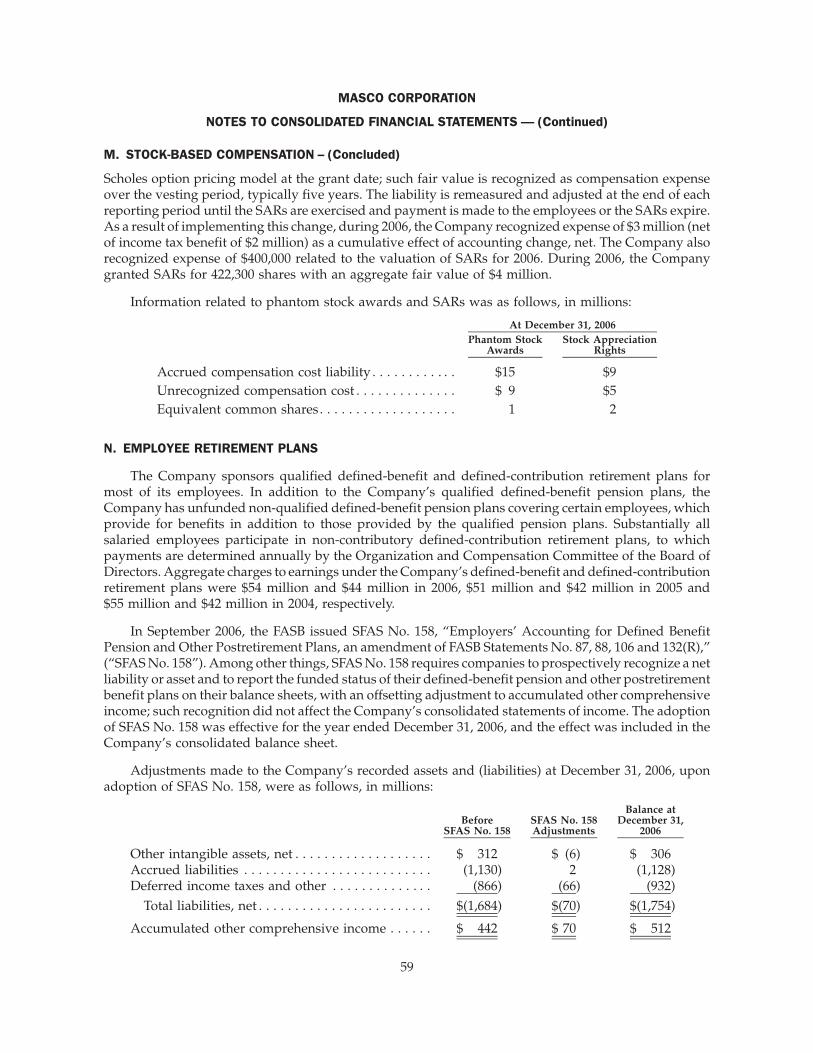
M. STOCK-BASED COMPENSATION – (Concluded)
Scholes option pricing model at the grant date; such fair value is recognized as compensation expenseover the vesting period, typically five years. The liability is remeasured and adjusted at the end of eachreporting period until the SARs are exercised and payment is made to the employees or the SARs expire.As a result of implementing this change, during 2006, the Company recognized expense of $3 million (netof income tax benefit of $2 million) as a cumulative effect of accounting change, net. The Company alsorecognized expense of $400,000 related to the valuation of SARs for 2006. During 2006, the Companygranted SARs for 422,300 shares with an aggregate fair value of $4 million.
Information related to phantom stock awards and SARs was as follows, in millions:
Phantom StockAwards
Stock AppreciationRights
At December 31, 2006
Accrued compensation cost liability . . . . . . . . . . . . $15 $9Unrecognized compensation cost . . . . . . . . . . . . . . $ 9 $5Equivalent common shares. . . . . . . . . . . . . . . . . . . 1 2
N. EMPLOYEE RETIREMENT PLANS
The Company sponsors qualified defined-benefit and defined-contribution retirement plans formost of its employees. In addition to the Company’s qualified defined-benefit pension plans, theCompany has unfunded non-qualified defined-benefit pension plans covering certain employees, whichprovide for benefits in addition to those provided by the qualified pension plans. Substantially allsalaried employees participate in non-contributory defined-contribution retirement plans, to whichpayments are determined annually by the Organization and Compensation Committee of the Board ofDirectors. Aggregate charges to earnings under the Company’s defined-benefit and defined-contributionretirement plans were $54 million and $44 million in 2006, $51 million and $42 million in 2005 and$55 million and $42 million in 2004, respectively.
In September 2006, the FASB issued SFAS No. 158, “Employers’ Accounting for Defined BenefitPension and Other Postretirement Plans, an amendment of FASB Statements No. 87, 88, 106 and 132(R),”(“SFAS No. 158”). Among other things, SFAS No. 158 requires companies to prospectively recognize a netliability or asset and to report the funded status of their defined-benefit pension and other postretirementbenefit plans on their balance sheets, with an offsetting adjustment to accumulated other comprehensiveincome; such recognition did not affect the Company’s consolidated statements of income. The adoptionof SFAS No. 158 was effective for the year ended December 31, 2006, and the effect was included in theCompany’s consolidated balance sheet.
Adjustments made to the Company’s recorded assets and (liabilities) at December 31, 2006, uponadoption of SFAS No. 158, were as follows, in millions:
BeforeSFAS No. 158
SFAS No. 158Adjustments
Balance atDecember 31,
2006
Other intangible assets, net . . . . . . . . . . . . . . . . . . . $ 312 $ (6) $ 306Accrued liabilities . . . . . . . . . . . . . . . . . . . . . . . . . . (1,130) 2 (1,128)Deferred income taxes and other . . . . . . . . . . . . . . (866) (66) (932)
Total liabilities, net . . . . . . . . . . . . . . . . . . . . . . . . $(1,684) $(70) $(1,754)
Accumulated other comprehensive income . . . . . . $ 442 $ 70 $ 512
59
MASCO CORPORATION
NOTES TO CONSOLIDATED FINANCIAL STATEMENTS — (Continued)
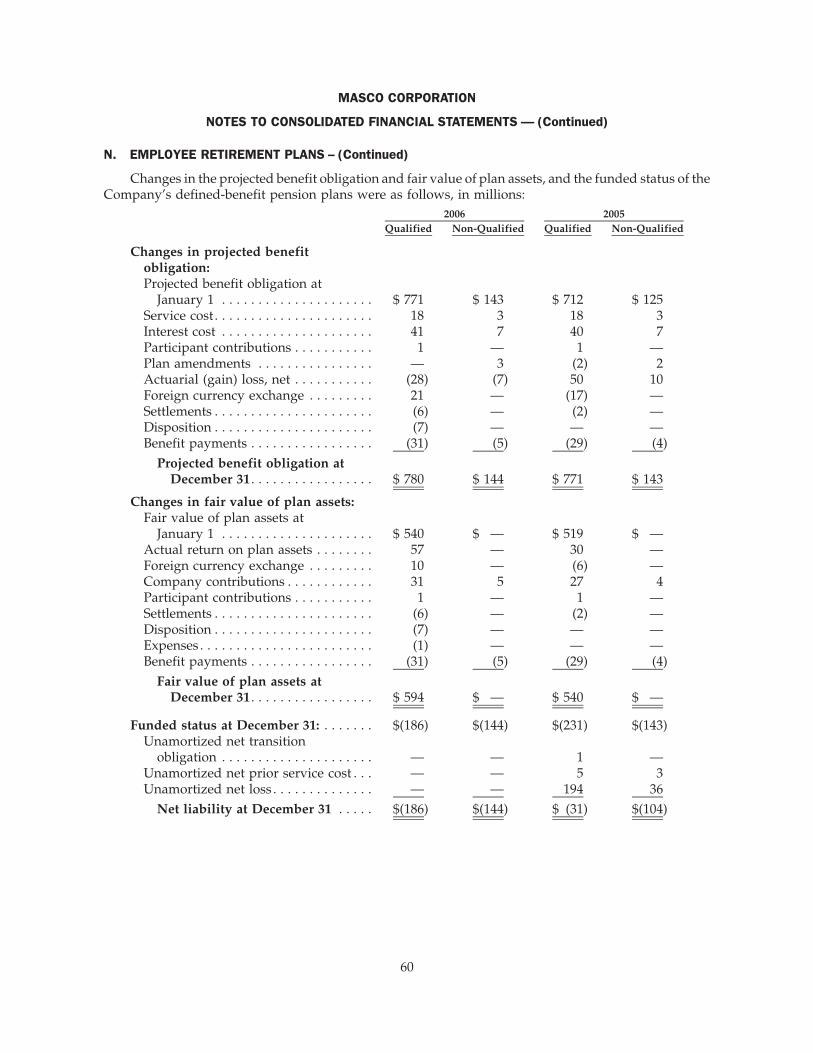
N. EMPLOYEE RETIREMENT PLANS – (Continued)
Changes in the projected benefit obligation and fair value of plan assets, and the funded status of theCompany’s defined-benefit pension plans were as follows, in millions:
Qualified Non-Qualified Qualified Non-Qualified2006 2005
Changes in projected benefitobligation:Projected benefit obligation at
January 1 . . . . . . . . . . . . . . . . . . . . . $ 771 $ 143 $ 712 $ 125Service cost . . . . . . . . . . . . . . . . . . . . . . 18 3 18 3Interest cost . . . . . . . . . . . . . . . . . . . . . 41 7 40 7Participant contributions . . . . . . . . . . . 1 — 1 —Plan amendments . . . . . . . . . . . . . . . . — 3 (2) 2Actuarial (gain) loss, net . . . . . . . . . . . (28) (7) 50 10Foreign currency exchange . . . . . . . . . 21 — (17) —Settlements . . . . . . . . . . . . . . . . . . . . . . (6) — (2) —Disposition . . . . . . . . . . . . . . . . . . . . . . (7) — — —Benefit payments . . . . . . . . . . . . . . . . . (31) (5) (29) (4)
Projected benefit obligation atDecember 31 . . . . . . . . . . . . . . . . . $ 780 $ 144 $ 771 $ 143
Changes in fair value of plan assets:Fair value of plan assets at
January 1 . . . . . . . . . . . . . . . . . . . . . $ 540 $ — $ 519 $ —Actual return on plan assets . . . . . . . . 57 — 30 —Foreign currency exchange . . . . . . . . . 10 — (6) —Company contributions . . . . . . . . . . . . 31 5 27 4Participant contributions . . . . . . . . . . . 1 — 1 —Settlements . . . . . . . . . . . . . . . . . . . . . . (6) — (2) —Disposition . . . . . . . . . . . . . . . . . . . . . . (7) — — —Expenses . . . . . . . . . . . . . . . . . . . . . . . . (1) — — —Benefit payments . . . . . . . . . . . . . . . . . (31) (5) (29) (4)
Fair value of plan assets atDecember 31 . . . . . . . . . . . . . . . . . $ 594 $ — $ 540 $ —
Funded status at December 31: . . . . . . . $(186) $(144) $(231) $(143)Unamortized net transition
obligation . . . . . . . . . . . . . . . . . . . . . — — 1 —Unamortized net prior service cost . . . — — 5 3Unamortized net loss . . . . . . . . . . . . . . — — 194 36
Net liability at December 31 . . . . . $(186) $(144) $ (31) $(104)
60
MASCO CORPORATION
NOTES TO CONSOLIDATED FINANCIAL STATEMENTS — (Continued)

N. EMPLOYEE RETIREMENT PLANS – (Continued)
Amounts in the Company’s consolidated balance sheets were as follows, in millions:
Qualified Non-Qualified Qualified Non-QualifiedAt December 31, 2006 At December 31, 2005
Other assets . . . . . . . . . . . . . . . . . . . . . . . $ 1 $ — $ 43 $ —Other intangible assets, net . . . . . . . . . . . — — 9 3Accrued liabilities . . . . . . . . . . . . . . . . . . (2) (8) (74) (104)Deferred income taxes and other . . . . . . (185) (136) (146) (32)
Total net liability . . . . . . . . . . . . . . . . . $(186) $(144) $(168) $(133)
Amounts in accumulated other comprehensive income before income taxes were as follows, inmillions:
Qualified Non-Qualified Qualified Non-QualifiedAt December 31, 2006 At December 31, 2005
Net loss . . . . . . . . . . . . . . . . . . . . . . . . . . $149 $25 $137 $28Net transition obligation . . . . . . . . . . . . . 1 — — —Net prior service cost . . . . . . . . . . . . . . . 2 5 — —
Total . . . . . . . . . . . . . . . . . . . . . . . . . . . $152 $30 $137 $28
Information for defined-benefit pension plans with an accumulated benefit obligation in excess ofplan assets was as follows, in millions:
Qualified Non-Qualified Qualified Non-Qualified2006 2005
At December 31
Projected benefit obligation . . . . . . . . . . . $669 $144 $766 $143Accumulated benefit obligation . . . . . . . $613 $135 $712 $134Fair value of plan assets . . . . . . . . . . . . . $481 $ — $535 $ —
The projected benefit obligation was in excess of plan assets for all except one of the Company’squalified defined-benefit pension plans at December 31, 2006 and for all of the Company’s qualifieddefined-benefit pension plans at December 31, 2005.
61
MASCO CORPORATION
NOTES TO CONSOLIDATED FINANCIAL STATEMENTS — (Continued)

N. EMPLOYEE RETIREMENT PLANS – (Continued)
Net periodic pension cost for the Company’s defined-benefit pension plans were as follows, inmillions:
Qualified Non-Qualified Qualified Non-Qualified Qualified Non-Qualified2006 2005 2004
Service cost . . . . . . $ 19 $ 3 $ 18 $ 3 $ 16 $ 3Interest cost . . . . . . 41 7 40 7 39 7Expected return on
plan assets . . . . . (45) — (42) — (38) —Amortization of
prior servicecost . . . . . . . . . . . 1 2 1 2 1 2
Recognizedcurtailment(gain) loss . . . . . 1 (1) — — — —
Recognizedsettlement loss . . 1 — — — — —
Amortization ofnet loss . . . . . . . . 8 4 5 5 6 5
Net periodicpension cost . . . $ 26 $15 $ 22 $17 $ 24 $17
The Company expects to recognize $7 million and $1 million of net loss and prior service costs,respectively, from accumulated other comprehensive income into net periodic pension cost in 2007.
Plan Assets
The Company’s qualified defined-benefit pension plan weighted average asset allocation, which isbased upon fair value, was as follows:
2006 2005At December 31
Equity securities . . . . . . . . . . . . . . . . . . . . . . . . . . . . . . . . . . . . . . . . 69% 83%Debt securities . . . . . . . . . . . . . . . . . . . . . . . . . . . . . . . . . . . . . . . . . 4% 4%Other . . . . . . . . . . . . . . . . . . . . . . . . . . . . . . . . . . . . . . . . . . . . . . . . . 27% 13%
Total . . . . . . . . . . . . . . . . . . . . . . . . . . . . . . . . . . . . . . . . . . . . . . . . 100% 100%
The investment objectives of the Company’s qualified defined-benefit pension plans are: 1) to earn areturn, net of fees, greater than or equal to the expected long-term rate of return on plan assets; 2) todiversify the portfolio among various asset classes with the goal of reducing volatility of return andreducing principal risk; and 3) to maintain liquidity sufficient to meet Plan obligations. Long-term targetallocations are: equity securities (85%), debt securities (5%) and other investments (10%).
Plan assets included 1.4 million shares of Company common stock valued at $42 million and$43 million at December 31, 2006 and 2005, respectively.
62
MASCO CORPORATION
NOTES TO CONSOLIDATED FINANCIAL STATEMENTS — (Continued)
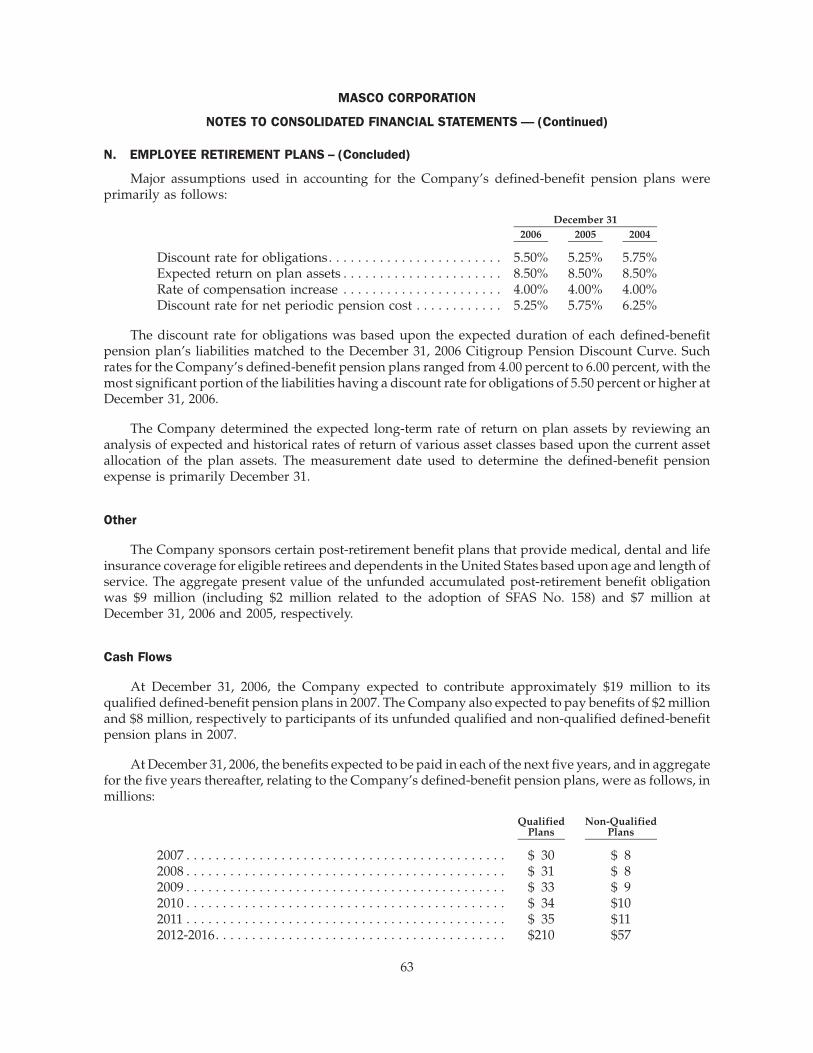
N. EMPLOYEE RETIREMENT PLANS – (Concluded)
Major assumptions used in accounting for the Company’s defined-benefit pension plans wereprimarily as follows:
2006 2005 2004December 31
Discount rate for obligations. . . . . . . . . . . . . . . . . . . . . . . . 5.50% 5.25% 5.75%Expected return on plan assets . . . . . . . . . . . . . . . . . . . . . . 8.50% 8.50% 8.50%Rate of compensation increase . . . . . . . . . . . . . . . . . . . . . . 4.00% 4.00% 4.00%Discount rate for net periodic pension cost . . . . . . . . . . . . 5.25% 5.75% 6.25%
The discount rate for obligations was based upon the expected duration of each defined-benefitpension plan’s liabilities matched to the December 31, 2006 Citigroup Pension Discount Curve. Suchrates for the Company’s defined-benefit pension plans ranged from 4.00 percent to 6.00 percent, with themost significant portion of the liabilities having a discount rate for obligations of 5.50 percent or higher atDecember 31, 2006.
The Company determined the expected long-term rate of return on plan assets by reviewing ananalysis of expected and historical rates of return of various asset classes based upon the current assetallocation of the plan assets. The measurement date used to determine the defined-benefit pensionexpense is primarily December 31.
Other
The Company sponsors certain post-retirement benefit plans that provide medical, dental and lifeinsurance coverage for eligible retirees and dependents in the United States based upon age and length ofservice. The aggregate present value of the unfunded accumulated post-retirement benefit obligationwas $9 million (including $2 million related to the adoption of SFAS No. 158) and $7 million atDecember 31, 2006 and 2005, respectively.
Cash Flows
At December 31, 2006, the Company expected to contribute approximately $19 million to itsqualified defined-benefit pension plans in 2007. The Company also expected to pay benefits of $2 millionand $8 million, respectively to participants of its unfunded qualified and non-qualified defined-benefitpension plans in 2007.
At December 31, 2006, the benefits expected to be paid in each of the next five years, and in aggregatefor the five years thereafter, relating to the Company’s defined-benefit pension plans, were as follows, inmillions:
QualifiedPlans
Non-QualifiedPlans
2007 . . . . . . . . . . . . . . . . . . . . . . . . . . . . . . . . . . . . . . . . . . . . $ 30 $ 82008 . . . . . . . . . . . . . . . . . . . . . . . . . . . . . . . . . . . . . . . . . . . . $ 31 $ 82009 . . . . . . . . . . . . . . . . . . . . . . . . . . . . . . . . . . . . . . . . . . . . $ 33 $ 92010 . . . . . . . . . . . . . . . . . . . . . . . . . . . . . . . . . . . . . . . . . . . . $ 34 $102011 . . . . . . . . . . . . . . . . . . . . . . . . . . . . . . . . . . . . . . . . . . . . $ 35 $112012-2016. . . . . . . . . . . . . . . . . . . . . . . . . . . . . . . . . . . . . . . . $210 $57
63
MASCO CORPORATION
NOTES TO CONSOLIDATED FINANCIAL STATEMENTS — (Continued)

O. SHAREHOLDERS’ EQUITY
In May 2006, the Company’s Board of Directors authorized the repurchase for retirement of up to50 million shares of the Company’s common stock in open-market transactions or otherwise, replacing aprevious Board of Directors authorization established in 2005. At December 31, 2006, the Company hadremaining authorization to repurchase up to 36 million shares of its common stock in open-markettransactions or otherwise. The Company repurchased and retired 29 million common shares in 2006 and31 million common shares in both 2005 and 2004 for cash aggregating $854 million, $986 million and$903 million in 2006, 2005 and 2004, respectively.
On the basis of amounts paid (declared), cash dividends per common share were $.86 ($.88) in 2006,$.78 ($.80) in 2005 and $.66 ($.68) in 2004, respectively. In 2006, the Company increased its quarterly cashdividend by 10 percent to $.22 per common share from $.20 per common share.
Accumulated Other Comprehensive Income
The Company’s total comprehensive income was as follows, in millions:
2006 2005 2004
Net income . . . . . . . . . . . . . . . . . . . . . . . . . . . . . . . . . . . . . . . $488 $ 940 $ 893Other comprehensive income (loss):
Cumulative translation adjustments . . . . . . . . . . . . . . . . . 208 (251) 214Unrealized loss on marketable securities, net . . . . . . . . . . (10) (10) (3)Minimum pension liability, net . . . . . . . . . . . . . . . . . . . . . 56 (38) (5)
Total. . . . . . . . . . . . . . . . . . . . . . . . . . . . . . . . . . . . . . . . . $742 $ 641 $1,099
The unrealized loss, net, on marketable securities is net of income tax benefit of $6 million, $5 millionand $2 million for 2006, 2005 and 2004, respectively. The minimum pension liability, net, is net of incometax (benefit) of $33 million, $(23) million and $(3) million for 2006, 2005 and 2004, respectively.
The components of accumulated other comprehensive income were as follows, in millions:
2006 2005At December 31
Cumulative translation adjustments . . . . . . . . . . . . . . . . . . . . . . . . . . $ 627 $ 419Unrealized gain on marketable securities, net . . . . . . . . . . . . . . . . . . 3 13Unrecognized prior service cost and net loss, net . . . . . . . . . . . . . . . (118) —Minimum pension liability, net . . . . . . . . . . . . . . . . . . . . . . . . . . . . . . — (104)
Accumulated other comprehensive income . . . . . . . . . . . . . . . . . $ 512 $ 328
The unrealized gain on marketable securities, net, is reported net of income tax of $2 million and$8 million at December 31, 2006 and 2005, respectively. The unrecognized prior service cost and net loss,net, is reported net of income tax benefit of $66 million at December 31, 2006. The minimum pensionliability, net, is reported net of income tax benefit of $61 million at December 31, 2005.
The realized gains, net, on marketable securities of $3 million, net of tax effect, for 2006 wereincluded in determining net income and were reclassified from accumulated other comprehensiveincome. There were no realized gains, net, on marketable securities to be reclassified from accumulatedother comprehensive income for 2005.
64
MASCO CORPORATION
NOTES TO CONSOLIDATED FINANCIAL STATEMENTS — (Continued)

P. SEGMENT INFORMATION
The Company’s reportable segments are as follows:
Cabinets and Related Products – principally includes assembled and ready-to-assemblekitchen and bath cabinets; home office workstations; entertainment centers; storage products;bookcases; and kitchen utility products.
Plumbing Products – principally includes faucets; plumbing fittings and valves; showerheadsand hand showers; bathtubs and shower enclosures; and spas.
Installation and Other Services – principally includes the sale, installation and distribution ofinsulation and other building products.
Decorative Architectural Products – principally includes paints and stains; and door, windowand other hardware.
Other Specialty Products – principally includes windows, window frame components andpatio doors; staple gun tackers, staples and other fastening tools; and hydronic radiators and heatconvectors.
The above products and services are sold and provided to the home improvement and homeconstruction markets through mass merchandisers, hardware stores, home centers, builders, distributorsand other outlets for consumers and contractors.
The Company’s operations are principally located in North America and Europe. The Company’scountry of domicile is the United States of America.
Corporate assets consist primarily of real property, equipment, cash and cash investments and otherinvestments.
The Company’s segments are based upon similarities in products and services and represent theaggregation of operating units, for which financial information is regularly evaluated by the Company’scorporate operating executives in determining resource allocation and assessing performance and isperiodically reviewed by the Board of Directors. Accounting policies for the segments are the same asthose for the Company. The Company primarily evaluates performance based upon operating profit and,other than general corporate expense, allocates specific corporate overhead to each segment. Incomeregarding the Behr litigation settlement has also been excluded from the evaluation of segment operatingprofit.
65
MASCO CORPORATION
NOTES TO CONSOLIDATED FINANCIAL STATEMENTS — (Continued)

P. SEGMENT INFORMATION – (Continued)
Information about the Company by segment and geographic area was as follows, in millions:
2006 2005 2004 2006 2005 2004 2006 2005 2004
Net Sales(1)(2)(3)(4)(5) Operating Profit(5)(9) Assets at December 31(6)(10)
The Company’s operations by segmentwere:
Cabinets and Related Products. . . . $ 3,286 $ 3,324 $ 3,065 $ 122 $ 515 $ 519 $ 1,860 $ 2,017 $ 2,272Plumbing Products . . . . . . . . . . . . 3,296 3,176 3,057 280 367 370 2,400 2,206 2,356Installation and Other Services . . . . 3,158 3,063 2,771 344 382 358 2,488 2,496 2,433Decorative Architectural
Products . . . . . . . . . . . . . . . . . . 1,777 1,681 1,610 357 252 269 1,007 976 1,086Other Specialty Products . . . . . . . . 1,261 1,325 1,280 225 229 225 2,089 2,128 2,224
Total . . . . . . . . . . . . . . . . . . . $12,778 $12,569 $11,783 $1,328 $1,745 $1,741 $ 9,844 $ 9,823 $10,371
The Company’s operations bygeographic area were:
North America . . . . . . . . . . . . . . . $10,537 $10,440 $ 9,673 $1,417 $1,567 $1,608 $ 7,390 $ 7,443 $ 7,145International, principally Europe . . 2,241 2,129 2,110 (89) 178 133 2,454 2,380 3,226
Total, as above . . . . . . . . . . . . $12,778 $12,569 $11,783 1,328 1,745 1,741 9,844 9,823 10,371
General corporate expense, net (7) . . . . (203) (192) (194)Gains on sale of corporate fixed assets, net . . . . . . . . . . . . . . . . . . . . — 8 7Income regarding litigation settlement (8) . . . . . . . . . . . . . . . . . . . . . 1 6 30
Operating profit, as reported . . . . . . . . . . . . . . . . . . . . . . . . . . . . . . 1,126 1,567 1,584Other income (expense), net . . . . . . . . . . . . . . . . . . . . . . . . . . . . . . (226) (165) (50)
Income from continuing operations before income taxes, minorityinterest and cumulative effect of accounting change, net . . . . . . . . . $ 900 $1,402 $1,534
Corporate assets . . . . . . . . . . . . . . . . . . . . . . . . . . . . . . . . . . . . . . . . . . . . . . . . . . . . . . . . . . 2,481 2,736 2,007Assets held for sale . . . . . . . . . . . . . . . . . . . . . . . . . . . . . . . . . . . . . . . . . . . . . . . . . . . . . . . . — — 163
Total assets . . . . . . . . . . . . . . . . . . . . . . . . . . . . . . . . . . . . . . . . . . . . . . . . . . . . . . . $12,325 $12,559 $12,541
2006 2005 2004 2006 2005 2004
Property AdditionsDepreciation andAmortization (5)
The Company’s operations by segment were:Cabinets and Related Products . . . . . . . . . . . . . . . . . . . . . . . . . . . . . . . . . $169 $ 77 $ 86 $ 60 $ 58 $ 55Plumbing Products . . . . . . . . . . . . . . . . . . . . . . . . . . . . . . . . . . . . . . . . . 101 76 69 89 71 68Installation and Other Services . . . . . . . . . . . . . . . . . . . . . . . . . . . . . . . . . 32 15 19 24 26 33Decorative Architectural Products . . . . . . . . . . . . . . . . . . . . . . . . . . . . . . . 17 47 36 19 19 18Other Specialty Products . . . . . . . . . . . . . . . . . . . . . . . . . . . . . . . . . . . . . 71 55 87 38 37 36
390 270 297 230 211 210Unallocated amounts, principally related to corporate assets . . . . . . . . . . . . 11 9 6 14 24 18Assets of dispositions (acquisitions), net . . . . . . . . . . . . . . . . . . . . . . . . . . — 3 7 — — —
Total . . . . . . . . . . . . . . . . . . . . . . . . . . . . . . . . . . . . . . . . . . . . . . . . $401 $282 $310 $244 $235 $228
66
MASCO CORPORATION
NOTES TO CONSOLIDATED FINANCIAL STATEMENTS — (Continued)
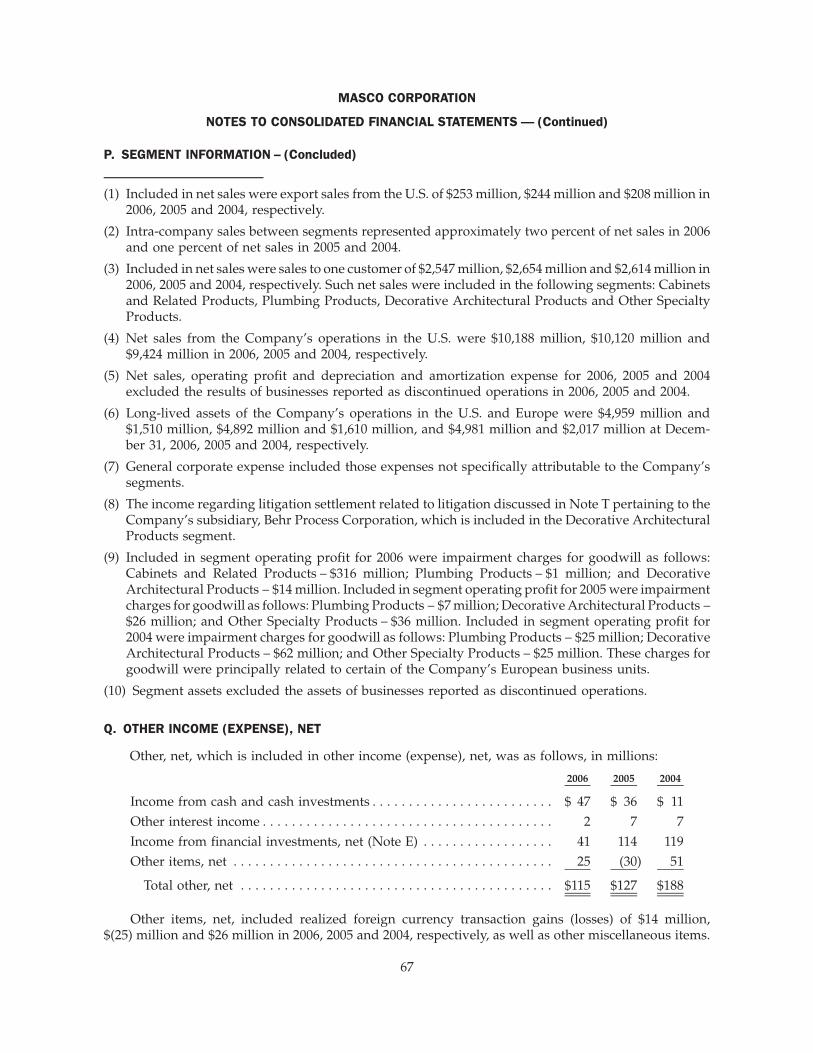
P. SEGMENT INFORMATION – (Concluded)
(1) Included in net sales were export sales from the U.S. of $253 million, $244 million and $208 million in2006, 2005 and 2004, respectively.
(2) Intra-company sales between segments represented approximately two percent of net sales in 2006and one percent of net sales in 2005 and 2004.
(3) Included in net sales were sales to one customer of $2,547 million, $2,654 million and $2,614 million in2006, 2005 and 2004, respectively. Such net sales were included in the following segments: Cabinetsand Related Products, Plumbing Products, Decorative Architectural Products and Other SpecialtyProducts.
(4) Net sales from the Company’s operations in the U.S. were $10,188 million, $10,120 million and$9,424 million in 2006, 2005 and 2004, respectively.
(5) Net sales, operating profit and depreciation and amortization expense for 2006, 2005 and 2004excluded the results of businesses reported as discontinued operations in 2006, 2005 and 2004.
(6) Long-lived assets of the Company’s operations in the U.S. and Europe were $4,959 million and$1,510 million, $4,892 million and $1,610 million, and $4,981 million and $2,017 million at Decem-ber 31, 2006, 2005 and 2004, respectively.
(7) General corporate expense included those expenses not specifically attributable to the Company’ssegments.
(8) The income regarding litigation settlement related to litigation discussed in Note T pertaining to theCompany’s subsidiary, Behr Process Corporation, which is included in the Decorative ArchitecturalProducts segment.
(9) Included in segment operating profit for 2006 were impairment charges for goodwill as follows:Cabinets and Related Products – $316 million; Plumbing Products – $1 million; and DecorativeArchitectural Products – $14 million. Included in segment operating profit for 2005 were impairmentcharges for goodwill as follows: Plumbing Products – $7 million; Decorative Architectural Products –$26 million; and Other Specialty Products – $36 million. Included in segment operating profit for2004 were impairment charges for goodwill as follows: Plumbing Products – $25 million; DecorativeArchitectural Products – $62 million; and Other Specialty Products – $25 million. These charges forgoodwill were principally related to certain of the Company’s European business units.
(10) Segment assets excluded the assets of businesses reported as discontinued operations.
Q. OTHER INCOME (EXPENSE), NET
Other, net, which is included in other income (expense), net, was as follows, in millions:
2006 2005 2004
Income from cash and cash investments . . . . . . . . . . . . . . . . . . . . . . . . . $ 47 $ 36 $ 11Other interest income . . . . . . . . . . . . . . . . . . . . . . . . . . . . . . . . . . . . . . . . 2 7 7Income from financial investments, net (Note E) . . . . . . . . . . . . . . . . . . 41 114 119Other items, net . . . . . . . . . . . . . . . . . . . . . . . . . . . . . . . . . . . . . . . . . . . . 25 (30) 51
Total other, net . . . . . . . . . . . . . . . . . . . . . . . . . . . . . . . . . . . . . . . . . . . $115 $127 $188
Other items, net, included realized foreign currency transaction gains (losses) of $14 million,$(25) million and $26 million in 2006, 2005 and 2004, respectively, as well as other miscellaneous items.
67
MASCO CORPORATION
NOTES TO CONSOLIDATED FINANCIAL STATEMENTS — (Continued)
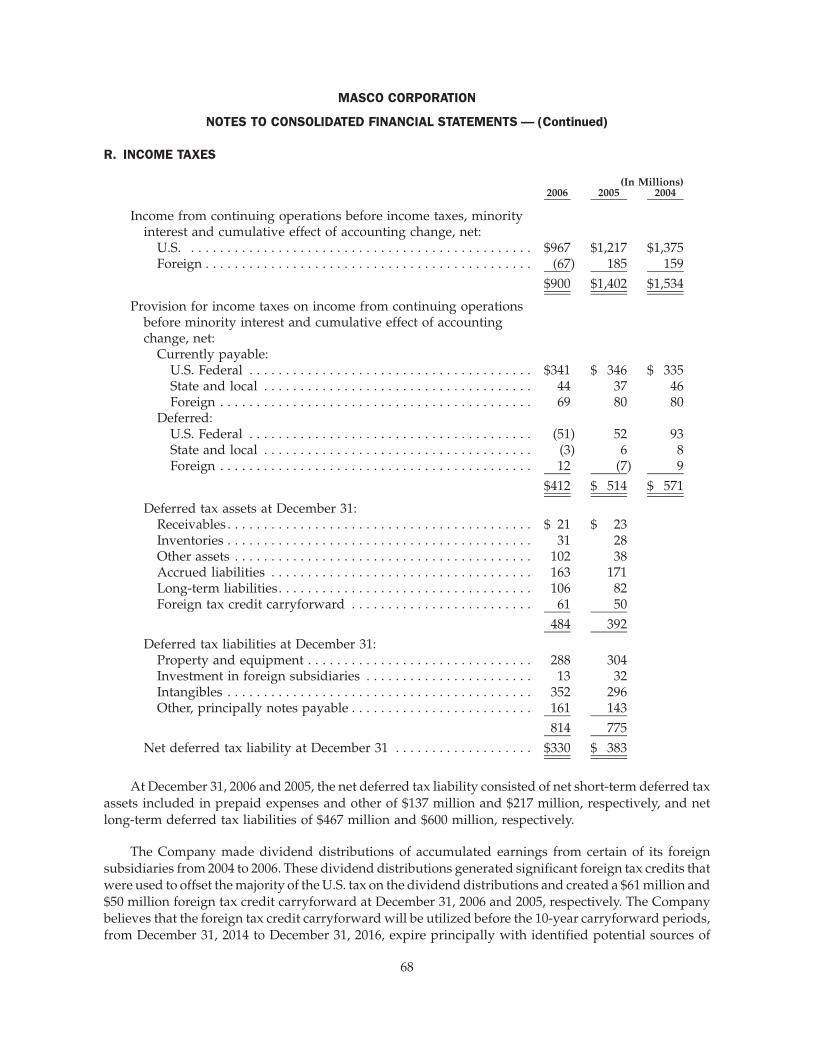
R. INCOME TAXES
2006 2005 2004(In Millions)
Income from continuing operations before income taxes, minorityinterest and cumulative effect of accounting change, net:
U.S. . . . . . . . . . . . . . . . . . . . . . . . . . . . . . . . . . . . . . . . . . . . . . . . $967 $1,217 $1,375Foreign . . . . . . . . . . . . . . . . . . . . . . . . . . . . . . . . . . . . . . . . . . . . . (67) 185 159
$900 $1,402 $1,534
Provision for income taxes on income from continuing operationsbefore minority interest and cumulative effect of accountingchange, net:
Currently payable:U.S. Federal . . . . . . . . . . . . . . . . . . . . . . . . . . . . . . . . . . . . . . . $341 $ 346 $ 335State and local . . . . . . . . . . . . . . . . . . . . . . . . . . . . . . . . . . . . . 44 37 46Foreign . . . . . . . . . . . . . . . . . . . . . . . . . . . . . . . . . . . . . . . . . . . 69 80 80
Deferred:U.S. Federal . . . . . . . . . . . . . . . . . . . . . . . . . . . . . . . . . . . . . . . (51) 52 93State and local . . . . . . . . . . . . . . . . . . . . . . . . . . . . . . . . . . . . . (3) 6 8Foreign . . . . . . . . . . . . . . . . . . . . . . . . . . . . . . . . . . . . . . . . . . . 12 (7) 9
$412 $ 514 $ 571
Deferred tax assets at December 31:Receivables . . . . . . . . . . . . . . . . . . . . . . . . . . . . . . . . . . . . . . . . . . $ 21 $ 23Inventories . . . . . . . . . . . . . . . . . . . . . . . . . . . . . . . . . . . . . . . . . . 31 28Other assets . . . . . . . . . . . . . . . . . . . . . . . . . . . . . . . . . . . . . . . . . 102 38Accrued liabilities . . . . . . . . . . . . . . . . . . . . . . . . . . . . . . . . . . . . 163 171Long-term liabilities. . . . . . . . . . . . . . . . . . . . . . . . . . . . . . . . . . . 106 82Foreign tax credit carryforward . . . . . . . . . . . . . . . . . . . . . . . . . 61 50
484 392Deferred tax liabilities at December 31:
Property and equipment . . . . . . . . . . . . . . . . . . . . . . . . . . . . . . . 288 304Investment in foreign subsidiaries . . . . . . . . . . . . . . . . . . . . . . . 13 32Intangibles . . . . . . . . . . . . . . . . . . . . . . . . . . . . . . . . . . . . . . . . . . 352 296Other, principally notes payable . . . . . . . . . . . . . . . . . . . . . . . . . 161 143
814 775Net deferred tax liability at December 31 . . . . . . . . . . . . . . . . . . . $330 $ 383
At December 31, 2006 and 2005, the net deferred tax liability consisted of net short-term deferred taxassets included in prepaid expenses and other of $137 million and $217 million, respectively, and netlong-term deferred tax liabilities of $467 million and $600 million, respectively.
The Company made dividend distributions of accumulated earnings from certain of its foreignsubsidiaries from 2004 to 2006. These dividend distributions generated significant foreign tax credits thatwere used to offset the majority of the U.S. tax on the dividend distributions and created a $61 million and$50 million foreign tax credit carryforward at December 31, 2006 and 2005, respectively. The Companybelieves that the foreign tax credit carryforward will be utilized before the 10-year carryforward periods,from December 31, 2014 to December 31, 2016, expire principally with identified potential sources of
68
MASCO CORPORATION
NOTES TO CONSOLIDATED FINANCIAL STATEMENTS — (Continued)

R. INCOME TAXES – (Concluded)
future income taxed in foreign jurisdictions at rates less than the present U.S. rate of 35 percent; therefore,a valuation allowance was not required at December 31, 2006 and 2005.
A reconciliation of the U.S. Federal statutory rate to the provision for income taxes on income fromcontinuing operations before minority interest and cumulative effect of accounting change, net, was asfollows:
2006 2005 2004
U.S. Federal statutory rate. . . . . . . . . . . . . . . . . . . . . . . . . . . . . . 35% 35% 35%State and local taxes, net of Federal tax benefit . . . . . . . . . . . . . 3 2 2Lower taxes on foreign earnings . . . . . . . . . . . . . . . . . . . . . . . . . (1) (1) (1)Change in U.S. and foreign taxes on distributed and
undistributed foreign earnings, including the impact offoreign tax credit . . . . . . . . . . . . . . . . . . . . . . . . . . . . . . . . . . . (3) — —
Foreign goodwill impairment charges providing no taxbenefit . . . . . . . . . . . . . . . . . . . . . . . . . . . . . . . . . . . . . . . . . . . . 13 2 2
Domestic production deduction . . . . . . . . . . . . . . . . . . . . . . . . . (1) (1) —Other, net . . . . . . . . . . . . . . . . . . . . . . . . . . . . . . . . . . . . . . . . . . . — — (1)
Effective tax rate . . . . . . . . . . . . . . . . . . . . . . . . . . . . . . . . . . . 46% 37% 37%
Income taxes paid were approximately $496 million, $457 million and $406 million in 2006, 2005 and2004, respectively.
S. EARNINGS PER COMMON SHARE
Reconciliations of the numerators and denominators used in the computations of basic anddiluted earnings per common share were as follows, in millions:
2006 2005 2004
Numerator (basic and diluted):Income from continuing operations before cumulative effect of
accounting change, net . . . . . . . . . . . . . . . . . . . . . . . . . . . . . . . . . . . $461 $866 $944Income (loss) from discontinued operations, net. . . . . . . . . . . . . . . . . 30 74 (51)Cumulative effect of accounting change, net . . . . . . . . . . . . . . . . . . . . (3) — —
Net income . . . . . . . . . . . . . . . . . . . . . . . . . . . . . . . . . . . . . . . . . . . . . . $488 $940 $893
Denominator:Basic common shares (based on weighted average) . . . . . . . . . . . . . . 394 422 445
Add:Contingent common shares . . . . . . . . . . . . . . . . . . . . . . . . . . . . . . . . . 5 4 6Stock option dilution . . . . . . . . . . . . . . . . . . . . . . . . . . . . . . . . . . . . . . 1 4 5
Diluted common shares . . . . . . . . . . . . . . . . . . . . . . . . . . . . . . . . . . . . 400 430 456
69
MASCO CORPORATION
NOTES TO CONSOLIDATED FINANCIAL STATEMENTS — (Continued)

S. EARNINGS PER COMMON SHARE – (Concluded)
At December 31, 2006 and 2005, the Company did not include any common shares related to theZero Coupon Convertible Senior Notes (“Notes”) in the calculation of diluted earnings per commonshare, as the price of the Company’s common stock at December 31, 2006 and 2005 did not exceed theequivalent accreted value of the Notes. At December 31, 2004, the Company included approximately onemillion common shares related to the Notes in the calculation of diluted earnings per common share, asthe price of the Company’s common stock at December 31, 2004 exceeded the equivalent accreted valueof the Notes.
Additionally, 16 million common shares, 13 million common shares and one million common sharesfor 2006, 2005 and 2004, respectively, related to stock options were excluded from the computation ofdiluted earnings per common share due to their antidilutive effect.
Common shares outstanding included on the Company’s balance sheet and for the calculation ofearnings per common share do not include unvested stock awards (nine million common shares atDecember 31, 2006); shares outstanding for legal requirements include all common shares that havevoting rights (including unvested stock awards).
T. OTHER COMMITMENTS AND CONTINGENCIES
Litigation
The Company is subject to lawsuits and pending or asserted claims with respect to matters generallyarising in the ordinary course of business.
As the Company reported in previous filings, late in the second half of 2002, the Company and itssubsidiary, Behr Process Corporation, agreed to two Settlements (the National Settlement and theWashington State Settlement) to resolve all class action lawsuits pending in the United States involvingcertain exterior wood coating products formerly manufactured by Behr. The evaluation, processing andpayment of claims for both the National Settlement and the Washington State Settlement were completedin 2006 except for a small number of administrative appeals of claim awards, which should be resolved inthe first half of 2007.
Early in 2003, a suit was brought against the Company and a number of its insulation installationcompanies in the federal court in Atlanta, Georgia, alleging that certain practices violate provisions offederal and state antitrust laws. The plaintiff publicized the lawsuit with a press release and stated in thatrelease that the U.S. Department of Justice was investigating the business practices of the Company’sinsulation installation companies. Although the Company was unaware of any investigation at that time,the Company was later advised that an investigation had been commenced but was subsequently closedwithout any enforcement action recommended. Two additional lawsuits were subsequently brought inVirginia making similar claims under the antitrust laws. Both of these lawsuits have since been dismissedwithout any payment or requirement for any change in business practices. During the second half of2004, the same counsel who commenced the initial action in Atlanta filed six additional lawsuits onbehalf of several of Masco’s competitors in the insulation installation business. The plaintiffs thendismissed all of these lawsuits and, represented by the same counsel, filed another action in the samefederal court as a putative class action against the Company, a number of its insulation installationcompanies and certain of their suppliers. All of the Company’s suppliers who are co-defendants in thislawsuit have agreed in principle with the plaintiffs to settle this matter. This suit currently seeks classrepresentation for residential insulation contractors (other than the defendants and their affiliates) thathave directly purchased fiberglass insulation suitable for residential installation from certain insulationmanufacturers. The Company is opposing certification of this lawsuit which seeks to proceed on a class
70
MASCO CORPORATION
NOTES TO CONSOLIDATED FINANCIAL STATEMENTS — (Continued)
T. OTHER COMMITMENTS AND CONTINGENCIES – (Continued)
representation basis. An additional lawsuit, seeking class action status and alleging anticompetitiveconduct, was filed in a Florida state court against the Company and a number of its insulation suppliers.This lawsuit was recently dismissed by the court with prejudice. Based upon the advice of its outsidecounsel, the Company believes that the conduct of the Company and its insulation installation com-panies, which has been the subject of the above-described lawsuits, has not violated any antitrust laws.There cannot, however, be any assurance that the Company will ultimately prevail in the remaininglawsuits or, if unsuccessful, that the ultimate liability would not be material. The Company is unable atthis time to reliably estimate any potential liability which might occur from an adverse judgment butdoes not believe that any adverse judgment would have a material adverse effect on its businesses or themethods used by its insulation installation companies in doing business.
In February 2003, a suit was served upon the Company’s subsidiary, Milgard Manufacturing, in theSolano County, California Superior Court, alleging design defects in certain of Milgard’s aluminumwindows. The complaint requests class action status for all owners of homes in California in which thewindows are installed, and seeks replacement costs and other damages. Milgard denies that thewindows are defective and is vigorously defending the case. In August 2006 the trial court deniedplaintiffs’ motion for class certification. Plaintiffs filed a notice of appeal to the California Court ofAppeals. Based upon the advice of its outside counsel, Milgard believes that the trial court ruling shouldbe affirmed by the appellate court.
In 2004, the Company learned that European governmental authorities were investigating possibleanticompetitive business practices relating to the plumbing and heating industries in Europe. Theinvestigations involve a number of European companies, including certain of the Company’s Europeanmanufacturing divisions and a number of other large businesses. As part of its broadened governanceactivities, the Company, with the assistance of its outside counsel, completed a review of the competitionpractices of its European divisions, including those in the plumbing and heating industries, and theCompany is cooperating fully with the European governmental authorities. Several private antitrustlawsuits have been filed in the United States as putative class actions against, among others, theCompany and certain of the other companies being investigated relating to the defendants’ plumbingoperations. These appear to be an outgrowth of the investigations being conducted by Europeangovernmental authorities. These lawsuits have been dismissed; however, the Company has been notifiedthat a notice of appeal has been filed in one of these lawsuits. Based upon the advice of its outsidecounsel, the review of the competition practices of its European divisions referred to above and otherfactors, the Company believes that it will not incur material liability as a result of the matters that are thesubject of these investigations.
Warranty
Certain of the Company’s products and product finishes and services are covered by a warranty tobe free from defects in material and workmanship for periods ranging from one year to the life of theproduct. At the time of sale, the Company accrues a warranty liability for estimated costs to provideproducts, parts or services to repair or replace products in satisfaction of warranty obligations. TheCompany’s estimate of costs to service its warranty obligations is based upon historical experience andexpectations of future conditions. To the extent that the Company experiences any changes in warrantyclaim activity or costs associated with servicing those claims, its warranty liability is adjustedaccordingly.
71
MASCO CORPORATION
NOTES TO CONSOLIDATED FINANCIAL STATEMENTS — (Continued)
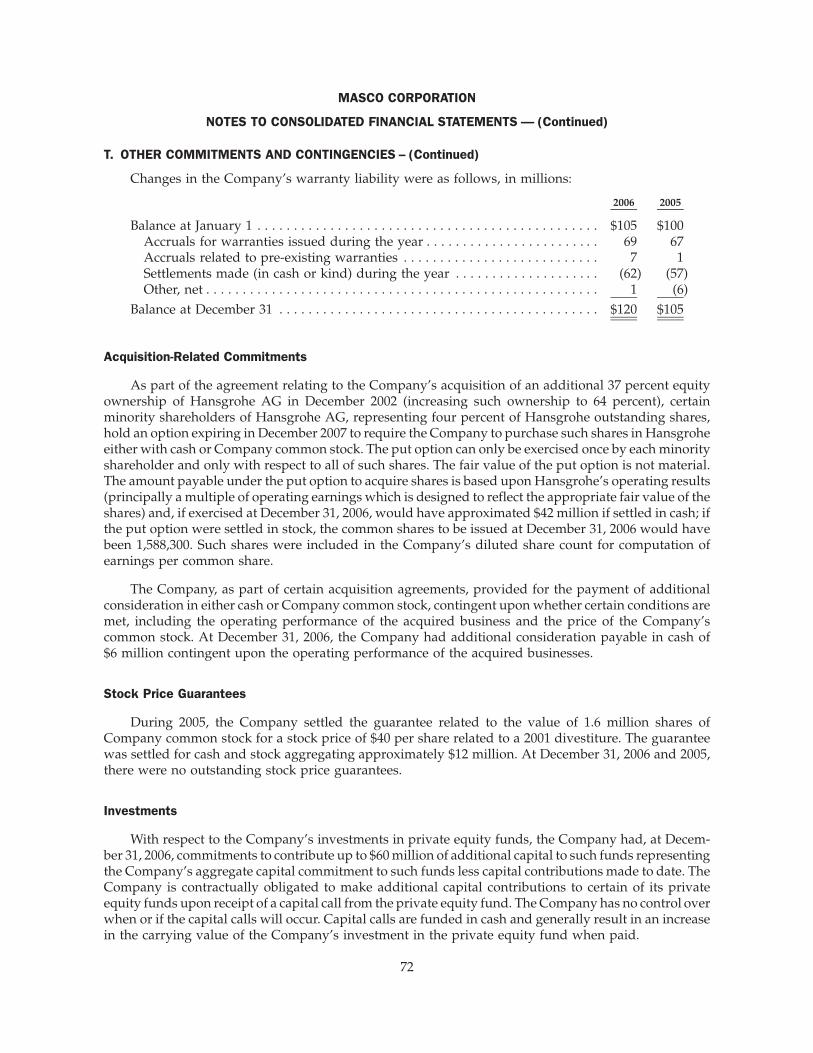
T. OTHER COMMITMENTS AND CONTINGENCIES – (Continued)
Changes in the Company’s warranty liability were as follows, in millions:
2006 2005
Balance at January 1 . . . . . . . . . . . . . . . . . . . . . . . . . . . . . . . . . . . . . . . . . . . . . . . $105 $100Accruals for warranties issued during the year . . . . . . . . . . . . . . . . . . . . . . . . 69 67Accruals related to pre-existing warranties . . . . . . . . . . . . . . . . . . . . . . . . . . . 7 1Settlements made (in cash or kind) during the year . . . . . . . . . . . . . . . . . . . . (62) (57)Other, net . . . . . . . . . . . . . . . . . . . . . . . . . . . . . . . . . . . . . . . . . . . . . . . . . . . . . . 1 (6)
Balance at December 31 . . . . . . . . . . . . . . . . . . . . . . . . . . . . . . . . . . . . . . . . . . . . $120 $105
Acquisition-Related Commitments
As part of the agreement relating to the Company’s acquisition of an additional 37 percent equityownership of Hansgrohe AG in December 2002 (increasing such ownership to 64 percent), certainminority shareholders of Hansgrohe AG, representing four percent of Hansgrohe outstanding shares,hold an option expiring in December 2007 to require the Company to purchase such shares in Hansgroheeither with cash or Company common stock. The put option can only be exercised once by each minorityshareholder and only with respect to all of such shares. The fair value of the put option is not material.The amount payable under the put option to acquire shares is based upon Hansgrohe’s operating results(principally a multiple of operating earnings which is designed to reflect the appropriate fair value of theshares) and, if exercised at December 31, 2006, would have approximated $42 million if settled in cash; ifthe put option were settled in stock, the common shares to be issued at December 31, 2006 would havebeen 1,588,300. Such shares were included in the Company’s diluted share count for computation ofearnings per common share.
The Company, as part of certain acquisition agreements, provided for the payment of additionalconsideration in either cash or Company common stock, contingent upon whether certain conditions aremet, including the operating performance of the acquired business and the price of the Company’scommon stock. At December 31, 2006, the Company had additional consideration payable in cash of$6 million contingent upon the operating performance of the acquired businesses.
Stock Price Guarantees
During 2005, the Company settled the guarantee related to the value of 1.6 million shares ofCompany common stock for a stock price of $40 per share related to a 2001 divestiture. The guaranteewas settled for cash and stock aggregating approximately $12 million. At December 31, 2006 and 2005,there were no outstanding stock price guarantees.
Investments
With respect to the Company’s investments in private equity funds, the Company had, at Decem-ber 31, 2006, commitments to contribute up to $60 million of additional capital to such funds representingthe Company’s aggregate capital commitment to such funds less capital contributions made to date. TheCompany is contractually obligated to make additional capital contributions to certain of its privateequity funds upon receipt of a capital call from the private equity fund. The Company has no control overwhen or if the capital calls will occur. Capital calls are funded in cash and generally result in an increasein the carrying value of the Company’s investment in the private equity fund when paid.
72
MASCO CORPORATION
NOTES TO CONSOLIDATED FINANCIAL STATEMENTS — (Continued)

T. OTHER COMMITMENTS AND CONTINGENCIES – (Concluded)
Residual Value Guarantees
The Company has residual value guarantees resulting from operating leases, primarily related tocertain of the Company’s trucks and other vehicles, in the Installation and Other Services segment. Theoperating leases are generally for a minimum term of 18 to 24 months and are renewable monthly afterthe initial term. After the end of the initial term, if the Company cancels the leases, the Company mustpay the lessor the difference between the guaranteed residual value and the fair market value of therelated vehicles. The value of lease-related guarantees, including the obligation payable under theresidual value guarantees, assuming the fair value at lease termination is zero, was approximately$88 million at December 31, 2006.
For all operating leases that contain residual value guarantee provisions (principally related tovehicles), the Company calculates the amount due under the guarantees and compares such amount tothe fair value of the leased assets. If the amount payable under the residual value guarantee exceeds thefair value at lease termination, the Company would record a liability equal to such excess with acorresponding charge to earnings. At December 31, 2006, the estimated fair market value exceeded theamount payable under the residual value guarantees and no liability was recorded.
Other Matters
The Company enters into contracts, which include reasonable and customary indemnifications thatare standard for the industries in which it operates. Such indemnifications include customer claimsagainst builders for issues relating to the Company’s products and workmanship. In conjunction withdivestitures and other transactions, the Company occasionally provides reasonable and customaryindemnifications relating to various items including: the enforceability of trademarks; legal and envi-ronmental issues; provisions for sales returns; and asset valuations. The Company has never had to pay amaterial amount related to these indemnifications and evaluates the probability that amounts may beincurred and appropriately records an estimated liability when probable.
73
MASCO CORPORATION
NOTES TO CONSOLIDATED FINANCIAL STATEMENTS — (Continued)

U. INTERIM FINANCIAL INFORMATION (UNAUDITED)
TotalYear December 31 September 30 June 30 March 31
Quarters Ended(In Millions, Except Per Common Share Data)
2006:Net sales . . . . . . . . . . . . . . . . . . . . . . . . . . . . $12,778 $2,946 $3,295 $3,370 $3,167Gross profit . . . . . . . . . . . . . . . . . . . . . . . . . $ 3,519 $ 743 $ 923 $ 979 $ 874Income (loss) from continuing
operations . . . . . . . . . . . . . . . . . . . . . . . . . $ 461 $ (186) $ 225 $ 215 $ 207Net income (loss) . . . . . . . . . . . . . . . . . . . . . $ 488 $ (187) $ 252 $ 219 $ 204Earnings (loss) per common share:
Basic:Income (loss) from continuing
operations . . . . . . . . . . . . . . . . . . . . . $ 1.17 $ (.48) $ .58 $ .54 $ .51Net income (loss) . . . . . . . . . . . . . . . . . $ 1.24 $ (.49) $ .65 $ .55 $ .50
Diluted:Income (loss) from continuing
operations . . . . . . . . . . . . . . . . . . . . . $ 1.15 $ (.48) $ .57 $ .53 $ .50Net income (loss) . . . . . . . . . . . . . . . . . $ 1.22 $ (.49) $ .64 $ .54 $ .50
2005:Net sales . . . . . . . . . . . . . . . . . . . . . . . . . . . . $12,569 $3,128 $3,278 $3,267 $2,896Gross profit . . . . . . . . . . . . . . . . . . . . . . . . . $ 3,584 $ 861 $ 940 $ 961 $ 822Income from continuing operations . . . . . . $ 866 $ 140 $ 254 $ 266 $ 206Net income . . . . . . . . . . . . . . . . . . . . . . . . . . $ 940 $ 173 $ 262 $ 274 $ 231Earnings per common share:
Basic:Income from continuing operations . . . $ 2.05 $ .34 $ .60 $ .63 $ .48Net income . . . . . . . . . . . . . . . . . . . . . . $ 2.23 $ .42 $ .62 $ .65 $ .53
Diluted:Income from continuing operations . . . $ 2.01 $ .33 $ .59 $ .62 $ .47Net income . . . . . . . . . . . . . . . . . . . . . . $ 2.19 $ .41 $ .61 $ .64 $ .52
Earnings (loss) per common share amounts for the four quarters of 2006 and 2005 may not total to theearnings per common share amounts for the years ended December 31, 2006 and 2005 due to the timingof common stock repurchases.
Fourth quarter 2006 loss from continuing operations and net loss include non-cash impairmentcharges for goodwill of $321 million after tax ($321 million pre-tax), and income regarding litigationsettlement of $1 million after tax ($1 million pre-tax). Income from continuing operations and net incomeinclude after-tax impairment charges for financial investments of $51 million ($78 million pre-tax),$5 million ($8 million pre-tax) and $10 million ($15 million pre-tax) in the second, third and fourthquarters of 2006, respectively. Net income for 2006 includes after-tax income (loss), net, related todiscontinued operations of $0 million ($1 million pre-tax), $4 million ($6 million pre-tax), $27 million($52 million pre-tax) and $(1) million ($(1) million pre-tax) in the first, second, third and fourth quartersof 2006, respectively.
74
MASCO CORPORATION
NOTES TO CONSOLIDATED FINANCIAL STATEMENTS — (Continued)
U. INTERIM FINANCIAL INFORMATION (UNAUDITED) – (Concluded)
Fourth quarter 2005 income from continuing operations and net income include non-cash impair-ment charges for goodwill of $69 million after tax ($69 million pre-tax). Income from continuingoperations and net income include after-tax income regarding litigation settlement of $1 million ($2 mil-lion pre-tax), $2 million ($3 million pre-tax) and $1 million ($1 million pre-tax) in the first, second andthird quarters of 2005, respectively. Income from continuing operations and net income include after-taximpairment charges for financial investments of $1 million ($2 million pre-tax) and $28 million ($43 mil-lion pre-tax) in the second and third quarters of 2005, respectively. Net income for 2005 includes after-taxincome, net, related to discontinued operations of $25 million ($24 million pre-tax), $8 million ($12 millionpre-tax), $8 million ($13 million pre-tax) and $33 million ($63 million pre-tax) in the first, second, thirdand fourth quarters of 2005, respectively.
75
MASCO CORPORATION
NOTES TO CONSOLIDATED FINANCIAL STATEMENTS — (Concluded)

Item 9. Changes in and Disagreements with Accountants on Accounting and Financial Disclosure.
Not applicable.
Item 9A. Controls and Procedures.
(a) Evaluation of Disclosure Controls and Procedures.
The Company, with the participation of the Chief Executive Officer and Chief Financial Officer,conducted an evaluation of its disclosure controls and procedures as required by Exchange ActRules 13a-15(b) and 15d-15(b) as of December 31, 2006. Based on this evaluation, the Company’smanagement, including the Chief Executive Officer and Chief Financial Officer, concluded that theCompany’s disclosure controls and procedures were effective.
(b) Management’s Report on Internal Control over Financial Reporting.
Management’s report on the Company’s internal control over financial reporting (as such term isdefined in Rules 13a-15(f) and 15d-15(f) under the Exchange Act) is included in this Report under Item 8.Financial Statements and Supplementary Data under the heading “Management’s Report on InternalControl over Financial Reporting,” and the related report of our independent registered public account-ing firm is included under the heading “Report of Independent Registered Public Accounting Firm”under the same Item.
(c) Changes in Internal Control over Financial Reporting.
There were no changes in the Company’s internal control over financial reporting that occurredduring the last fiscal quarter that have materially affected, or are reasonably likely to materially affect, theCompany’s internal control over financial reporting.
Item 9B. Other Information.
Not applicable.
PART III
Item 10. Directors, Executive Officers and Corporate Governance.
Certain information regarding executive officers required by this Item is set forth as a Supplemen-tary Item at the end of Part I hereof (pursuant to Instruction 3 to Item 401(b) of Regulation S-K). TheCompany’s Code of Business Ethics applies to all employees, officers and directors including thePrincipal Executive Officer and Principal Financial Officer and Principal Accounting Officer, and isposted on the Company’s website at www.masco.com. Other information required by this Item will becontained in the Company’s definitive Proxy Statement for its 2007 Annual Meeting of Stockholders, tobe filed on or before April 28, 2007, and such information is incorporated herein by reference.
Item 11. Executive Compensation.
Information required by this Item will be contained in the Company’s definitive Proxy Statement forits 2007 Annual Meeting of Stockholders, to be filed on or before April 28, 2007, and such information isincorporated herein by reference.
Item 12. Security Ownership of Certain Beneficial Owners and Management and Related Stock-holder Matters.
Equity Compensation Plan Information
The Company has three equity compensation plans, the 1991 Long Term Stock Incentive Plan (underwhich further grants have been discontinued), the 2005 Long Term Stock Incentive Plan and the 1997Non-Employee Directors Stock Plan. The following table sets forth information as of December 31, 2006
76

concerning the Company’s three equity compensation plans, each of which was approved by stock-holders. The Company does not have any equity compensation plans that are not approved bystockholders.
Plan Category
Number ofSecurities to be
Issued UponExercise of
OutstandingOptions, Warrants
and Rights
Weighted-AverageExercise Price of
Outstanding Options,Warrants and Rights
Number of SecuritiesRemaining Available forFuture Issuance Under
Equity Compensation Plans(Excluding Securities
Reflected in theFirst Column)
Equity compensation plansapproved by stockholders . . . . 26,619,000 $26.17 20,278,500
The remaining information required by this Item will be contained in the Company’s definitiveProxy Statement for its 2007 Annual Meeting of Stockholders, to be filed on or before April 28, 2007, andsuch information is incorporated herein by reference.
Item 13. Certain Relationships and Related Transactions, and Director Independence.
Information required by this Item will be contained in the Company’s definitive Proxy Statement forits 2007 Annual Meeting of Stockholders, to be filed on or before April 28, 2007, and such information isincorporated herein by reference.
Item 14. Principal Accountant Fees and Services.
Information required by this Item will be contained in the Company’s definitive Proxy Statement forits 2007 Annual Meeting of Stockholders, to be filed on or before April 28, 2007, and such information isincorporated herein by reference.
77

PART IV
Item 15. Exhibits and Financial Statement Schedule.
(a) Listing of Documents.
(1) Financial Statements. The Company’s Consolidated Financial Statements included in Item 8hereof, as required at December 31, 2006 and 2005, and for the years ended December 31,2006, 2005 and 2004, consist of the following:
Consolidated Balance SheetsConsolidated Statements of IncomeConsolidated Statements of Cash FlowsConsolidated Statements of Shareholders’ EquityNotes to Consolidated Financial Statements
(2) Financial Statement Schedule.
(i) Financial Statement Schedule of the Company appended hereto, as required for theyears ended December 31, 2006, 2005 and 2004, consists of the following:
II. Valuation and Qualifying Accounts
(3) Exhibits.ExhibitNumber
3.i Restated Certificate of Incorporation of Masco Corporation and amendmentsthereto (Incorporated by reference to Exhibit 3.i of Masco’s 2005 Form 10-K filed3-2-2006).
3.ii Bylaws of Masco Corporation, as Amended and Restated February 6, 2007(Incorporated by reference to Exhibit 3.1 of Masco’s Form 8-K filed 2-8-2007).
4.a.i Indenture dated as of December 1, 1982 between Masco Corporation and Bankof New York Trust Company, N.A., as successor trustee under agreementoriginally with Morgan Guaranty Trust Company of New York, as Trustee(Filed herewith) and Directors’ resolutions establishing Masco Corporation’s:(i) 71⁄8% Debentures Due August 15, 2013 (Incorporated by reference to
Exhibit 4.a.i of Masco’s 2003 Form 10-K filed 2-27-2004);(ii) 6.625% Debentures Due April 15, 2018 (Incorporated by reference to
Exhibit 4.a.i of Masco’s 2003 Form 10-K filed 2-27-2004);(iii) 5.75% Notes Due October 15, 2008 (Incorporated by reference to Exhibit 4.a.i
of Masco’s 2003 Form 10-K filed 2-27-2004); and(iv) 73⁄4% Debentures Due August 1, 2029 (Incorporated by reference to Exhibit 4.a.i
of Masco’s 2004 Form 10-K filed 3-16-2005).4.a.ii Agreement of Appointment and Acceptance of Successor Trustee dated as of
July 25, 1994 among Masco Corporation, Morgan Guaranty Trust Company ofNew York and The First National Bank of Chicago (Incorporated by reference toExhibit 4.a.ii of Masco’s 2004 Form 10-K filed 3-16-2005).
4.a.iii Supplemental Indenture dated as of July 26, 1994 between Masco Corporationand Bank of New York Trust Company, N.A., as successor trustee underagreement originally with The First National Bank of Chicago, as Trustee(Incorporated by reference to Exhibit 4.a.iii of Masco’s 2004 Form 10-K filed3-16-2005).
78

ExhibitNumber
4.b.i Indenture dated as of February 12, 2001 between Masco Corporation and Bankof New York Trust Company, N.A., as successor trustee under agreementoriginally with Bank One Trust Company, National Association, as Trustee(Filed herewith) and Directors’ Resolutions establishing Masco Corporation’s:(i) 57⁄8% Notes Due July 15, 2012 (Incorporated by reference to Exhibit 4.b.i of
Masco’s 2002 Form 10-K filed 3-14-2003);(ii) 45⁄8% Notes Due August 15, 2007 (Incorporated by reference to Exhibit 4.b.i of
Masco’s 2002 Form 10-K filed 3-14-2003);(iii) 61⁄2% Notes Due August 15, 2032 (Incorporated by reference to Exhibit 4.b of
Masco’s 2002 Form 10-K filed 3-14-2003);(iv) Floating Rate Notes Due 2007 (Incorporated by reference to Exhibit 4.b.i of
Masco’s 2004 Form 10-K filed 3-16-2005);(v) 4.80% Notes Due June 15, 2015 (Incorporated by reference to Exhibit 4.b.i of
Masco’s 2nd Quarter Form 10-Q filed 8-4-2005); and(vi) 6.125% Notes Due October 3, 2016 (Filed herewith).
4.b.ii First Supplemental Indenture dated as of July 20, 2001 to the Indenture datedFebruary 12, 2001 by and among Masco Corporation and Bank of New YorkTrust Company, N.A., as successor trustee under agreement originally withBank One Trust Company, National Association, as Trustee, relating to theCompany’s Zero Coupon Convertible Senior Notes Due July 20, 2031 (Filedherewith);(i) Amendment No. 1 dated as of July 19, 2002 (Incorporated by reference to
Exhibit 4.b of Masco’s 2nd Quarter Form 10-Q filed 8-13-2002); and(ii) Amendment No. 2 dated as of November 2, 2004 (Incorporated by reference
to Exhibit 4 of Masco’s 3rd Quarter Form 10-Q filed 11-04-2004).4.b.iii Supplemental Indenture dated as of November 30, 2006 to the Indenture dated
February 12, 2001 by and among Masco Corporation and Bank of New YorkTrust Company, N.A., as Trustee (Filed herewith).
4.b.iv Second Supplemental Indenture between Masco Corporation and J.P. MorganTrust Company, National Association, as trustee dated as of December 23, 2004(including form of Zero Coupon Convertible Senior Note, Series B due 2031)(Incorporated by reference to Exhibit 10.1 of Masco’s Form 8-K filed 12-23-2004).
4.c U.S. $2 billion 5-Year Revolving Credit Agreement dated as of November 5,2004 among Masco Corporation and Masco Europe, S.á r.l. as borrowers, thebanks party thereto, as lenders, J.P. Morgan Securities Inc. and CitigroupGlobal Markets, Inc., as Joint Lead Arrangers and Joint Book Runners andCitibank, N.A., as Syndication Agent, Sumitomo Mitsui Banking Corporation,as Documentation Agent, and Bank One, N.A. (Main Office Chicago), asAdministrative Agent (Incorporated by reference to Exhibit 4 of Masco’s Form 8-Kfiled 11-12-2004), as amended by Amendment No. 1 dated February 10, 2006(Incorporated by reference to Exhibit 4 of Masco’s Form 8-K filed February 15, 2006).
Note: Other instruments, notes or extracts from agreements defining the rights ofholders of long-term debt of Masco Corporation or its subsidiaries have notbeen filed since(i) in each case the total amount of long-term debt permittedthereunder does not exceed 10 percent of Masco Corporation’s consolidatedassets, and (ii) such instruments, notes and extracts will be furnished by MascoCorporation to the Securities and Exchange Commission upon request.
Note: Exhibits 10.a through 10.h constitute the management contracts and executivecompensatory plans or arrangements in which certain of the Directors andexecutive officers of the Company participate.
79

ExhibitNumber
10.a Masco Corporation 1991 Long Term Stock Incentive Plan (as amended andrestated October 26, 2006) (Filed herewith).(i) Forms of Restricted Stock Award Agreement for awards prior to January 1,
2005 (Incorporated by reference to Exhibit 10.a.i of Masco’s 3rd QuarterForm 10-Q filed 11-04-2004) and for awards on and after January 1, 2005(Incorporated by reference to Exhibit 10.1 of Masco’s Form 8-K filed 1-06-2005);
(ii) Forms of Restoration Stock Option (Incorporated by reference to Exhibit 10.a.iiof Masco’s 3rd Quarter Form 10-Q filed 11-04-2004);
(iii) Forms of Stock Option Grant (Incorporated by reference to Exhibit 10.a.iii ofMasco’s 3rd Quarter Form 10-Q filed 11-04-2004);
(iv) Forms of Stock Option Grant for Non-Employee Directors (Incorporated byreference to Exhibit 10.a.iv of Masco’s 3rd Quarter Form 10-Q filed 11-04-2004);and
(v) Forms of amendment to Award Agreements (Incorporated by reference toExhibit 10.a of Masco’s 2005 Form 10-K filed 3-2-2006).
10.b Masco Corporation 2005 Long Term Stock Incentive Plan (as amended andrestated October 26, 2006) (Filed herewith).(i) Form of Restricted Stock Award (Incorporated by reference to Exhibit 10.b of
Masco’s 2005 Form 10-K filed 3-2-2006);(ii) Form of Stock Option Grant (Incorporated by reference to Exhibit 10.b of
Masco’s 2005 Form 10-K filed 3-2-2006);(iii) Form of Restoration Stock Option (Incorporated by reference to Exhibit 10.b of
Masco’s 2005 Form 10-K filed 3-2-2006); and(iv) Form of Stock Option Grant for Non-Employee Directors (Incorporated by
reference to Exhibit 10.b of Masco’s 2005 Form 10-K filed 3-2-2006).10.c Forms of Masco Corporation Supplemental Executive Retirement and
Disability Plan (Filed herewith).10.d Masco Corporation 1997 Non-Employee Directors Stock Plan (as amended and
restated October 27, 2005) (Incorporated by reference to Exhibit 10.e of Masco’s 2005Form 10-K filed 3-2-2006).(i) Form of Restricted Stock Award Agreement (Incorporated by reference toExhibit 10.e of Masco’s 2005 Form 10-K filed 3-2-2006);(ii) Form of Stock Option Grant (Incorporated by reference to Exhibit 10.e ofMasco’s 2005 Form 10-K filed 3-2-2006); and(iii) Form of amendment to Award Agreements (Incorporated by reference toExhibit 10.e of Masco’s 2005 Form 10-K filed 3-2-2006).
10.e Other compensatory arrangements for executive officers (Incorporated byreference to Exhibit 10.f of Masco’s 2005 Form 10-K filed 3-2-2006).
10.f Masco Corporation 2004 Restricted Stock Award Program (Incorporated byreference to Exhibit 10.b of Masco’s Form 10-Q filed 8-5-2004).
10.g Compensation of Directors (Incorporated by reference to Exhibit 10.o of Masco’s2004 Form 10-K filed 3-16-2005).
10.h Masco Corporation Retirement Benefit Restoration Plan dated January 1, 1995,as amended October 1, 2004 (Incorporated by reference to Exhibit 10.p of Masco’s2004 Form 10-K filed 3-16-2005).
10.i Amended and Restated Shareholders’ Agreement, dated as of November 27,2006, between RHJ International SA, Asahi Tec Corporation and the PrincipalCompany Shareholders Listed on Schedule I thereto (Filed herewith).
80
ExhibitNumber
10.j Shareholders Agreement, dated as of June 6, 2002, as amended and restated asof July 19, 2002, by and among Trimas Corporation, Metaldyne Company LLC,and the Heartland Entities listed therein and the Other Shareholders namedtherein or added as parties thereto from time to time (Filed herewith).
10.k Amendment No. 1, dated as of August 31, 2006, to Shareholders Agreement,dated as of June 6, 2002, as amended and restated as of July 19, 2002, by andamong Trimas Corporation, Metaldyne Company LLC, Heartland IndustrialPartners, L.P. and the Heartland Entities listed therein and the partiesidentified on the signature pages thereto as “Metaldyne Shareholder Parties.”(Filed herewith).
12 Computation of Ratio of Earnings to Combined Fixed Charges and PreferredStock Dividends (Filed herewith).
21 List of Subsidiaries (Filed herewith).23 Consent of Independent Registered Public Accounting Firm relating to Masco
Corporation’s Consolidated Financial Statements and Financial StatementSchedule (Filed herewith).
31.a Certification by Chief Executive Officer required by Rule 13a-14(a)/15d-14(a)(Filed herewith).
31.b Certification by Chief Financial Officer required by Rule 13a-14(a)/15d-14(a)(Filed herewith).
32 Certifications required by Rule 13a-14(b) or Rule 15d-14(b)and Section 1350 ofChapter 63 of the United States Code (Filed herewith)
The Company will furnish to its stockholders a copy of any of the above exhibits not includedherein upon the written request of such stockholder and the payment to the Company of thereasonable expenses incurred by the Company in furnishing such copy or copies.
81
SIGNATURES
Pursuant to the requirements of Section 13 or 15(d) of the Securities Exchange Act of 1934, theRegistrant has duly caused this Report to be signed on its behalf by the undersigned, thereunto dulyauthorized.
MASCO CORPORATION
By /s/ TIMOTHY WADHAMS
Timothy WadhamsSenior Vice President and Chief Financial Officer
February 27, 2007
Pursuant to the requirements of the Securities Exchange Act of 1934, this Report has been signedbelow by the following persons on behalf of the Registrant and in the capacities and on the dateindicated.
Principal Executive Officer:
/s/ RICHARD A. MANOOGIAN
Richard A. ManoogianChairman of the Board and Chief
Executive Officer
Principal Financial Officer andPrincipal Accounting Officer:
/s/ TIMOTHY WADHAMS
Timothy WadhamsSenior Vice President and Chief
Financial Officer
/s/ DENNIS W. ARCHER
Dennis W. ArcherDirector
/s/ THOMAS G. DENOMME
Thomas G. DenommeDirector
/s/ PETER A. DOW
Peter A. DowDirector
/s/ ANTHONY F. EARLEY, JR.Anthony F. Earley, Jr.
Director February 27, 2007
/s/ VERNE G. ISTOCK
Verne G. IstockDirector
/s/ DAVID L. JOHNSTON
David L. JohnstonDirector
/s/ J. MICHAEL LOSH
J. Michael LoshDirector
/s/ LISA A. PAYNE
Lisa A. PayneDirector
/s/ MARY ANN VAN LOKEREN
Mary Ann Van LokerenDirector
82
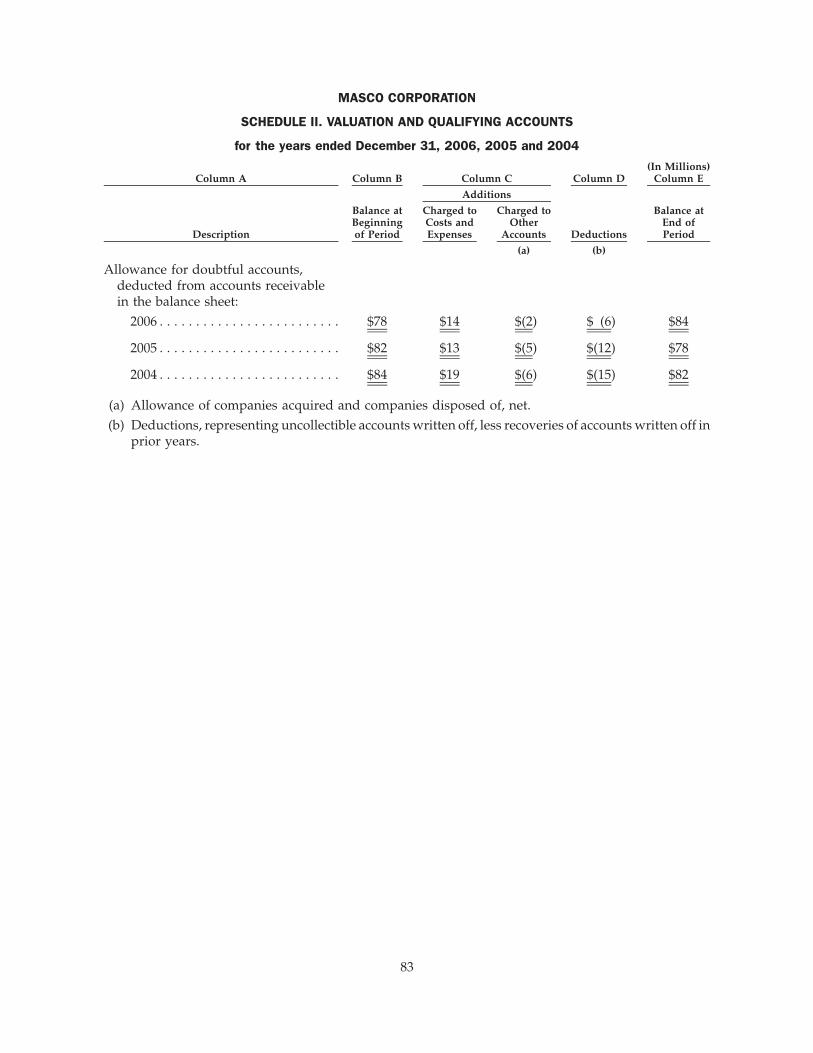
MASCO CORPORATION
SCHEDULE II. VALUATION AND QUALIFYING ACCOUNTS
for the years ended December 31, 2006, 2005 and 2004
Description
Balance atBeginningof Period
Charged toCosts andExpenses
Charged toOther
Accounts Deductions
Balance atEnd ofPeriod
Additions
Column A Column CColumn B Column D Column E(In Millions)
(a) (b)
Allowance for doubtful accounts,deducted from accounts receivablein the balance sheet:
2006 . . . . . . . . . . . . . . . . . . . . . . . . . $78 $14 $(2) $ (6) $84
2005 . . . . . . . . . . . . . . . . . . . . . . . . . $82 $13 $(5) $(12) $78
2004 . . . . . . . . . . . . . . . . . . . . . . . . . $84 $19 $(6) $(15) $82
(a) Allowance of companies acquired and companies disposed of, net.(b) Deductions, representing uncollectible accounts written off, less recoveries of accounts written off in
prior years.
83

EXHIBIT INDEX
ExhibitNumber Description of Exhibits
3.i Restated Certificate of Incorporation of Masco Corporation and amendments thereto(Incorporated by reference to Exhibit 3.i of Masco’s 2005 Form 10-K filed 3-2-2006).
3.ii Bylaws of Masco Corporation, as Amended and Restated February 6, 2007 (Incorporated byreference to Exhibit 3.1 of Masco’s Form 8-K filed 2-8-2007).
4.a.i Indenture dated as of December 1, 1982 between Masco Corporation and Bank of New YorkTrust Company, N.A., as successor trustee under agreement originally with MorganGuaranty Trust Company of New York, as Trustee (Filed herewith) and Directors’resolutions establishing Masco Corporation’s:(i) 71⁄8% Debentures Due August 15, 2013 (Incorporated by reference to Exhibit 4.a.i of Masco’s
2003 Form 10-K filed 2-27-2004);(ii) 6.625% Debentures Due April 15, 2018 (Incorporated by reference to Exhibit 4.a.i of Masco’s
2003 Form 10-K filed 2-27-2004);(iii) 5.75% Notes Due October 15, 2008 (Incorporated by reference to Exhibit 4.a.i of Masco’s 2003
Form 10-K filed 2-27-2004); and(iv) 73⁄4% Debentures Due August 1, 2029 (Incorporated by reference to Exhibit 4.a.i of Masco’s
2004 Form 10-K filed 3-16-2005).4.a.ii Agreement of Appointment and Acceptance of Successor Trustee dated as of July 25, 1994
among Masco Corporation, Morgan Guaranty Trust Company of New York and The FirstNational Bank of Chicago (Incorporated by reference to Exhibit 4.a.ii of Masco’s 2004 Form 10-Kfiled 3-16-2005).
4.a.iii Supplemental Indenture dated as of July 26, 1994 between Masco Corporation and Bank ofNew York Trust Company, N.A., as successor trustee under agreement originally with TheFirst National Bank of Chicago, as Trustee (Incorporated by reference to Exhibit 4.a.iii of Masco’s2004 Form 10-K filed 3-16-2005).
4.b.i Indenture dated as of February 12, 2001 between Masco Corporation and Bank of New YorkTrust Company, N.A., as successor trustee under agreement originally with Bank One TrustCompany, National Association, as Trustee (Filed herewith) and Directors’ Resolutionsestablishing Masco Corporation’s:(i) 57⁄8% Notes Due July 15, 2012 (Incorporated by reference to Exhibit 4.b.i of Masco’s 2002
Form 10-K filed 3-14-2003);(ii) 45⁄8% Notes Due August 15, 2007 (Incorporated by reference to Exhibit 4.b.i of Masco’s 2002
Form 10-K filed 3-14-2003);(iii) 61⁄2% Notes Due August 15, 2032 (Incorporated by reference to Exhibit 4.b of Masco’s 2002
Form 10-K filed 3-14-2003);(iv) Floating Rate Notes Due 2007 (Incorporated by reference to Exhibit 4.b.i of Masco’s 2004
Form 10-K filed 3-16-2005);(v) 4.80% Notes Due June 15, 2015 (Incorporated by reference to Exhibit 4.b.i of Masco’s
2nd Quarter Form 10-Q filed 8-4-2005); and(vi) 6.125% Notes Due October 3, 2016 (Filed herewith).
84

ExhibitNumber Description of Exhibits
4.b.ii First Supplemental Indenture dated as of July 20, 2001 to the Indenture dated February 12,2001 by and among Masco Corporation and Bank of New York Trust Company, N.A., assuccessor trustee under agreement originally with Bank One Trust Company, NationalAssociation, as Trustee, relating to the Company’s Zero Coupon Convertible Senior NotesDue July 20, 2031 (Filed herewith);(i) Amendment No. 1 dated as of July 19, 2002 (Incorporated by reference to Exhibit 4.b of
Masco’s 2nd Quarter Form 10-Q filed 8-13-2002); and(ii) Amendment No. 2 dated as of November 2, 2004 (Incorporated by reference to Exhibit 4 of
Masco’s 3rd Quarter Form 10-Q filed 11-04-2004).4.b.iii Supplemental Indenture dated as of November 30, 2006 to the Indenture dated February 12,
2001 by and among Masco Corporation and Bank of New York Trust Company, N.A., asTrustee (Filed herewith).
4.b.iv Second Supplemental Indenture between Masco Corporation and J.P. Morgan TrustCompany, National Association, as trustee dated as of December 23, 2004 (includingform of Zero Coupon Convertible Senior Note, Series B due 2031) (Incorporated byreference to Exhibit 10.1 of Masco’s Form 8-K filed 12-23-2004).
4.c U.S. $2 billion 5-Year Revolving Credit Agreement dated as of November 5, 2004 amongMasco Corporation and Masco Europe, S.á r.l. as borrowers, the banks party thereto, aslenders, J.P. Morgan Securities Inc. and Citigroup Global Markets, Inc., as Joint LeadArrangers and Joint Book Runners and Citibank, N.A., as Syndication Agent, SumitomoMitsui Banking Corporation, as Documentation Agent, and Bank One, N.A. (Main OfficeChicago), as Administrative Agent (Incorporated by reference to Exhibit 4 of Masco’s Form 8-Kfiled 11-12-2004), as amended by Amendment No. 1 dated February 10, 2006 (Incorporated byreference to Exhibit 4 of Masco’s Form 8-K filed February 15, 2006).
Note: Other instruments, notes or extracts from agreements defining the rights of holders of long-term debt of Masco Corporation or its subsidiaries have not been filed since(i) in each casethe total amount of long-term debt permitted thereunder does not exceed 10 percent ofMasco Corporation’s consolidated assets, and (ii) such instruments, notes and extracts willbe furnished by Masco Corporation to the Securities and Exchange Commission uponrequest.
Note: Exhibits 10.a through 10.h constitute the management contracts and executivecompensatory plans or arrangements in which certain of the Directors and executiveofficers of the Company participate.
10.a Masco Corporation 1991 Long Term Stock Incentive Plan (as amended and restatedOctober 26, 2006) (Filed herewith).(i) Forms of Restricted Stock Award Agreement for awards prior to January 1, 2005
(Incorporated by reference to Exhibit 10.a.i of Masco’s 3rd Quarter Form 10-Q filed11-04-2004) and for awards on and after January 1, 2005 (Incorporated by reference toExhibit 10.1 of Masco’s Form 8-K filed 1-06-2005);
(ii) Forms of Restoration Stock Option (Incorporated by reference to Exhibit 10.a.ii of Masco’s3rd Quarter Form 10-Q filed 11-04-2004);
(iii) Forms of Stock Option Grant (Incorporated by reference to Exhibit 10.a.iii of Masco’s3rd Quarter Form 10-Q filed 11-04-2004);
(iv) Forms of Stock Option Grant for Non-Employee Directors (Incorporated by reference toExhibit 10.a.iv of Masco’s 3rd Quarter Form 10-Q filed 11-04-2004); and
(v) Forms of amendment to Award Agreements (Incorporated by reference to Exhibit 10.a ofMasco’s 2005 Form 10-K filed 3-2-2006).
85

ExhibitNumber Description of Exhibits
10.b Masco Corporation 2005 Long Term Stock Incentive Plan (as amended and restatedOctober 26, 2006) (Filed herewith).(i) Form of Restricted Stock Award (Incorporated by reference to Exhibit 10.b of Masco’s 2005
Form 10-K filed 3-2-2006);(ii) Form of Stock Option Grant (Incorporated by reference to Exhibit 10.b of Masco’s 2005
Form 10-K filed 3-2-2006);(iii) Form of Restoration Stock Option (Incorporated by reference to Exhibit 10.b of Masco’s 2005
Form 10-K filed 3-2-2006); and(iv) Form of Stock Option Grant for Non-Employee Directors (Incorporated by reference to
Exhibit 10.b of Masco’s 2005 Form 10-K filed 3-2-2006).10.c Forms of Masco Corporation Supplemental Executive Retirement and Disability Plan (Filed
herewith).10.d Masco Corporation 1997 Non-Employee Directors Stock Plan (as amended and restated
October 27, 2005) (Incorporated by reference to Exhibit 10.e of Masco’s 2005 Form 10-K filed3-2-2006).(i) Form of Restricted Stock Award Agreement (Incorporated by reference to Exhibit 10.e of
Masco’s 2005 Form 10-K filed 3-2-2006);(ii) Form of Stock Option Grant (Incorporated by reference to Exhibit 10.e of Masco’s 2005
Form 10-K filed 3-2-2006); and(iii) Form of amendment to Award Agreements (Incorporated by reference to Exhibit 10.e of
Masco’s 2005 Form 10-K filed 3-2-2006).10.e Other compensatory arrangements for executive officers (Incorporated by reference to
Exhibit 10.f of Masco’s 2005 Form 10-K filed 3-2-2006).10.f Masco Corporation 2004 Restricted Stock Award Program (Incorporated by reference to
Exhibit 10.b of Masco’s Form 10-Q filed 8-5-2004).10.g Compensation of Directors (Incorporated by reference to Exhibit 10.o of Masco’s 2004 Form 10-K
filed 3-16-2005).10.h Masco Corporation Retirement Benefit Restoration Plan dated January 1, 1995, as amended
October 1, 2004 (Incorporated by reference to Exhibit 10.p of Masco’s 2004 Form 10-K filed3-16-2005).
10.i Amended and Restated Shareholders’ Agreement, dated as of November 27, 2006, betweenRHJ International SA, Asahi Tec Corporation and the Principal Company ShareholdersListed on Schedule I thereto (Filed herewith).
10.j Shareholders Agreement dated, as of June 6, 2002, as amended and restated as of July 19,2002, by and among Trimas Corporation, Metaldyne Company LLC, and the HeartlandEntities listed therein and the Other Shareholders named therein or added as parties theretofrom time to time (Filed herewith).
10.k Amendment No. 1, dated as of August 31, 2006, to Shareholders Agreement, dated as ofJune 6, 2002, as amended and restated as of July 19, 2002, by and among Trimas Corporation,Metaldyne Company LLC, Heartland Industrial Partners, L.P. and the Heartland Entitieslisted therein and the parties identified on the signature pages thereto as “MetaldyneShareholder Parties.” (Filed herewith).
12 Computation of Ratio of Earnings to Combined Fixed Charges and Preferred StockDividends (Filed herewith).
21 List of Subsidiaries (Filed herewith).
86

ExhibitNumber Description of Exhibits
23 Consent of Independent Registered Public Accounting Firm relating to MascoCorporation’s Consolidated Financial Statements and Financial Statement Schedule(Filed herewith).
31.a Certification by Chief Executive Officer required by Rule 13a-14(a)/15d-14(a) (Filedherewith).
31.b Certification by Chief Financial Officer required by Rule 13a-14(a)/15d-14(a) (Filed herewith).32 Certifications required by Rule 13a-14(b) or Rule 15d-14(b)and Section 1350 of Chapter 63 of
the United States Code (Filed herewith).
87

Exhibit 12
MASCO CORPORATION
Computation of Ratio of Earnings to Combined Fixed Charges and Preferred Stock Dividends
2006 2005 2004 2003 2002
(Dollars in Millions)Year Ended December 31,
Earnings Before Income Taxes,Preferred Stock Dividendsand Fixed Charges:Income from continuing operations before income
taxes, minority interest and cumulative effect ofaccounting change, net . . . . . . . . . . . . . . . . . . . . . . . $ 900 $1,402 $1,534 $1,243 $ 927
Deduct equity in undistributed (earnings) of fifty-percent-or- less-owned companies . . . . . . . . . . . . . . (1) (1) (1) – (10)
Add interest on indebtedness, net . . . . . . . . . . . . . . . . 241 246 214 252 226Add amortization of debt expense . . . . . . . . . . . . . . . 4 6 6 13 13Add estimated interest factor for rentals. . . . . . . . . . . 53 40 34 31 24Earnings before income taxes, minority interest,
cumulative effect of accounting change, net, fixedcharges and preferred stock dividends . . . . . . . . . . $1,197 $1,693 $1,787 $1,539 $1,180
Fixed Charges:Interest on indebtedness . . . . . . . . . . . . . . . . . . . . . . . $ 241 $ 244 $ 214 $ 253 $ 225Amortization of debt expense . . . . . . . . . . . . . . . . . . . 4 6 6 13 13Estimated interest factor for rentals. . . . . . . . . . . . . . . 53 40 34 31 24Total fixed charges . . . . . . . . . . . . . . . . . . . . . . . . . . . . $ 298 $ 290 $ 254 $ 297 $ 262
Preferred stock dividends (a) . . . . . . . . . . . . . . . . . . . . . $ – $ – $ 8 $ 16 $ 14Combined fixed charges and preferred stock
dividends . . . . . . . . . . . . . . . . . . . . . . . . . . . . . . . . . $ 298 $ 290 $ 262 $ 313 $ 276
Ratio of earnings to fixed charges . . . . . . . . . . . . . . . . . . 4.0 5.8 7.0 5.2 4.5
Ratio of earnings to combined fixed charges andpreferred stock dividends . . . . . . . . . . . . . . . . . . . . . . 4.0 5.8 6.8 4.9 4.3
Ratio of earnings to combined fixed charges andpreferred stock dividends excluding certainitems (b) . . . . . . . . . . . . . . . . . . . . . . . . . . . . . . . . . . . . 5.5 6.2 7.2 4.9 4.8
(a) Represents amount of income before provision for income taxes required to meet the preferred stockdividend requirements of the Company.
(b) Excludes the 2006 non-cash, pre-tax impairment charges for goodwill and financial investments of$331 million and $101 million, respectively, and the pre-tax income related to the Behr litigationsettlement of $1 million; the 2005 pre-tax income related to the Behr litigation settlement of$6 million, the non-cash, pre-tax impairment charges for goodwill and financial investments of$69 million and $45 million, respectively the 2004 pre-tax income related to the Behr litigationsettlement of $30 million, the non-cash, pre-tax impairment charges for goodwill of $112 million, andthe pre-tax impairment charge related to a marketable security of $21 million; the 2003 pre-taxincome related to the Behr litigation settlement of $72 million and the non-cash, pre-tax goodwillimpairment charges of $53 million; the 2002 pre-tax net charge of $147 million related to the Behrlitigation settlement.