maryland, race to the top, year 3 (school year 2012-2013) - …€¦ · · 2014-04-10race to the...
TRANSCRIPT

Maryland ReportYear 3: School Year 2012 – 2013
U.S. Department of Education Washington, DC 20202
March 19, 2014

Maryland Year 3: School Year 2012 – 2013Race to the Top 2
Executive Summary
Race to the Top overview
On February 17, 2009, President Obama signed into law the American Recovery and Reinvestment Act of 2009 (ARRA), historic legislation designed to stimulate the economy, support job creation, and invest in critical sectors, including education. ARRA provided $4.35 billion for the Race to the Top fund, of which approximately $4 billion was used to fund comprehensive statewide reform grants under the Race to the Top program.1 In 2010, the U.S. Department of Education (Department) awarded Race to the Top Phase 1 and Phase 2 grants to 11 States and the District of Columbia. The Race to the Top program is a competitive four-year grant program designed to encourage and reward States that are creating the conditions for education innovation and reform; achieving significant improvement in student outcomes, including making substantial gains in student achievement, closing achievement gaps, and improving high school graduation rates; and ensuring students are prepared for success in college and careers. Since the Race to the Top Phase 1 and 2 competitions, the Department has made additional grants under the Race to the Top Phase 3, Race to the Top – Early Learning Challenge,2 and Race to the Top – District3 competitions.
The Race to the Top program is built on the framework of comprehensive reform in four education reform areas:
• Adopting rigorous standards and assessments that prepare
students for success in college and the workplace;
• Building data systems that measure student success and inform
teachers and principals how they can improve their practices;
• Recruiting, developing, retaining, and rewarding effective
teachers and principals; and
• Turning around the lowest-performing schools.
Since education is a complex system, sustained and lasting instructional improvement in classrooms, schools, local educational agencies (LEAs), and States will not be achieved through piecemeal change. Race to the Top builds on the local contexts of States and LEAs participating in the State’s Race to the Top plan (participating LEAs)4 in the design and implementation of the most effective and innovative approaches that meet the needs of their educators, students, and families.
1 The remaining funds were awarded under the Race to the Top Assessment program. More information about the Race to the Top Assessment program is available at www.ed.gov/programs/racetothetop-assessment.
2 More information on the Race to the Top – Early Learning Challenge can be found at http://www2.ed.gov/programs/racetothetop-earlylearningchallenge/index.html.
3 More information on Race to the Top – District can be found at http://www2.ed.gov/programs/racetothetop-district/index.html.
4 Participating local educational agencies (LEAs) are those LEAs that choose to work with the State to implement all or significant portions of the State’s Race to the Top plan, as specified in each LEA’s Memorandum of Understanding with the State. Each participating LEA that receives funding under Title I, Part A will receive a share of the 50 percent of a State’s grant award that the State must subgrant to LEAs, based on the LEA’s relative share of Title I, Part A allocations in the most recent year, in accordance with section 14006(c) of the American Recovery and Reinvestment Act (ARRA).
Race to the Top program reviewAs part of the Department’s commitment to supporting States as they implement ambitious reform agendas, the Department established the Implementation and Support Unit (ISU) in the Office of the Deputy Secretary to administer, among others, the Race to the Top program. The goal of the ISU is to provide assistance to States as they implement unprecedented and comprehensive reforms to improve student outcomes. Consistent with this goal, the Department has developed a Race to the Top program review process that not only addresses the Department’s responsibilities for fiscal and programmatic oversight, but is also designed to identify areas in which Race to the Top grantees need assistance and support to meet their goals. Specifically, the ISU works with Race to the Top grantees to differentiate support based on individual State needs, and helps States work with each other and with experts to achieve and sustain educational reforms that improve student outcomes. In partnership with the ISU, the Reform Support Network (RSN) offers collective and individualized technical assistance and resources to Race to the Top grantees. The RSN’s purpose is to support Race to the Top grantees as they implement reforms in education policy and practice, learn from each other, and build their capacity to sustain these reforms.5
Grantees are accountable for the implementation of their approved Race to the Top plans, and the information and data gathered throughout the program review help to inform the Department’s management and support of the Race to the Top grantees, as well as provide appropriate and timely updates to the public on their progress. In the event that adjustments are required to an approved plan, the grantee must submit a formal amendment request to the Department for consideration. States may submit for Department approval amendment requests to a plan and budget, provided such changes do not significantly affect the scope or objectives of the approved plans. In the event that the Department determines that a grantee is not meeting its goals, activities, timelines, budget, or annual targets, or is not fulfilling other applicable requirements, the Department will take appropriate enforcement action(s), consistent with 34 CFR section 80.43 in the Education Department General Administrative Regulations (EDGAR).6
State-specific summary reportThe Department uses the information gathered during the review process (e.g., through monthly calls, onsite reviews, and Annual Performance Reports (APRs)) to draft State-specific summary reports. The State-specific summary report serves as an assessment of a State’s annual Race to the Top implementation. The Year 3 report for Phase 1 and 2 grantees highlights successes and accomplishments, identifies challenges, and provides lessons learned from implementation from approximately September 2012 through September 2013; the Year 2 report for Phase 3 grantees provides similar information from approximately December 2012 through December 2013.
5 More information can be found at http://www2.ed.gov/about/inits/ed/implementation-support-unit/tech-assist/index.html.
6 More information about the Implementation and Support Unit’s (ISU’s) program review process, State Annual Performance Report (APR) data, and State Scopes of Work can be found at http://www2.ed.gov/programs/racetothetop/index.html.

Maryland Year 3: School Year 2012 – 2013Race to the Top 3
Executive Summary
State’s education reform agendaIn September 2010, the Department awarded Maryland a $249,999,182 Race to the Top grant to support comprehensive education reform efforts in the State. Under the terms of the Race to the Top grant, the State must distribute at least half of the award amount to participating LEAs to support their reform efforts. Maryland stated in its Race to the Top application that it aspires to become world class in public education through implementation of its Race to the Top initiatives. The State’s reform goals include the adoption of clearer and more rigorous Common Core State Standards (CCSS) and new assessments, development of a P-20 longitudinal data system, a redesigned human capital framework including a new teacher and principal evaluation system, and a more cohesive approach to turning around lowest-achieving schools. In its Race to the Top application, Maryland considered the development of a high-quality instructional improvement system (IIS) composed of multiple systems to be the centerpiece of its reform agenda, dedicating more of its Race to the Top State funds to data systems to improve instruction than to any of the other Race to the Top education reform areas.
State Years 1 and 2 summary Maryland’s Race to the Top Year 1 accomplishments included critical capacity-building at the Maryland State Department of Education (MSDE), with the establishment of a Race to the Top office within the Division of Academic Reform and Innovation under the direction of an assistant State superintendent. In Year 2, the State enhanced its communication efforts to target school-level personnel and promote consistent messages about the State’s Race to the Top work.
Maryland adopted the CCSS in June 2010. In June 2011, the Maryland State Board of Education accepted the Maryland Common Core State Curriculum (MCCSC) Frameworks in mathematics and English language arts (ELA), which were based on the CCSS and created with the input of Maryland educators. These Frameworks define the skills and knowledge that students must have in order to achieve the goals of the CCSS and guide the State’s development of curriculum resources. Using the MCCSC Frameworks and Partnership for Assessment of Readiness for College and Careers (PARCC) Model Content Frameworks as guides, Maryland educators developed two model units and two model lessons in ELA and
mathematics for each grade level in SY 2011-2012 for Maryland educators to use in their classrooms or as exemplars to develop their own units and lessons aligned to the MCCSC Frameworks.
In Years 1 and 2, Maryland hosted summer Educator Effectiveness Academies and Teacher Induction Academies. The Educator Effectiveness Academies, held at 11 regional sites across the State, provided CCSS professional development to more than 6,000 teachers and principals. The second Teacher Induction Academy, held in June 2012, reached approximately 200 new teacher mentors and induction coordinators in an effort to ensure that all new teachers in Maryland public schools participate in a high-quality, supportive teacher induction program. Additionally, Maryland held its first Academy for School Turnaround for executive officers and principals from low-achieving schools around the State in summer 2012.
During school year (SY) 2010-2011, 11 schools in the State initiated a school intervention model.7 Maryland’s Breakthrough Center continued to lead the State’s efforts to turn around its lowest-achieving schools. During Year 2, the Breakthrough Center provided instructional, leadership, and student services support to these schools in Baltimore City Public School (BCPS) and Prince George’s County Public Schools (PGCPS).
While the State made some progress in implementing its Race to the Top initiatives during Years 1 and 2, Maryland continued to report difficulty in hiring qualified staff, particularly for projects related to the State’s technology and IIS projects. This challenge, along with the State procurement process, led to delays in many projects that had already experienced delays in Year 1. As a result, Maryland educators did not have access to components of the IIS in Year 2 as initially planned. Additionally, because Maryland has experienced ongoing delays in many technology projects, the State has a much tighter timeframe for completing this work and rolling it out to LEAs within the Race to the Top grant period.
Additionally, Maryland did not set clear expectations for the SY 2011- 2012 pilot of its new teacher and principal evaluation system, which occurred in select schools within seven LEAs. This led to significant variability among LEAs’ pilot activities and posed challenges to the State’s ability to gather meaningful and consistent data on the outcomes of the pilot.
7 Race to the Top States’ plans include supporting their LEAs in turning around the lowest-achieving schools by implementing one of the four school intervention models:
• Turnaround model: Replace the principal and rehire no more than 50 percent of the staff and grant the principal sufficient operational flexibility (including in staffing, calendars/time and budgeting) to fully implement a comprehensive approach to substantially improve student outcomes.
• Restart model: Convert a school or close and reopen it under a charter school operator, a charter management organization, or an education management organization that has been selected through a rigorous review process.
• School closure: Close a school and enroll the students who attended that school in other schools in the district that are higher achieving.
• Transformation model: Implement each of the following strategies: (1) replace the principal and take steps to increase teacher and school leader effectiveness, (2) institute comprehensive instructional reforms, (3) increase learning time and create community-oriented schools, and (4) provide operational flexibility and sustained support.

Maryland Year 3: School Year 2012 – 2013Race to the Top 4
Executive Summary
State Year 3 summaryDuring Year 3 Maryland continued to prepare educators to fully implement the CCSS in SY 2013-2014 and PARCC assessments in SY 2014-2015. Building on the model units and lessons that Maryland educators developed for each grade in ELA and mathematics in Year 2, the State developed additional ELA and mathematics units and lessons, and created social studies and science curriculum resources. Additionally, all participating LEAs conducted an abbreviated pilot of the new teacher and principal evaluation system in Year 3 in preparation for implementation of all components of the system in SY 2013-2014.
AccomplishmentsMaryland continued to score well above the national average on the National Assessment of Educational Progress (NAEP) in 2013. The State showed slight increases in reading from 2011. Although the State had a negligible decrease in overall mathematics scores since 2011, the percent of students scoring in the advanced range increased by eight percent in grade four mathematics and five percent in grade eight mathematics.
State-level project implementationIn Year 3, MSDE began holding Race to the Top Stat meetings to discuss the status of each project, successes, challenges, and the quality of implementation. The meetings provide MSDE leadership with a clear understanding of the status of each project and ability to determine which projects require additional intervention or support to ensure their success.
Resources aligned to Common Core State StandardsUsing the MCCSC Frameworks and PARCC Model Content Frameworks as guides, Maryland educators continued developing model units and lessons in ELA and mathematics for each grade level for use across the State. All MCCSC resources are available through the new Curriculum Management System (CMS) and Learning Management System (LMS), both key aspects of its IIS, which launched at the at the 2013 Educator Effectiveness Academies.
Breakthrough CenterMaryland’s Breakthrough Center continues to lead the State’s efforts to turn around its lowest-achieving schools. During Year 3, the Breakthrough Center provided individual support for teachers on the MCCSC. To ensure the professional development was high-quality, MSDE conducted mid-year and end-of-year observations to measure professional development effectiveness, make mid-course corrections and provide additional interventions as needed, and inform planning for the subsequent school year.
ChallengesWhile Maryland made some progress implementing its Race to the Top initiatives in Year 3, the State continued to struggle with finding highly qualified staff to conduct project activities related to the State’s technology and IIS projects and experienced technical challenges, resulting in further delays and impacting the State’s ability to meet the timeline outlined in its Race to the Top application. As the State completes development of many new resources and systems, it is imperative that the State provide comprehensive communication and support to LEAs.
Throughout SY 2012-2013, Maryland did not have a strategy in place to collect formative feedback on participating LEA capacity and the quality of implementation at the local-level across its reform agenda. Specifically, Maryland has not developed processes to determine how CCSS implementation is progressing across LEAs and schools or identified what additional support LEAs need to successfully utilize the State’s new technology systems.
Maryland conducted an abbreviated statewide field test of its teacher and leader evaluation systems with 14 percent of teachers and principals across the State from January – March 2013. Given the abbreviated timeline, it is unclear if MSDE and participating LEAs had sufficient time to collaborate across LEAs, share best practices, evaluate the outcomes of the field test, and make mid-course corrections prior to finalizing the evaluation system that will be used in SY 2013-2014.
Looking ahead to Year 4In Year 4, Maryland will fully implement the CCSS and will administer PARCC assessments in SY 2014-2015. Maryland educators will have access to additional resources to support CCSS implementation through the State’s CMS and LMS. In SY 2013- 2014, the State plans to complete development of several technology-based resources and systems, including enhancements to the Maryland Longitudinal Data System (MLDS), data dashboards and accompanying multi-media training modules, online science, technology, engineering and mathematics (STEM) courses, and the repository of CCSS materials. Maryland also plans to develop a comprehensive communications, training, and roll-out plan to ensure that LEA and school-level personnel have sufficient support and are prepared to utilize these new resources.
Finally, Maryland will implement its teacher and principal evaluation system for all teachers in its participating LEAs in SY 2013-2014. To ensure successful implementation, the State must provide comprehensive training and support for LEAs. The State has submitted a request to the Department that is currently under review to delay full implementation of its evaluation system, including the student growth component, by one year, to SY 2014-2015, stating that it would like more time to finalize the teacher and principal evaluation system and build capacity across its participating LEAs.

Maryland Year 3: School Year 2012 – 2013Race to the Top 5
State Success Factors
Building capacity to support LEAsIn order to manage the day-to-day implementation of grant initiatives, Maryland established a Race to the Top office within the Division of Academic Reform and Innovation at MSDE in Year 1. Maryland is also working as an agency across divisions to provide comprehensive communication and support to LEAs, while also ensuring that the LEAs are implementing Race to the Top reforms. In Year 3, Maryland re-staffed the division and began holding Race to the Top Stat meetings to discuss the status of each Race to the Top project and determine if projects require additional intervention. The meetings, facilitated by the MSDE Chief Performance Office, Chief Operating Officer, and Assistant Superintendent for the Division of Academic Policy and Innovation, allow the State to examine projects’ successes, challenges, and the quality of implementation, including supporting evidence, for each project. Additionally, MSDE revised its report that is provided to the State Board of Education each month. To enhance the oversight of Race to the Top projects, MSDE provides the State Board of Education an updated analysis of the status of each project, rated on a four-point scale. For those projects that are rated in the lowest two rankings, the State provides an explanation for the rating, as well as a plan to improve implementation of that project.
Support and accountability for LEAsIn an effort to improve efficiency and align LEAs’ Master Plans8 and Race to the Top Scopes of Work, Maryland worked closely at the beginning of Year 2 with participating LEAs to integrate the respective development processes. During fall 2012, the State approved combined Scopes of Work and Master Plans for all participating LEAs. In spring 2013, the State revised its guidance for the 2014 Master Plan submission and provided technical support and guidance to LEAs on the new process, as appropriate.
In Year 2, MSDE assigned a State-level liaison to each participating LEA to serve as the main point of contact for the LEAs and to provide support and assistance, as necessary. The Division of Academic Reform and Innovation established a monthly reporting system
and amendment process for LEAs to ensure that the State receives information about progress and issues in local implementation, focusing on budgetary requirements and compliance issues. In Year 3, the State continued to review these monthly reports and follow up with LEAs as needed. In May and June 2013, MSDE conducted LEA on-site reviews. In preparation for the visits, LEAs were asked to share accomplishments, challenges, how they have addressed those challenges, and evidence of success for each reform area and LEA-specific project. However, while beneficial, the visits focused predominantly on LEA compliance with approved project plans and budgetary requirements, rather than on fidelity of implementation.
Throughout SY 2012-2013, Maryland still did not have a strategy in place to systematically collect formative feedback on LEA capacity and the quality of implementation across the education reform areas. Specifically, Maryland has not developed processes to determine the status or extent of CCSS implementation across LEAs and schools or identified what additional support LEAs need to successfully utilize its new technology systems. MSDE plans to hold LEA Stat meetings in fall 2013 to assess the progress and quality of implementation of LEA-level Race to the Top implementation and provide more guidance and support to LEAs.
Maryland continued to host professional development academies to support educators across the State. The State hosted its third series of Educator Effectiveness Academies in summer 2013 which provided CCSS professional development to principals and teachers from every school in the State. More than 6,000 teachers and principals across the State attended the academies (see Standards and Assessments). The State also held its third Teacher Induction Academy in June 2013, reaching approximately 200 new teacher mentors and induction coordinators in an effort to ensure that all new teachers in Maryland public schools participate in a high-quality, supportive teacher induction program (see Great Teachers and Leaders). Additionally, the State held its second Academy for School Turnaround in summer 2013 and worked directly with Executive Officers to personalize the content for their principals.
8 Master Plans are plans developed by each LEA for improving student achievement and closing achievement gaps as well as aligning local priorities with annual budgets.

Maryland Year 3: School Year 2012 – 2013Race to the Top 6
State Success Factors
LEA participationTwenty-two of Maryland’s 24 LEAs agreed to participate in the State’s Race to the Top plan and continued to participate throughout Year 3. Although the two remaining LEAs, Frederick County and Montgomery County, are not fully participating in Race to the Top, they are involved in some aspects of the work. For example, these LEAs participated in the Educator Effectiveness Academies and the Teacher Induction Academy held during summer 2013.
LEAs participating in Maryland’s Race to the Top plan
22
2
Participating LEAs (#)
Involved LEAs (#)
K-12 students in LEAs participating in Maryland’s Race to the Top plan
639,652184,390
K-12 students (#) in participating LEAs
K-12 students (#) in involved LEAs
Students in poverty in LEAs participating in Maryland’s Race to the Top plan
306,389
59,319
Students in poverty (#) in participating LEAs
Students in poverty (#) in involved LEAs
The number of K-12 students and number of students in poverty statewide are calculated using pre-release data from the National Center for Education Statistics’ (NCES) Common Core of Data (CCD). Students in poverty statewide comes from the CCD measure of the number of students eligible for free or reduced price lunch subsidy (commonly used as a proxy for the number of students who are economically disadvantaged in a school) under the U.S. Department of Agriculture’s National School Lunch Program. The students in poverty statewide count is an aggregation of school-level counts summed to one State-level count. Statistical procedures were applied systematically by CCD to these data to prevent potential disclosure of information about individual students as well as for data quality assurance; consequently State-level counts may differ from those originally reported by the State. Please note that these data are considered to be preliminary as of August 21, 2013.
For State-reported context, please refer to the Race to the Top APR at www.rtt-apr.us.

Maryland Year 3: School Year 2012 – 2013Race to the Top 7
State Success Factors
Stakeholder engagementKey activities and stakeholdersIn October 2012, Maryland began sending frequent updates to LEA Superintendents, other LEA points of contact, MSDE leadership, and external stakeholders to ensure timely and informative communication on implementation of the teacher and principal evaluation systems. In addition, the State created a new website dedicated to teacher and principal evaluations and supports that houses all relevant materials, tools, and resources.
The State also continued its partnership with Institutions of Higher Education (IHEs) and the business community and as part of its Race to the Top work. For example, MSDE held meetings with Maryland IHEs to provide updates and resources on CCSS implementation and continued to collaborate to enhance and develop new teacher preparation programs. Additionally, the State partnered with the Maryland Business Roundtable to develop the STEM Resource Clearinghouse, an online repository of lessons, tools, videos, and other resources that teachers can access to support instruction (see Science, Technology, Engineering, and Mathematics). Maryland also shared information and engaged with representatives from the State’s education organizations and other stakeholder groups during regular meetings on the Race to the Top.
Maryland received individualized technical assistance from the RSN to develop key messages and create and implement a strategic plan that benefited from the input of peers. The RSN worked with MSDE leaders to develop core messages of the plan; help develop a written narrative and PowerPoint presentation to introduce the strategic plan to the Board; and connect with other States who have gone through similar re-alignments. In addition, Maryland participated in the RSN social media work. Specifically, Maryland participated in a social media consultation to assist in the development of a social media policy that established guidelines and best practices for social media use and in research for Stakeholder Communications and Engagement Community of Practice publication, “Measurable Success, Growing Adoption, Vast Potential: Social Media Use Among State and Local Education Agencies,” highlighting findings from a “social media use” inquiry and including data from 23 State educational agencies (SEAs) and 11 LEAs.
Continuous improvementThe State reports that the primary method it uses to assess the quality of implementation of grant activities is through the program evaluation conducted by the University System of Maryland Center for Applications and Innovative Research in Education (CAIRE). In February 2013, CAIRE provided a summary of the 2012 Educator Effectiveness Academies that included several recommendations to improve them in summer 2013 (see Standards and Assessments).
CAIRE also provided a Thematic Analysis of the Breakthrough Center that analyzed MSDE’s views on the effectiveness of its internal Cross-Functional Team, comprised of representatives from across MSDE. However, the report provided limited feedback for how the State could improve the services that are provided to the lowest-achieving schools. Although CAIRE began the second phase of its evaluation, utilization and impact, in January 2013, the evaluation has not provided formative feedback across the State’s Race to the Top projects. To help ensure that CAIRE is focused on providing evaluation results and information that provides timely formative feedback and can enhance and improve the quality of implementation, MSDE performed an in-depth review of CAIRE’s work and decided to shift its focus to the outcomes of each project, rather than the progress of each project against its Scope of Work. The State hopes this shift will provide timely and formative feedback on project implementation, particularly as it moves into the final year of the Race to the Top grant.
Successes, challenges, and lessons learnedTo assess the quality of implementation at the State-level, Maryland began holding Race to the Top Stat meetings to discuss the status of each Race to the Top project and determine where projects require additional intervention. At the local-level, Maryland did not collect formative feedback on LEA capacity and the quality of implementation across the education reform areas. Specifically, Maryland did not have a process to determine the quality of CCSS implementation across the State or to identify what additional support LEAs need to successfully utilize the State’s new technology systems. In SY 2013-2014, MSDE plans to hold LEA Stat meetings to assess the progress and quality of implementation of LEA-level Race to the Top implementation. Additionally, the State will collect survey data from educators across the State to ensure it provides the resources and support needed by LEAs for successful implementation of MCCSC (see Standards and Assessments).
Through its external evaluation of all Race to the Top projects, Maryland received several reports from CAIRE that summarized its progress and provided an analysis of the 2012 Educator Effectiveness Academies. However, in Year 4, the State will shift the focus of CAIRE’s evaluation to ensure it provides timely formative feedback that can inform mid-course corrections and improve the quality of implementation across the State’s Race to the Top plan.

Maryland Year 3: School Year 2012 – 2013Race to the Top 8
State Success Factors
Student outcomes dataIn SY 2012-213, Maryland State Assessment (MSA) rates of proficiency decreased slightly or stayed about the same for both ELA and mathematics as the State began its transition to the new MCCSC in SY 2013-2014.
Student proficiency on Maryland’s ELA assessment
Grade 3 Grade 4 Grade 5 Grade 6 Grade 7 Grade 8 High School
85.185.2 82.7
89.988.7 88.3 90.090.2 88.484.683.9 84.2
81.384.2 85.1
80.982.8 81.1 83.281.8 83.0
0%
10%
20%
30%
40%
50%
60%
70%
80%
90%
100%
Per
cent
pro
ficie
nt
Actual: SY 2010—2011 Actual: SY 2011—2012 Actual: SY 2012—2013
Student proficiency on Maryland’s mathematics assessment
87.886.382.1
Grade 3
89.990.3 88.7
Grade 4
85.482.3 80.9
Grade 5
83.181.177.2
Grade 6
76.574.5 72.8
Grade 7
69.566.3 67.2
Grade 8
83.983.7 84.1
High School0%
10%
20%
30%
40%
50%
60%
70%
80%
90%
100%
Per
cent
pro
ficie
nt
Actual: SY 2010—2011 Actual: SY 2011—2012 Actual: SY 2012—2013
Preliminary SY 2012-2013 data reported as of: September 20, 2013.
NOTE: Over the last three years, a number of States adopted new assessments and/or cut scores.
For State-reported context, please refer to the Race to the Top APR at www.rtt-apr.us.

Maryland Year 3: School Year 2012 – 2013Race to the Top 9
State Success Factors
Between SY 2011-2012 and SY 2012-2013, achievement gaps on Maryland’s ELA and mathematics assessments increased slightly or stayed about the same.
Achievement gap on Maryland’s ELA assessment
22.5
16.7
31.4
11.6
16.4
6.7
17.8
26.1
10.015.116.4
6.1
17.5
26.5
10.3 16.217.0
6.30
10
30
20
50
40
60
Per
cent
age
poin
t diff
eren
ce
Actual: SY 2010—2011 Actual: SY 2011—2012 Actual: SY 2012—2013
White/Hispanic Gap
Children without Disabilities/Children with Disabilities Gap
Not Limited English Proficient/Limited English Proficient Gap
Not Low Income/Low Income Gap
Female/Male Gap
White/Black Gap
Achievement gap on Maryland’s mathematics assessment
20.723.0
37.2
16.120.5
3.6
13.3
30.4
13.618.722.3
2.8
13.6
31.1
13.3
18.321.8
3.0
0
10
30
20
50
40
60
Per
cent
age
poin
t diff
eren
ce
Actual: SY 2010—2011 Actual: SY 2011—2012 Actual: SY 2012—2013
White/Hispanic Gap
Children without Disabilities/Children with Disabilities Gap
Not Limited English Proficient/Limited English Proficient Gap
Not Low Income/Low Income Gap
Female/Male Gap
White/Black Gap
Preliminary SY 2012-2013 data reported as of: September 20, 2013.
Numbers in the graph represent the gap over three school years between two sub-groups on the State’s ELA and mathematics assessments.
Achievement gaps were calculated by subtracting the percent of students scoring proficient in the lower-performing sub-group from the percent of students scoring proficient in the higher-performing sub-group to get the percentage point difference between the proficiency of the two sub-groups.
If the achievement gap narrowed between two sub-groups, the line will slope downward. If the achievement gap increased between two sub-groups, the line will slope upward.
NOTE: Over the last three years, a number of States adopted new assessments and/or cut scores.
For State-reported context, please refer to the Race to the Top APR at www.rtt-apr.us.

Maryland Year 3: School Year 2012 – 2013Race to the Top 10
State Success Factors
Results from the 2013 NAEP assessments illustrate growth in Maryland’s reading results for grades four and eight. Although there was a negligible decrease in mathematics scores since SY 2010-2011, the percent of students scoring in the advanced range increased by eight percent in fourth-grade and five percent in eighth-grade mathematics.
Student proficiency, NAEP reading
44.743.0 42.239.9
10%
0%
20%
30%
40%
50%
60%
70%
80%
90%
100%
Per
cent
of s
tude
nts
at o
r abo
ve p
rofic
ient
Grade 8Grade 4
Actual: SY 2010—2011
Actual: SY 2012—2013
Student proficiency, NAEP mathematics
46.547.6
37.440.4
10%
0%
20%
30%
40%
50%
60%
70%
80%
90%
100%
Per
cent
of s
tude
nts
at o
r abo
ve p
rofic
ient
Grade 8Grade 4
Actual: SY 2010—2011
Actual: SY 2012—2013
NAEP is administered once every two years. The two most recent years are SY 2010-2011 and SY 2012-2013. NAEP reading and mathematics results are provided by the Department of Education’s Institute of Education Sciences. To learn more about the NAEP data, please visit http://nces.ed.gov/nationsreportcard/.
Maryland’s approved Race to the Top plan included targets for NAEP results based on percentages, not based on students’ average scale scores.
Maryland Year 3: School Year 2012 – 2013Race to the Top 11
State Success Factors
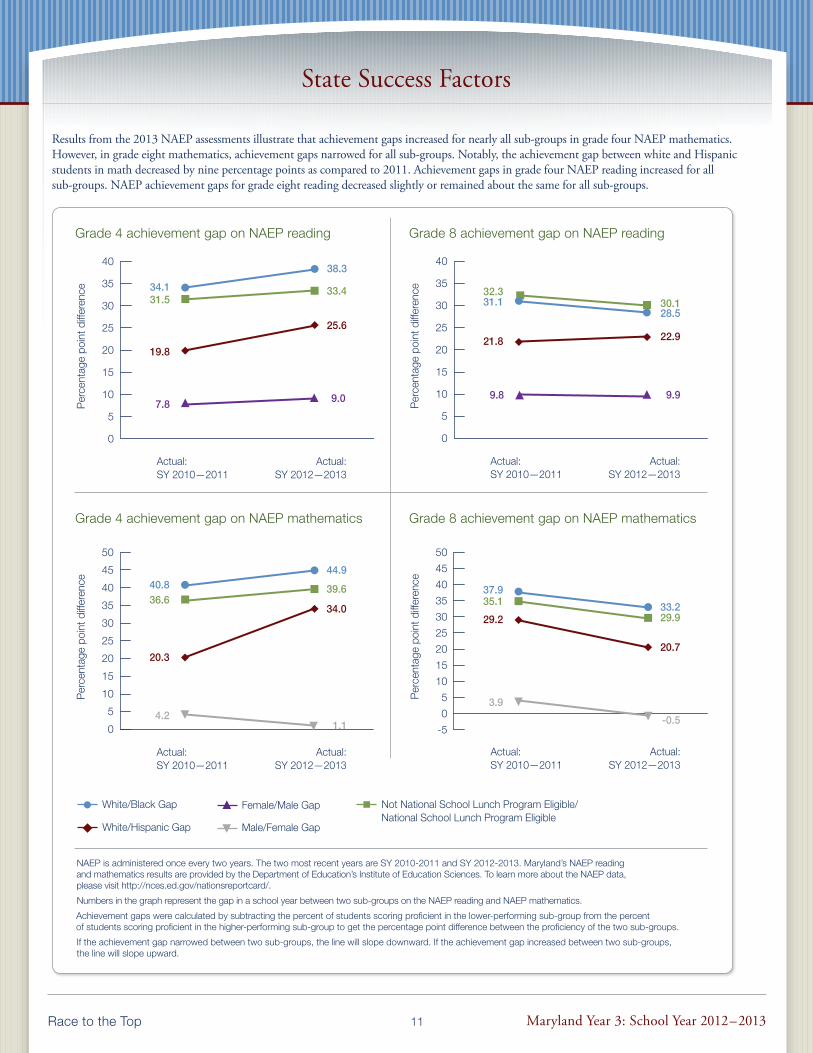
Results from the 2013 NAEP assessments illustrate that achievement gaps increased for nearly all sub-groups in grade four NAEP mathematics. However, in grade eight mathematics, achievement gaps narrowed for all sub-groups. Notably, the achievement gap between white and Hispanic students in math decreased by nine percentage points as compared to 2011. Achievement gaps in grade four NAEP reading increased for all sub- groups. NAEP achievement gaps for grade eight reading decreased slightly or remained about the same for all sub-groups.
Grade 4 achievement gap on NAEP reading
Per
cent
age
poin
t diff
eren
ce
Actual: SY 2010—2011
Actual: SY 2012—2013
0
5
10
15
20
25
30
35
4038.3
33.4
25.6
9.0
31.5
19.8
34.1
7.8
Grade 8 achievement gap on NAEP reading
Per
cent
age
poin
t diff
eren
ce
Actual: SY 2010—2011
Actual: SY 2012—2013
0
5
10
15
20
25
30
35
40
28.530.1
22.9
9.9
32.3
21.8
31.1
9.8
Grade 4 achievement gap on NAEP mathematics
0
5
10
15
20
25
30
40
35
50
45 44.9
39.6
34.0
1.1
36.6
20.3
40.8
4.2
Per
cent
age
poin
t diff
eren
ce
Actual: SY 2010—2011
Actual: SY 2012—2013
Grade 8 achievement gap on NAEP mathematics
0
-5
5
10
15
20
25
30
40
50
35
45
33.229.9
20.7
-0.5
35.1
29.2
37.9
3.9
Per
cent
age
poin
t diff
eren
ce
Actual: SY 2010—2011
Actual: SY 2012—2013
NAEP is administered once every two years. The two most recent years are SY 2010-2011 and SY 2012-2013. Maryland’s NAEP reading and mathematics results are provided by the Department of Education’s Institute of Education Sciences. To learn more about the NAEP data, please visit http://nces.ed.gov/nationsreportcard/.
Numbers in the graph represent the gap in a school year between two sub-groups on the NAEP reading and NAEP mathematics.
Achievement gaps were calculated by subtracting the percent of students scoring proficient in the lower-performing sub-group from the percent of students scoring proficient in the higher-performing sub-group to get the percentage point difference between the proficiency of the two sub-groups.
If the achievement gap narrowed between two sub-groups, the line will slope downward. If the achievement gap increased between two sub-groups, the line will slope upward.
White/Black Gap
White/Hispanic Gap
Not National School Lunch Program Eligible/ National School Lunch Program Eligible
Female/Male Gap
Male/Female Gap

Maryland Year 3: School Year 2012 – 2013Race to the Top 12
State Success Factors
High school graduation performance remained relatively the same, though the State met its SY 2012-2013 target. Finally, the State showed a slight increase in college enrollment.
High school graduation rate
10%
0%
20%
30%
40%
50%
60%
70%
80%
90%
100%
83.6 83.482.8
Gra
duat
ion
rate
Target from approved plan: SY 2012—2013
Actual: SY 2010—2011
Actual: SY 2011—2012
Preliminary SY 2011-2012 data reported as of: August 13, 2013
For State-reported context, please refer to the Race to the Top APR at www.rtt-apr.us.
College enrollment rate
10%
0%
20%
30%
40%
50%
60%
70%
80%
90%
100%
69.366.7
62.7
Col
lege
enr
ollm
ent r
ate
Target from approved plan: SY 2012—2013
Actual: SY 2011—2012
Actual: SY 2012—2013
Preliminary SY 2012-2013 data reported as of: August 21, 2013.
For State-reported context, please refer to the Race to the Top APR at www.rtt-apr.us.
The Department provided guidance to States regarding the reporting period for college enrollment. For SY 2012-2013 data, States report on the students who graduated from high school in SY 2010-2011 and enrolled in an institution of higher education (IHE).

Maryland Year 3: School Year 2012 – 2013Race to the Top 13
Standards and Assessments
Implementing rigorous college- and career-ready standards and assessments that prepare students for success in college and career is an integral aspect of education reform in all Race to the Top States.
Supporting the transition to college- and career-ready standards and high-quality assessmentsIn June 2010, the Maryland State Board of Education adopted the CCSS for ELA and mathematics for kindergarten through twelfth grade (K-12) and committed to fully implement the CCSS in classrooms in SY 2013-2014. Maryland is also a governing member of PARCC, and is committed to administering PARCC assessments in SY 2014-2015. In June 2013, the Maryland State Board of Education also adopted the Next Generation Science Standards which identify the science practices and content that all students should master in order to be fully prepared for college and careers. Teachers received training on the new science standards during the 2013 Educator Effectiveness Academies.
In order to prepare graduates who are skilled in STEM and proficient in languages other than English, Maryland provided subgrants to eight LEAs to plan and implement elementary school STEM programs as part of its World Languages project. In SY 2012-2013, six LEAs began implementing new world language programs. Three additional LEAs were selected to participate in the project in Year 4. Maryland also developed five additional STEM curriculum modules for use in language programs statewide, and translated the modules into Spanish, Arabic, and Chinese. In total, MSDE has developed 10 additional STEM curriculum modules for use by educators across the State.
During summer 2012, the State established agreements with two additional LEAs to implement the International Technology and Engineering Educators Association’s (ITEEA) Foundations of Technology course for students, bringing the total number of LEAs to 20. Throughout SY 2012-2013, the State provided monthly online professional development to all LEAs participating in the project. In SY 2013-2014, six schools will begin implementing a four-part Career and Technical Education course in Construction Management and Design that the State developed in Years 2 and 3 in collaboration with the Southern Regional Education Board consortium.
The State continued developing a plan for the design and implementation of a formative assessment system, including a formative assessment item bank that includes items aligned to PARCC. Due to capacity challenges and procurement delays, the State is significantly delayed in the development and implementation of this project; as a result, the formative assessment system may not be available for use by LEAs until SY 2014-2015.
As part of the RSN’s Transitions Workgroup, Maryland participated in a convening that focused on developing solutions to the implementation challenges States will face in SY 2013-2014 in transitioning to new college- and career-ready standards and assessments and new evaluation systems, communicating the interconnectedness of reforms and building principal capacity. Following the convening, the Maryland work
group members continued to develop solutions to these challenges by designing new approaches to coordinate and integrate the reforms within the State educational agency, developing integrated key messages and communication plans, participating in a series of learning modules on the State role in building principal capacity and engagement, developing new tools and sharing resources peer-to-peer and collecting feedback from the field on the status of reforms.
World Languages Program
As part of the World Languages Program, Anne Arundel County was able to implement an elementary school mathematics and science program in Arabic (grades 4-5) and in Chinese (grades K-5). Alleghany County implemented its kindergarten mathematics and science program in Mandarin. All program participants monitor student progress through an electronic platform that is also available to parents. Both counties will continue to sustain the programs once Race to the Top funding is no longer available.
Dissemination of resources and professional developmentIn summer 2013, the State hosted its third set of Educator Effectiveness Academies. During the four-day academies, participants explored the State’s CMS and LMS, developed transition plans for SY 2013-2014 to guide MCCSC implementation, and participated in content-based school team sessions on ELA, mathematics, and the Next Generation Science Standards. CAIRE completed an evaluation of the summer 2012 Educator Effectiveness Academies in February 2013 that concluded that the Academies were very successfully organized based on surveys from participants and attendance at the Academies. The CAIRE report also included several recommendations for the summer 2013 sessions, such as pairing small and large LEAs together, facilitating sessions to share information across LEAs, and tailoring content to LEA needs, which the State took into account in planning the 2013 Educator Effectiveness Academies. Although the State reported it did not have the capability to differentiate the Educator Effectiveness Academies, the first day of each Academy was held at participants’ home schools to allow each school team to plan for full implementation of MCCSC based on its implementation status. Additionally, MSDE revised the transition plan templates to focus on professional learning to meet the individual needs of the school and/or the LEA. Although CAIRE conducted an evaluation of the SY 2012-2013 transition plans, the State was unable to provide any information regarding the effectiveness of the plans in facilitating a smooth transition to the CCSS. MSDE will continue to host online follow up sessions throughout SY 2013-2014 to ensure it is providing targeted support to educators across the State.

Maryland Year 3: School Year 2012 – 2013Race to the Top 14
Standards and Assessments
Throughout SY 2012-2013, Maryland continued to develop model units and lessons aligned to the CCSS for each grade level. The model units and lessons were available for educators at the 2013 Educator Effectiveness Academies. To ensure the resources are high-quality, the State submitted its units and lessons for review by other States and received positive feedback, particularly from other PARCC member States. In Year 3, Maryland also finalized STEM Standards of Practice that were reviewed and modified based on stakeholder feedback.9
Successes, challenges, and lessons learnedDuring Year 3, Maryland provided proactive professional development for teachers and used data to inform implementation of the
Foundations for Technology course in SY 2012-2013. Additionally, Maryland provided professional development on the CCSS for over 6,000 educators through the 2013 Educator Effectiveness Academies and developed and disseminated CCSS-aligned model units and lessons for each grade level in both ELA and mathematics. However, the State did not receive timely feedback on the 2012 Educator Effectiveness Academies or transition plans. As a result, the State was unable to provide any information regarding the effectiveness of the plans in facilitating a smooth transition to the MCCSC. Moreover, Maryland did not collect formative feedback on MCCSC implementation throughout SY 2012-2013 and did not have a strategy to determine the quality of implementation across LEAs and schools. To address this challenge, the State reports that it will survey educators in fall 2013 and spring 2014, and conduct onsite visits to each LEA, to determine what resources they need and how best to support them as they fully implement MCCSC in SY 2013-2014.
Data Systems to Support Instruction
Statewide longitudinal data systems (SLDS) and instructional improvement systems (IIS) enhance the ability of States to effectively manage, use, and analyze education data to support instruction. Race to the Top States are working to ensure that their data systems are accessible to key stakeholders and that the data support educators and decision-makers in their efforts to improve instruction and increase student achievement.
Fully implementing a statewide longitudinal data systemAs of June 30, 2011, Maryland reported that its SLDS met all 12 elements identified in the America COMPETES Act. In January 2013, the State completed the development and implementation of the P-20 Workforce Data Warehouse and Center, including a public-facing portal and secure dashboards. The P-20 Workforce and Data Warehouse and Center was completed five months ahead of the schedule in the State’s approved Race to the Top plan.
Accessing and using State dataIn Year 3, Maryland continued to expand and upgrade its data systems to support Race to the Top initiatives. In its K-12 longitudinal data system (K-12 LDS), Maryland installed enhanced capabilities within the system, such as email notifications and reporting and inquiry tools. Despite this progress, the State did not complete development of the K-12 LDS in February 2013, as outlined in its approved plan. The
State experienced technical challenges when developing secure user access to the system and as a result, the K-12 LDS will not be complete until fall 2013.
Although Maryland has been developing data dashboards using data from the K-12 LDS over the past three years, the State will not launch the dashboards until fall 2013 due to technical challenges described above. Similarly, the State was unable to launch the multi-media modules that will train users on how to use the data dashboards. Once available, the State reports that the dashboards and associated reports will provide student performance data and help to ensure data from the K-12 LDS are in alignment with the requirements of the Family Educational Rights and Privacy Act (FERPA) and are available to inform key stakeholders and support decision-making for educators.
Participating LEAs continued to implement data system upgrades and improve local data infrastructure using subgrants from the State. For example, LEAs chose to enhance wireless connections, upgrade security systems, or purchase upgraded equipment.
9 Maryland’s Science, Technology, Engineering, and Mathematics (STEM) Standards of Practice guide STEM instruction by defining the combination of behaviors, integrated with STEM content that the State expects of proficient STEM students. These behaviors include engagement in inquiry, logical reasoning, collaboration, and investigation.

Maryland Year 3: School Year 2012 – 2013Race to the Top 15
Data Systems to Support Instruction
Using data to improve instructionIn its Race to the Top application, Maryland considered the development of a high-quality IIS composed of multiple systems to be the centerpiece of its reform agenda. The State has dedicated more of its Race to the Top funds to its IIS than to any of the other Race to the Top education reform areas.
In summer 2013, the State launched its joint CMS and LMS10 at the Educator Effectiveness Academies, one year later than originally planned. The purpose of the joint CMS and LMS is to create a standardized curriculum management system that provides teachers with a rich bank of instructional resources to support the transition to the MCCSC and improve and differentiate instruction. Additionally, the LMS component provides professional development to improve teacher practice. Maryland reports that difficulties hiring qualified staff, as well as lengthy procurement processes contributed to the ongoing delays in completing the developing of the CMS and LMS. At the summer 2013 Educator Effectiveness Academies, the State organized a virtual tour for academy participants and uploaded all available CCSS resources for educator use (see Standards and Assessments). However, the State experienced delays securing a vendor to identify and create a repository of additional CCSS materials as part of its instructional toolkit project, and anticipates that these resources will not be available until September 2014, one year later than originally planned.
Successes, challenges, and lessons learnedThe State completed development of its CMS and LMS in time to introduce the systems to educators participating in the summer 2013 Educator Effectiveness Academies and for use in SY 2013-2014 as educators begin fully implementing the CCSS. Additionally, the State launched its P-20 Workforce Data Warehouse and Center in January 2013, five months ahead of schedule. However, the State continues to experience delays in implementing upgrades to the technology infrastructure for the MLDS, data dashboards, multi-media training modules to support implementation of the data dashboards, and securing additional CCSS resources. As a result, many resources will not be available for use by educators until SY 2013-2014 or SY 2014-2015.
Although the State began completing development of several technology systems in Year 3, it still does not have a comprehensive performance management strategy for identifying dependencies between technology projects and other reform initiatives, communicating with stakeholders, and training educators to ensure they know how to use and benefit from the State’s projects. Additionally, the State is not able to track usage data of the CMS and LMS and is still developing a strategy for collecting formative feedback from LEAs and educators. As a result, the State is unable to determine if the resources are meeting the needs of educators.
Great Teachers and Leaders
Race to the Top States are developing comprehensive systems of educator effectiveness by supporting high-quality pathways for aspiring teachers and principals, ensuring equitable distribution of effective teachers and principals, improving the effectiveness of teacher and principal preparation programs, and providing effective supports to all educators. As part of these efforts, Race to the Top States are designing and implementing rigorous, transparent, and fair evaluation systems for teachers and principals; conducting annual evaluations that include timely and constructive feedback; and using evaluation information to inform professional development, compensation, promotion, retention, and tenure decisions.
Improving teacher and principal effectiveness based on performanceDuring Year 3, Maryland continued development of its teacher and principal evaluation system based on recommendations received from the Maryland Council on Educator Effectiveness (MCEE) in Year 1. In December 2012, Maryland refined its State teacher and principal
evaluation model—the default model that LEAs will use if they opt not to develop their own models—and guidelines to which LEAs must adhere if they develop their own models. Specifically, Maryland incorporated Student Learning Objectives (SLOs) to measure student growth for principals, teachers of tested grades and subjects, and teachers of non-tested grades and subjects because it believes that SLOs will allow for LEA- and school-specific goals to be captured
10 The Learning Management System (LMS), a component of the State’s instructional improvement system (IIS), will include the functionalities expected of both the Course Registration and E-Learning System within one system instead of two separate systems.

Maryland Year 3: School Year 2012 – 2013Race to the Top 16
Great Teachers and Leaders
while also maintaining a focus on the importance of student growth. Maryland also included the Maryland School Performance Index,11 a school-wide measure of achievement, reduction of the student achievement gap, and growth, as one of the multiple measures for all principals and teachers. Despite these changes, Maryland submitted additional requests to the Department in summer 2013 to further modify the State model.
From January to March 2013, all participating LEAs conducted a statewide field test. MSDE states that the purpose of this field test was to provide a collaborative and innovative platform for LEAs to develop and test components of their teacher and principal evaluation systems in preparation for full implementation of the system. Three LEAs piloted the State teacher evaluation model. At the end of the field test, Maryland reported that over 8,600 educators participated in the field test and received ratings based on the new evaluation systems. Participating LEAs were required to submit their evaluation plans and models for SY 2013-2014 to MSDE for approval by June 2013; all 22 participating LEA plans were approved. However, the State submitted a request to the Department that is currently under review to delay full implementation of its evaluation system for one year, including the student growth component.
Throughout the field test, MSDE held monthly meetings with all LEAs in the State to share information, collectively discuss problems of practice, and offer opportunities for collaboration. Despite these opportunities, several LEAs expressed frustration that there were not more formal opportunities to collaborate and share resources across LEAs. Maryland hired an independent field monitor to visit each participating LEA, assess the fidelity of implementation, and gather qualitative information through separate focus groups of teachers, principals, and LEA-level central office administration throughout the field test. The field monitor found that: (1) there is a substantial learning curve for educators when implementing SLOs; (2) effective communication with all stakeholders, including educators and union representatives, is essential for successful implementation of the evaluation system; (3) teachers expressed concern about principal capacity to serve as effective evaluators; and (4) LEAs are not consistently prepared to use evaluation data to support educators and improve instruction. To address these findings, Maryland developed a professional development plan that details responsibilities of teachers, principals, Executive Officers, central office staff, and State personnel throughout SY 2013-2014.
In March 2013, the State adjusted its student growth model based on feedback from LEAs and an analysis of existing assessment data. After speaking with local Superintendents, the State determined that it would not calculate the performance ratings at the State-level. As a result, MSDE finalized the methodology for calculating the MSA translation for educator effectiveness levels and supported LEAs to
calculate the ratings at the local-level. In summer 2013, the State offered subgrants to LEAs to assist in the enhancement of local technology systems or preparation of evaluators and educators to increase efficiencies in the implementation of evaluation systems.
MSDE participated in an RSN work group meeting, Learning from Experience to Generate Continuous Improvement of Evaluation Systems, in June 2013. During the convening, MSDE identified existing and new approaches to create expectations for continuous improvement of teacher and leader evaluation systems. The convening focused on three high priority areas of interest – improving the accuracy of teacher and leader effectiveness ratings over time, expanding principal capacity to successfully implement teacher evaluation systems and communicating about the implementation and improvement of teacher evaluation systems.
Ensuring equitable distribution of effective teachers and principalsIn Year 3, Maryland continued to work toward its goals of increasing the equitable distribution of effective teachers and principals in high-poverty, high-minority, and hard-to-staff schools. Through a project focused on building leadership capacity in low-achieving urban and rural districts, the State awarded a subgrant to Salisbury University and the University of Maryland Eastern Shore to train a cohort of 25 highly effective leaders to serve five rural Eastern Shore counties. By summer 2013, over half of the candidates had already been promoted by their respective school districts. During Year 3, New Leaders exceeded its goals, placing 65 principals in BCPS and PGCPS.
In Year 3 Maryland continued its partnership with UTeach to increase the number of STEM teachers entering the classroom, enrolling over 85 students in the first course of the sequence in fall 2013. MSDE reported that feedback from students was positive. Maryland also continued working with seven IHEs to explore the attributes of successful teacher preparation programs for high-poverty/high-minority schools. Additionally, MSDE hosted six events for teachers and teacher mentors covering topics such as “Creating Guidelines for Teacher Preparation Programs” and “Making Content Instruction Comprehensible for English Leaners.”
The State made awards to BCPS and PGCPS to establish LEA-specific programs to reward effective teachers and principals serving in the State’s lowest-achieving five percent of schools in SY 2012-2013; each LEA made financial awards to eligible teachers in September 2013. Four LEAs, Kent County, Prince George’s County, Baltimore County and Baltimore City Public Schools received subgrants to provide incentives for 38 teachers in shortage areas, such as STEM, English language learners, and special education, in SY 2012-2013.
11 Maryland established the School Performance Index as a part of its accountability plan for Elementary and Secondary Education Act (ESEA) flexibility, approved on May 29, 2012. The School Performance Index for grades pre-kindergarten through eight (K-8) includes achievement, gap, and growth data (all as measured by student performance on the Maryland State Assessment (MSA)). The School Performance Index for grades 9 through 12 includes achievement and gap data (as measured by the High School Assessment, cohort graduation rate, and cohort dropout rate) and college- and career- readiness (as measured by cohort graduation rate and college and career preparation).

Maryland Year 3: School Year 2012 – 2013Race to the Top 17
Great Teachers and Leaders
In addition, through a program offering incentives to teachers who obtain English for Speakers of Other Languages (ESOL) certification, the State has certified 167 ESOL teachers in 18 LEAs since the beginning of the grant period.
Providing effective support to teachers and principalsDuring Year 2, the State provided MCCSC professional development through the Educator Effectiveness Academies (see Standards and Assessments). Maryland also continued its work to address the needs of new teachers through its Teacher Induction Academy, which aims to ensure that all teachers have the opportunity to participate in a high-quality, supportive teacher induction program. The 2013 Teacher Induction Academy focused on “Mentoring for the Common Core: Reaching All Students.” The State has received very positive feedback from participants of the Teacher Induction Academy; on average, 90 percent of participants found the sessions useful or very useful in deepening their skills and knowledge. Maryland continued to hold quarterly LEA Teacher Induction Coordinator meetings to provide ongoing support to LEAs. To inform its quarterly meeting, Teacher Induction Academies, and resources, the State conducted site visits to all 24 LEAs to collect information on successes, best practices, and challenges with program implementation.
Successes, challenges, and lessons learnedDuring Year 3, the State continued to provide professional development for its teachers and leaders through Educator Effectiveness Academies and the Teacher Induction Academy. Additionally, the State worked with IHEs and other partners to expand preparation programs and train highly effective leaders, resulting in 65 new principals in PGCPS and BCPS.
In December 2012, the Department expressed its concerns with the overall strategic planning, implementation, and evaluation of the State’s teacher and principal evaluation system, including the quality of the SY 2011-2012 seven-LEA pilot, as well as communication with and support provided to participating LEAs. Although the State made improvements to implementation in SY 2012-2013, the Department remains concerned about the strategic planning and evaluation of the SY 2012-2013 field test. MSDE must provide more comprehensive training and support related to implementation of the evaluation system for LEAs throughout SY 2013-2014. In response to the Department’s concerns, as well as findings from its independent field monitor, Maryland developed a professional development plan that details responsibilities of teachers, principals, Executive Officers, central office staff, and MSDE personnel throughout SY 2013-2014.
Turning Around the Lowest-Achieving Schools
Race to the Top States are supporting LEAs’ implementation of far-reaching reforms to turn around lowest-achieving schools by implementing one of four school intervention models.
Support for the lowest-achieving schoolsMSDE created the Breakthrough Center in 2008 to provide a coherent strategy for leveraging and coordinating the State’s services to build the capacity of schools and LEAs to lead and sustain student achievement gains. The Breakthrough Center leads Maryland’s efforts to support and turn around lowest-achieving schools, and serves as a liaison among MSDE, LEAs, and schools. The State also created a Cross Functional Team comprised of members from across MSDE to ensure a coordinated effort in supporting the lowest-achieving schools.
As of SY 2011-2012, a total of 16 schools in Maryland were implementing one of the four school intervention models; 8 are implementing the restart model and 8 are implementing the turnaround model. Throughout Year 3, the Breakthrough Center continued to work with the 16 schools, as well as their feeder schools, to improve student performance by providing instructional and leadership support, as well as other student support services. Specifically, the Breakthrough Center administered robust needs
assessments to determine priorities for LEA and school actions; provided feedback on the implementation of schools’ intervention models as required by the School Improvement Grant (SIG) program; provided monthly, job-embedded CCSS-aligned teacher professional development in ELA and mathematics; provided leadership support for principals and instructional leadership teams; and evaluated school culture, climate, and student services teams to identify areas for improvement and school-specific technical assistance. In order to assess the quality and impact of the professional development provided by the Breakthrough Center, MSDE conducted mid-year and end-of-year observations to measure professional development effectiveness and inform planning for the subsequent school year. For example, after conducting an end-of-year walkthrough focused on the rigor of MCCSC implementation, reading, and student engagement, MSDE noted that although lesson plans were aligned to the MCCSC, teachers needed additional support developing lessons for reading text closely and support with student engagement. As a result, MSDE focused on student engagement strategies, scaffolding text-dependent

Maryland Year 3: School Year 2012 – 2013Race to the Top 18
questions, broadening students’ text annotation strategies, and having teachers adjust instruction throughout the lesson based upon students’ performance in its monthly professional development cycle.
After hosting its first Academy for School Turnaround in summer 2012, MSDE held follow-up sessions throughout SY 2012-2103 to provide ongoing support to Executive Officers and principals in the lowest-achieving schools. The State held its second Academy for School Turnaround in summer 2013 and worked directly with Executive Officers to personalize the content for their principals.
Maryland was also one of six member States participating in the RSN’s Performance Management for School Turnaround work group. Maryland completed a performance management self-assessment during summer 2013 and identified key priorities for improving their performance management practices with school districts. MSDE attended a September 2013 meeting on Performance Management for School Turnaround Programs and is now participating in an ongoing work group.
During Year 2, the State awarded a contract to CAIRE to conduct a formative evaluation of the Breakthrough Center’s work, which will provide an analysis of the delivery of support services to lowest-achieving schools and determine the degree to which LEAs are building capacity to support these schools. In Year 3, CAIRE provided
a Thematic Analysis the Breakthrough Center based on 26 interviews with and observations of members of the Cross Functional Team. However, the report provided limited feedback for how to improve the services that are provided to the lowest-achieving schools. In Year 4, CAIRE plans to conduct several case studies to capture best practices and lessons learned.
Successes, challenges, and lessons learnedIn Year 3, Maryland continued to provide high-quality support to its lowest-achieving schools in PGCPS and BCPS. The State ensures alignment and integration of supports for the lowest-achieving schools, both within the Breakthrough Center and across MSDE. The State also provided support to applicable Executive Officers and principals through the Academy for School Turnaround.
The State actively collects formative feedback from teachers and principals that receive support and services from the Breakthrough Center, allowing the State to make mid-course corrections immediately to ensure it provides high-quality support. However, it is unclear if the State has received formative, actionable feedback from CAIRE to further inform its work.
Charter Schools
Ensuring successful conditions for high-performing charter schoolsDuring Year 3, the State finalized the “Maryland Quality School Standards for Charter Schools” and accompanying resource guide. The purpose of the Quality Standards is to develop a framework for charter schools to conduct self-assessments and to help guide improvement and development efforts. Maryland reports that it has been pleased with the response it has received on the Quality Standards; charter school authorizers are satisfied with the level of technical assistance they have received thus far. The State distributed the final Quality Standards in summer 2013. Also in summer 2013, Maryland conducted a pilot of a Self-Assessment tool with four charter schools.
Although the State opened Furman L. Templeton Academy as a restart charter school in August 2011, it has continued to struggle to identify additional restart charter schools in BCPS and PGCPS as outlined in its approved Race to the Top plan.
Successes, challenges, and lessons learnedThe State finalized its “Maryland Quality School Standards for Charter Schools,” an important milestone in the State’s project plan. However, the State failed to identify and open two additional restart schools as initially planned. The State continues to work with LEAs to identify and open high-performing charter schools as outlined in its approved plan.
Turning Around the Lowest-Achieving Schools

Maryland Year 3: School Year 2012 – 2013Race to the Top 19
Emphasis on Science, Technology, Engineering, and Mathematics (STEM)
Race to the Top States are committed to providing a high-quality plan with a rigorous course of study in STEM. In doing so, each State must cooperate with STEM-capable community partners in order to prepare and assist teachers in integrating STEM content across grades and disciplines, in promoting effective and relevant instruction, and in offering applied learning opportunities for students. A focus on STEM furthers the goal of preparing more students for an advanced study in sciences, technology, engineering, and mathematics, including among underrepresented groups such as female students.
State’s STEM initiativesIn June 2013, the Maryland State Board of Education adopted the Next Generation Science Standards which identify the science practices and content that all students should master in order to be fully prepared for college and careers. During Year 3, Maryland also finalized its STEM Standards of Practice. The STEM Standards of Practice, as well as STEM lessons that were developed and reviewed by educators and STEM stakeholders across the State, were used at the 2013 Educator Effectiveness Academies. MSDE also continued to expand its International Technology and Engineering Educators Association’s (ITEEA) Foundations of Technology and Career and Technical Education course in Construction Management and Design (see Standards and Assessments).
Career technology education enrollment
Performance measureActual: SY 2011–2012
Actual: SY 2012–2013
Target From Maryland’s Approved Plan: SY 2012–2013
AP STEM Exams -- Receiving 3, 4, or 5
19,078 20,900 19,024
AP STEM Number of Exams
31,073 33,021 32,119
Biomedical Sciences 1,348 1,928 1,081
IT Networking Academy 1,616 2,154 1,664
Computer Science 1,903 1,818 1,802
Pre-Engineering 11,530 11,722 10,437
For State-reported context, please refer to the Race to the Top APR at www.rtt-apr.us.
The Maryland Business Roundtable (MBRT) developed the STEM Resource Clearinghouse, an online repository of lessons, tools, videos, and other resources that teachers can access to support instruction. A group of 20 teachers identified by LEAs created lesson plans and additional resources that will be included in the STEM Resource Clearinghouse. In Year 2, Maryland launched the Career Exploration website for students within the STEMnet Student Hub – the portion of STEMnet that is intended for student use. Through this website, students can view profiles of STEM professionals and learn about STEM-related career opportunities. Maryland officially launched its STEM Specialists in the Classroom program in 15 LEAs. Through this program, STEM professionals from the community visit
classrooms and present information about their fields of expertise. Through the STEMnet Teacher Hub, STEM specialists can post information about their areas of expertise, and teachers can view profiles and choose specialists to visit their classrooms.
During Year 3, the Elementary STEM Network continued its partnership with nine teacher preparation programs to produce more STEM educators for Maryland’s schools. As of spring 2013, there were ten programs under development: four partners are developing elementary STEM concentration programs for pre-service teachers, four are developing STEM endorsement programs for practicing teachers, and one partner is developing both programs. In SY 2012- 2013, approximately 20 students were enrolled in pre-service programs and approximately 85 candidates were enrolled in in-service programs. The State continued to provide targeted professional development to all teacher preparation program partners.
In Year 2, Maryland released a request for vendor proposals for the creation of the first two of four planned online STEM courses – Cybersecurity and Environmental Science – and identified Forensics and Video Game Design as the topics for the two other courses. Due to continued delays in developing and receiving approval of the request for vendor proposals, the first two courses will not be available until winter 2013, instead of winter 2012 as originally planned.
Successes, challenges, and lessons learnedAs a part of its Race to the Top plan, Maryland committed to developing and providing STEM resources and opportunities for teachers and students across the State. In Year 3, Maryland made significant progress; the State formally adopted the Next General Science Standards, finalized its STEM Standards of Practice, developed lesson plans with educators across Maryland, and continued its work with the MBRT to provide STEM resources to teachers and students. The State also continued its work with nine IHE partners through the Elementary STEM Network, launching preparation programs for teacher candidates and in-service programs for existing teachers. Finally, the State exceeded its targets for the number of students that receive a 3, 4, or 5 on STEM Advanced Placement Exams in SY 2012- 2013.
In Year 4, the State hopes to include three additional IHEs in the Elementary STEM Network. Despite the accomplishments, the State is still delayed in the implementation of online STEM courses for students.
Maryland Year 3: School Year 2012 – 2013Race to the Top
Progress Updates on Invitational Priorities
20
Expansion and adaptation of statewide longitudinal data systems One of Maryland’s Race to the Top goals is to develop and implement a statewide centralized student transcript system. The purpose of the project is to connect all 24 Maryland LEAs to the University
of Maryland’s electronic transcript system. This system will allow for K-12 and higher education data linking and will reduce costs for student transcript preparation and transmission to colleges. All LEAs were on track to implement the statewide transcript system, including the new interface with the LEA student information system to initiate electronic transcripts, prior to the start of SY 2013-2014.
Looking Ahead to Year 4
In Year 4, Maryland will fully implement the MCCSC, followed by administration of the PARCC assessments in SY 2014-2015. Maryland educators will have access to additional resources to support CCSS implementation through the State’s CMS and LMS. The State reports that it plans to survey educators in fall 2013 and spring 2014 to determine what resources they need and how best to support them with CCSS implementation. Rather than host in-person Educator Effectiveness Academies in summer 2014, Maryland is developing 12 online courses on the MCCSC and effective use of the IIS that will be accessible to educators across the State. In addition, the State will conduct onsite visits to schools in every LEA to determine the level of MCCSC implementation and identify additional resources and professional development opportunities to support LEAs.
In SY 2013-2014, MSDE plans to complete development of several technology-based resources and systems, including enhancements to the MLDS, data dashboards and accompanying multi-media training modules, online STEM courses, and the repository of CCSS materials.
To ensure that LEA and school-level personnel are prepared to utilize these new resources, Maryland must develop a comprehensive communications, training, and roll-out plan.
Finally, to ensure successful implementation of its teacher and principal evaluation systems in SY 2013-2014, MSDE plans to provide more comprehensive training and support for LEAs. In response to the Department’s concerns, as well as findings from its independent field monitor, Maryland developed a professional development plan that details responsibilities of teachers, principals, Executive Officers, central office staff, and MSDE personnel throughout SY 2013-2014. The State has submitted a request to the Department that is currently under review to delay full implementation of its evaluation system, including the student growth component, by one year to SY 2014- 2015, stating that it would like more time to finalize the teacher and principal evaluation system and build capacity across its participating LEAs.
Budget
For the State’s expenditures through June 30, 2013, please see the APR Data Display at http://www.rtt-apr.us.
For State budget information, see http://www2.ed.gov/programs/racetothetop/state-scope-of-work/index.html.
For the State’s fiscal accountability and oversight report, see http://www2.ed.gov/programs/racetothetop/performance.html.

Maryland Year 3: School Year 2012 – 2013Race to the Top 21
Glossary
Alternative routes to certification: Pathways to certification that are authorized under the State’s laws or regulations that allow the establishment and operation of teacher and administrator preparation programs in the State, and that have the following characteristics (in addition to standard features such as demonstration of subject-matter mastery, and high-quality instruction in pedagogy and in addressing the needs of all students in the classroom including English learners and students with disabilities): (1) can be provided by various types of qualified providers, including both institutions of higher education (IHEs) and other providers operating independently from institutions of higher education; (2) are selective in accepting candidates; (3) provide supervised, school-based experiences and ongoing support such as effective mentoring and coaching; (4) significantly limit the amount of coursework required or have options to test out of courses; and (5) upon completion, award the same level of certification that traditional preparation programs award upon completion.
Amendment requests: In the event that adjustments are needed to a State’s approved Race to the Top plan, the grantee must submit an amendment request to the Department for consideration. Such requests may be prompted by an updated assessment of needs in that area, revised cost estimates, lessons learned from prior implementation efforts, or other circumstances. Grantees may propose revisions to goals, activities, timelines, budget, or annual targets, provided that the following conditions are met: the revisions do not result in the grantee’s failure to comply with the terms and conditions of this award and the program’s statutory and regulatory provisions; the revisions do not change the overall scope and objectives of the approved proposal; and the Department and the grantee mutually agree in writing to the revisions. The Department has sole discretion to determine whether to approve the revisions or modifications. If approved by the Department, a letter with a description of the amendment and any relevant conditions will be sent notifying the grantee of approval. (For additional information please see http://www2.ed.gov/programs/racetothetop/amendments/index.html.)
America COMPETES Act elements: The twelve indicators specified in section 6401(e)(2)(D) of the America COMPETES Act are: (1) a unique statewide student identifier that does not permit a student to be individually identified by users of the system; (2) student-level enrollment, demographic, and program participation information; (3) student-level information about the points at which students exit, transfer in, transfer out, drop out, or complete P–16 education programs; (4) the capacity to communicate with higher education data systems; (5) a State data audit system assessing data quality, validity, and reliability; (6) yearly test records of individual students with respect to assessments under section 1111(b) of the Elementary and Secondary Education Act (ESEA) (20 U.S.C. 6311(b)); (7) information on students not tested by grade and subject; (8) a teacher identifier system with the ability to match teachers to students; (9) student-level transcript information, including information on courses completed and grades earned; (10) student-level college-readiness test scores; (11) information regarding the extent to which students transition successfully from secondary
school to postsecondary education, including whether students enroll in remedial coursework; and (12) other information determined necessary to address alignment and adequate preparation for success in postsecondary education.
American Recovery and Reinvestment Act of 2009 (ARRA): On February 17, 2009, President Obama signed into law the ARRA, historic legislation designed to stimulate the economy, support job creation, and invest in critical sectors, including education. The Department of Education received a $97.4 billion appropriation.
Annual Performance Report (APR): Report submitted by each grantee with outcomes to date, performance against the measures established in its application, and other relevant data. The Department uses data included in the APRs to provide Congress and the public with detailed information regarding each State’s progress on meeting the goals outlined in its application. The annual State APRs are found at www.rtt-apr.us.
College- and career-ready standards: State-developed standards that build toward college and career readiness by the time students graduate from high school.
Common Core State Standards (CCSS): Kindergarten through twelfth grade (K-12) English language arts and mathematics standards developed in collaboration with a variety of stakeholders including governors, chief State school officers, content experts, teachers, school administrators, and parents. (For additional information, please see http://www.corestandards.org/).
The education reform areas for Race to the Top: (1) Standards and Assessments: Adopting rigorous college- and career-ready standards and assessments that prepare students for success in college and career; (2) Data Systems to Support Instruction: Building data systems that measure student success and support educators and decision-makers in their efforts to improve instruction and increase student achievement; (3) Great Teachers and Great Leaders: Recruiting, developing, retaining, and rewarding effective teachers and principals; and (4) Turning Around the Lowest-Achieving Schools: Supporting local educational agencies’ (LEAs’) implementation of far-reaching reforms to turn around lowest-achieving schools by implementing school intervention models.
Effective teacher: A teacher whose students achieve acceptable rates (e.g., at least one grade level in an academic year) of student growth (as defined in the Race to the Top requirements). States, LEAs, or schools must include multiple measures, provided that teacher effectiveness is evaluated, in significant part, by student growth (as defined in the Race to the Top requirements). Supplemental measures may include, for example, multiple observation-based assessments of teacher performance.
High-minority school: A school designation defined by the State in a manner consistent with its Teacher Equity Plan. The State should provide, in its Race to the Top application, the definition used.

Maryland Year 3: School Year 2012 – 2013Race to the Top 22
Glossary
High-poverty school: Consistent with section 1111(h)(1)(C)(viii) of the ESEA, a school in the highest quartile of schools in the State with respect to poverty level, using a measure of poverty determined by the State.
Highly effective teacher: A teacher whose students achieve high rates (e.g., one and one-half grade levels in an academic year) of student growth (as defined in the Race to the Top requirements). States, LEAs, or schools must include multiple measures, provided that teacher effectiveness is evaluated, in significant part, by student growth (as defined in the Race to the Top requirements). Supplemental measures may include, for example, multiple observation-based assessments of teacher performance or evidence of leadership roles (which may include mentoring or leading professional learning communities) that increase the effectiveness of other teachers in the school or LEA.
Instructional improvement systems (IIS): Technology-based tools and other strategies that provide teachers, principals, and administrators with meaningful support and actionable data to systemically manage continuous instructional improvement, including such activities as instructional planning; gathering information (e.g., through formative assessments (as defined in the Race to the Top requirements), interim assessments (as defined in the Race to the Top requirements), summative assessments, and looking at student work and other student data); analyzing information with the support of rapid-time (as defined in the Race to the Top requirements) reporting; using this information to inform decisions on appropriate next instructional steps; and evaluating the effectiveness of the actions taken. Such systems promote collaborative problem-solving and action planning; they may also integrate instructional data with student-level data such as attendance, discipline, grades, credit accumulation, and student survey results to provide early warning indicators of a student’s risk of educational failure.
Invitational priorities: Areas of focus that the Department invited States to address in their Race to the Top applications. Applicants did not earn extra points for addressing these focus areas, but many grantees chose to create and fund activities to advance reforms in these areas.
Involved LEAs: LEAs that choose to work with the State to implement those specific portions of the State’s plan that necessitate full or nearly-full statewide implementation, such as transitioning to a common set of K-12 standards (as defined in the Race to the Top requirements). Involved LEAs do not receive a share of the 50 percent of a State’s grant award that it must subgrant to LEAs in accordance with section 14006(c) of the ARRA, but States may provide other funding to involved LEAs under the State’s Race to the Top grant in a manner that is consistent with the State’s application.
No-Cost Extension Amendment Request: A no-cost extension amendment request provides grantees with additional time to spend their grants (until September 2015) to accomplish the reform goals, deliverables and commitments in its Race to the Top application and approved Scope of Work. A grantee may make a no-cost extension amendment request to extend work beyond the final project year, consistent with the Amendment Principles (http://www2.ed.gov/programs/racetothetop/grant-amendment-submission-process-oct-4-2011.pdf) as well as the additional elements outlined in the Department Review section of the Amendment Requests with No Cost Extension Guidance and Principles document (http://www2.ed.gov/programs/racetothetop/no-cost-extenstion-submission-process.pdf).
Participating LEAs: LEAs that choose to work with the State to implement all or significant portions of the State’s Race to the Top plan, as specified in each LEA’s agreement with the State. Each participating LEA that receives funding under Title I, Part A will receive a share of the 50 percent of a State’s grant award that the State must subgrant to LEAs, based on the LEA’s relative share of Title I, Part A allocations in the most recent year at the time of the award, in accordance with section 14006(c) of the ARRA. Any participating LEA that does not receive funding under Title I, Part A (as well as one that does) may receive funding from the State’s other 50 percent of the grant award, in accordance with the State’s plan.
The Partnership for Assessment of Readiness for College and Careers (PARCC): One of two consortia of States awarded grants under the Race to the Top Assessment program to develop next-generation assessment systems that are aligned to common K-12 English language and mathematics standards and that will accurately measure student progress toward college and career readiness. (For additional information please see http://www.parcconline.org/.)
Persistently lowest-achieving schools: As determined by the State, (1) any Title I school in improvement, corrective action, or restructuring that (a) is among the lowest-achieving five percent of Title I schools in improvement, corrective action, or restructuring or the lowest-achieving five Title I schools in improvement, corrective action, or restructuring in the State, whichever number of schools is greater; or (b) is a high school that has had a graduation rate as defined in 34 CFR 200.19(b) that is less than 60 percent over a number of years; and (2) any secondary school that is eligible for, but does not receive, Title I funds that (a) is among the lowest-achieving five percent of secondary schools or the lowest-achieving five secondary schools in the State that are eligible for, but do not receive, Title I funds, whichever number of schools is greater; or (b) is a high school that has had a graduation rate as defined in 34 CFR 200.19(b) that is less than 60 percent over a number of years. To identify the lowest-achieving schools, a State must take into account both (1) the academic achievement of the “all students” group in a school in terms of proficiency on the State’s assessments under section 1111(b)(3) of the ESEA in reading/language arts and mathematics combined; and (2) the school’s lack of progress on those assessments over a number of years in the “all students” group. (For additional information please see http://www2.ed.gov/programs/sif/index.html.)

Maryland Year 3: School Year 2012 – 2013Race to the Top 23
Glossary
Qualifying evaluation systems: Educator evaluation systems that meet the following criteria: rigorous, transparent, and fair evaluation systems for teachers and principals that: (1) differentiate effectiveness using multiple rating categories that take into account data on student growth as a significant factor, and (2) are designed and developed with teacher and principal involvement.
Reform Support Network (RSN): In partnership with the Implementation and Support Unit (ISU), the RSN offers collective and individualized technical assistance and resources to grantees of the Race to the Top education reform initiative. The RSN’s purpose is to support the Race to the Top grantees as they implement reforms in education policy and practice, learn from each other and build their capacity to sustain these reforms.
The School Improvement Grants (SIG) program is authorized under section 1003(g) of Title I of the ESEA. Funds are awarded to States to help them turn around persistently lowest-achieving schools. (For additional information please see http://www2.ed.gov/programs/sif/index.html.)School intervention models: A State’s Race to the Top plan describes how it will support its LEAs in turning around the lowest-achieving schools by implementing one of the four school intervention models:
• Turnaround model: Replace the principal and rehire no more than 50 percent of the staff and grant the principal sufficient operational flexibility (including in staffing, calendars/time and budgeting) to fully implement a comprehensive approach to substantially improve student outcomes.
• Restart model: Convert a school or close and reopen it under a charter school operator, a charter management organization, or an education management organization that has been selected through a rigorous review process.
• School closure: Close a school and enroll the students who attended that school in other schools in the district that are higher achieving.
• Transformation model: Implement each of the following strategies: (1) replace the principal and take steps to increase teacher and school leader effectiveness, (2) institute comprehensive instructional reforms, (3) increase learning time and create community-oriented schools, and (4) provide operational flexibility and sustained support.
Single sign-on: A user authentication process that permits a user to enter one name and password in order to access multiple applications.
The SMARTER Balanced Assessment Consortium (Smarter Balanced): One of two consortia of States awarded grants under the Race to the Top Assessment program to develop next-generation assessment systems that are aligned to common K-12 English language and mathematic standards and that will accurately measure student progress toward college and career readiness. (For additional information please see http://www.k12.wa.us/SMARTER/default.aspx.)
The State Scope of Work: A detailed document for the State’s projects that reflects the grantee’s approved Race to the Top application. The State Scope of Work includes items such as the State’s specific goals, activities, timelines, budgets, key personnel, and annual targets for key performance measures. (For additional information please see http://www2.ed.gov/programs/racetothetop/state-scope-of-work/index.html.) Additionally, all participating LEAs are required to submit Scope of Work documents, consistent with State requirements, to the State for its review and approval.
Statewide longitudinal data systems (SLDS): Data systems that enhance the ability of States to efficiently and accurately manage, analyze, and use education data, including individual student records. The SLDS help States, districts, schools, educators, and other stakeholders to make data-informed decisions to improve student learning and outcomes, as well as to facilitate research to increase student achievement and close achievement gaps. (For additional information please see http://nces.ed.gov/Programs/SLDS/about_SLDS.asp.)
Student achievement: For the purposes of this report, student achievement (1) for tested grades and subjects is (a) a student’s score on the State’s assessments under the ESEA; and, as appropriate, (b) other measures of student learning, such as those described in number (2) of this definition, provided they are rigorous and comparable across classrooms; and (2) for non-tested grades and subjects, alternative measures of student learning and performance such as student scores on pre-tests and end-of-course tests; student performance on English language proficiency assessments; and other measures of student achievement that are rigorous and comparable across classrooms.
Student growth: The change in student achievement (as defined in the Race to the Top requirements) for an individual student between two or more points in time. A State may also include other measures that are rigorous and comparable across classrooms.
Value-added models (VAMs): A specific type of growth model based on changes in test scores over time. VAMs are complex statistical models that generally attempt to take into account student or school background characteristics in order to isolate the amount of learning attributable to a specific teacher or school. Teachers or schools that produce more than typical or expected growth are said to “add value.”