mars phoenix edl trajectory and atmosphere reconstruction
TRANSCRIPT
NASA/TM–2019–220282
Mars Phoenix EDL Trajectory andAtmosphere Reconstruction UsingNewSTEP
Christopher D. Karlgaard and Jake A. TynisAnalytical Mechanics Associates, Inc., Hampton, Virginia
May 2019
NASA STI Program. . . in Profile
Since its founding, NASA has been dedicatedto the advancement of aeronautics and spacescience. The NASA scientific and technicalinformation (STI) program plays a key partin helping NASA maintain this importantrole.
The NASA STI Program operates under theauspices of the Agency Chief InformationOfficer. It collects, organizes, provides forarchiving, and disseminates NASA’s STI.The NASA STI Program provides access tothe NASA Aeronautics and Space Databaseand its public interface, the NASA TechnicalReport Server, thus providing one of thelargest collection of aeronautical and spacescience STI in the world. Results arepublished in both non-NASA channels andby NASA in the NASA STI Report Series,which includes the following report types:
• TECHNICAL PUBLICATION. Reports ofcompleted research or a major significantphase of research that present the resultsof NASA programs and include extensivedata or theoretical analysis. Includescompilations of significant scientific andtechnical data and information deemed tobe of continuing reference value. NASAcounterpart of peer-reviewed formalprofessional papers, but having lessstringent limitations on manuscript lengthand extent of graphic presentations.
• TECHNICAL MEMORANDUM.Scientific and technical findings that arepreliminary or of specialized interest, e.g.,quick release reports, working papers, andbibliographies that contain minimalannotation. Does not contain extensiveanalysis.
• CONTRACTOR REPORT. Scientific andtechnical findings by NASA-sponsoredcontractors and grantees.
• CONFERENCE PUBLICATION.Collected papers from scientific andtechnical conferences, symposia, seminars,or other meetings sponsored orco-sponsored by NASA.
• SPECIAL PUBLICATION. Scientific,technical, or historical information fromNASA programs, projects, and missions,often concerned with subjects havingsubstantial public interest.
• TECHNICAL TRANSLATION. English-language translations of foreign scientificand technical material pertinent toNASA’s mission.
Specialized services also include organizingand publishing research results, distributingspecialized research announcements andfeeds, providing information desk andpersonal search support, and enabling dataexchange services.
For more information about the NASA STIProgram, see the following:
• Access the NASA STI program home pageat http://www.sti.nasa.gov
• E-mail your question [email protected]
• Phone the NASA STI Information Desk at757-864-9658
• Write to:NASA STI Information DeskMail Stop 148NASA Langley Research CenterHampton, VA 23681-2199

NASA/TM–2019–220282
Mars Phoenix EDL Trajectory andAtmosphere Reconstruction UsingNewSTEP
Christopher D. Karlgaard and Jake A. TynisAnalytical Mechanics Associates, Inc., Hampton, Virginia
National Aeronautics andSpace Administration
Langley Research CenterHampton, Virginia 23681-2199
May 2019

Acknowledgments
The content of this work benefited from discussions with Soumyo Dutta, Ashley Korzun, RafaelLugo, Mark Schoenenberger, and Carlie Zumwalt.
The use of trademarks or names of manufacturers in this report is for accurate reporting and does notconstitute an offical endorsement, either expressed or implied, of such products or manufacturers by theNational Aeronautics and Space Administration.
Available from:
NASA STI Program / Mail Stop 148NASA Langley Research Center
Hampton, VA 23681-2199Fax: 757-864-6500

Abstract
This document describes the trajectory and atmosphere reconstruction of the MarsPhoenix Entry, Descent, and Landing using the New Statistical Trajectory Estima-tion Program. The approach utilizes a Kalman filter to blend inertial measurementunit data with initial conditions and radar altimetry to obtain the inertial trajectoryof the entry vehicle. The nominal aerodynamic database is then used in combina-tion with the sensed accelerations to obtain estimates of the atmosphere-relativestate. The reconstructed atmosphere profile is then blended with pre-flight modelsto construct an estimate of the as-flown atmosphere.
1 Introduction
On May 28th, 2008 the Mars Phoenix lander successfully conducted its Entry, De-scent, and Landing (EDL) sequence to land on the surface of Mars. Data from theon-board Inertial Measurement Unit (IMU) (accelerations and angular rates) andOrbit Determination (OD) initial conditions were utilized to reconstruct the as-flown trajectory of the entry vehicle from entry interface to touchdown using a deadreckoning integration technique. The nominal vehicle aerodynamic database wasused to estimate the as-flown atmospheric density profile by solving for the densityusing the measured axial acceleration and the nominal axial force coefficient.
The methodology and results of the trajectory and atmospheric reconstructionare documented in [1] and [2]. Unfortunately, the reconstructed data has subse-quently been lost. However, the raw telemetry data from the mission still exists andso can be used to reconstruct the trajectory and atmosphere for archival purposes.The reconstruction makes use of the New Statistical Trajectory Estimation Program(NewSTEP). NewSTEP is an Iterative Extended Kalman Filter (IEKF) [3] code forprocessing various types of on-board and ground-based (where applicable) measure-ments to produce a trajectory estimate that is a best fit to all of the data sourcesbased on their given uncertainties.
This memorandum serves to document this reconstruction and the results. Theremainder of the document is organized as follows. The next section provides abrief overview of the Phoenix entry vehicle and the nominal EDL timeline, andthen gives an overview of the various measurement data sources that are used forthe trajectory reconstruction. The following section provides an overview of thetrajectory and atmosphere reconstruction methodology, before presenting the resultsof the reconstruction.
2 Vehicle Description
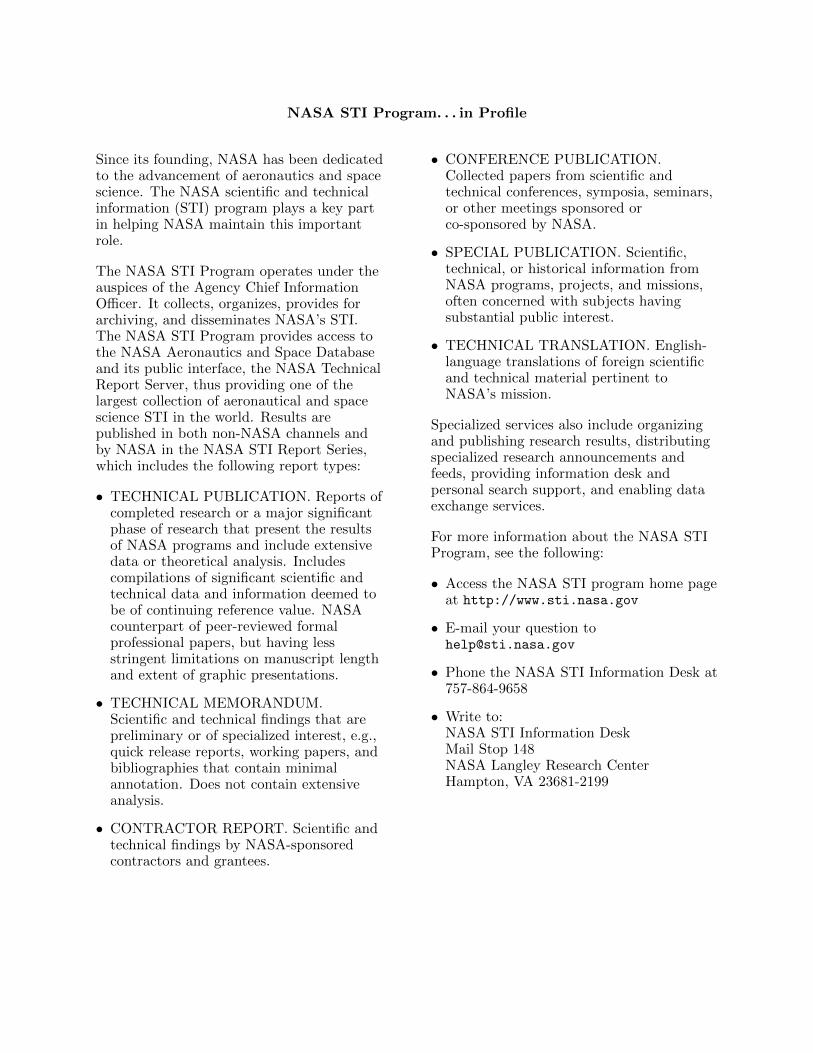
The Phoenix entry vehicle is a 70 deg sphere cone shape with a diameter of 2.65 mand mass at entry of 572.743 kg. The EDL concept of operations is shown inFigure 1. During the hypersonic phase the entry vehicle is unguided and is notspin stabilized. After peak heating and peak deceleration the vehicle slows to aMach number of approximately 1.65 where the supersonic disk-gap-band parachute
1
is deployed. Shortly thereafter the heatshield is jettisoned, lander legs are deployed,the radar altimeter is activated, and the lander separates from the backshell andbegins powered flight. During the terminal descent phase the lander flies on agravity turn trajectory until reaching a condition close to the landing site, where itdescends at a constant velocity until touchdown after which the motor is poweredoff. Additional details on the vehicle design and EDL system overview can be foundin [4].
Figure 1: Phoenix Entry, Descent, and Landing
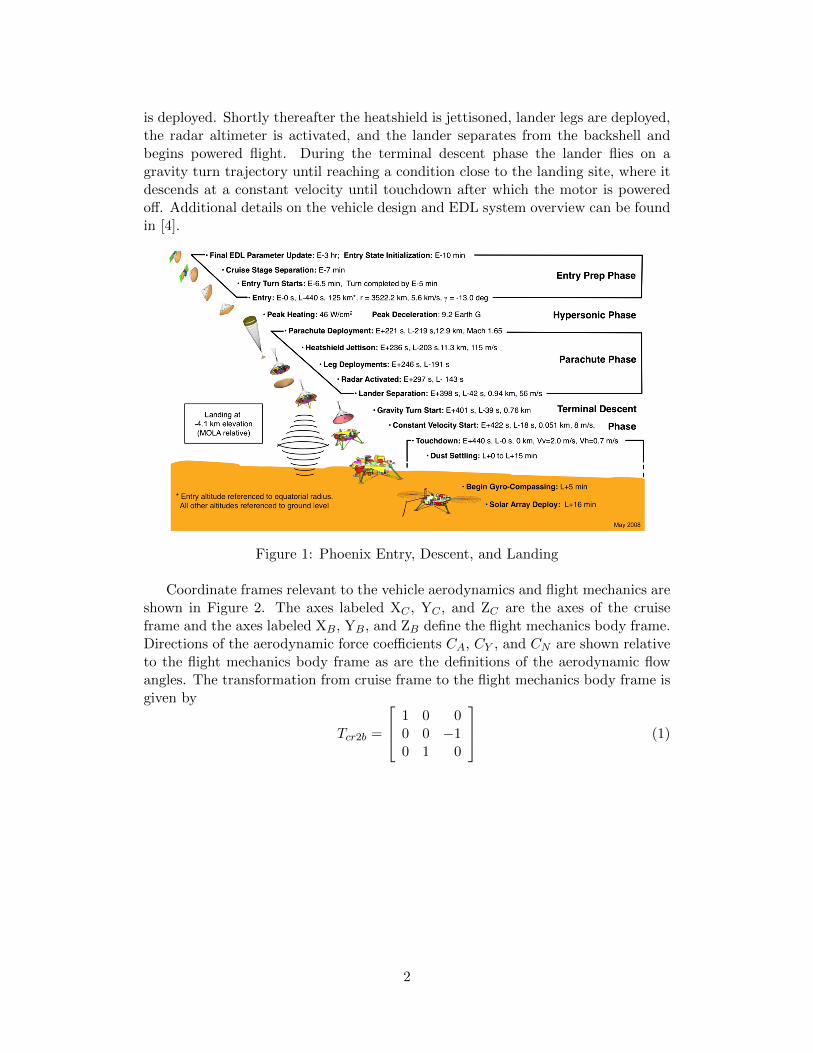
Coordinate frames relevant to the vehicle aerodynamics and flight mechanics areshown in Figure 2. The axes labeled XC , YC , and ZC are the axes of the cruiseframe and the axes labeled XB, YB, and ZB define the flight mechanics body frame.Directions of the aerodynamic force coefficients CA, CY , and CN are shown relativeto the flight mechanics body frame as are the definitions of the aerodynamic flowangles. The transformation from cruise frame to the flight mechanics body frame isgiven by
Tcr2b =
1 0 00 0 −10 1 0
(1)
2
Figure 2: Phoenix Coordinate Frames
3 Data Sources
Several sources of measurement data are available to be used for trajectory re-construction purposes. These include the IMU, radar altimeter, OD initial condi-tions, and the landing site position fix. Many of these data can be found in the“phx tlm v9.mat” MATLAB data file. The following subsections describe thesedata sources.
3.1 Inertial Measurement Unit
The primary measurement source for performing the trajectory and atmospherereconstruction is the on-board IMU, which provides three axis linear accelerationand angular rate measurements in the IMU instrument frame. These measurementsare provided at the rate of 200 Hz.
According to [1], the transformation from the IMU instrument frame to thecruise reference frame is given by the matrix
Timu2cr =
0.001658000000000 0.434532000000000 0.9006550000000000.865583671733631 −0.451637796435926 0.2163048457763950.500761102355330 0.779233610045474 −0.37687298280806
(2)
The location of the IMU in the cruise reference frame is given by the vector
rimu =[
1.284866 −0.5195119 −0.228428]T
m [1].
The measured accelerations were transformed from the IMU frame into the vehi-
3
(a) Axial Acceleration (b) Roll Rate
(c) Side Acceleration (d) Pitch Rate
(e) Normal Acceleration (f) Yaw Rate
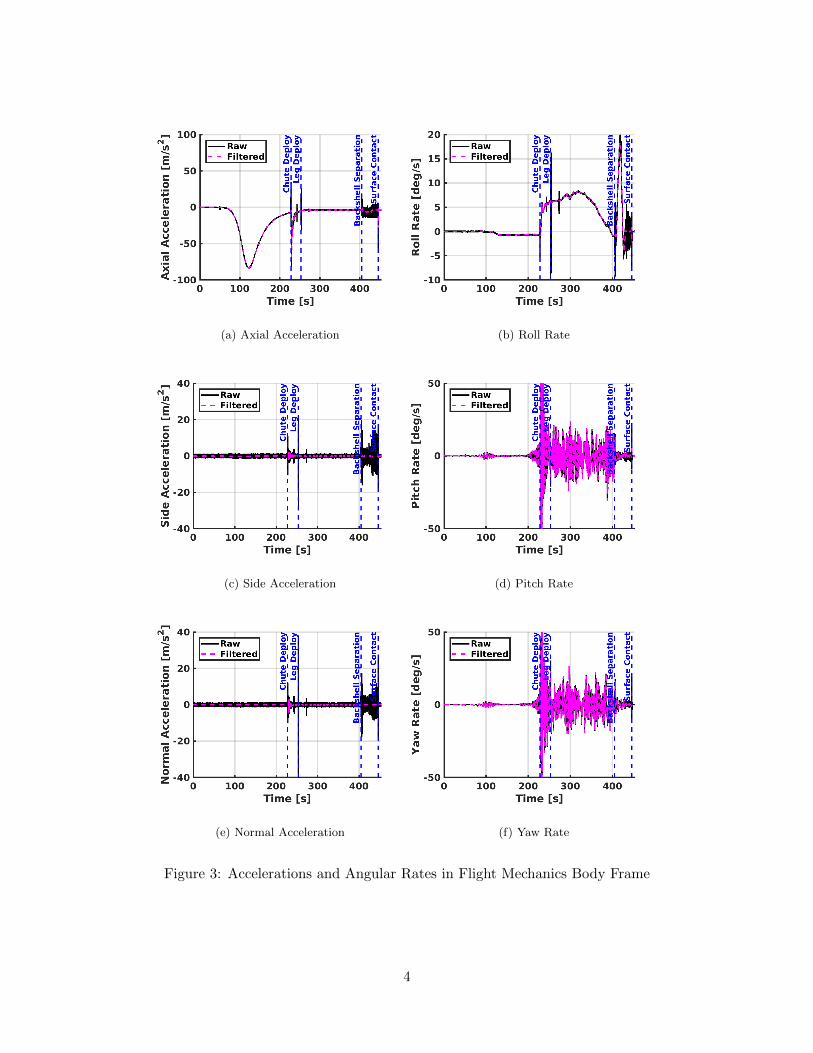
Figure 3: Accelerations and Angular Rates in Flight Mechanics Body Frame
4
(a) Acceleration (b) Angular Rate
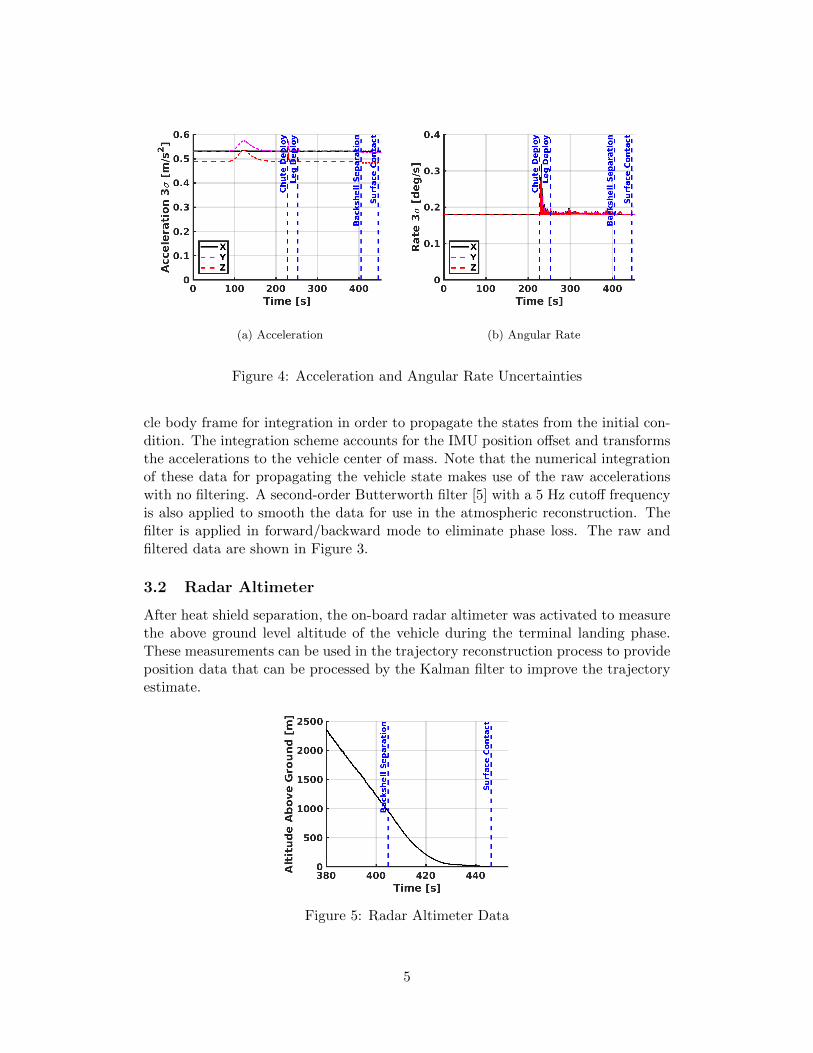
Figure 4: Acceleration and Angular Rate Uncertainties
cle body frame for integration in order to propagate the states from the initial con-dition. The integration scheme accounts for the IMU position offset and transformsthe accelerations to the vehicle center of mass. Note that the numerical integrationof these data for propagating the vehicle state makes use of the raw accelerationswith no filtering. A second-order Butterworth filter [5] with a 5 Hz cutoff frequencyis also applied to smooth the data for use in the atmospheric reconstruction. Thefilter is applied in forward/backward mode to eliminate phase loss. The raw andfiltered data are shown in Figure 3.
3.2 Radar Altimeter
After heat shield separation, the on-board radar altimeter was activated to measurethe above ground level altitude of the vehicle during the terminal landing phase.These measurements can be used in the trajectory reconstruction process to provideposition data that can be processed by the Kalman filter to improve the trajectoryestimate.
Figure 5: Radar Altimeter Data
5
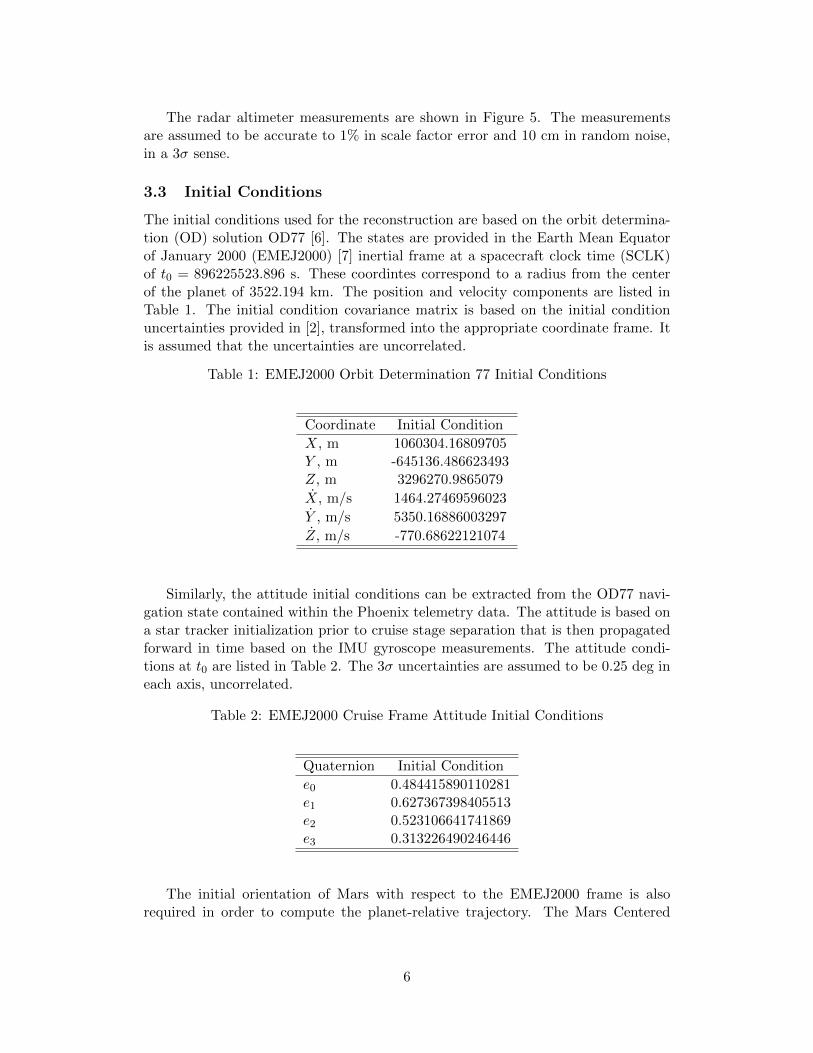
The radar altimeter measurements are shown in Figure 5. The measurementsare assumed to be accurate to 1% in scale factor error and 10 cm in random noise,in a 3σ sense.
3.3 Initial Conditions
The initial conditions used for the reconstruction are based on the orbit determina-tion (OD) solution OD77 [6]. The states are provided in the Earth Mean Equatorof January 2000 (EMEJ2000) [7] inertial frame at a spacecraft clock time (SCLK)of t0 = 896225523.896 s. These coordintes correspond to a radius from the centerof the planet of 3522.194 km. The position and velocity components are listed inTable 1. The initial condition covariance matrix is based on the initial conditionuncertainties provided in [2], transformed into the appropriate coordinate frame. Itis assumed that the uncertainties are uncorrelated.
Table 1: EMEJ2000 Orbit Determination 77 Initial Conditions
Coordinate Initial Condition
X, m 1060304.16809705Y , m -645136.486623493Z, m 3296270.9865079
X, m/s 1464.27469596023
Y , m/s 5350.16886003297
Z, m/s -770.68622121074
Similarly, the attitude initial conditions can be extracted from the OD77 navi-gation state contained within the Phoenix telemetry data. The attitude is based ona star tracker initialization prior to cruise stage separation that is then propagatedforward in time based on the IMU gyroscope measurements. The attitude condi-tions at t0 are listed in Table 2. The 3σ uncertainties are assumed to be 0.25 deg ineach axis, uncorrelated.
Table 2: EMEJ2000 Cruise Frame Attitude Initial Conditions
Quaternion Initial Condition
e0 0.484415890110281e1 0.627367398405513e2 0.523106641741869e3 0.313226490246446
The initial orientation of Mars with respect to the EMEJ2000 frame is alsorequired in order to compute the planet-relative trajectory. The Mars Centered
6
Mars Fixed (MCMF) frame is defined relative to the EMEJ2000 frame at t0 by thequaternion listed in Table 3.
Table 3: EMEJ2000 MCMF Frame Initial Conditions
Quaternion Initial Condition
e0 0.414943021388918e1 2.39260776718649e-05e2 5.51686127775915e-05e3 -0.909847396756512
Note that these initial conditions differ slightly from those assumed in [1], thoughthere is a time offset of approximately 68 ms (OD77 initial conditions occurredshortly after the conditions from [1]). The specific numbers assumed in [1] are notfound in the provided Phoenix telemetry data structures that are used in the presentanalysis.
3.4 Landing Site Location
The Phoenix landing site location was extracted from the flight data file and isrepeated in Table 4. This location is used for trajectory reconstruction purposes toprovide an end point to the trajectory as another form of a position fix. The landingsite location and associated uncertainties were determined from Doppler tracking [8].This landing site corresponds to a Mars Orbiter Laser Altimeter (MOLA) elevationof -4131 m [8].
Table 4: Phoenix Landing Site Coordinates
Coordinate Value 3σ
Radius 3376291.5 m 4.2 mLongitude 234.24843 deg 0.000288 degDeclination 68.21878 deg 0.00018 deg
Note that these coordinates are within 0.5 m of those specified in [1]. Thedifference is primarily in the longitude component with [1] providing a value 2.03 ·10−5 deg larger.
3.5 Mass Properties Model
The mass properties models are based directly on those provided in [1] along witha timing adjustment to account for the 68 ms offset between the t0 time definitions.The mass properties are referenced to SCLK time, but the time from t0 is providedfor convenience. The center of mass coordinates are specified in the cruise referenceframe. The aerodynamic reference length, b is also provided in this table.
7
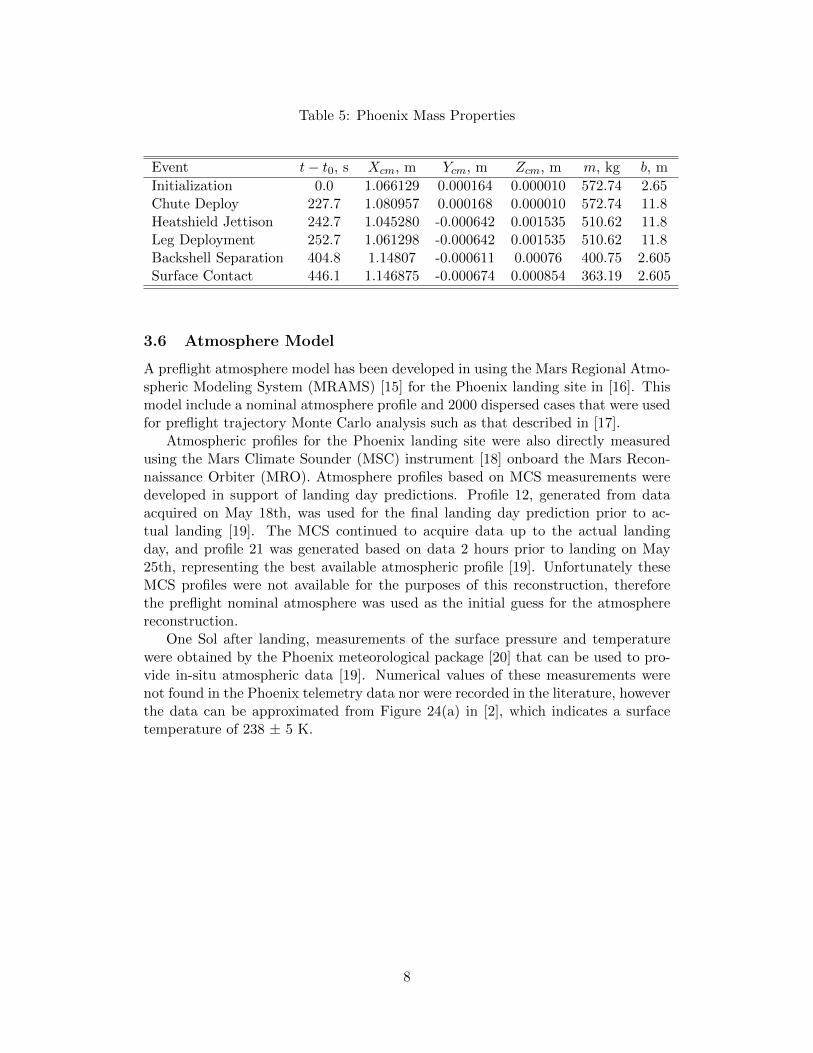
Table 5: Phoenix Mass Properties
Event t− t0, s Xcm, m Ycm, m Zcm, m m, kg b, m
Initialization 0.0 1.066129 0.000164 0.000010 572.74 2.65Chute Deploy 227.7 1.080957 0.000168 0.000010 572.74 11.8Heatshield Jettison 242.7 1.045280 -0.000642 0.001535 510.62 11.8Leg Deployment 252.7 1.061298 -0.000642 0.001535 510.62 11.8Backshell Separation 404.8 1.14807 -0.000611 0.00076 400.75 2.605Surface Contact 446.1 1.146875 -0.000674 0.000854 363.19 2.605
3.6 Atmosphere Model
A preflight atmosphere model has been developed in using the Mars Regional Atmo-spheric Modeling System (MRAMS) [15] for the Phoenix landing site in [16]. Thismodel include a nominal atmosphere profile and 2000 dispersed cases that were usedfor preflight trajectory Monte Carlo analysis such as that described in [17].
Atmospheric profiles for the Phoenix landing site were also directly measuredusing the Mars Climate Sounder (MSC) instrument [18] onboard the Mars Recon-naissance Orbiter (MRO). Atmosphere profiles based on MCS measurements weredeveloped in support of landing day predictions. Profile 12, generated from dataacquired on May 18th, was used for the final landing day prediction prior to ac-tual landing [19]. The MCS continued to acquire data up to the actual landingday, and profile 21 was generated based on data 2 hours prior to landing on May25th, representing the best available atmospheric profile [19]. Unfortunately theseMCS profiles were not available for the purposes of this reconstruction, thereforethe preflight nominal atmosphere was used as the initial guess for the atmospherereconstruction.
One Sol after landing, measurements of the surface pressure and temperaturewere obtained by the Phoenix meteorological package [20] that can be used to pro-vide in-situ atmospheric data [19]. Numerical values of these measurements werenot found in the Phoenix telemetry data nor were recorded in the literature, howeverthe data can be approximated from Figure 24(a) in [2], which indicates a surfacetemperature of 238 ± 5 K.
8

(a) Nominal Density (b) Nominal Pressure
(c) Nominal Temperature (d) Dispersed Density
Figure 6: Atmosphere Model
(a) North Wind (b) East Wind
Figure 7: Winds Model
9
3.7 Aerodynamics Model
The aerodynamics model for the Phoenix entry vehicle was developed using a com-bination of historical data, previous flight tests of similar systems, wind tunneltesting, and computational methods. The Phoenix entry vehicle was geometricallysimilar to the Mars Exploration Rover, Pathfinder, and Viking geometries and lever-aged this data as appropriate. This approach allowed an aerodynamic database tobe generated that encompassed all of the flight regimes, including free molecular,transitional, hypersonic, supersonic, and transonic flows. The resultant databaseincluded static and dynamic coefficients along with associated uncertainties. Thefinal aerodynamic database product is a model that can be queried with flight con-ditions and return the relevant aerodynamic coefficients for trajectory simulations.A detailed description and analysis of the Phoenix aerodynamic database can befound in [21].
3.8 Gravity Model
The Mars gravitational acceleration is modeled using the MRO110C model [22].This model is based on tracking data of Mars Global Surveyor (MGS), Mars Odysseyand Mars Reconnaissance Orbiter (MRO), and MOLA-derived topography data.The model contains spherical harmonics up to degree and order 110.
4 Reconstruction Methods
The reconstruction process utilized for the Phoenix EDL data consists of three steps.In the first step, the NewSTEP code is used to generate a kinematic reconstructionof the inertial flight path of the vehicle based on Kalman filtering of the orbit deter-mination initial conditions, IMU, Radar, and landing site coordinates. The nominalatmosphere profile is superimposed on this trajectory to produce a reasonable setof atmospheric-relative states. As part of this process, the measured IMU acceler-ations are transformed to the vehicle center of mass and rotated into the vehicleflight mechanics body coordinate frame.
In the next step, the nominal aerodynamic database and sensed accelerationsare used to reconstruct the atmospheric-relative trajectory. Dynamic pressure iscomputed from the axial acceleration, mass, and reference area. The flow angles aresimultaneously computed from the ratio of lateral to axial acceleration. The densityis computed from the dynamic pressure and the reconstructed velocity (assumingthe nominal winds), and then static pressure is computed from an integration of thehydrostatic equation. An estimate of the Mach number can be computed from thestatic and dynamic pressure. Uncertainties are also mapped through the process.The overall process is described in [14].
Note that the density reconstructed from the vehicle aerodynamics is only validduring the entry phase up until the point of parachute mortar fire. After parachutedeployment, the vehicle aerodynamics are poorly known and so the atmospherereconstruction must rely on another source. For this work, a pre-flight densityprofile was found that was a best fit to the reconstructed density in the altitude
10
range where the vehicle aerodynamics are well known. The density profile from thepre-flight model was anchored to the reconstructed density to provide an estimateof the density at altitudes below parachute deployment. The static pressure wascomputed from a top-down integration of the hydrostatic equation, and temperaturewas computed from the ideal gas law.
In the final step, another NewSTEP run was processed but instead of the pre-flight nominal atmosphere, the reconstructed atmosphere was superimposed on thetrajectory in order to provide best estimates of the atmospheric-relative state fromentry interface to touchdown.
5 Reconstruction Results
The results of the reconstruction process described in the previous section are shownin the following subsections, describing the inertial trajectory, atmospheric-relativetrajectory, and the atmosphere reconstruction.
5.1 Inertial Trajectory
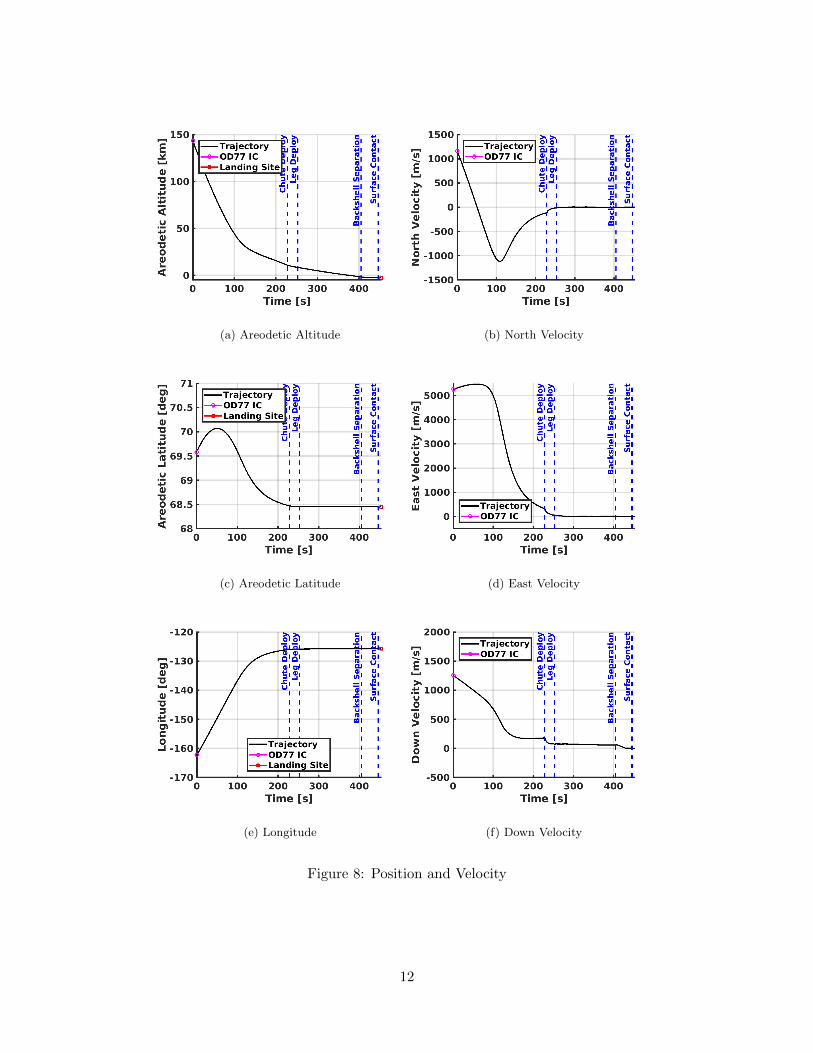
Components of the vehicle trajectory relative to the Mars surface are shown inFigure 8 along with the OD77 initial conditions and the landing site location. Eventsalong the trajectory are also indicated. Position and velocity uncertainties are shownin Figure 9. The planet-relative velocity magnitude and flight path angle are shownin Figure 10. The reconstructed initial relative flight path angle at t0 is -13.162 deg.The reconstructed velocity magnitude at touchdown is 2.5 m/s.
The vehicle body Euler angles relative to the North-East-Down frame along withthe total attitude uncertainty are shown in Figure 11. It is apparent here that thevehicle developed a roll rate during the atmospheric entry. Potential causes for thisroll rate are explored in [19]. The total attitude uncertainty is shown in 11(d).
11
(a) Areodetic Altitude (b) North Velocity
(c) Areodetic Latitude (d) East Velocity
(e) Longitude (f) Down Velocity
Figure 8: Position and Velocity
12
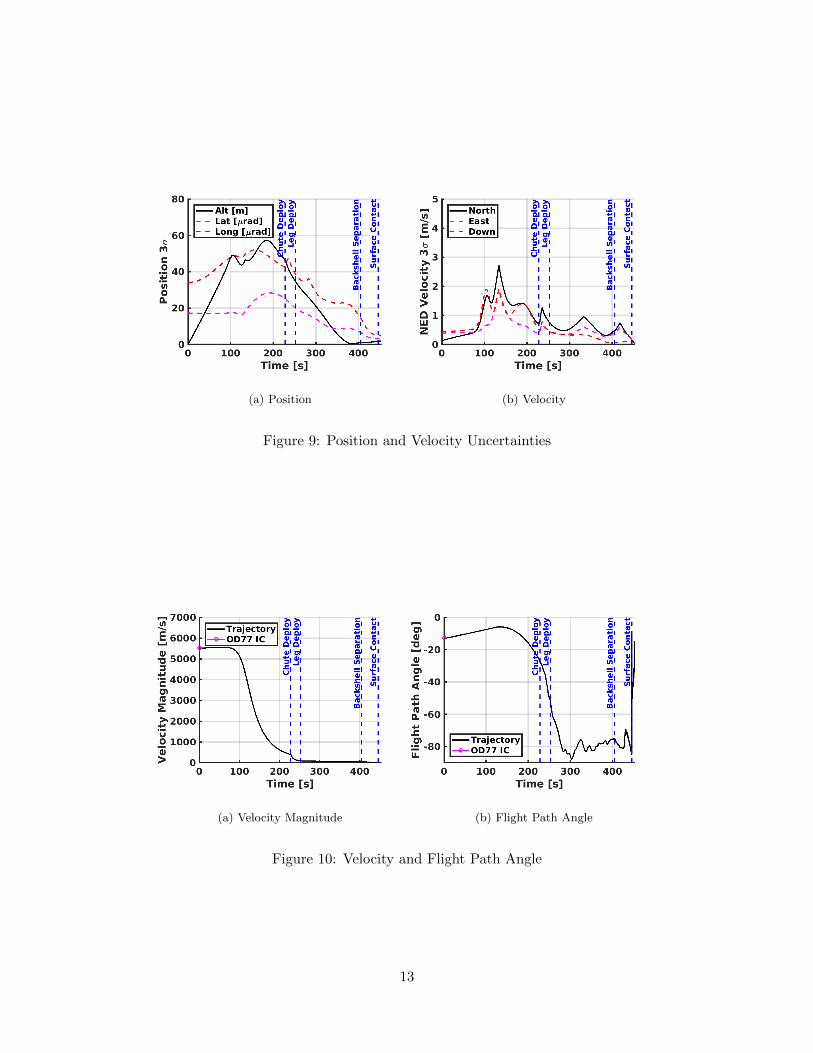
(a) Position (b) Velocity
Figure 9: Position and Velocity Uncertainties
(a) Velocity Magnitude (b) Flight Path Angle
Figure 10: Velocity and Flight Path Angle
13
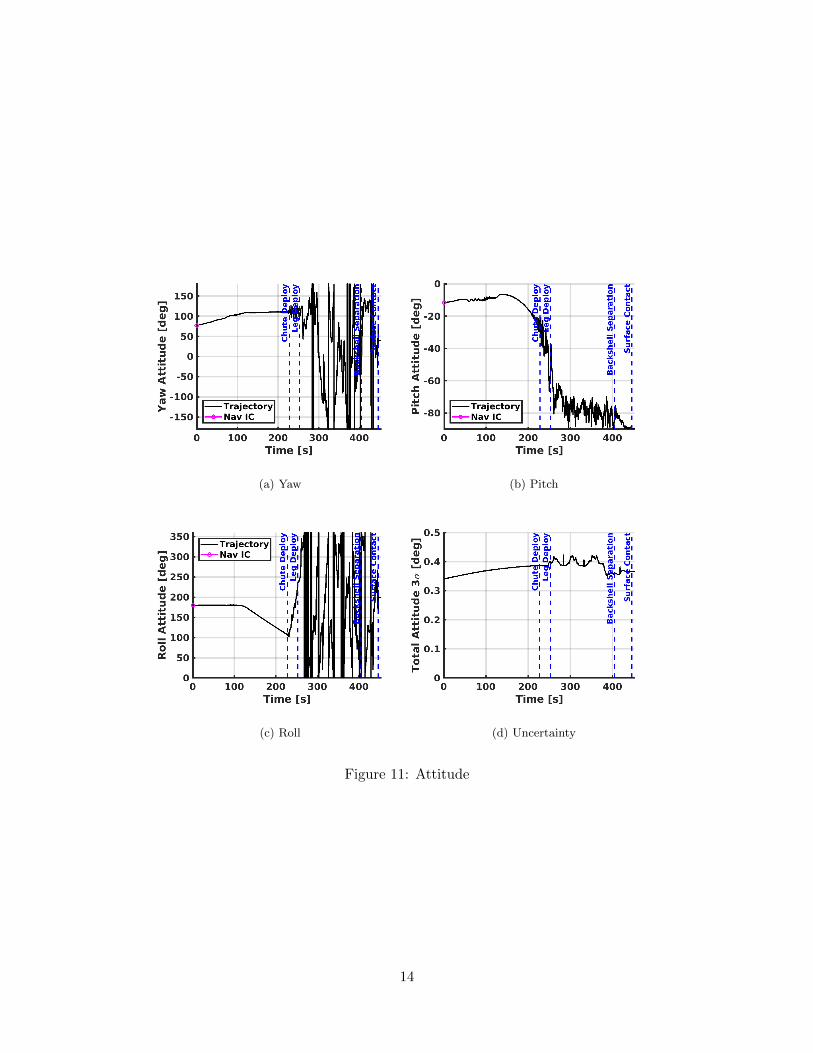
(a) Yaw (b) Pitch
(c) Roll (d) Uncertainty
Figure 11: Attitude
14
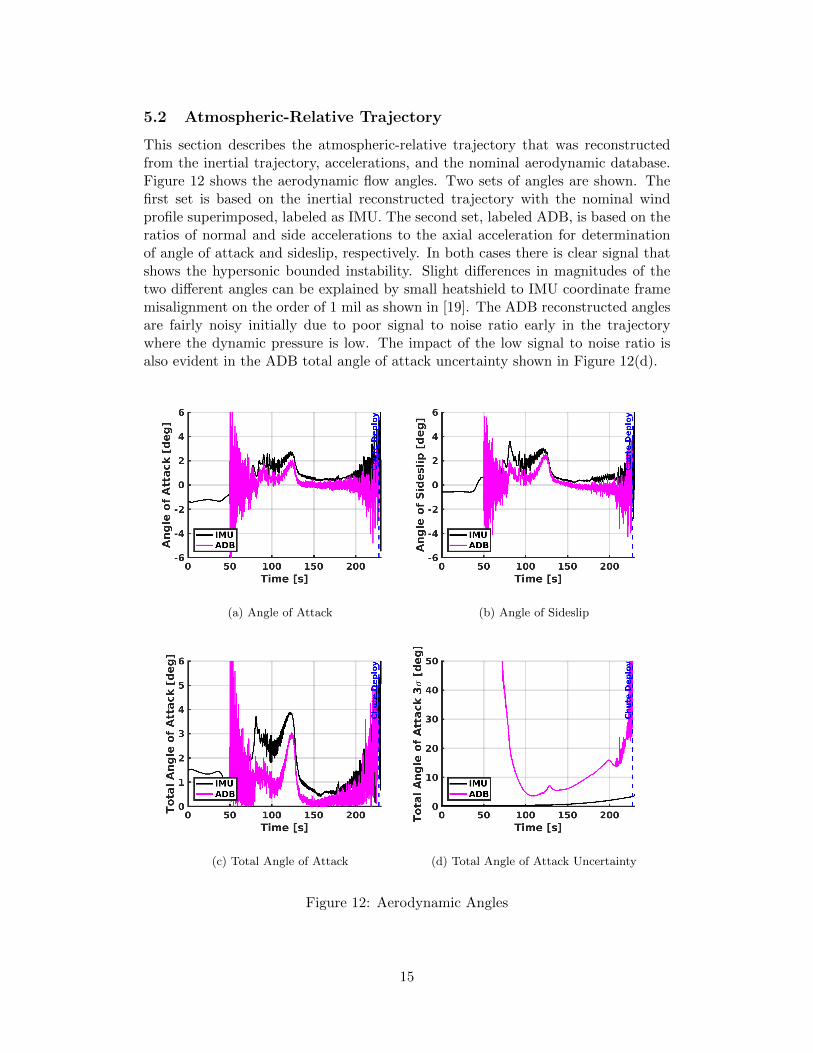
5.2 Atmospheric-Relative Trajectory
This section describes the atmospheric-relative trajectory that was reconstructedfrom the inertial trajectory, accelerations, and the nominal aerodynamic database.Figure 12 shows the aerodynamic flow angles. Two sets of angles are shown. Thefirst set is based on the inertial reconstructed trajectory with the nominal windprofile superimposed, labeled as IMU. The second set, labeled ADB, is based on theratios of normal and side accelerations to the axial acceleration for determinationof angle of attack and sideslip, respectively. In both cases there is clear signal thatshows the hypersonic bounded instability. Slight differences in magnitudes of thetwo different angles can be explained by small heatshield to IMU coordinate framemisalignment on the order of 1 mil as shown in [19]. The ADB reconstructed anglesare fairly noisy initially due to poor signal to noise ratio early in the trajectorywhere the dynamic pressure is low. The impact of the low signal to noise ratio isalso evident in the ADB total angle of attack uncertainty shown in Figure 12(d).
(a) Angle of Attack (b) Angle of Sideslip
(c) Total Angle of Attack (d) Total Angle of Attack Uncertainty
Figure 12: Aerodynamic Angles
15
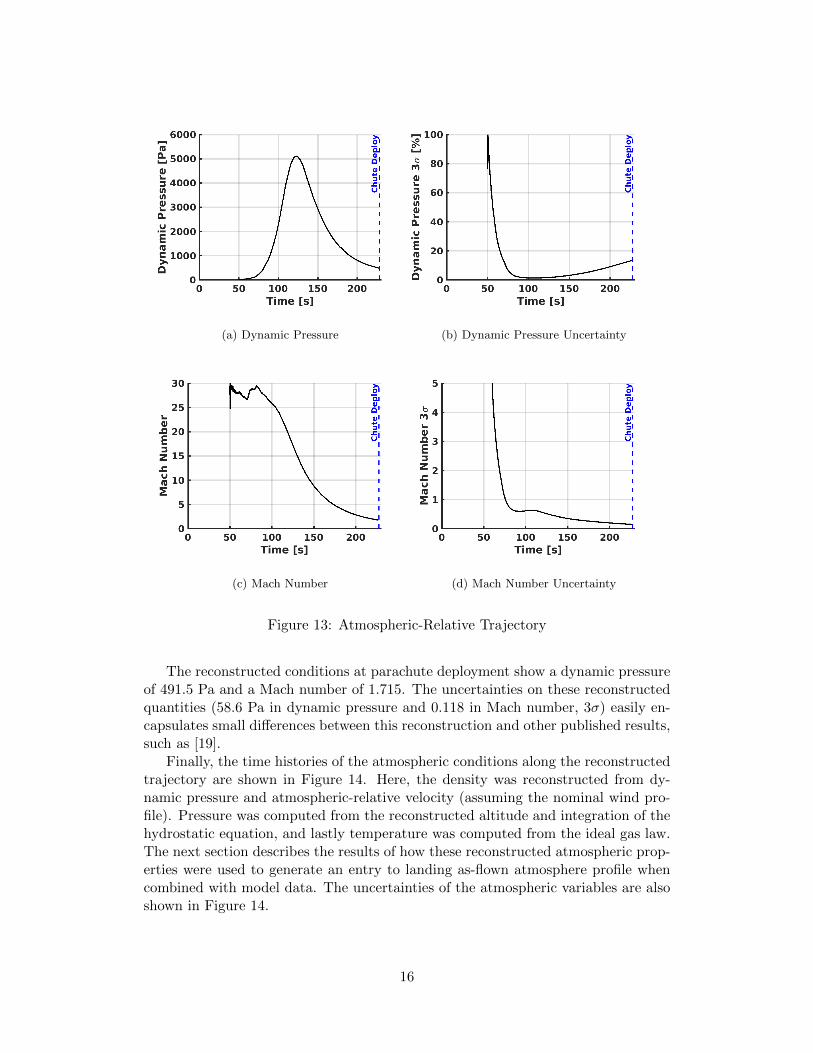
(a) Dynamic Pressure (b) Dynamic Pressure Uncertainty
(c) Mach Number (d) Mach Number Uncertainty
Figure 13: Atmospheric-Relative Trajectory
The reconstructed conditions at parachute deployment show a dynamic pressureof 491.5 Pa and a Mach number of 1.715. The uncertainties on these reconstructedquantities (58.6 Pa in dynamic pressure and 0.118 in Mach number, 3σ) easily en-capsulates small differences between this reconstruction and other published results,such as [19].
Finally, the time histories of the atmospheric conditions along the reconstructedtrajectory are shown in Figure 14. Here, the density was reconstructed from dy-namic pressure and atmospheric-relative velocity (assuming the nominal wind pro-file). Pressure was computed from the reconstructed altitude and integration of thehydrostatic equation, and lastly temperature was computed from the ideal gas law.The next section describes the results of how these reconstructed atmospheric prop-erties were used to generate an entry to landing as-flown atmosphere profile whencombined with model data. The uncertainties of the atmospheric variables are alsoshown in Figure 14.
16
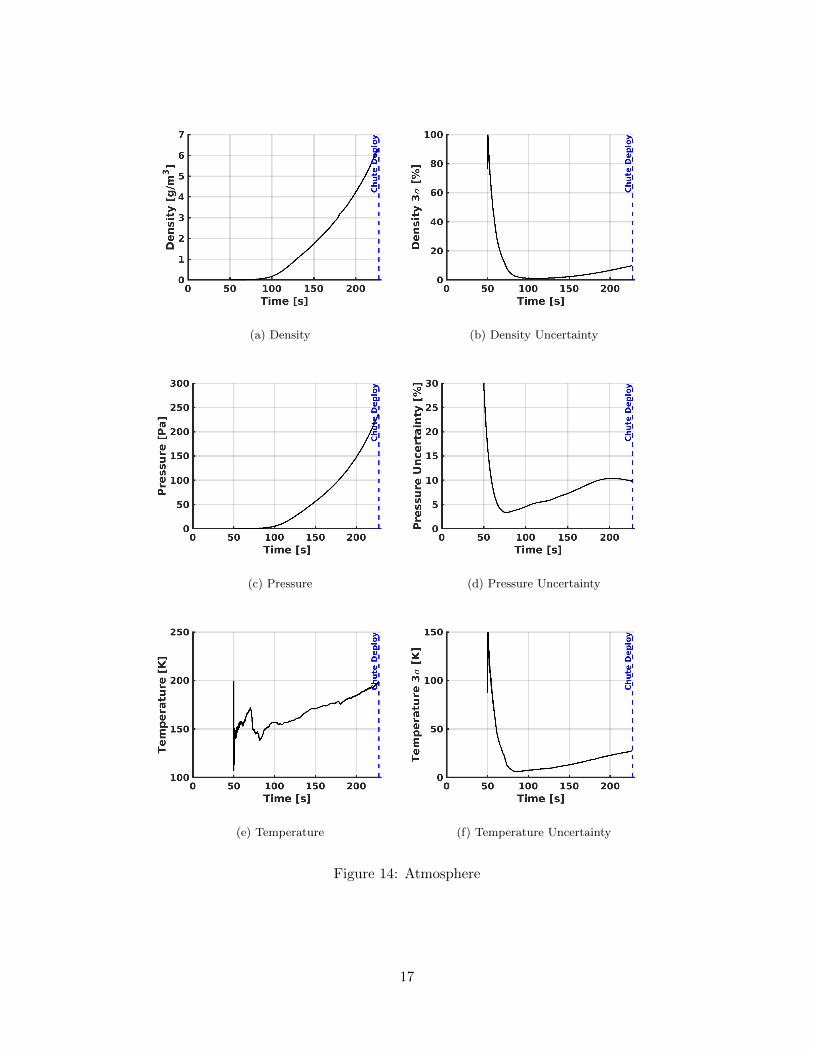
(a) Density (b) Density Uncertainty
(c) Pressure (d) Pressure Uncertainty
(e) Temperature (f) Temperature Uncertainty
Figure 14: Atmosphere
17
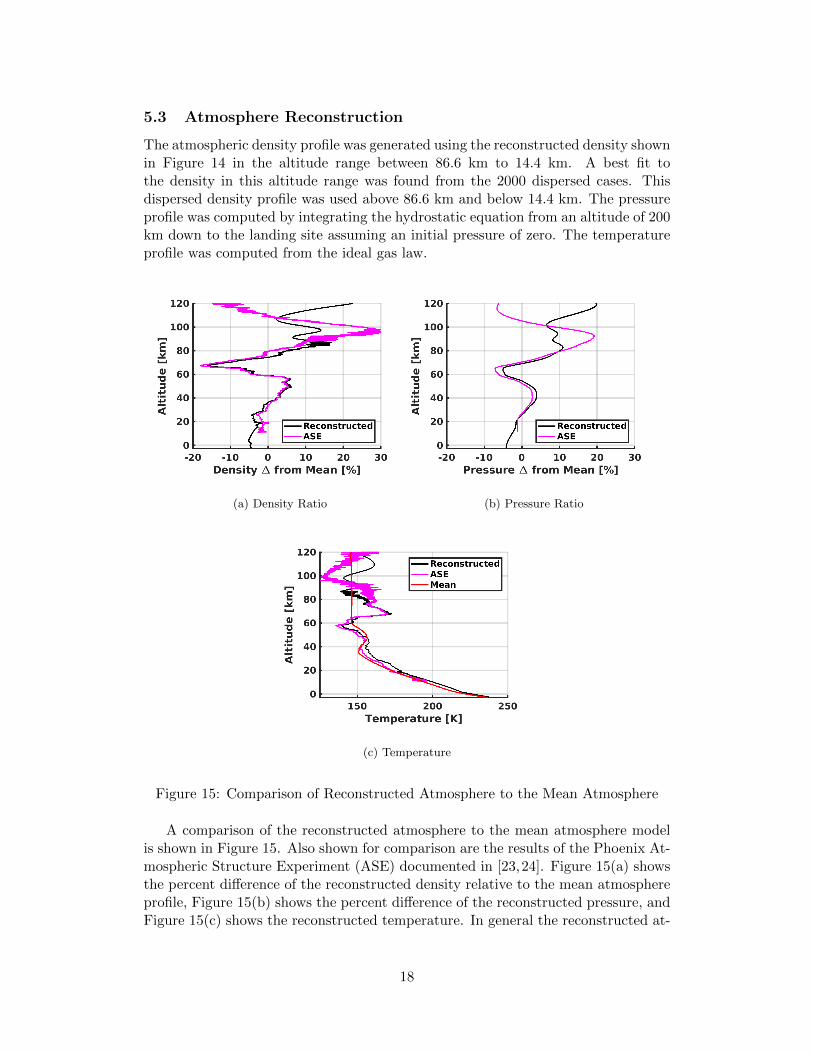
5.3 Atmosphere Reconstruction
The atmospheric density profile was generated using the reconstructed density shownin Figure 14 in the altitude range between 86.6 km to 14.4 km. A best fit tothe density in this altitude range was found from the 2000 dispersed cases. Thisdispersed density profile was used above 86.6 km and below 14.4 km. The pressureprofile was computed by integrating the hydrostatic equation from an altitude of 200km down to the landing site assuming an initial pressure of zero. The temperatureprofile was computed from the ideal gas law.
(a) Density Ratio (b) Pressure Ratio
(c) Temperature
Figure 15: Comparison of Reconstructed Atmosphere to the Mean Atmosphere
A comparison of the reconstructed atmosphere to the mean atmosphere modelis shown in Figure 15. Also shown for comparison are the results of the Phoenix At-mospheric Structure Experiment (ASE) documented in [23,24]. Figure 15(a) showsthe percent difference of the reconstructed density relative to the mean atmosphereprofile, Figure 15(b) shows the percent difference of the reconstructed pressure, andFigure 15(c) shows the reconstructed temperature. In general the reconstructed at-
18
mosphere profile matches with the ASE results. Differences at upper altitudes aredue to use of a dispersed atmosphere profile case above 86.6 km in the reconstructedatmosphere presented in this memorandum. The ASE data made use of accelerom-eter data above that altitude, although the results are noisy and so are not likelyto be physically valid. Note that the ASE results end at parachute deployment anddo not extend to the surface. The reconstructed temperature at the surface is 238.4K, which matches within 0.4 K to the measurements made by the lander describedin Section 3.6. The mean temperature at the surface is 234 K.
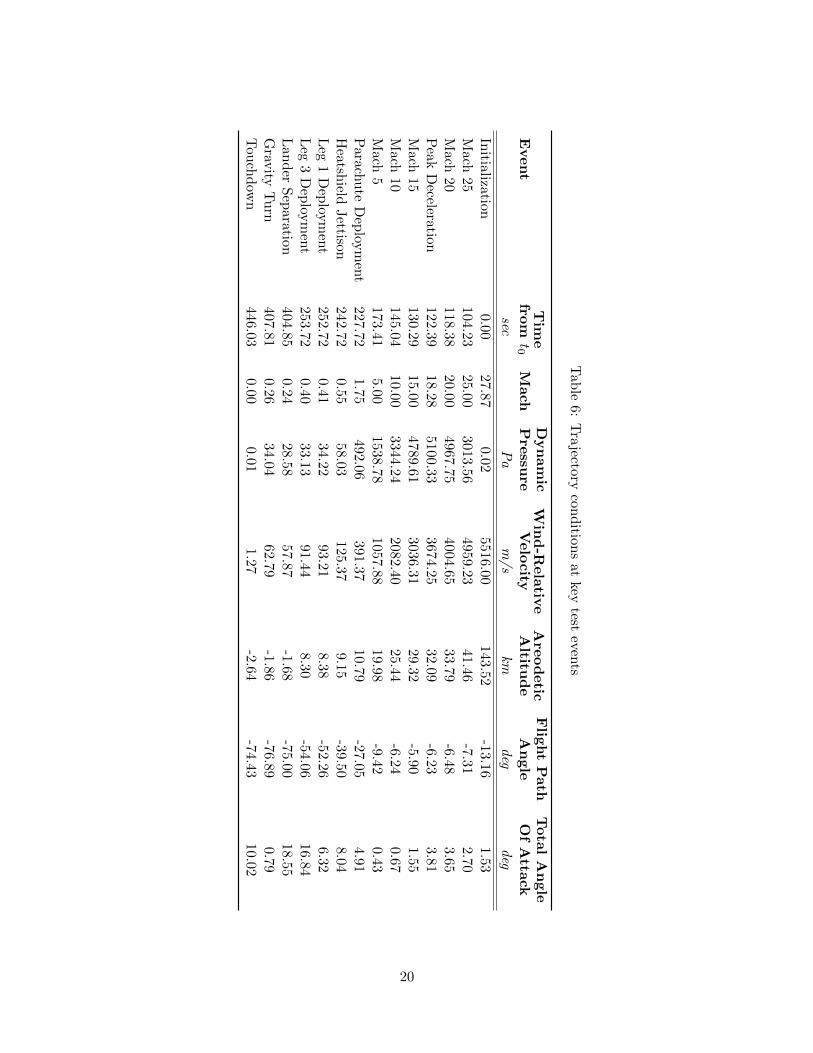
6 Trajectory Conditions
A summary of the conditions at several events in the trajectory is provided inTable 6.
19
Tab
le6:
Tra
jectorycon
dition
sat
keytest
events
Event
Tim
efro
mt0
Mach
Dyn
am
icP
ressu
reW
ind
-Rela
tive
Velo
city
Are
od
etic
Altitu
de
Flig
ht
Path
An
gle
Tota
lA
ngle
Of
Atta
cksec
Pa
m/s
kmdeg
deg
Initia
lizatio
n0.00
27.870.02
5516.00143.52
-13.161.53
Mach
25
104.23
25.003013.56
4959.2341.46
-7.312.70
Mach
20
118.38
20.004967.75
4004.6533.79
-6.483.65
Peak
Decelera
tion
122.3
918.28
5100.333674.25
32.09-6.23
3.81M
ach15
130.29
15.004789.61
3036.3129.32
-5.901.55
Mach
10
145.04
10.003344.24
2082.4025.44
-6.240.67
Mach
517
3.41
5.001538.78
1057.8819.98
-9.420.43
Parach
ute
Dep
loym
ent
227.7
21.75
492.06391.37
10.79-27.05
4.91H
eatshield
Jettiso
n242.72
0.5558.03
125.379.15
-39.508.04
Leg
1D
eploy
men
t25
2.7
20.41
34.2293.21
8.38-52.26
6.32L
eg3
Dep
loym
ent
253.7
20.40
33.1391.44
8.30-54.06
16.84L
an
der
Sep
aration404.85
0.2428.58
57.87-1.68
-75.0018.55
Grav
ityT
urn
407.81
0.2634.04
62.79-1.86
-76.890.79
Tou
chd
own
446.0
30.00
0.011.27
-2.64-74.43
10.02
20
7 Conclusions
The NewSTEP Kalman filter trajectory reconstruction code was used to reconstructthe Mars Phoenix entry, descent, and landing trajectory and the day of landingatmosphere. All data that was available was used in the reconstruction process,including initial conditions, inertial measurement unit, radar altimeter, landing sitecoordinates, and atmospheric models. Uncertainties were computed on all estimatedstates as a by product of the Kalman filter process. The atmosphere reconstructionresults compared well with published results from the Phoenix Atmosphere StructureExperiment.
References
1. Blanchard, R. C., “Mars Phoenix Mission Entry, Descent, and Landing Trajec-tory and Atmosphere Reconstruction,” Technical Report, The George WashingtonUniversity, Grant Award No. CCLS20458F, January 2009.
2. Blanchard, R. C. and Desai, P. N., “Mars Phoenix Entry, Descent, and LandingTrajectory and Atmosphere Reconstruction,” Journal of Spacecraft and Rockets,Vol. 48, No. 5, 2011, pp. 809–821.
3. Crassidis, J. L., and Junkins, J. L., Optimal Estimation of Dynamic Systems,CRC Press, Boca Raton, FL, 2004, Chapter 5.
4. Grover, R. M., Cichy, B. D., and Desai, P., “Overview of the Phoenix Entry,Descent, and Landing System Architecture,” Journal of Spacecraft and Rockets,Vol. 48, No. 5, 2011, pp. 706–712.
5. Winder, S., Analog and Digital Filter Design, Second Edition, Elsevier Science,2002, Chapter 2.
6. Portock, B. M., Kruizinga, G., Bonfiglio, E., Raofi, B., and Ryne, M., “NavigationChallenges of the Mars Phoenix Lander Mission,” AIAA Paper 2008–7214, August2008.
7. Tapley, B. D., Schutz, , B. E., and Born, G. H., Statistical Orbit Determination,Elsevier, 2004, Chapter 2.
8. Withers, P. and Catling, D. C., “Observations of Atmospheric Tides on Mars atthe Season and Latitude of the Phoenix Atmospheric Entry,” Geophysical ResearchLetters, Vol. 37, 2010, Paper L24204.
9. Karlgaard C. D., Tartabini, P. V., Blanchard, R. C., Kirsch, M., and To-niolo, M. D., “Hyper-X Post-Flight-Trajectory Reconstruction,” Journal of Space-craft and Rockets, Vol. 43, No. 1, 2006, pp. 105–115.
10. Karlgaard, C. D., Beck, R. E., Derry, S. D., Brandon, J. M., Starr, B. R.,Tartabini, P. V., and Olds, A. D., “Ares I-X Trajectory Reconstruction: Methodol-ogy and Results,” Journal of Spacecraft and Rockets, Vol. 50, No. 3, 2013, pp. 641–661.
21
11. Karlgaard, C. D., Kutty, P., Schoenenberger, M., Munk, M. M., Little, A.,Kuhl, C. A., and Shidner, J., “Mars Science Laboratory Entry Atmospheric DataSystem Trajectory and Atmosphere Reconstruction,” Journal of Spacecraft andRockets, Vol. 51, No. 4, 2014, pp. 1029–1047.
12. Karlgaard, C. D., Kutty, P., O’Farrell, C., Blood, E., Ginn, J., and Schoenen-berger, M., “Reconstruction of Atmosphere, Trajectory, and Aerodynamics for theLow-Density Supersonic Decelerator Project,” Journal of Spacecraft and Rockets,Vol. 56, No. 1, 2019, pp. 221–240.
13. Kutty, P. and Karlgaard, C. D., “Mars Science Laboratory Aerodatabase Trajec-tory Reconstruction and Uncertainty Assessment,” AIAA Paper 2014-1094, Jan-uary 2014.
14. Kutty, P., “Reconstruction and Uncertainty Quantification of Entry, Descent,and Landing Trajectories Using Vehicle Aerodynamics,” M. S. Thesis, School ofAerospace Engineering, Georgia Institute of Technology, May 2014.
15. Rafkin, S. C. R., Haberle, R. M., and Michaels, T. I., “The Mars Regional Atmo-spheric Modeling System: Model Description and Selected Simulations,” Icarus,Vol. 151, No. 2, 2001, pp. 228-256.
16. Tamppari, L. K., Barnes, J., Bonfiglio, E., Cantor, B., Friedson, A. J., Ghosh, A.,Grover, M. R., Kass, D., Martin, T. Z., Mellon, M., Michaels, T., Murphy, J.,Rafkin, S. C. R., Smith, M. D., Tsuyuki, G., Tyler, D., and Wolff, M., “ExpectedAtmospheric Environment for the Phoenix Landing Season and Location,” Journalof Geophysical Research, Vol. 113, No. E10, 2008, Paper E00A20.
17. Prince, J. L., Desai, P. N., Queen, E. M., and Grover, M. R., “Mars PhoenixEntry, Descent, and Landing Simulation Design and Modeling Analysis,” Journalof Spacecraft and Rockets, Vol. 48, No. 5, 2011, pp. 756–764.
18. McCleese, D. J., Schofield, J. T., Taylor, F. W., Calcutt, S. B., Foote, M. C.,Kass, D. M., Leovy, C. B., Paige, D. A., Read, P. L., and Zurek, R. W., “MarsClimate Sounder: An Investigation of Thermal and Water Vapor Structure, Dustand Condensate Distributions in the Atmosphere, and Energy Balance of the PolarRegions,” Journal of Geophysical Research, Vol. 112, No. E5, 2007, Paper E05S06.
19. Desai, P. N., Prince, J. L., Queen, E. M., Schoenenberger, M., Cruz, J. R., andGrover, M. R., “Entry, Descent, and Landing Performance of the Mars PhoenixLander,” Journal of Spacecraft and Rockets, Vol. 48, No. 5, 2011, pp. 798–808.
20. Taylor, P. A., Catling, D. C., Daly, M., Dickinson, C. S., Gunnlaugsseon, H. P.,Harri, A., and Lange, C., “Temperature, Pressure, and Wind Instrumentation inthe Phoenix Meteorological Package,” Journal of Geophysical Research, Vol. 113,No. E3, 2008, Paper E00A10.
21. Edquist, K. T., Desai, P. N., and Schoenenberger, M., “Aerodynamics for MarsPhoenix Entry Capsule,” Journal of Spacecraft and Rockets, Vol. 48, No. 5, 2011,pp. 713–726.
22
22. Konopliv, A. S., Asmar, S. W., Folkner, W. M., Karatekin, O., Nunes, D. C.,Smrekar, S. E., Yoder, C. F., and Zuber, M. T., “Mars High Resolution GravityFields from MRO, Mars Seasonal Gravity, and Other Dynamical Parameters,”Icarus, Vol. 211, No. 1, 2011, pp. 401–428.
23. Withers, P. and Catling, D. C., “The Phoenix Atmospheric Structure Exper-iment (ASE): Data Processing and Scientific Results,” International PlanetaryProbe Workshop, Barcelona, Spain, June 2010.
24. Withers, P., Catling, D. C., and Murphy, J. R., “Phoenix Lander AtmosphericStructure Reduced Data Records, Version 1.0,” PHX-M-ASE-5-EDL-RDR-V1.0,NASA Planetary Data System, Washington, D.C., 2010.
23
REPORT DOCUMENTATION PAGE Form ApprovedOMB No. 0704–0188
The public reporting burden for this collection of information is estimated to average 1 hour per response, including the time for reviewing instructions, searching existing data sources,gathering and maintaining the data needed, and completing and reviewing the collection of information. Send comments regarding this burden estimate or any other aspect of this collectionof information, including suggestions for reducing this burden, to Department of Defense, Washington Headquarters Services, Directorate for Information Operations and Reports(0704-0188), 1215 Jefferson Davis Highway, Suite 1204, Arlington, VA 22202-4302. Respondents should be aware that notwithstanding any other provision of law, no person shall besubject to any penalty for failing to comply with a collection of information if it does not display a currently valid OMB control number.PLEASE DO NOT RETURN YOUR FORM TO THE ABOVE ADDRESS.
Standard Form 298 (Rev. 8/98)Prescribed by ANSI Std. Z39.18
1. REPORT DATE (DD-MM-YYYY)
01-05-20192. REPORT TYPE
Technical Memorandum3. DATES COVERED (From - To)
4. TITLE AND SUBTITLE
Mars Phoenix EDL Trajectory and Atmosphere Reconstruction Using NewSTEP
5a. CONTRACT NUMBER
5b. GRANT NUMBER
5c. PROGRAM ELEMENT NUMBER
5d. PROJECT NUMBER
5e. TASK NUMBER
5f. WORK UNIT NUMBER
6. AUTHOR(S)
Christopher D. Karlgaard and Jake A. Tynis
7. PERFORMING ORGANIZATION NAME(S) AND ADDRESS(ES)
NASA Langley Research CenterHampton, Virginia 23681-2199
8. PERFORMING ORGANIZATIONREPORT NUMBER
L–21028
9. SPONSORING/MONITORING AGENCY NAME(S) AND ADDRESS(ES)
National Aeronautics and Space AdministrationWashington, DC 20546-0001
10. SPONSOR/MONITOR’S ACRONYM(S)NASA
11. SPONSOR/MONITOR’S REPORTNUMBER(S)
NASA/TM–2019–22028212. DISTRIBUTION/AVAILABILITY STATEMENT
Unclassified-UnlimitedSubject Category 12Availability: NASA STI Program (757) 864-9658
13. SUPPLEMENTARY NOTES
14. ABSTRACT
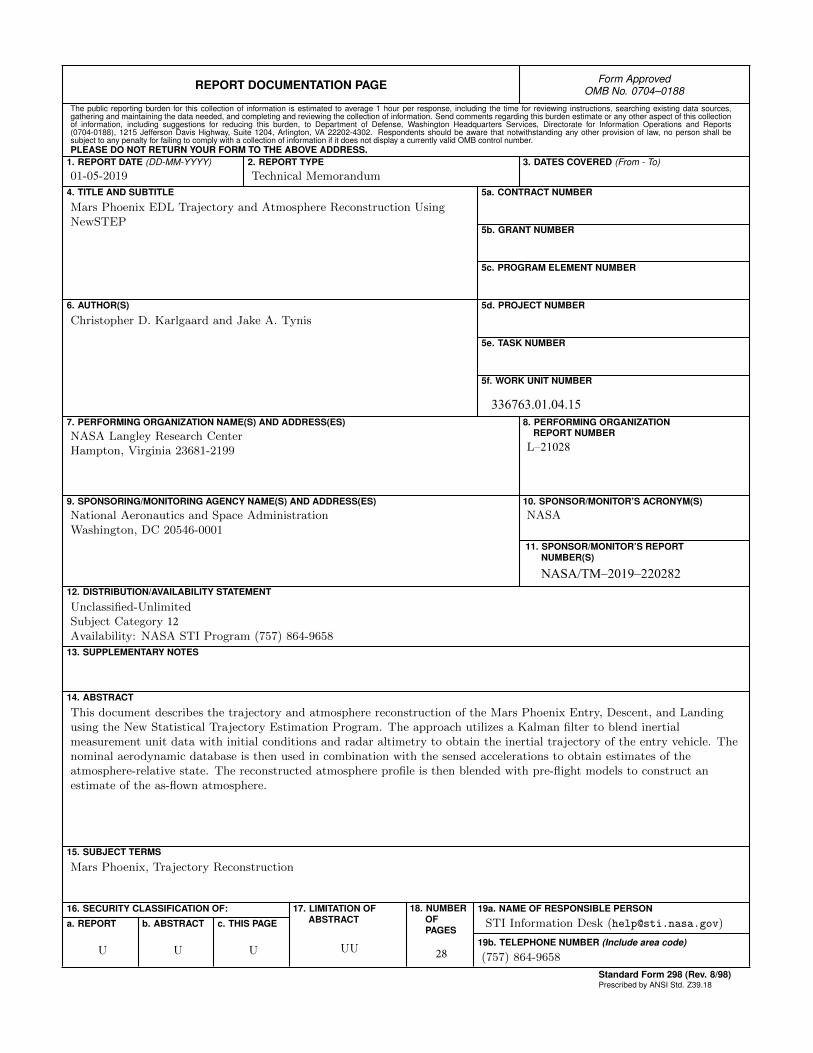
This document describes the trajectory and atmosphere reconstruction of the Mars Phoenix Entry, Descent, and Landingusing the New Statistical Trajectory Estimation Program. The approach utilizes a Kalman filter to blend inertialmeasurement unit data with initial conditions and radar altimetry to obtain the inertial trajectory of the entry vehicle. Thenominal aerodynamic database is then used in combination with the sensed accelerations to obtain estimates of theatmosphere-relative state. The reconstructed atmosphere profile is then blended with pre-flight models to construct anestimate of the as-flown atmosphere.
15. SUBJECT TERMS
Mars Phoenix, Trajectory Reconstruction
16. SECURITY CLASSIFICATION OF:
a. REPORT
U
b. ABSTRACT
U
c. THIS PAGE
U
17. LIMITATION OFABSTRACT
UU
18. NUMBEROFPAGES
28
19a. NAME OF RESPONSIBLE PERSON
STI Information Desk ([email protected])
19b. TELEPHONE NUMBER (Include area code)
(757) 864-9658
336763.01.04.15