marquette law school poll { july 7-10, 2016 results for ... · marquette law school poll { july...
TRANSCRIPT

Marquette Law School Poll – July 7-10, 2016
(Percentages are rounded to whole numbers for reporting of results. Values ending in .5 here mayround up or down if they are slightly above .5 or slightly below. Frequencies have been roundedto whole numbers but percentages are calculated based on non-integer weighted sample sizes.)
Results for all survey items among only likely voters are presented here. Please note that somequestions are only asked of particular groups of respondents. In these instances, the row “NA’s”includes the number and percent of respondents omitted from the question. These omitted casesare ignored when calculating the “Valid” and “Cumulative” percent columns.
Results for all items among Likely Voters
S2. Record Gender
Frequency Percent Valid Percent Cum Percent
Male 299 48 48 48Female 330 52 52 100Total 629 100 100
S3. Do you currently live in Wisconsin?
Frequency Percent Valid Percent Cum Percent
Yes 629 100 100 100Total 629 100 100
S4. Do you currently live within Milwaukee city limits?
Frequency Percent Valid Percent Cum Percent
Yes 54 9 56 56No 42 7 44 100NA’s 534 85Total 629 100 100

S5. Some people are registered to vote and others are not. Are you registered to vote in theprecinct or ward where you now live, or aren’t you?
Frequency Percent Valid Percent Cum Percent
Yes, registered to vote 589 94 94 94No, not registered to vote 37 6 6 100No Answer/Don’t Know/Refused 3 0 0 100Total 629 100 100
S6. Do you plan to register to vote, or is there a chance that you may not register?
Frequency Percent Valid Percent Cum Percent
Plan to Register 40 6 100 100NA’s 589 94Total 629 100 100
Q1. Some people seem to follow what’s going on in politics most of the time, whether there’s anelection going on or not. Others aren’t that interested. Would you say you follow what’s going onin politics most of the time, some of the time, only now and then, or hardly at all?
Frequency Percent Valid Percent Cum Percent
Most of the time 454 72 72 72Some of the time 140 22 22 94Only now and then 28 4 4 99Hardly at all 7 1 1 100Don’t know 0 0 0 100Total 629 100 100
Q2. What are the chances that you will vote in the November 2016 general election for Presi-dent, Congress, and other offices – are you absolutely certain to vote, very likely to vote, are thechances 50-50, or don’t you think you will vote?
Frequency Percent Valid Percent Cum Percent
Absolutely certain 629 100 100 100Total 629 100 100
Q3. Over the past year, do you feel the economy has gotten better, gotten worse, or stayed aboutthe same?
Frequency Percent Valid Percent Cum Percent
Gotten better 162 26 26 26Gotten worse 180 29 29 54Stayed the same 278 44 44 98Don’t know 10 2 2 100Total 629 100 100

Q4. Looking ahead, over the next year do you expect the economy to get better, get worse, orstay about the same?
Frequency Percent Valid Percent Cum Percent
Get better 161 26 26 26Get worse 138 22 22 48Stay the same 262 42 42 89Don’t know 62 10 10 99Refused 6 1 1 100Total 629 100 100
Q5. Overall, do you approve or disapprove of the way Barack Obama is handling his job as presi-dent?
Frequency Percent Valid Percent Cum Percent
Approve 312 50 50 50Disapprove 297 47 47 97Don’t know 11 2 2 99Refused 9 1 1 100Total 629 100 100
Q6. Overall, do you approve or disapprove of the way Scott Walker is handling his job as Gover-nor of Wisconsin?
Frequency Percent Valid Percent Cum Percent
Approve 259 41 41 41Disapprove 352 56 56 97Don’t know 15 2 2 99Refused 3 1 1 100Total 629 100 100
Q7. Barack Obama: Do you have a favorable or unfavorable opinion of Barack Obama or haven’tyou heard enough about him yet?
Frequency Percent Valid Percent Cum Percent
Favorable 331 53 53 53Unfavorable 288 46 46 98Haven’t heard enough 10 2 2 100Refused 1 0 0 100Total 629 100 100
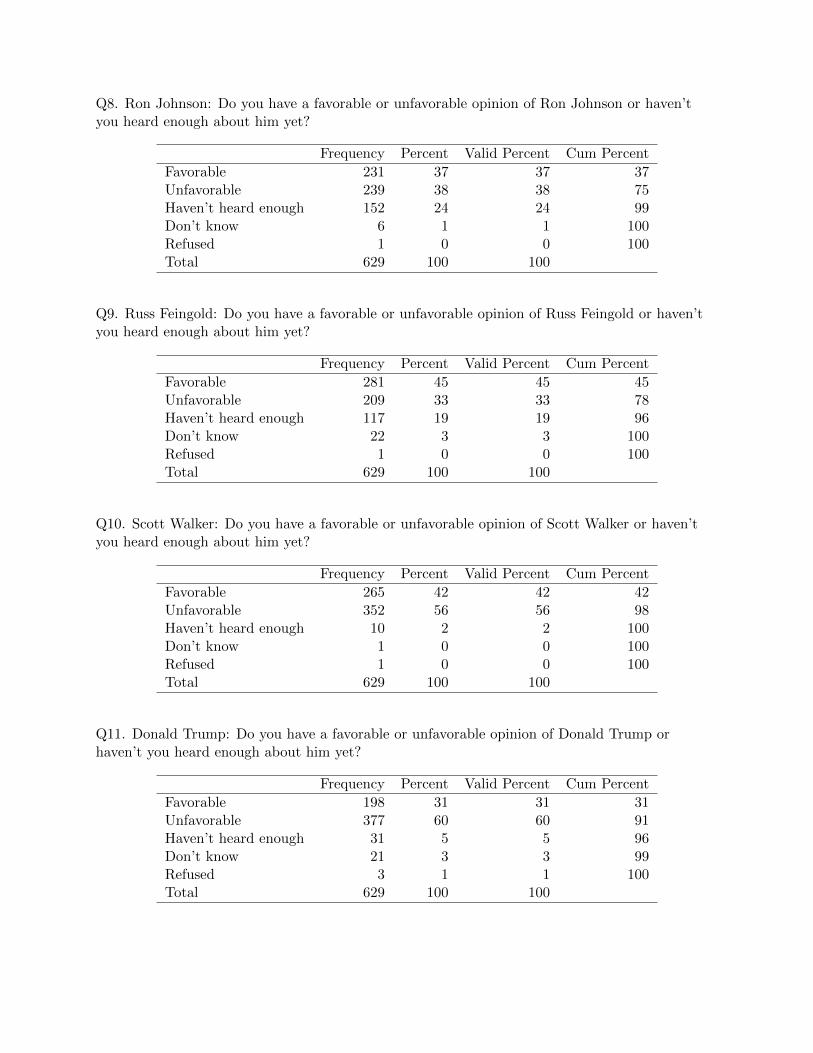
Q8. Ron Johnson: Do you have a favorable or unfavorable opinion of Ron Johnson or haven’tyou heard enough about him yet?
Frequency Percent Valid Percent Cum Percent
Favorable 231 37 37 37Unfavorable 239 38 38 75Haven’t heard enough 152 24 24 99Don’t know 6 1 1 100Refused 1 0 0 100Total 629 100 100
Q9. Russ Feingold: Do you have a favorable or unfavorable opinion of Russ Feingold or haven’tyou heard enough about him yet?
Frequency Percent Valid Percent Cum Percent
Favorable 281 45 45 45Unfavorable 209 33 33 78Haven’t heard enough 117 19 19 96Don’t know 22 3 3 100Refused 1 0 0 100Total 629 100 100
Q10. Scott Walker: Do you have a favorable or unfavorable opinion of Scott Walker or haven’tyou heard enough about him yet?
Frequency Percent Valid Percent Cum Percent
Favorable 265 42 42 42Unfavorable 352 56 56 98Haven’t heard enough 10 2 2 100Don’t know 1 0 0 100Refused 1 0 0 100Total 629 100 100
Q11. Donald Trump: Do you have a favorable or unfavorable opinion of Donald Trump orhaven’t you heard enough about him yet?
Frequency Percent Valid Percent Cum Percent
Favorable 198 31 31 31Unfavorable 377 60 60 91Haven’t heard enough 31 5 5 96Don’t know 21 3 3 99Refused 3 1 1 100Total 629 100 100

Q12. Hillary Clinton: Do you have a favorable or unfavorable opinion of Hillary Clinton orhaven’t you heard enough about her yet?
Frequency Percent Valid Percent Cum Percent
Favorable 243 39 39 39Unfavorable 352 56 56 94Haven’t heard enough 18 3 3 97Don’t know 13 2 2 99Refused 4 1 1 100Total 629 100 100
Q13. Bernie Sanders: Do you have a favorable or unfavorable opinion of Bernie Sanders orhaven’t you heard enough about him yet?
Frequency Percent Valid Percent Cum Percent
Favorable 286 45 45 45Unfavorable 257 41 41 86Haven’t heard enough 71 11 11 97Don’t know 11 2 2 99Refused 4 1 1 100Total 629 100 100
Q14. Paul Ryan: Do you have a favorable or unfavorable opinion of Paul Ryan or haven’t youheard enough about him yet?
Frequency Percent Valid Percent Cum Percent
Favorable 313 50 50 50Unfavorable 215 34 34 84Haven’t heard enough 82 13 13 97Don’t know 16 3 3 100Refused 3 0 0 100Total 629 100 100
Q15. Gary Johnson: Do you have a favorable or unfavorable opinion of Gary Johnson or haven’tyou heard enough about him yet?
Frequency Percent Valid Percent Cum Percent
Favorable 75 12 12 12Unfavorable 65 10 10 22Haven’t heard enough 424 67 67 90Don’t know 61 10 10 99Refused 4 1 1 100Total 629 100 100
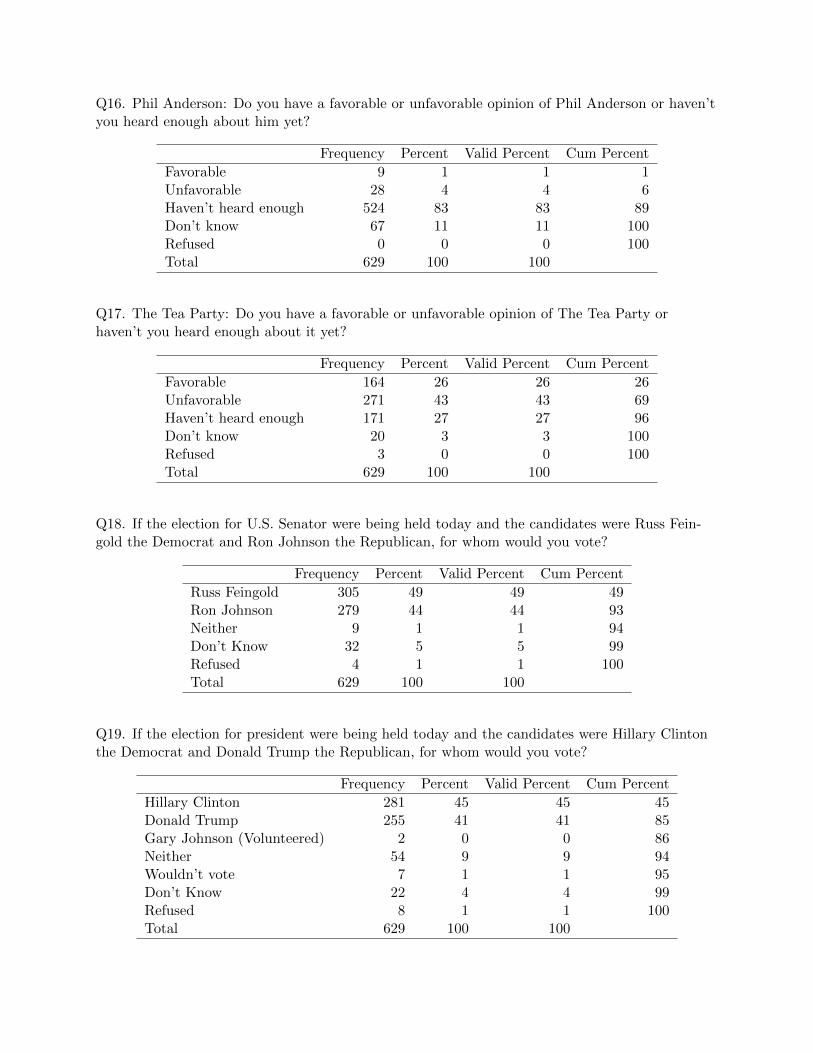
Q16. Phil Anderson: Do you have a favorable or unfavorable opinion of Phil Anderson or haven’tyou heard enough about him yet?
Frequency Percent Valid Percent Cum Percent
Favorable 9 1 1 1Unfavorable 28 4 4 6Haven’t heard enough 524 83 83 89Don’t know 67 11 11 100Refused 0 0 0 100Total 629 100 100
Q17. The Tea Party: Do you have a favorable or unfavorable opinion of The Tea Party orhaven’t you heard enough about it yet?
Frequency Percent Valid Percent Cum Percent
Favorable 164 26 26 26Unfavorable 271 43 43 69Haven’t heard enough 171 27 27 96Don’t know 20 3 3 100Refused 3 0 0 100Total 629 100 100
Q18. If the election for U.S. Senator were being held today and the candidates were Russ Fein-gold the Democrat and Ron Johnson the Republican, for whom would you vote?
Frequency Percent Valid Percent Cum Percent
Russ Feingold 305 49 49 49Ron Johnson 279 44 44 93Neither 9 1 1 94Don’t Know 32 5 5 99Refused 4 1 1 100Total 629 100 100
Q19. If the election for president were being held today and the candidates were Hillary Clintonthe Democrat and Donald Trump the Republican, for whom would you vote?
Frequency Percent Valid Percent Cum Percent
Hillary Clinton 281 45 45 45Donald Trump 255 41 41 85Gary Johnson (Volunteered) 2 0 0 86Neither 54 9 9 94Wouldn’t vote 7 1 1 95Don’t Know 22 4 4 99Refused 8 1 1 100Total 629 100 100

Q20. If the election for U.S. Senator were being held today and the candidates were Russ Fein-gold the Democrat and Ron Johnson the Republican and Phil Anderson the Libertarian, forwhom would you vote?
Frequency Percent Valid Percent Cum Percent
Russ Feingold 289 46 46 46Ron Johnson 253 40 40 86Phil Anderson 47 7 7 94None of these 10 2 2 95Wouldn’t vote 3 0 0 96Don’t know 25 4 4 99Refused 3 1 1 100Total 629 100 100
Q21. If the election for president were being held today and the candidates were Hillary Clintonthe Democrat, Donald Trump the Republican, Gary Johnson the Libertarian and Jill Stein theGreen Party, for whom would you vote?
Frequency Percent Valid Percent Cum Percent
Hillary Clinton 272 43 43 43Donald Trump 234 37 37 80Gary Johnson, Libertarian party 51 8 8 89Jill Stein, Green party 15 2 2 91None of these 16 3 3 94Wouldn’t vote 5 1 1 94Don’t know 31 5 5 99Refused 5 1 1 100Total 629 100 100
Q22a. How comfortable are you with the idea of Hillary Clinton as president? Are you very com-fortable, somewhat comfortable, somewhat uncomfortable or very uncomfortable?
Frequency Percent Valid Percent Cum Percent
Very comfortable 133 21 21 21Somewhat comfortable 132 21 21 42Somewhat uncomfortable 83 13 13 55Very uncomfortable 279 44 44 100Don’t know 2 0 0 100Total 629 100 100

Q22b. How comfortable are you with the idea of Donald Trump as president? Are you very com-fortable, somewhat comfortable, somewhat uncomfortable or very uncomfortable?
Frequency Percent Valid Percent Cum Percent
Very comfortable 94 15 15 15Somewhat comfortable 127 20 20 35Somewhat uncomfortable 79 13 13 48Very uncomfortable 326 52 52 99Don’t know 3 1 1 100Refused 1 0 0 100Total 629 100 100
Q23. Please tell me whether the following statement describes Hillary Clinton, or not.... she issomeone who is honest.
Frequency Percent Valid Percent Cum Percent
Describes 196 31 31 31Does not describe 412 66 66 97Don’t know 18 3 3 99Refused 3 1 1 100Total 629 100 100
Q24. Please tell me whether the following statement describes Donald Trump, or not.... he issomeone who is honest.
Frequency Percent Valid Percent Cum Percent
Describes 217 35 35 35Does not describe 384 61 61 96Don’t know 25 4 4 100Refused 2 0 0 100Total 629 100 100
Q25. Please tell me whether the following statement describes Hillary Clinton, or not.... she issomeone who has the qualifications to be president.
Frequency Percent Valid Percent Cum Percent
Describes 357 57 57 57Does not describe 264 42 42 99Don’t know 5 1 1 100Refused 3 0 0 100Total 629 100 100

Q26. Please tell me whether the following statement describes Donald Trump, or not.... he issomeone who has the qualifications to be president.
Frequency Percent Valid Percent Cum Percent
Describes 222 35 35 35Does not describe 403 64 64 99Don’t know 5 1 1 100Total 629 100 100
Q27. Do you think the Republican Party is united now, is divided now but will unite by Novem-ber, or will still be divided in November?
Frequency Percent Valid Percent Cum Percent
United now 34 5 5 5Divided but will unite by November 200 32 32 37Still divided in November 376 60 60 97Don’t know 18 3 3 100Refused 1 0 0 100Total 629 100 100
Q28. Do you think the Democratic Party is united now, is divided now but will unite by Novem-ber, or will still be divided in November?
Frequency Percent Valid Percent Cum Percent
United now 225 36 36 36Divided but will unite by November 230 37 37 72Still divided in November 154 25 25 97Don’t know 19 3 3 100Refused 1 0 0 100Total 629 100 100
Q29a. When it comes to marijuana, the government should emphasize prosecuting individualswho use the drug over providing them with treatment.
Frequency Percent Valid Percent Cum Percent
Strongly agree 35 6 10 10Somewhat agree 58 9 17 28Somewhat disagree 96 15 28 56Strongly disagree 138 22 41 97Don’t know 8 1 3 100Refused 1 0 0 100NA’s 292 46Total 629 100 100

Q30a. When it comes to heroin, the government should emphasize prosecuting individuals whouse the drug over providing them with treatment.
Frequency Percent Valid Percent Cum Percent
Strongly agree 82 13 24 24Somewhat agree 88 14 26 50Somewhat disagree 78 12 23 73Strongly disagree 84 13 25 98Don’t know 6 1 2 100Refused 1 0 0 100NA’s 292 46Total 629 100 100
Q31a. When it comes to crack cocaine, the government should emphasize prosecuting individualswho use the drug over providing them with treatment.
Frequency Percent Valid Percent Cum Percent
Strongly agree 82 13 24 24Somewhat agree 79 13 23 48Somewhat disagree 85 14 25 73Strongly disagree 85 14 25 98Don’t know 5 1 2 100Refused 1 0 0 100NA’s 292 46Total 629 100 100
Q32a. When it comes to methamphetamine or “crystal meth,” the government should emphasizeprosecuting individuals who use the drug over providing them with treatment.
Frequency Percent Valid Percent Cum Percent
Strongly agree 94 15 28 28Somewhat agree 81 13 24 52Somewhat disagree 86 14 26 78Strongly disagree 70 11 21 98Don’t know 5 1 1 100Refused 1 0 0 100NA’s 292 46Total 629 100 100

Q29b. When it comes to marijuana, the government should emphasize providing treatment toindividuals who use the drug over prosecuting them.
Frequency Percent Valid Percent Cum Percent
Strongly agree 112 18 38 38Somewhat agree 93 15 32 70Somewhat disagree 34 5 12 82Strongly disagree 43 7 15 97Don’t know 7 1 3 100Refused 1 0 0 100NA’s 337 54Total 629 100 100
Q30b. When it comes to heroin, the government should emphasize providing treatment to indi-viduals who use the drug over prosecuting them.
Frequency Percent Valid Percent Cum Percent
Strongly agree 104 16 36 36Somewhat agree 103 16 35 71Somewhat disagree 32 5 11 82Strongly disagree 52 8 18 99Don’t know 1 0 0 100Refused 0 0 0 100NA’s 337 54Total 629 100 100
Q31b. When it comes to crack cocaine, the government should emphasize providing treatment toindividuals who use the drug over prosecuting them.
Frequency Percent Valid Percent Cum Percent
Strongly agree 96 15 33 33Somewhat agree 110 18 38 71Somewhat disagree 25 4 9 79Strongly disagree 55 9 19 98Don’t know 5 1 2 100Refused 0 0 0 100NA’s 337 54Total 629 100 100

Q32b. When it comes to methamphetamine, or “crystal meth,” the government should emphasizeproviding treatment to individuals who use the drug over prosecuting them.
Frequency Percent Valid Percent Cum Percent
Strongly agree 92 15 31 31Somewhat agree 112 18 38 70Somewhat disagree 25 4 9 79Strongly disagree 58 9 20 98Don’t know 4 1 1 100Refused 0 0 0 100NA’s 337 54Total 629 100 100
Q33. Marijuana is a major problem in the area where I live.
Frequency Percent Valid Percent Cum Percent
Strongly agree 114 18 18 18Somewhat agree 146 23 23 41Somewhat disagree 152 24 24 65Strongly disagree 184 29 29 95Don’t know 32 5 5 100Refused 1 0 0 100Total 629 100 100
Q34. Crack cocaine is a major problem in the area where I live.
Frequency Percent Valid Percent Cum Percent
Strongly agree 109 17 17 17Somewhat agree 167 27 27 44Somewhat disagree 159 25 25 69Strongly disagree 122 19 19 89Don’t know 71 11 11 100Refused 1 0 0 100Total 629 100 100
Q35. Heroin is a major problem in the area where I live.
Frequency Percent Valid Percent Cum Percent
Strongly agree 263 42 42 42Somewhat agree 145 23 23 65Somewhat disagree 88 14 14 79Strongly disagree 91 15 15 93Don’t know 41 7 7 100Total 629 100 100
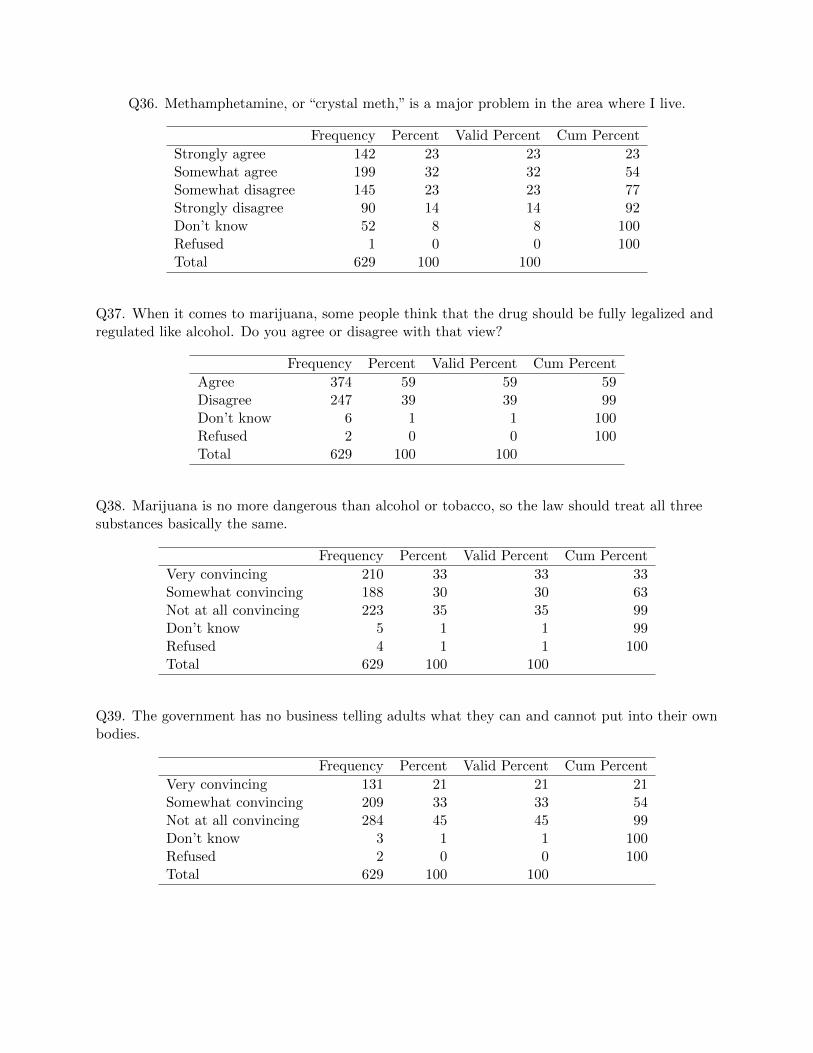
Q36. Methamphetamine, or “crystal meth,” is a major problem in the area where I live.
Frequency Percent Valid Percent Cum Percent
Strongly agree 142 23 23 23Somewhat agree 199 32 32 54Somewhat disagree 145 23 23 77Strongly disagree 90 14 14 92Don’t know 52 8 8 100Refused 1 0 0 100Total 629 100 100
Q37. When it comes to marijuana, some people think that the drug should be fully legalized andregulated like alcohol. Do you agree or disagree with that view?
Frequency Percent Valid Percent Cum Percent
Agree 374 59 59 59Disagree 247 39 39 99Don’t know 6 1 1 100Refused 2 0 0 100Total 629 100 100
Q38. Marijuana is no more dangerous than alcohol or tobacco, so the law should treat all threesubstances basically the same.
Frequency Percent Valid Percent Cum Percent
Very convincing 210 33 33 33Somewhat convincing 188 30 30 63Not at all convincing 223 35 35 99Don’t know 5 1 1 99Refused 4 1 1 100Total 629 100 100
Q39. The government has no business telling adults what they can and cannot put into their ownbodies.
Frequency Percent Valid Percent Cum Percent
Very convincing 131 21 21 21Somewhat convincing 209 33 33 54Not at all convincing 284 45 45 99Don’t know 3 1 1 100Refused 2 0 0 100Total 629 100 100

Q40. If marijuana were legalized, then it could be taxed, which could help to support importantgovernment services like education.
Frequency Percent Valid Percent Cum Percent
Very convincing 274 43 43 43Somewhat convincing 175 28 28 71Not at all convincing 176 28 28 99Don’t know 5 1 1 100Total 629 100 100
Q41. We spend too many government resources on arresting and incarcerating marijuana offend-ers; it would be better to spend those resources on other things.
Frequency Percent Valid Percent Cum Percent
Very convincing 307 49 49 49Somewhat convincing 197 31 31 80Not at all convincing 122 19 19 100Don’t know 3 0 0 100Total 629 100 100
Q42a. How much do you oppose or support making sentences more severe for all crimes?
Frequency Percent Valid Percent Cum Percent
Strongly support 57 9 17 17Support 23 4 7 24Somewhat support 86 14 26 50Somewhat oppose 70 11 21 70Oppose 39 6 12 82Strongly oppose 48 8 14 97Don’t know 7 1 2 99Refused 5 1 1 100NA’s 296 47Total 629 100 100

Q43a. How much do you oppose or support locking up more juvenile offenders?
Frequency Percent Valid Percent Cum Percent
Strongly support 41 6 12 12Support 23 4 7 19Somewhat support 89 14 27 46Somewhat oppose 81 13 24 70Oppose 24 4 7 77Strongly oppose 68 11 20 98Don’t know 7 1 2 100Refused 1 0 0 100NA’s 296 47Total 629 100 100
Q44a. How much do you oppose or support increasing the use of mandatory minimum sentencinglaws, like Three Strikes, for repeat offenders?
Frequency Percent Valid Percent Cum Percent
Strongly support 110 17 33 33Support 34 5 10 43Somewhat support 82 13 24 68Somewhat oppose 33 5 10 78Oppose 25 4 8 85Strongly oppose 42 7 12 98Don’t know 7 1 2 100Refused 1 0 0 100NA’s 296 47Total 629 100 100
Q42b. How much do you oppose or support making sentences less severe for all crimes?
Frequency Percent Valid Percent Cum Percent
Strongly support 19 3 6 6Support 20 3 7 13Somewhat support 54 9 18 32Somewhat oppose 67 11 23 54Oppose 39 6 13 67Strongly oppose 93 15 32 99Don’t know 3 0 1 100Refused 1 0 0 100NA’s 334 53Total 629 100 100

Q43b. How much do you oppose or support locking up less juvenile offenders?
Frequency Percent Valid Percent Cum Percent
Strongly support 55 9 19 19Support 33 5 11 30Somewhat support 88 14 30 59Somewhat oppose 58 9 20 79Oppose 18 3 6 85Strongly oppose 34 5 11 97Don’t know 8 1 3 99Refused 2 0 1 100NA’s 334 53Total 629 100 100
Q44b. How much do you oppose or support reducing the use of mandatory minimum sentencinglaws, like Three Strikes, for repeat offenders?
Frequency Percent Valid Percent Cum Percent
Strongly support 84 13 29 29Support 36 6 12 41Somewhat support 62 10 21 62Somewhat oppose 29 5 10 72Oppose 23 4 8 80Strongly oppose 51 8 17 97Don’t know 6 1 2 99Refused 4 1 1 100NA’s 334 53Total 629 100 100
Q45. Agree/Disagree: There is a lot of discrimination against Blacks in the U.S. today, limitingtheir chances to get ahead.
Frequency Percent Valid Percent Cum Percent
Strongly agree 129 20 20 20Agree 78 12 12 33Somewhat agree 163 26 26 59Somewhat disagree 113 18 18 77Disagree 54 9 9 85Strongly disagree 85 14 14 99Don’t know 7 1 1 100Refused 1 0 0 100Total 629 100 100
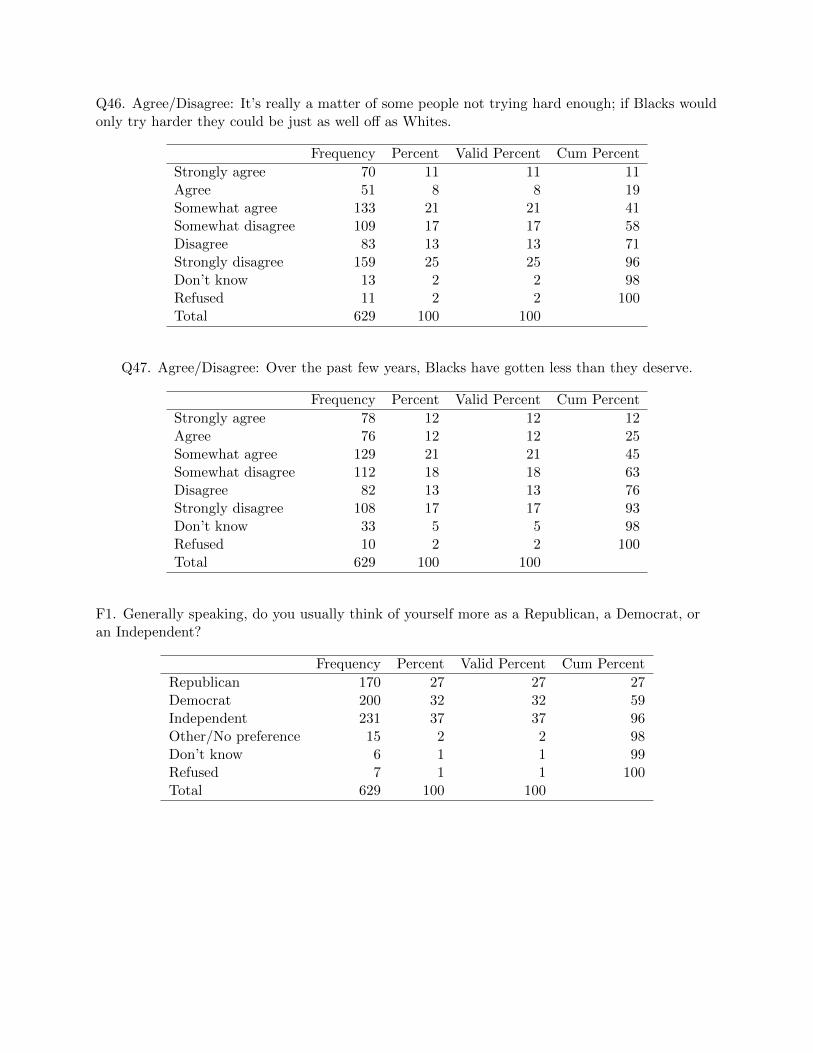
Q46. Agree/Disagree: It’s really a matter of some people not trying hard enough; if Blacks wouldonly try harder they could be just as well off as Whites.
Frequency Percent Valid Percent Cum Percent
Strongly agree 70 11 11 11Agree 51 8 8 19Somewhat agree 133 21 21 41Somewhat disagree 109 17 17 58Disagree 83 13 13 71Strongly disagree 159 25 25 96Don’t know 13 2 2 98Refused 11 2 2 100Total 629 100 100
Q47. Agree/Disagree: Over the past few years, Blacks have gotten less than they deserve.
Frequency Percent Valid Percent Cum Percent
Strongly agree 78 12 12 12Agree 76 12 12 25Somewhat agree 129 21 21 45Somewhat disagree 112 18 18 63Disagree 82 13 13 76Strongly disagree 108 17 17 93Don’t know 33 5 5 98Refused 10 2 2 100Total 629 100 100
F1. Generally speaking, do you usually think of yourself more as a Republican, a Democrat, oran Independent?
Frequency Percent Valid Percent Cum Percent
Republican 170 27 27 27Democrat 200 32 32 59Independent 231 37 37 96Other/No preference 15 2 2 98Don’t know 6 1 1 99Refused 7 1 1 100Total 629 100 100

F2. Do you think of yourself as closer to the Republican Party or to the Democratic Party?
Frequency Percent Valid Percent Cum Percent
Republican 92 15 36 36Democratic 106 17 42 79Neither/Just Independent 42 7 17 95Don’t know 10 2 4 99Refused 2 0 1 100NA’s 377 60Total 629 100 100
Q48. Would you like to see the Republican convention nominate someone other than DonaldTrump or do you think Trump should be the nominee of the party?
Frequency Percent Valid Percent Cum Percent
Nominate someone else 82 13 31 31Nominate Trump 177 28 67 99Don’t know 4 1 1 100NA’s 367 58Total 629 100 100
Q49. Which of the following would you prefer to be the Democratic presidential nominee?
Frequency Percent Valid Percent Cum Percent
Hillary Clinton 170 27 56 56Bernie Sanders 127 20 41 97Someone else 4 1 1 98Don’t know 4 1 1 100Refused 1 0 0 100NA’s 323 51Total 629 100 100

F3. What is the highest level of education you completed?
Frequency Percent Valid Percent Cum Percent
Elementary school only 3 0 0 0Some high school but didn’t finish 29 5 5 5Completed high school 187 30 30 35Some college but didn’t finish 113 18 18 53Two year college degree 83 13 13 66Four year college degree 111 18 18 84Some graduate work 19 3 3 87Completed masters or professional degree 66 11 11 97Advanced graduate work or Ph.D. 16 3 3 100Don’t know 1 0 0 100Refused 1 0 0 100Total 629 100 100
F4. What is your age?
Frequency Percent Valid Percent Cum Percent
18 10 2 2 219 1 0 0 220 5 1 1 321 6 1 1 322 5 1 1 423 2 0 0 524 3 0 0 525 5 1 1 626 9 1 1 727 11 2 2 928 8 1 1 1029 3 1 1 1130 6 1 1 1231 5 1 1 1232 10 2 2 1433 8 1 1 1534 7 1 1 1635 16 3 3 1936 21 3 3 2237 12 2 2 2438 8 1 1 2539 14 2 2 2840 8 1 1 2941 11 2 2 3142 11 2 2 3243 13 2 2 3444 5 1 1 3545 12 2 2 37
Continued on next page

F4. What is your age?
Frequency Percent Valid Percent Cum Percent
46 8 1 1 3847 9 1 1 4048 13 2 2 4249 10 2 2 4450 17 3 3 4651 11 2 2 4852 11 2 2 5053 9 1 1 5154 18 3 3 5455 19 3 3 5756 9 1 1 5857 18 3 3 6158 15 2 2 6459 14 2 2 6660 11 2 2 6861 8 1 1 6962 5 1 1 7063 10 2 2 7164 9 1 1 7365 11 2 2 7466 10 2 2 7667 10 2 2 7868 12 2 2 8069 8 1 1 8170 8 1 1 8271 5 1 1 8372 5 1 1 8473 4 1 1 8474 11 2 2 8675 7 1 1 8776 7 1 1 8877 8 1 1 9078 9 1 1 9179 8 1 1 9280 6 1 1 9381 2 0 0 9482 2 0 0 9483 4 1 1 9584 1 0 0 9585 2 0 0 9586 0 0 0 9587 4 1 1 9688 2 0 0 9689 1 0 0 96
Continued on next page

F4. What is your age?
Frequency Percent Valid Percent Cum Percent
90 3 0 0 9691 1 0 0 9792 2 0 0 9795 1 0 0 9796 1 0 0 9799 19 3 3 100Total 629 100 100
F4A. Age Group (if “Refused” in F4)
Frequency Percent Valid Percent Cum Percent
18-29 years old 2 0 10 1030-44 years old 7 1 35 4545-59 years old 4 1 20 6560 years old or more 2 0 12 77Refused 4 1 23 100NA’s 611 97Total 629 100 100
F5. Are you currently married, living with a partner but not married, widowed, divorced, sepa-rated, or have you never been married?
Frequency Percent Valid Percent Cum Percent
Married 370 59 59 59Living with a partner but not married 44 7 7 66Widowed 46 7 7 73Divorced 55 9 9 82Separated 1 0 0 82Never married 107 17 17 99Refused 6 1 1 100Total 629 100 100
F7. Are you of Hispanic or Latino origin, such as Mexican, Puerto Rican, Cuban or some otherSpanish background?
Frequency Percent Valid Percent Cum Percent
Yes 30 5 5 5No 595 95 95 99Don’t know 0 0 0 99Refused 3 1 1 100Total 629 100 100

F8. Would you describe yourself as White, African American or Black, Asian, Native American,of more than one race or some other race?
Frequency Percent Valid Percent Cum Percent
White 533 85 85 85African American or Black 32 5 5 90Asian, South Asian or Pacific Islander 1 0 0 90Native American or American Indian 8 1 1 91More than one race 31 5 5 96Hispanic or Latino 5 1 1 97Other (SPECIFY) 10 2 2 98Refused 10 2 2 100Total 629 100 100
F9. Aside from weddings and funerals, how often do you attend religious services... more thanonce a week, once a week, once or twice a month, a few times a year, seldom, or never?
Frequency Percent Valid Percent Cum Percent
More than once a week 56 9 9 9Once a week 135 21 21 30Once or twice a month 106 17 17 47A few times a year 110 17 17 65Seldom 107 17 17 82Never 111 18 18 99Don’t know 1 0 0 100Refused 3 0 0 100Total 629 100 100
F10. What is your religious preference... are you Protestant, Roman Catholic, Jewish, Muslim,another religion or no religion?
Frequency Percent Valid Percent Cum Percent
Protestant 156 25 25 25Roman Catholic 198 31 31 56Jewish 5 1 1 57Muslim/Islam 0 0 0 57Mormon/Latter-Day Saints 1 0 0 57Other Christian Religion 113 18 18 75Other Non-Christian Religion 37 6 6 81No Religion/Atheist/Agnostic 107 17 17 98Don’t know 6 1 1 99Refused 6 1 1 100Total 629 100 100

F11. Would you describe yourself as a “born-again” or evangelical Christian, or not?
Frequency Percent Valid Percent Cum Percent
Yes, would 94 15 35 35No, would not 171 27 63 98Don’t know 4 1 1 100Refused 1 0 0 100NA’s 359 57Total 629 100 100
F12. Last year, that is in 2015, what was your total family income from all sources, before taxes?Just stop me when I get to the right category.
Frequency Percent Valid Percent Cum Percent
Less than $10,000 21 3 3 310 to under $20,000 36 6 6 920 to under $30,000 42 7 7 1630 to under $40,000 60 10 10 2540 to under $50,000 53 8 8 3450 to under $75,000 98 16 16 4975 to under $100,000 112 18 18 67100 to under $150,000 87 14 14 81150 to under $200,000 33 5 5 86Over $200,000 21 3 3 89Don’t know 12 2 2 91Refused 56 9 9 100Total 629 100 100
F13. Would you describe the place where you live as urban, suburban or rural?
Frequency Percent Valid Percent Cum Percent
Urban 142 23 23 23Suburban 232 37 37 59Rural 248 39 39 99Don’t know 6 1 1 100Refused 2 0 0 100Total 629 100 100

F15. In general, would you describe your political views as...?
Frequency Percent Valid Percent Cum Percent
Very conservative 60 10 10 10Conservative 187 30 30 39Moderate 212 34 34 73Liberal 110 18 18 91Very liberal 40 6 6 97Don’t know 8 1 1 98Refused 10 2 2 100Total 629 100 100
F16. Are you or any member of your household a member of a local, state or national laborunion?
Frequency Percent Valid Percent Cum Percent
R in Union 65 10 10 10Other in Union 28 4 4 15Non-Union 532 85 85 99Don’t Know 1 0 0 99Refused 4 1 1 100Total 629 100 100
F17. Do you or any member of your household work for federal, state, or local government: forexample, as a public school teacher, police officer, firefighter, or other government job?
Frequency Percent Valid Percent Cum Percent
Yes 125 20 20 20No 500 79 79 99Don’t know 2 0 0 100Refused 3 0 0 100Total 629 100 100
F19. Of all the personal telephone calls that you receive, do you get... ?
Frequency Percent Valid Percent Cum Percent
All or almost all on a cell phone 296 47 47 47Some on a cell phone and some on a home phone 153 24 24 71All or almost all on a regular home phone 171 27 27 99Don’t know 0 0 0 99Refused 8 1 1 100Total 629 100 100

F20. Is this phone a cell phone?
Frequency Percent Valid Percent Cum Percent
Yes 341 54 54 54No 288 46 46 100Total 629 100 100
Likely Voter
Frequency Percent Valid Percent Cum Percent
Likely Voter 629 100 100 100Total 629 100 100
wave
Frequency Percent Valid Percent Cum Percent
36 629 100 100 100Total 629 100 100
polldatestr
Frequency Percent Valid Percent Cum Percent
2016-7-7 629 100 100 100Total 629 100 100
Sex
Frequency Percent Valid Percent Cum Percent
Male 299 48 48 48Female 330 52 52 100Total 629 100 100
Age 4 categories
Frequency Percent Valid Percent Cum Percent
18-29 70 11 11 1130-44 161 26 26 3745-59 197 31 31 6860+ 197 31 31 99DK/NA/Ref 4 1 1 100Total 629 100 100

Age 6 categories
Frequency Percent Valid Percent Cum Percent
18-29 70 11 11 1130-39 107 17 17 2840-49 106 17 17 4550-59 145 23 23 6860-69 95 15 15 8370+ 102 16 16 99DK/NA/Ref 4 1 1 100Total 629 100 100
Race 3 categories
Frequency Percent Valid Percent Cum Percent
White 533 85 85 85Black 32 5 5 90Other 54 9 9 98DK/NA/Ref 10 2 2 100Total 629 100 100
Hispanic
Frequency Percent Valid Percent Cum Percent
Yes 30 5 5 5No 595 95 95 99DK/NA/Ref 4 1 1 100Total 629 100 100
5 education categories
Frequency Percent Valid Percent Cum Percent
Not HS 32 5 5 5HS 187 30 30 35Some Coll 113 18 18 53AA 83 13 13 66BA or more 212 34 34 100DK/NA/Ref 2 0 0 100Total 629 100 100

Education 5 with Post-BA
Frequency Percent Valid Percent Cum Percent
Not HS 32 5 5 5HS 187 30 30 35Some Coll/AA 196 31 31 66BA 111 18 18 84Post BA 101 16 16 100DK/NA/Ref 2 0 0 100Total 629 100 100
Education 6 AA, BA, and MA
Frequency Percent Valid Percent Cum Percent
Not HS 32 5 5 5HS 187 30 30 35Some Coll 113 18 18 53AA 83 13 13 66BA 111 18 18 84Post-BA 101 16 16 100DK/NA/Ref 2 0 0 100Total 629 100 100
3 category Party ID including leaners
Frequency Percent Valid Percent Cum Percent
Republican 262 42 42 42Democrat 306 49 49 90Independent 52 8 8 99DK/NA/Ref 9 1 1 100Total 629 100 100
3 category Party ID no leaners
Frequency Percent Valid Percent Cum Percent
Republican 170 27 27 27Democrat 200 32 32 59Independent 250 40 40 99DK/NA/Ref 9 1 1 100Total 629 100 100

Pary ID 5 categories, leaners separate
Frequency Percent Valid Percent Cum Percent
Rep 170 27 27 27Lean Rep 92 15 15 42Ind 52 8 8 50Lean Dem 106 17 17 67Dem 200 32 32 99DK/NA/Ref 9 1 1 100Total 629 100 100
Race/Ethnicity
Frequency Percent Valid Percent Cum Percent
White 525 83 83 83Black 31 5 5 88Hispanic 30 5 5 93Other 36 6 6 99DK/NA/Ref 8 1 1 100Total 629 100 100
Income Recode
Frequency Percent Valid Percent Cum Percent
Under $40k 158 25 25 25$40k to $74k 151 24 24 49$75k up 253 40 40 89DK/NA/Ref 67 11 11 100Total 629 100 100
Region/Media Market
Frequency Percent Valid Percent Cum Percent
MKE City 52 8 8 8Rest of MKE 209 33 33 42MSN 101 16 16 58GB/A 127 20 20 78Rest of State 140 22 22 100Total 629 100 100

Region2/MKE,WOW,Media Market
Frequency Percent Valid Percent Cum Percent
MKE City 52 8 8 8WOW Counties 59 9 9 18Rest of MKE 151 24 24 42MSN 101 16 16 58GB/A 127 20 20 78Rest of state 140 22 22 100Total 629 100 100
Region7/MKE,WOW,Media Market
Frequency Percent Valid Percent Cum Percent
MKE City 52 8 8 8WOW Counties 59 9 9 18Rest of MKE 151 24 24 42MSN 101 16 16 58GB/A 127 20 20 78Lax/EC 47 7 7 85MSP/DS/WAU 93 15 15 100Total 629 100 100
dma8/Eight category Media Market
Frequency Percent Valid Percent Cum Percent
MKE City 52 8 8 8WOW Counties 59 9 9 18Rest of MKE 151 24 24 42Dane Rock 69 11 11 52Rest of MSN 33 5 5 58Lax/EC 47 7 7 65GB/A 127 20 20 85Wau/MSP/DS 93 15 15 100Total 629 100 100