maroochy river flood mitigation study – flood damage analysis · part of the development of the...
TRANSCRIPT

i
- - - - - - - - - - - - - - - - - - - - - - - - - - - - - - - - - - - - - - - - - - - - - - - - - - - - - - - - -
DELWP, Western Water, Hume City Council
Preliminary Assessment Method (PAM) for Integrated Water Management Strategies Version 02 / OCTOBER 2015
- - - - - - - - - - - - - - - - - - - - - - - - - - - - - - - - - - - - - - - - - - - - - - - - - - - - - - - - -

Preliminary Assessment Method (PAM) for Integrated Water Management Strategies Final Report
1
Document Control Sheet
Project
Report Title Preliminary Assessment Method (PAM) for Integrated Water Management Strategies
Version 02
Author(s) Celeste Morgan, Sara Lloyd
Approved by Sara Lloyd
Signed
Date 8 October 2015
File Location Y:\156_Sunbury WoWCM Study\003_RAM\Report
Distribution October 2015
Revision Date Approved Details of Revision
1 October 2015 Sara Lloyd Comments on draft incorporated
This document has been prepared solely for the benefit of DELWP, Western Water and Hume City Council and is issued in confidence for the purposes only for which it is supplied. Unauthorised use of this document in any form whatsoever is prohibited. No liability is accepted by e2designlab or any employee, contractor, or sub-consultant of this company with respect to its use by any other person.
This disclaimer shall apply notwithstanding that the document may be made available to other persons for an application for permission or approval to fulfil a legal obligation.

Preliminary Assessment Method (PAM) for Integrated Water Management Strategies Final Report
2
- - - - - - - - - - - - - - - - - - - - - - - - - - - - - - - - - - - - - - - - - - - - - - - - - - - - - - - - - - -
CONTENTS - - - - - - - - - - - - - - - - - - - - - - - - - - - - - - - - - - - - - - - - - - - - - - - - - - - - - - - - - - - -
1. Introduction ....................................................................................... 3
1.1 Purpose of the Preliminary Assessment Method (PAM) 3
1.2 Intended users of the PAM 3
1.3 Structure of this document 5
1.4 Reference methodologies for IWM strategies 6
1.5 Terminology and definitions 8
2. Preparation ..................................................................................... 10
2.1 Review water cycle context 10
2.2 Identify objectives 11
2.3 Identify base case and possible options 13
3. Assessment of Options ................................................................... 17
3.1 Assess scale of benefits 17
3.2 Review key cost factors 21
3.3 Risk review 21
3.4 Finalise comparison matrix 22
4. Shortlisting of Portfolios .................................................................. 24
4.1 Select method of portfolio shortlisting 24
4.2 Review complementary tools 26
4.3 Shortlist portfolios 27
Attachment A – Review of case study IWM strategies .......................... 29
Attachment B – Reference Tables for the PAM ..................................... 46
Attachment C – Worked Example: Sunbury Growth Areas ................... 77

Preliminary Assessment Method (PAM) for Integrated Water Management Strategies Final Report
3
- - - - - - - - - - - - - - - - - - - - - - - - - - - - - - - - - - - - - - - - - - - - - - - - - - - - - - - - - - - -
1. Introduction - - - - - - - - - - - - - - - - - - - - - - - - - - - - - - - - - - - - - - - - - - - - - - - - - - - - - - - - - - - -
1.1 Purpose of the Preliminary Assessment Method (PAM) This document provides a methodology for conducting a preliminary assessment of integrated water management options, with the intention of identifying a shortlist of option portfolios to take forward for further detailed assessment. The PAM is designed to be used as part of the development of an Integrated Water Management (IWM) Strategy for a large area or region where there is opportunity to add, re-configure or augment water management infrastructure to achieve improved outcomes.
Integrated water management strategies can include a wide range of management options which can affect one aspect or multiple aspects of the water cycle. Options can be implemented at a range of scales, from regional, to precinct, to lot scale. Options can utilise different sources of water, satisfy different demands for water, and utilise a range of local or regional infrastructure for storage and treatment. Accordingly, the number of possible options to be examined in an IWM Strategy is often very high. Practitioners have often found the shortlisting process challenging and there is a gap in existing guidance around how to go about shortlisting options. The PAM brings together learnings and data from previous IWM strategies and provides a methodology framework to aid shortlisting in a time-effective yet robust manner. As part of the development of the PAM, the shortlisting processes used in a series of existing IWM strategies were reviewed. The review is documented in Attachment A.
The PAM should not be used to replace detailed analysis of option portfolios or to underpin business case proposals. It is only intended as a high level assessment method to aid shortlisting.
1.2 Intended users of the PAM The PAM is designed for use by stakeholder groups developing an IWM strategy for:
- A major growth area (typically comprising new developments that will add >5000 new homes, and are of a scale to significantly influence regional water management decisions)
- A servicing region for a water authority, incorporating significant future growth or change which will require changes in regional water management arrangements.

Preliminary Assessment Method (PAM) for Integrated Water Management Strategies Final Report
4
As an IWM strategy considers the whole water cycle, the stakeholder group is likely to include representatives responsible for:
- Water supply - Wastewater management - Stormwater management - Groundwater management - Rural water - Waterway health - Coastal management (as applicable) - Land use and development planning - Recreation and amenity - Environmental enhancement
The stakeholder group may undertake an IWM strategy to decide on the servicing strategy for major new development areas or for future planning of a region. An IWM strategy will often complement existing investigations into specific water supply, sewerage and stormwater management along with environmental and catchment management strategies.

Preliminary Assessment Method (PAM) for Integrated Water Management Strategies Final Report
5
1.3 Structure of this document Following this introductory chapter, the three remaining chapters of this document provide guidance on how to conduct a preliminary assessment. Chapter 2 outlines the preparation work which should be completed in advance of the preliminary assessment, while Chapters 3 and 4 discuss the two core stages of the PAM; assessment of a long list of options, and shortlisting of portfolios (see 1.5 for definitions of options and portfolios). Figure 1 outlines the structure of the document.
Figure 1: Structure of the document

Preliminary Assessment Method (PAM) for Integrated Water Management Strategies Final Report
6
1.4 Reference methodologies for IWM strategies The PAM provides supplementary guidance on one part of the development of a typical IWM strategy. The PAM should be read in conjunction with guidance on the full IWM strategy development process. Reference methodologies for the IWM strategy development process include:
• DELWP (2015) Draft investment lifecycle guidelines – water supplement. Available from DELWP.
• DELWP (2014) Developing Integrated Water Management Plans: a process for analysis (Unpublished).
• Water Research Foundation and Commonwealth Scientific and Industrial Research Organisation (CSIRO) (2010) Integrated Urban Water Management Planning Manual. Available: https://publications.csiro.au/rpr/download?pid=csiro:EP10449&dsid=DS1
At development planning scale, where the regional approach to integrated water management has been determined, a useful reference for the assessment of integrated water management opportunities is:
• Barwon Region Integrated Water Cycle Management Network (2013) Urban Water Cycle Planning Guide. Available: www.urbanwaterplanner.com.au
For the benefit of clarity, Figure 2 shows a simplified methodology for the development of an IWM strategy based on the existing guidance. The PAM can form a part of the overall process – the two stages in green boxes. However, in order for the PAM to be effective, the preparatory steps conducted before the shortlisting stage should have a certain amount of detail and focus. The grey steps with a green outline are preparatory tasks, which aren’t specifically included in the PAM, but which affect its successful use. For these tasks commentary is provided in this document to ensure these steps are completed with adequate rigour to ensure the PAM is successful. The steps in the grey boxes are not covered by this document and should be completed utilising guidance supplied in the reference methodologies.

Preliminary Assessment Method (PAM) for Integrated Water Management Strategies Final Report
7
Figure 2: Simplified reference methodology for the development of an IWM strategy showing the position of the PAM in the overall tasks (green boxes) and those tasks interacting with the PAM (green outline). The chapters of this document which provide guidance on these steps are also indicated. The grey boxes indicate steps in the IWM strategy development process which are not part of the PAM.

Preliminary Assessment Method (PAM) for Integrated Water Management Strategies Final Report
8
1.5 Terminology and definitions Criteria: is an assessed variable that must be achieved to a set standard of an indicator.
Indicator: is used to assess outcomes of an Integrated Water Management objective.
Integrated Water Management (IWM): is the sustainable management of all water sources (potable water, wastewater, rainwater, stormwater and groundwater) so that water is used optimally to deliver multiple beneficial outcomes. It applies to all scales of development.
Objective: is a broad outcome that Integrated Water Management aims to achieve through coordinated planning and design.
Option: infrastructure components that supplies and/or disposes of a water resource.

Preliminary Assessment Method (PAM) for Integrated Water Management Strategies Final Report
9
Portfolio: a complete combination of water servicing infrastructure options that addresses the water cycle as a whole.
Stakeholder group: are the representatives with the appropriate level of expertise and/or authority from organisations/companies and government departments that will be impacted by the costs or benefits associated with the design, delivery or operational phases of water servicing infrastructure solutions included in the Integrated Water Management strategy.

Preliminary Assessment Method (PAM) for Integrated Water Management Strategies Final Report
10
- - - - - - - - - - - - - - - - - - - - - - - - - - - - - - - - - - - - - - - - - - - - - - - - - - - - - - - - - - - -
2. Preparation - - - - - - - - - - - - - - - - - - - - - - - - - - - - - - - - - - - - - - - - - - - - - - - - - - - - - - - - - - - -
The reference methodologies listed in section 1.3 each include an initial stage of investigation whereby:
• The local context is reviewed;
• Objectives are created for the IWM strategy; and
• Possible IWM options are identified. While these steps occur before a PAM is applied, ensuring that these preparatory steps are completed in enough detail is crucial to the success of the preliminary assessment method. Having a clear understanding of the drivers for IWM and the possibilities will ensure that the right options area being assessed for the right reasons in the PAM. The following sections provide additional guidance on how the preliminary steps of an IWM strategy should be undertaken.
2.1 Review water cycle context An integrated water management strategy requires an understanding of the whole water cycle. Often this will require a range of partners coming together to contribute contextual information. Information on some parts of the water cycle may be unavailable or unclear, requiring supplementary investigation before the IWM investigation can start in earnest.
The review of previous IWM strategies in Attachment A highlighted that the receiving environment context is one area which is often poorly understood. There may be an environmental risk to the receiving environment but it is important to understand whether this is due to water quality, quantity, flow timing or a combination of these.
Preparation – Task overview 1. Review water cycle context 2. Set objectives 3. Identify base case and possible options
• Complete a high level water and pollutant balance • Create and review long list of options

Preliminary Assessment Method (PAM) for Integrated Water Management Strategies Final Report
11
Table B1 in Attachment B sets out a set of questions that should be answered as part of a review of context. The questions cover key considerations that are needed to set effective objectives and to complete a preliminary assessment of options. The questions should be answered with both the current situation and possible future situations in mind.
2.2 Identify objectives The stakeholder group should agree on a set of objectives for the IWM strategy to achieve. These should respond to issues and opportunities identified in the review of context.
The review of previous IWM strategies in Victoria (Attachment A) identified three common themes for objectives:
1. Provide secure and sustainable water services 2. Protect and enhance health of receiving environments 3. Support liveability of the places we live and work
These three themes should be used as a starting point for IWM strategies unless local context requires additional themes to be considered. Considerations which are also central to IWM, and which are inherently included within the assessment of options and portfolios within the reference methodologies are cost-efficiency and public health protection. Cost-efficiency and effectiveness is assessed through the cost-benefit analysis of portfolios, while protection of public health is a requirement for design and operation to meet Department of Health and EPA regulations and guidelines.
Under each theme, a set of objectives should be developed which are specific to context. Each objective should be measureable, and where it is not quantifiable in physical terms, a way in which performance may be scored or differentiated should be determined by the stakeholder group.
Objectives can be set as ‘criteria’ whereby a minimum required level of service is set for an objective, e.g. a 20% reduction in potable water use. Creating criteria can be useful in compiling and assessing portfolios in Stage 3, but is not recommended this early in the process. An exception to this is where certain criteria are required by regulation or supported by strong contextual evidence – then it is beneficial to state criteria at this stage. Otherwise, it can be beneficial to introduce criteria at a later stage once the likely performance of options is better understood.
Figure 3 includes some example types of objectives used by previous IWM studies under the three common themes.

Preliminary Assessment Method (PAM) for Integrated Water Management Strategies Final Report
12
1. Provide secure and sustainable water services
2. Protect and enhance health of receiving environments
3. Support liveability of the places we live and work
• Reduce potable water consumption
• Increase available water supplies
• Reduce GHG emissions associated with water services
• Reduce flood risk
• Reduce wastewater discharge to the environment
• Improve wastewater discharge quality
• Reduce stormwater discharge to the environment
• Improve stormwater discharge quality
• Increase environmental flows contribution in regional areas
• Increase local infiltration and soil moisture
• Increase water availability for recreational and cultural purposes
• Enhance amenity and microclimate through introduction of natural features
• Minimise impact of water management assets on land value (visual, odour)
Figure 3: Three themes and example objectives used in previous IWM studies
The stakeholder group should also agree on the core purpose of IWM strategy at this point. The review of previous IWM strategies in Victoria (Attachment A) identified that a clear purpose of either ‘optimisation’ (seeking most cost-effective solution) or ‘exploration’ (testing boundaries) of objectives will help define the portfolios developed in subsequent stages of the PAM. This becomes very important in shortlisting portfolios (see chapter 4).

Preliminary Assessment Method (PAM) for Integrated Water Management Strategies Final Report
13
2.3 Identify base case and possible options In identifying alternative options to the base case, it is suggested that two steps are completed to assist in identification of all options:
• Create a high level water and pollutant balance (using the reference tables provided here as needed). This water balance will also be needed in the assessment process.
• Review the long list of typical options provided here.
2.3.1 High level water and pollutant balance
To assist in the identification and assessment of options a high level water and pollutant balance needs to be calculated. The balance considers the water cycle for the study area. In order to identify possible water sources, demands and management options, an understanding of the total volume of stormwater and wastewater generated is important. In addition, stormwater generation of different surface types should be calculated so that the potential for roof runoff harvesting can be identified.
The water and pollutant balance should identify:
Alternative Sources1 Water demands
• Amount of excess or available stormwater (including roofwater as a delineated component). Pollutant content should also be identified.
• Amount of excess or available wastewater. Pollutant content (post treatment) should also be identified.
• residential non-potable demands
• residential potable demands
• irrigation of Public Open Spaces including active open spaces (e.g. ovals and other sporting fields) and passively used spaces (where applicable)
• environmental needs
• cultural flows
• peri urban agribusiness
• other location specific demands (e.g. industrial demands).
1 Other water sources, such as groundwater, may be applicable as water resources to be evaluated to supplement future use in some areas. Generally the ‘base case’ will utilise existing potable supplies from river diversions, groundwater or desalination – options explore ‘alternatives’ to the extension of the base case supplies which may have substantial environmental or cost impacts or have restricted availability.

Preliminary Assessment Method (PAM) for Integrated Water Management Strategies Final Report
14
Tables B2 to Table B7 in Attachment B provide a series of quick references to estimate high level water balance and pollutant balance inputs. These should not be used to replace more detailed modelling required to accurately calculate benefits and costs during latter stages of IWM planning.
2.3.2 Review and create long list of options
The stakeholder group should agree on the long list of options. These should be considered using the four dimensions of IWM provided in Figure 4. General agreement of place making attributes for the study area should be gleaned from the stakeholder group as desirable outcomes may determine the extent to which vegetated or non-vegetated systems are considered further.
All sources of water, including potable (PO), rainwater, also referred to as roof water (RW) and stormwater (SW), treated wastewater (WW), groundwater (GW) or a shandied supply of stormwater and treated wastewater (SW+WW) may be available to supply a range of end use demands (urban, agricultural, environmental and cultural). The scale at which the source is intercepted may vary, often depending on the demand. At the regional scale, options may exist both within, and beyond, the boundary of a study area. Options also exist at the precinct, streetscape and lot scales. A summary of the typical long list of options are provided in Table B8 (see Attachment B). These can be added to if other options can be identified locally.
Each option should be considered in the local context and discard the options which are not possible or will not achieve objectives. It may be useful to track comments as to why particular options are removed at this stage.
Reference methodologies for the IWM strategy development process suggest at this point the stakeholder group should agree on the base case for the study. In most cases the base case includes conventional centralised supply and sewerage infrastructure and therefore these options are not included in the long list of options provided in Table B8.

Preliminary Assessment Method (PAM) for Integrated Water Management Strategies Final Report
15
Figure 4:
Dimensions of IWM There will be contextual factors which lead to the inclusion of specific additional options that may include a unique local demand, or an additional source type. The long list is not intended to be exhaustive, but is helpful to review to ensure all typical types of water management and all scales are considered.
Refining the general options listed in Table B8, the stakeholder group should consider available storage and transfer options available as these may have significant cost implications. Storages manage the mismatch between the supply and demands of alternative water supplies. Tanks, open water bodies or an underlying aquifer may be available for use. In some areas dis-used assets could be considered. The preferred storage arrangements depend on the timing and volumes of supply available and the demand characteristics of the end use. Storage includes the following:
Tanks
Tanks provide storage for decentralized supply options. The size of the tank and catchment area determine the reliability of supply to meet end use demands. Tanks can be located above ground or underground, providing more flexibility for situations

Preliminary Assessment Method (PAM) for Integrated Water Management Strategies Final Report
16
where land availability is low (though more expensive than open water storages). For large stormwater harvesting projects, tank storage volume is often the limiting factor in reliability of supply.
Open water bodies
Existing or new open water bodies are potential storage opportunities. The active storage volume should be calculated by the surface area of the water body and the allowable draw down depth. Storage in open water bodies has a number of challenges including loss of supply volume due to evaporative losses and risks (to the supply quality) from algal blooms. Construction of large new storages is a significant cost if it is not part of the base case.
Aquifers
Aquifer storage and recovery (ASR) introduces treated wastewater, rainwater or stormwater into underground aquifers for storage. When large volumes of water are available, ASR can be a low cost storage opportunity.
Preparation – Key outputs • Context review including completion of Table B1 • Agreed objectives • Agreed base case • Water and pollutant balance (using Tables B2 – B7) • Long list of options (using Table B8 as reference)

Preliminary Assessment Method (PAM) for Integrated Water Management Strategies Final Report
17
- - - - - - - - - - - - - - - - - - - - - - - - - - - - - - - - - - - - - - - - - - - - - - - - - - - - - - - - - - - -
3. Assessment of Options - - - - - - - - - - - - - - - - - - - - - - - - - - - - - - - - - - - - - - - - - - - - - - - - - - - - - - - - - - - -
The following sections outline the key tasks in conducting a preliminary assessment of options. The aim of the preliminary assessment is to pre-empt the likely results of the full cost-benefit analysis by considering the relative scale of benefits, costs and risks of options available. By assessing the individual options in the long-list we can rapidly gain an insight into their relative performance, before options are assembled into portfolios for further assessment.
3.1 Assess scale of benefits The first stage of the preliminary assessment involves assessing the benefits that each of the long list of options could deliver. The benefits that we want to assess are likely to be closely related to the objectives identified in Stage 1, but also may include key elements which will be assessed through the detailed cost benefit analysis which is conducted after the PAM.
3.1.1 Select benefits to be assessed
The first stage of the assessment of benefits is selecting the benefits which should and can be assessed at this stage. Table B9 in Attachment B indicates typical benefits which are likely to be broadly quantifiable at the PAM stage, with those shaded in blue
Assessment of Options – Task overview 1. Assess scale of benefits
• Select benefits to be assessed • Set thresholds for benefit analysis • Review performance bands • Complete a comparison matrix of option benefits
2. Review key cost factors • Review factors that may offer cost advantages or
disadvantages • Add cost factor assessment to comparison matrix
3. Risk review • Note key risks on comparison matrix
4. Finalise comparison matrix

Preliminary Assessment Method (PAM) for Integrated Water Management Strategies Final Report
18
being benefits which are likely to have a substantial effect on the overall cost-benefit in most cases. It is recommended that all blue shaded benefits in Table B9 are assessed within the PAM, along with any other key benefits identified by the stakeholder group which are relevant to the objectives, and estimable without a detailed analysis. In selecting benefits to assess, these should be minimised to the essential representative objectives as far as possible. Effort should also be made to avoid double counting in the assessment. A simple way to do this is to check the method through which each benefit is assessed – if the same method and data is used to assess two benefits, these can be rationalised to one.
Table B9 also indicates information which should be available at this stage and can be used in the assessment of key benefits.
3.1.2 Set thresholds for benefit analysis
Once the key benefits have been selected against which the long list of options will be assessed, the stakeholder group should specify assessment thresholds. The preliminary comparison matrix (explained in section 3.3) utilises an assessment of the ability of each option to deliver each key benefit on a traffic light scale:
Table 1: Typical benefits relevant to IWM studies and suggested methods to quantify or assess those benefits
Traffic light performance categories reflecting the scale of benefit relative to base case
High benefit
Mid benefit
Low benefit (or similar to base case)
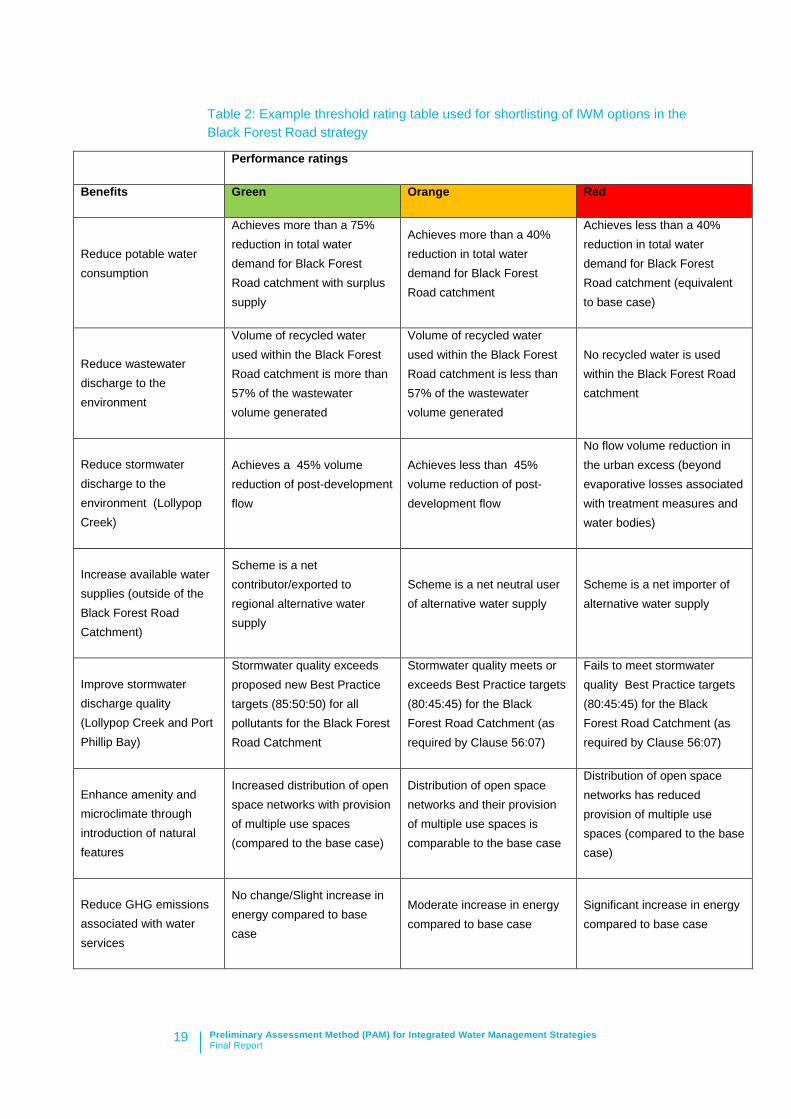
To assess the performance of options against each benefit on a fair and transparent basis, the stakeholder group should agree on both the assessment method (suggested for each criteria above) and the comparison thresholds which determine the performance category that is allocated.
A table similar to the example below should be developed and agreed by the stakeholder group which specifies the performance thresholds that will be used. The performance bands (see following section) can be used to inform suitable thresholds.
Preliminary Assessment Method (PAM) for Integrated Water Management Strategies Final Report
19
Table 2: Example threshold rating table used for shortlisting of IWM options in the Black Forest Road strategy
Performance ratings
Benefits Green Orange Red
Reduce potable water consumption
Achieves more than a 75% reduction in total water demand for Black Forest Road catchment with surplus supply
Achieves more than a 40% reduction in total water demand for Black Forest Road catchment
Achieves less than a 40% reduction in total water demand for Black Forest Road catchment (equivalent to base case)
Reduce wastewater discharge to the environment
Volume of recycled water used within the Black Forest Road catchment is more than 57% of the wastewater volume generated
Volume of recycled water used within the Black Forest Road catchment is less than 57% of the wastewater volume generated
No recycled water is used within the Black Forest Road catchment
Reduce stormwater discharge to the environment (Lollypop Creek)
Achieves a 45% volume reduction of post-development flow
Achieves less than 45% volume reduction of post-development flow
No flow volume reduction in the urban excess (beyond evaporative losses associated with treatment measures and water bodies)
Increase available water supplies (outside of the Black Forest Road Catchment)
Scheme is a net contributor/exported to regional alternative water supply
Scheme is a net neutral user of alternative water supply
Scheme is a net importer of alternative water supply
Improve stormwater discharge quality (Lollypop Creek and Port Phillip Bay)
Stormwater quality exceeds proposed new Best Practice targets (85:50:50) for all pollutants for the Black Forest Road Catchment
Stormwater quality meets or exceeds Best Practice targets (80:45:45) for the Black Forest Road Catchment (as required by Clause 56:07)
Fails to meet stormwater quality Best Practice targets (80:45:45) for the Black Forest Road Catchment (as required by Clause 56:07)
Enhance amenity and microclimate through introduction of natural features
Increased distribution of open space networks with provision of multiple use spaces (compared to the base case)
Distribution of open space networks and their provision of multiple use spaces is comparable to the base case
Distribution of open space networks has reduced provision of multiple use spaces (compared to the base case)
Reduce GHG emissions associated with water services
No change/Slight increase in energy compared to base case
Moderate increase in energy compared to base case
Significant increase in energy compared to base case

Preliminary Assessment Method (PAM) for Integrated Water Management Strategies Final Report
20
3.1.3 Review performance bands
IWM strategies which have previously been completed in Victoria have been reviewed to compile performance results of options in delivering a range of benefits. Contextual factors and design assumptions will lead to variations in performance, however some general relativities in performance can be drawn from the performance bands. These can be used alongside the water and pollutant balance for the area to estimate the likely scale of performance of options.
The performance bands provided in Table B10 to Table B13 in Attachment B include:
A. % potable water use reduction relative to the overall consumption of urban development
B. GHG emission factors of increase or decrease relative to conventional water and sewerage services (considering total GHG emissions across entire service area, i.e. including Melbourne Water and local retailer energy use)
C. % wastewater discharge reduction from urban development D. % stormwater discharge reduction from urban development
3.1.4 Complete a comparison matrix of option benefits
Use the agreed traffic light thresholds and the information drawn from the assessment to create a matrix of long-listed options and benefits, as shown in Table 3, below. Where possible, it is useful to quantify the anticipated benefits of the options, at least broadly. However, not all benefits will be quantifiable. The relative assessment of options should be possible by either (in order of preference):
• drawing from existing site specific studies;
• making a rapid quantification of likely benefit using data from the water and pollutant balance;
• using the performance bands to estimate likely performance level; or
• agreeing relative performance based on stakeholder estimations.
Table 3: Example benefit matrix
Option (long list)
Benefit 1 Benefit 2 Benefit 3 Benefit 4 Benefit 5
1
2
3

Preliminary Assessment Method (PAM) for Integrated Water Management Strategies Final Report
21
3.2 Review key cost factors In comparison to the scale of benefits estimated in the previous step, it is important to establish a preliminary scale of costs to anticipate the relative cost-benefit of options. A comparison of cost and benefits will be conducted in more detail during the detailed analysis of portfolios (as a whole of life, total community cost-benefit), however this preliminary assessment aims to gain some insight into the cost effectiveness of options without undertaking a full costing exercise.
An integrated water management strategy considers whole of community costs and benefits. A distributional analysis is conducted during the detailed analysis phase to determine the costs and benefits to each stakeholder, and examines possible transfers between stakeholders or possible partnered funding. At this point in the analysis it is important not to dismiss options as they may have a high cost to one stakeholder – instead all options should be considered in the round.
3.2.1 Review factors that may offer cost advantages or disadvantages
Experience from previous IWM strategies suggests that several factors have an influence on whether the cost of IWM options is likely to be more or less favourable. The factors in Table B14 in Attachment B should be reviewed, and any advantages or disadvantages to the long-listed options should be noted. Table B14 highlights factors that directly influence the design and operation of the options, but also notes factors which are present in the base case which could be avoided through the delivery of some options, leading to an avoided cost.
3.2.2 Add cost factor assessment to comparison matrix
Cost advantages or disadvantages in the long list should be noted alongside the benefits in the comparison matrix. Note advantages with an ‘A’ and a short description, and disadvantages with a ‘D’ and short description.
3.3 Risk review Another aspect which should be considered and added as an annotation to the comparison matrix is any significant risks to the delivery of an option. These deliverability considerations are noted at this stage, so that risk management and contingency factors can be integrated into the portfolios during the detailed analysis.
3.3.1 Note key risks on comparison matrix
Make notes against the options where the following types of risks are present:
- Public health hazards

Preliminary Assessment Method (PAM) for Integrated Water Management Strategies Final Report
22
- Organisational capacity to deliver or manage - Regulatory inconsistencies - Approval requirements - Extended time of construction - Water quality - Public perception - Susceptibility to climate change - “Novel technology”
The deliverability and risk factors should not be used as a reason to eliminate options at this stage (as this can introduce bias against options which may represent a change from standard practice but which are not inherently flawed). Instead, risk management measures should be identified and incorporated into the options during portfolio selection (and may be represented as a cost or timing impact).
3.4 Finalise comparison matrix Bringing together the elements of the assessment which assesses the long list of options against:
- Benefits (traffic light rated) - Notes of cost advantages (A) and disadvantages (D) - Notes of possible risks
A worked example of application of the PAM is included in Attachment C.
Table 4: Example final comparison matrix
Option Benefit 1 Benefit 2 Benefit 3 Cost factors Risks
1 A – low density development
D – sodic soils
Organisational capacity
2 A – storage available
A – high open space
Regulatory inconsistency
…. …. …. …. …. ….
At this point it is important to be aware of the scale of influence of options. Some options may show a low performance, but their performance could be enhanced if they were:

Preliminary Assessment Method (PAM) for Integrated Water Management Strategies Final Report
23
• Increased in scale or application (e.g. greater areas of open space could be irrigated), or
• Combined with other complimentary options that manage the same water stream (e.g. rainwater tanks on-lot could be combined with stormwater treatment within streets to have a greater effect on a precinct).
Before the comparison matrix is finalised, combinations of options that manage the same water stream (wastewater, stormwater etc.) should be identified and added to the matrix as new options.
It may be helpful to score options, but do not attempt to eliminate or rank options using the comparison matrix at this stage. The comparison matrix is a tool used in the portfolio selection process described in the next chapter.
Assessment of Options – Key outputs • Agreed key benefits for assessment (using Table B9) • Agreed thresholds for benefit assessment • Review of cost factors (using Table B14) • Comparison matrix with assessment of options for:
• Benefits (using Tables B10-B13 and water balance) • Cost advantages and disadvantages • Risks

Preliminary Assessment Method (PAM) for Integrated Water Management Strategies Final Report
24
- - - - - - - - - - - - - - - - - - - - - - - - - - - - - - - - - - - - - - - - - - - - - - - - - - - - - - - - - - - -
4. Shortlisting of Portfolios - - - - - - - - - - - - - - - - - - - - - - - - - - - - - - - - - - - - - - - - - - - - - - - - - - - - - - - - - - - -
At this stage we have considered individual options in the long-list. As described in section 1.4, a portfolio is a collection of options, and addresses the water cycle as a whole. Using the comparison matrix, the final phase in the PAM is to assemble a shortlist of portfolios for detailed analysis.
4.1 Select method of portfolio shortlisting There are two broad methods for portfolio shortlisting: optimisation or theming. The appropriate method depends on the purpose of the IWM strategy, which would have been discussed during the initial phases of the project, and should be revisited here.
Some IWM strategies will wish to determine the most cost-efficient solution to deliver defined levels of service for the area. For these strategies, the optimisation method is most appropriate.
Other IWM strategies are more exploratory and wish to test aspirational levels of service or explore technical and delivery limitations. For these strategies, the theming method is most appropriate.
In some cases, multiple rounds of shortlisting could be completed in which both the ‘theming’ and the ‘optimisation’ methods are used in sequence. Often a theming shortlisting would be followed by an optimisation shortlisting.
Shortlisting of Portfolios – Task overview 1. Select method of portfolio shortlisting
• Shortlisting portfolios using the ‘optimisation’ method • Shortlisting portfolios using the ‘theming’ method
2. Review complementary tools • Review hierarchy of use • Review benchmark costs
3. Shortlist portfolios

Preliminary Assessment Method (PAM) for Integrated Water Management Strategies Final Report
25
4.1.1 Shortlisting portfolios using the ‘optimisation’ method
Using this method, the comparison matrix constructed in the last phase is used to anticipate the portfolios which will deliver the best cost-benefit for the objectives of the project.
Firstly, by considering the number and scale of benefits and the possible cost factors achieved by options, select a set of ‘core’ options which are likely to perform well on a cost-benefit basis. These core options may not achieve all objectives by themselves, but could be complemented by other options to ‘round out’ the portfolio. Around each core option, a single portfolio or several portfolios may be created for assessment.
During the shortlisting process, the group may decide to specify minimum levels of service for the portfolios to meet. This effectively requires a portfolio to include achievement of benefits to a certain level. For example, a minimum flow reduction or amenity requirement could be required and judged using the comparison matrix. It may be useful to develop a comparison matrix of portfolios here by combining results from the individual options across water streams to gain greater achievement across the range of benefits desired. When combining options, be conscious of increasing costs as multiple options are combined – especially where separate delivery mechanisms are required for each.
4.1.2 Shortlisting portfolios using the ‘theming’ method
Where the group wishes to maximise achievement of objectives and test the boundaries of possibility (e.g. what would it take to preserve on-site waterways in their natural condition? Is it possible to achieve water neutrality or 100% potable demand reduction?), then theming can be used to assemble portfolios. Theming can help to develop a narrative to support portfolios, which can be an effective strategy for stakeholder engagement.
Theming seeks to increase performance for one theme, which may be an objective or group of objectives. Example themes could include:
- High environmental outcomes - High liveability outcomes - High water services outcomes - Low risk solutions
A variant to this approach could also be ‘book-ending’ where an aspect is maximised and minimised to understand the range of solutions and relative cost-benefit. However, caution is recommended with this approach, as book ends can often represent worst value scenarios, where options are pushed beyond their optimal performance with diminishing returns.

Preliminary Assessment Method (PAM) for Integrated Water Management Strategies Final Report
26
Figure 4 below shows how options may be ‘skewed’ towards a certain outcome to allow exploration in that area, and comparison against a focus on other outcomes.
Figure 4: Example of outcome performance distribution of ‘themed’ portfolios
4.2 Review complementary tools To compliment either method, additional references are included here which may help the stakeholder group to prioritise:
- Hierarchy of use: Which can inform preferences of water sources for uses on a fit for purpose basis.
- Benchmark costings: Which may allow the group to ascertain the likely scale of costs for comparative options with similar benefits, therefore helping to prioritise selection.
4.2.1 Review hierarchy of use
A hierarchy of use can be used as an additional tool to assist in portfolio compilation. Table B15 in Attachment B outlines the ideal sources of water for various uses on a fit for purpose basis. The hierarchy does not account for cost implications which should be judged separately.
Preliminary Assessment Method (PAM) for Integrated Water Management Strategies Final Report
27
4.2.2 Review benchmark costs
If the stakeholder group feels it is unable to adequately judge the relative cost of options in order to select portfolios, it may be useful to refer to the following document which provides benchmark costs for key infrastructure components drawn from previously completed IWM strategies:
• DELWP (2015) Peer review report on the assumptions of the integrated water management study for:
o Water Future Central – Options Development and Analysis o Sunbury Growth Area - Integrated Water Management Analysis o East Werribee Employment Precinct - Integrated Water Management
Servicing Strategy o Northern Growth Corridor – Integrated Water Management Study o Melton & Wyndham North Growth Area – Integrated Water
Management Study
4.3 Shortlist portfolios Drawing on the comparison matrix and any complementary tools, use the preferred shortlisting method to create a shortlist of portfolios. The shortlisting process should be conducted by the stakeholder group and agreed. When options are grouped into a portfolio, be aware that benefits and costs can change due to the presence of:
- shared infrastructure (resulting in a cost advantage) - competition for existing infrastructure (resulting in new storages or
transfers being required for construction) - competition for demands or end-uses (resulting in the need for water
sources to be prioritised) – the review of the hierarchy of use in the section below can assist in prioritisation.
The number of portfolios selected for detailed analysis will depend on the time and budget available, however as a general guide, 4-6 portfolios is considered an appropriate number. The reasons for selection of the shortlisted portfolios should be documented for transparency and future reference.
Keep in mind that this is unlikely to be the last time you refer to the comparison matrix. As the study progresses through the detailed analysis, it is likely that the group will learn more about portfolio performance, and it may become clear that parts of the portfolio need to be adjusted, with new options introduced. The PAM should be used to assist in this iterative process of refining and evolving portfolios.

Preliminary Assessment Method (PAM) for Integrated Water Management Strategies Final Report
28
A worked example of the whole PAM process is included in Attachment C.
Shortlisting of Portfolios – Key outputs • Agreed method of portfolio shortlisting
• Comparison matrix with assessment of portfolios (as needed)
• Identification of shortlisted portfolios (using Table B15 and benchmark costs)

Preliminary Assessment Method (PAM) for Integrated Water Management Strategies Final Report
29
- - - - - - - - - - - - - - - - - - - - - - - - - - - - - - - - - - - - - - - - - - - - - - - - - - - - - - - - - - - -
Attachment A – Review of case study IWM strategies - - - - - - - - - - - - - - - - - - - - - - - - - - - - - - - - - - - - - - - - - - - - - - - - - - - - - - - - - - - -

Preliminary Assessment Method (PAM) for Integrated Water Management Strategies Final Report
30
Integrated Water Management Case Study Review
The PAM aims to provide industry with a consistent approach to the identification of Integrated Water Management (IWM) options and guidance on the shortlisting of options. This review considers a number of IWM case studies and to understand the approach adopted by others and to draw on their key learnings to inform the development of the PAM.
Review of case studies and existing tools Industry tools and 8 IWM studies are reviewed in this discussion paper. The review involved gaining insights from relevant reports and a follow up phone conversation with key stakeholders involved in each study. A summary of the case studies is provided in Table 1.
The questions the review sought to answer are:
1. What key drivers and desired outcomes (objectives) were identified?
2. What options were identified?
3. How were these options shortlisted?
4. What processes were used in shortlisting (e.g. workshopping, rapid analysis, judgement)?
5. What indicators were useful in the shortlisting process and how did these relate to the key objectives and/or desired outcomes? Were these qualitative or quantitative?
6. What metrics or thresholds were used to score or distinguish between options?
7. Did multiple rounds of shortlisting occur?
8. What barriers and risks were identified? Were these perceived or validated?
9. Was information discovered during analysis that may have altered the initial shortlisting decisions?
10. What timeframe was the shortlisting conducted in?
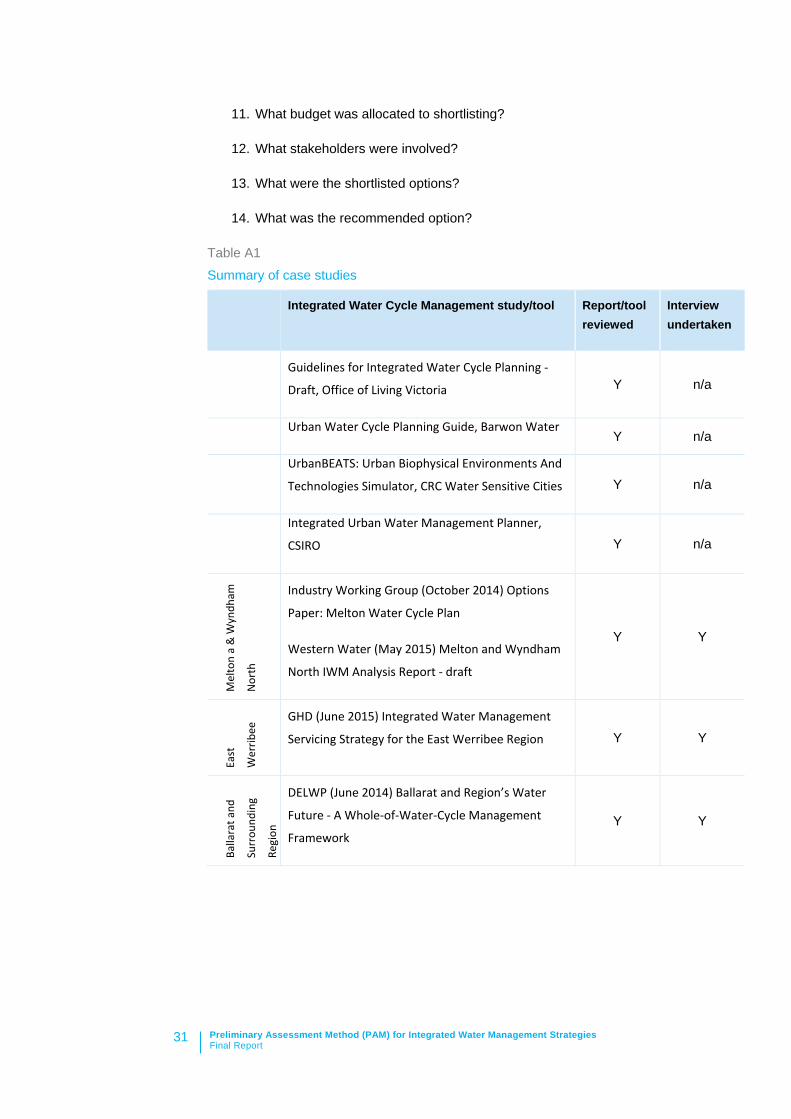
Preliminary Assessment Method (PAM) for Integrated Water Management Strategies Final Report
31
11. What budget was allocated to shortlisting?
12. What stakeholders were involved?
13. What were the shortlisted options?
14. What was the recommended option?
Table A1
Summary of case studies
Integrated Water Cycle Management study/tool Report/tool reviewed
Interview undertaken
Guidelines for Integrated Water Cycle Planning -
Draft, Office of Living Victoria Y n/a
Urban Water Cycle Planning Guide, Barwon Water Y n/a
UrbanBEATS: Urban Biophysical Environments And
Technologies Simulator, CRC Water Sensitive Cities Y n/a
Integrated Urban Water Management Planner,
CSIRO Y n/a
Mel
ton
a &
Wyn
dham
Nor
th
Industry Working Group (October 2014) Options
Paper: Melton Water Cycle Plan
Western Water (May 2015) Melton and Wyndham
North IWM Analysis Report - draft
Y Y
East
Wer
ribee
GHD (June 2015) Integrated Water Management
Servicing Strategy for the East Werribee Region Y Y
Balla
rat a
nd
Surr
ound
ing
Regi
on
DELWP (June 2014) Ballarat and Region’s Water
Future - A Whole-of-Water-Cycle Management
Framework Y Y
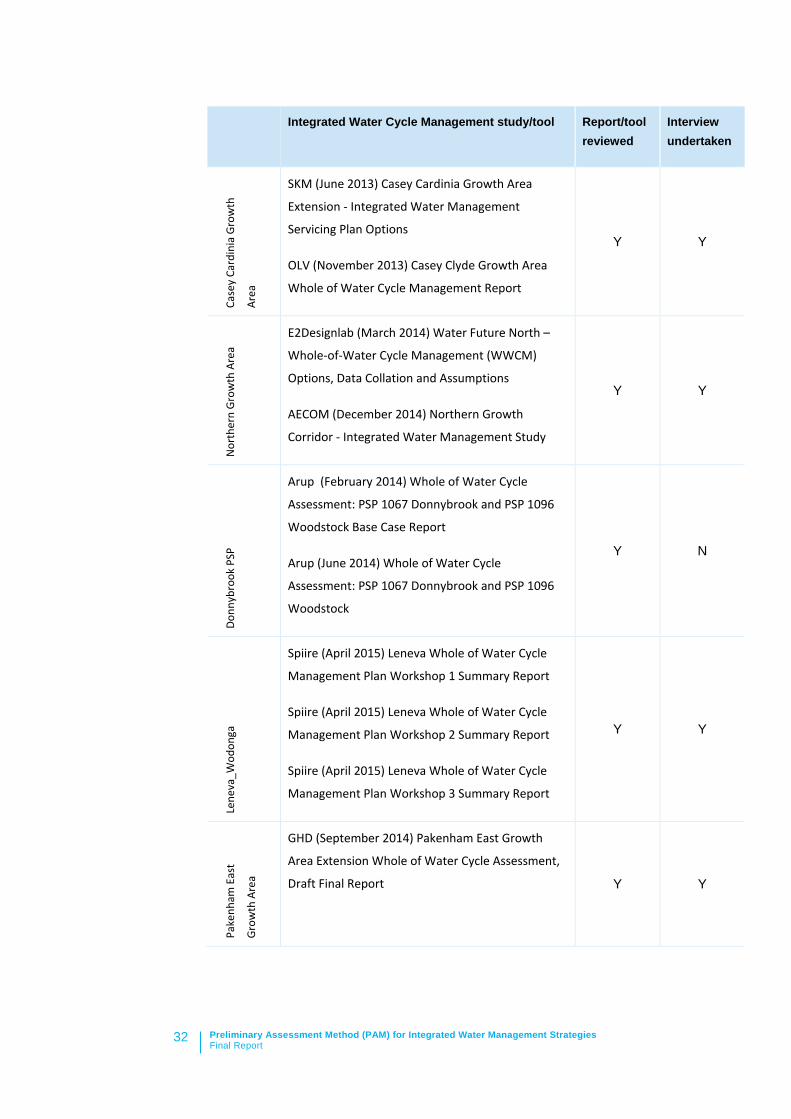
Preliminary Assessment Method (PAM) for Integrated Water Management Strategies Final Report
32
Integrated Water Cycle Management study/tool Report/tool reviewed
Interview undertaken
Case
y Ca
rdin
ia G
row
th
Area
SKM (June 2013) Casey Cardinia Growth Area
Extension - Integrated Water Management
Servicing Plan Options
OLV (November 2013) Casey Clyde Growth Area
Whole of Water Cycle Management Report
Y Y N
orth
ern
Gro
wth
Are
a
E2Designlab (March 2014) Water Future North –
Whole-of-Water Cycle Management (WWCM)
Options, Data Collation and Assumptions
AECOM (December 2014) Northern Growth
Corridor - Integrated Water Management Study
Y Y
Donn
ybro
ok P
SP
Arup (February 2014) Whole of Water Cycle
Assessment: PSP 1067 Donnybrook and PSP 1096
Woodstock Base Case Report
Arup (June 2014) Whole of Water Cycle
Assessment: PSP 1067 Donnybrook and PSP 1096
Woodstock
Y N
Lene
va_W
odon
ga
Spiire (April 2015) Leneva Whole of Water Cycle
Management Plan Workshop 1 Summary Report
Spiire (April 2015) Leneva Whole of Water Cycle
Management Plan Workshop 2 Summary Report
Spiire (April 2015) Leneva Whole of Water Cycle
Management Plan Workshop 3 Summary Report
Y Y
Pake
nham
Eas
t
Gro
wth
Are
a
GHD (September 2014) Pakenham East Growth
Area Extension Whole of Water Cycle Assessment,
Draft Final Report
Y Y

Preliminary Assessment Method (PAM) for Integrated Water Management Strategies Final Report
33
Review of existing industry guidelines and tools Integrated Water Cycle Management Project Assessment Guidelines, Office of Living Victoria
In 2013 the Office of Living Victoria released draft Integrated Water Cycle Management Project Assessment Guidelines (July 2013). This document provides industry guidance for establishing project objectives, establishing a project base case (business as usual) and undertaking detailed cost benefit analysis. They fall short on providing guidance on how to identify a long list of options as well as how to undertake a short listing process to identify priority options to take forward to detailed analysis.
Urban Water Cycle Planning Guide, Barwon Region IWCM Network
The Urban Water Cycle Planning Guide released by the Department of Land, Environment, Water and Planning, and Barwon Water establishes an excellent step by step process to define objectives and identify options. Infrastructure options are identified by project stakeholders under seven ‘aspects’ of IWCM including waterways and flood plains, major drainage, land use and public open space, WSUD, drinking water, sewerage, alternative water. The screening of options is based on expert judgement to assess if an option can achieve the stated project objectives. Further screening is undertaken using a series of ‘deal breakers’ to determine if an option is socially, environmentally, or economically unacceptable, and politically or strategically aligned. A traffic light approach rates options against these deal breakers, indicating whether the impact occurs ‘occasionally’, ‘sometimes’, or ‘mostly’. If options can achieve the stated objectives or rate poorly on the deal breakers then the option is excluded from further consideration or revised and reconsidered.
The framework does not include storage opportunities such as existing disused infrastructure, an aquifer or new storage requirements as part of evaluating alterative water options. Storage availability significantly influences the cost of stormwater as an alternative water option and therefore the tool could be expanded to include consideration of storage for use in locations where stormwater for indirect potable supply or stormwater for dual pipe non-potable supply options are being considered.
The Guide enables stakeholders to identify four option combinations (option clusters) to deliver different development standards (defined as minimal standard that achieves minimum (regulatory) requirements; some level of innovation that achieves slightly better than minimum requirements; significant level of innovation that achieves much better than minimum requirements; and highest level of innovation that achieves best practice requirements). The process shortcuts the development of a long list of option clusters. It is anticipated that where regional infrastructure investment remains unclear (in situations where the source of drinking water supply and sewerage

Preliminary Assessment Method (PAM) for Integrated Water Management Strategies Final Report
34
treatment options are not predefined) then there remains no process beyond expert judgement to identify the short list of option clusters to move forward to detailed analysis.
UrbanBEATS, CRC for Water Sensitive Cities
The CRC for Water Sensitive Cities is developing UrbanBEATS (Urban Biophysical Environments And Technologies Simulator). The model enables the user to define the physical (topography, rainfall, etc.) and social (land use, density, demands, etc.) parameters and identifies all options and option clusters to achieve user defined objectives. It identifies a long list of stormwater management options and falls short of providing a process for short listing. Once the testing of the prototype is completed the model will provide a rigorous means of identifying options for stormwater management to incorporate into IWM projects.
Integrated Urban Water Management Planner, CSIRO and WRF
The Commonwealth Scientific and Industrial Research Organisation (CSIRO) and Water Research Foundation (WRF) developed a ‘how to’ manual for Integrated Water Management Planning. The planning process outlines three phases of iterative learning fed back into a series of activities that seek to increase the level of technical rigour and detail used in each iteration. The process outlines convening the stakeholder group and establishing the strategic direction for IUWM planning. This involves setting the objectives, measures and criteria for the project and understanding the current water management system. Alternative whole-of-water system portfolios are developed and analysed to quantify physical, social, economic and environmental performance.
The IUWM planner provides a robust guide to whole of system urban water planning and support multi-objective decision making, however it provides little guidance of how to short list the IUWM options or portfolios.
Review of case studies This section summarises the approach adopted for the 8 case studies identified in Table A1. It should be noted that:
- The reports provided for the Donnybrook PSP IWM study details the base case and the preferred servicing strategy but does not provide detail on all the options considered. An appropriate stakeholder to interview was not identified in the time available to conduct this study and therefore little information was gleaned to help inform the option identification and short listing process.

Preliminary Assessment Method (PAM) for Integrated Water Management Strategies Final Report
35
- Ballarat IWM plan is yet to be undertaken. The implementation plan provides useful information on defining the objectives for the region. The interview enabled documentation of the approach the stakeholders intend to use to identify options and subsequent shortlisting. These are captured in the following summary.
Project objectives and stakeholders
All studies clearly defined the IWM objectives for the project, with 5 out of the 8 case studies drawing on the Living Melbourne, Living Victoria, or subsequent subregional planning ‘water futures’ work (summarised in Table A2). This provided consistency across the objectives of the projects with all projects considering environmental (environmental health of urban waterways and bay), social (liveable and sustainable communities, and secure supplies) and economic (affordable essential water services) outcomes. However, the way in which IW
M options are assessed against objectives differs considerably (this is discussed in later sections of this document). Localised objectives were used in 3 of the studies
During the review it was clear that having appropriate representatives participating during stakeholder workshops is crucial to the efficient use of time and confidence in agreements made during the forums. It was also important the organisational representatives had an appropriate level of authority within their organisation to ensure barriers could be overcome or major changes were not required during the subsequent detailed analysis stages of the project (resulting in rework, time delays and variations).

Preliminary Assessment Method (PAM) for Integrated Water Management Strategies Final Report
36
Table A2
Defining Project Objectives
Defining study
objectives
Use or
refinement of
existing
objectives
Created
own
objectives
Source
Melton and Wyndham North
Living Melbourne – Water Futures West
East Werribee Local objectives established in consultation with project stakeholders
Ballarat and Surrounding Region
Local objectives established in consultation with community
Casey Cardinia Growth Area
Living Melbourne, Living Victoria Implementation Plan Objectives
Northern Growth Area Living Melbourne – Water Futures North
Donnybrook PSP Living Melbourne, Living Victoria Implementation Plan Objectives
Leneva_Wodonga Local objectives based on Council's visioning strategy for future urban growth
Pakenham East Growth Area
Living Melbourne, Living Victoria Implementation Plan Objectives
Identifying a long list of options
The filtering process of all options to determine viable option clusters was undertaken differently for each project. Some had a predetermined number of option clusters defined and therefore some options may have been excluded prematurely. Others started with all possible options available and then drew on the findings of previous work or project stakeholder expertise/knowledge to identify a long list of option

Preliminary Assessment Method (PAM) for Integrated Water Management Strategies Final Report
37
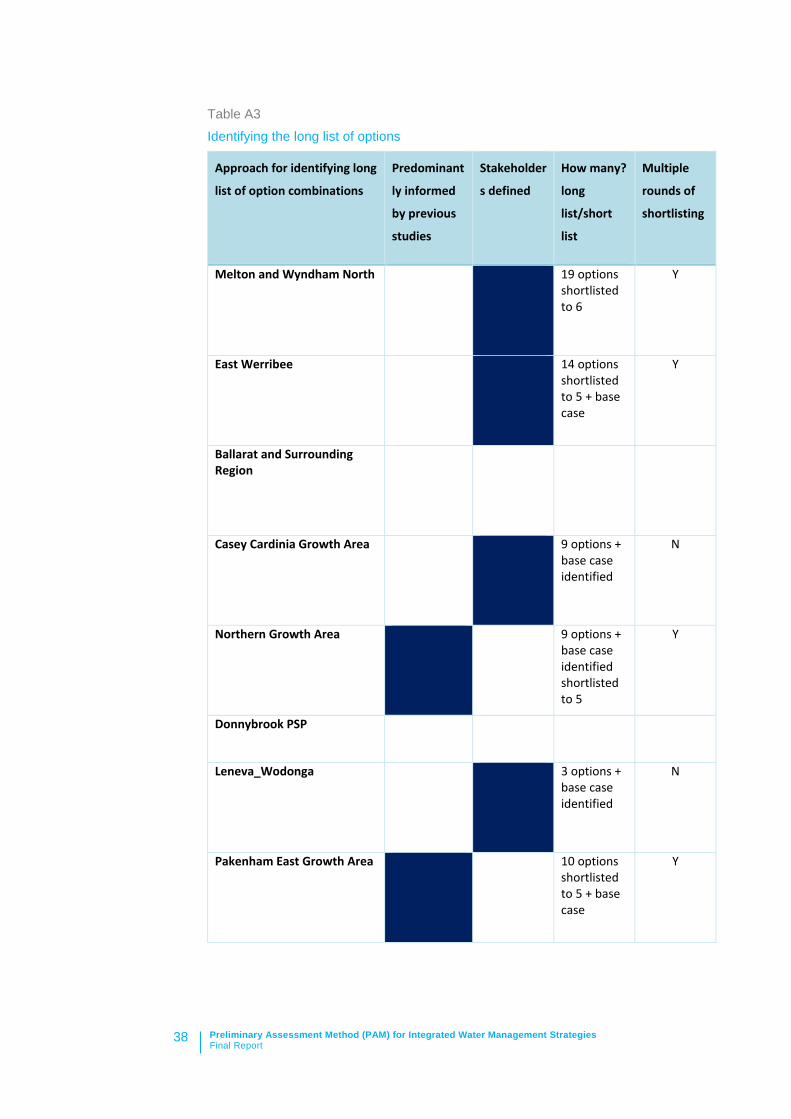
clusters; a summary of the primary approach used in each study is provided in Table A3.
Some studies went immediately to defining option clusters without predetermining the merit of each option and ended up with a long list that included many variations of a single option (for example, different end use demands for an alternative water supply were identified as different options). In some studies these were referred to as sub options. The long list of option clusters identified ranged from 9 to 19. Casey Cardinia Growth Area took all 9 to detailed analysis. Only the Leneva development adopted a transparent and robust approach to options identification using the Urban Water Cycle Planning Guide framework.
It was clear in all studies that option identification needed to account for local context and opportunities (such as, presence of an aquifer, existing infrastructure, etc.). Also, option identification should not be constrained by current regulation or political alignment, because in the studies that did include such options they were often found to be the least cost infrastructure solutions capable of delivering higher levels of service.
The base case was generally defined at this stage of the study.
Preliminary Assessment Method (PAM) for Integrated Water Management Strategies Final Report
38
Table A3
Identifying the long list of options
Approach for identifying long
list of option combinations
Predominant
ly informed
by previous
studies
Stakeholder
s defined
How many?
long
list/short
list
Multiple
rounds of
shortlisting
Melton and Wyndham North 19 options shortlisted to 6
Y
East Werribee 14 options shortlisted to 5 + base case
Y
Ballarat and Surrounding Region
Casey Cardinia Growth Area 9 options + base case identified
N
Northern Growth Area 9 options + base case identified shortlisted to 5
Y
Donnybrook PSP
Leneva_Wodonga 3 options + base case identified
N
Pakenham East Growth Area 10 options shortlisted to 5 + base case
Y

Preliminary Assessment Method (PAM) for Integrated Water Management Strategies Final Report
39
Setting performance indicators
Setting performance indicators is crucial to the success of an assessment framework. All studies linked indicators to the project objectives. Defining thresholds for indicators was identified as being particularly difficult. Defining environmental requirements and liveability indicators was noted as most difficult. Defining performance indicators prior to the development of an assessment framework needs to occur as the first step. Stakeholders need to agree on these before moving forward. Some indicators will pre-determine design elements for some options and may require particular options to be included in all option clusters. For example, if a flow control objective is included and aligned with a flow volume reduction indictor then it predetermines requirements for extensive stormwater harvesting.
The indicators varied for each study and collectively included the following:
• Life cycle costs • Potable water use reduction – % reduction • Supply of alternative supply – linked to potable reduction • Wastewater discharge to the environment - % reduction (regional areas this
can account for environmental flows) • Major flooding – 100 yr ARI standard • Local flooding – 5 yr ARI for residential, 10 yr ARI for commercial, max
infiltration • Stormwater quality – BPEM guidelines 80:45:45, enhanced standards or
SEPP, no change from base • Stormwater flow – # of runoff days, % vol reductions, no change from base • Environmental flows • Water for greening - % of POS, active & passive • Energy consumption – GHG emissions • Waterway aesthetics – daylighting of al drain > 10 yr ARI conveyance, level of
naturalness • Natural features – protect / maintain / rehabilitate natural assets • Adaptability to change – degree to which future options are ‘locked’ out • Liveability - % of demand supplied by alternative source for POS, gardens,
environment, dry conditions do not limit supply • Protect public health – provision of supply during low availability times • Land take – no take above BAU • Asset operational risk (visual, odour) – extend of land required to address
above BAU
Where current regulation does not support specific objectives (for example, flow reduction requirements in areas discharging to receiving waters with high ecological

Preliminary Assessment Method (PAM) for Integrated Water Management Strategies Final Report
40
values) some studies adopted a mandatory and aspirational set of indictors. In doing so the scope of the analysis essentially doubles. This needs to be clearly understood so that projects are adequately resourced.
Assessment framework for short listing
Most studies attempted to short list in order to reduce the time and cost associated with detailed analysis. An assessment framework in some form was developed to facilitate the short listing process. The process for assessing if an option cluster achieved performance criteria generally involved the use of knowledge gleaned from previous studies and data, judgement by project stakeholders and/or evidence based testing through modelling informed the final decision. Table A4 summarises the approach used for each study (dominant approach indicated by the shading).
Four studies used a qualitative assessment approach and two developed a semi-quantitative assessment approach (summarised in Table A5). A quantitative assessment refers to the use of numerical thresholds (such as, a 45% reduction in mean annual total nitrogen load) as opposed to ‘significant improvements in water quality discharged to receiving waters’.
Traffic light indicators or scored ratings (-1 to 2) were used to communicate if an option cluster achieved the performance criteria to a low, medium or high degree (according to the scoring thresholds specified – which were sometimes unclear).
Three case studies included an implementation assessment. This assessment was found to be useful to flag implementation or delivery risks. This enabled barriers to be dealt with as part of the subsequent more detailed analysis phase. However, this was in some cases used to filter out options which challenged the ‘norm’, the organisational capacity or the political will of stakeholders.
All studies assumed that short listing would occur once. However, inevitably multiple rounds of short listing were required (generally via consideration of sub options). In some instances an option that had previously been excluded was reintroduced and included again at a later point. Casey Cardinia growth area did not short list and still required further consideration of sub options. This reflects the difficulty in the short listing process.
The findings of the review emphasise the importance of the short listing process being transparent and defendable. This can be achieved through a robust assessment framework. Greater consistency in the indicators used across studies would be helpful to improve confidence in the process and may reduce the potential for revisiting options at later stages. Stakeholders need to be involved as much as practical to reduce the risk of questions remaining unanswered.

Preliminary Assessment Method (PAM) for Integrated Water Management Strategies Final Report
41
Table A4
Short listing of options (dark blue indicates predominant process used)
Process for short
listing/screening
Previous
studies,
modelling
and data
analysis
Undertaken
by project
stakeholders
Rapid
analysis
and
evidence
based
judgemen
t
Applied an
assessment
framework
Implementation
screening
Melton and Wyndham North
Y attempted &
abandoned
East Werribee Y Y Y
Ballarat and Surrounding Region
Casey Cardinia Growth Area
Y attempted &
abandoned
Y
Northern Growth Area
Y Y
Donnybrook PSP
Leneva_Wodonga Y Y Y
Pakenham East Growth Area
Y

Preliminary Assessment Method (PAM) for Integrated Water Management Strategies Final Report
42
Table A5
Assessment framework for prioritising short listed options
Type of assessment framework
Criteria reflect project objectives
Qualitative criteria
Semi-quantitative criteria
Quantitative criteria
Melton and Wyndham North
Approach was abandoned
Quasi-pairwise comparison
approach (2, 1 & N rating)
East Werribee Mandatory and aspirational
Qualitative scorecard
(traffic light approach)
Ballarat and Surrounding Region
Yes Intent is to use performance
indictors
Casey Cardinia Growth Area
Yes MCA - weightings assigned by
stakeholders
Northern Growth Area
Mandatory and
aspirational
Donnybrook PSP
Leneva_Wodonga Yes Environmental, social,
economic, strategic and
political (traffic light)
Pakenham East Growth Area
Yes Ratings -1 to 2

Preliminary Assessment Method (PAM) for Integrated Water Management Strategies Final Report
43
Cost and time implications
The identification and shortlisting of option clusters occupied a significant portion of time and project budget in the case studies examined, however, these varied considerably. Time taken varied from 6 weeks to 12 months, with cost implications increasing in proportion with time spent. However, as all case studies experienced some level of re-visiting of options, it is difficult to define where the shortlisting process ends.
Table A6
Cost and time implications
Time frame and costs Duration for identification & shortlisting
% of total project fee
Melton and Wyndham North 4-6 weeks in-kind
East Werribee 8 weeks $34K (24%)
Ballarat and Surrounding Region
Casey Cardinia Growth Area 12 months (entire project) $100K ($200K in-kind) 9 to detailed analysis
Northern Growth Area 6 weeks $23K (13%)
Donnybrook PSP
Leneva_Wodonga 6 months $155K (100%)
Pakenham East Growth Area 12 months $75K (70%)

Preliminary Assessment Method (PAM) for Integrated Water Management Strategies Final Report
44
Recommendations for PAM development The PAM will enable documentation of the decision making in a transparent manner to communicate effectively with stakeholder groups. As part of the development of the PAM it will be important to provide guidance on the use of consistent terminology and to be clear about the purpose and scale for applying the PAM.
Figure A1 below outlines the recommended three stage process proposed for the PAM. The PAM will guide users to:
Set the objectives and setting for the study
- Define IWM objectives.
- Collate and review the biophysical and social context of the study.
Review all options to create a long list:
- Identify all options for each aspect of the water cycle that could be delivered, screening those not consistent with project objectives and local context. This first screening stage would be undertaken through a process of project stakeholders applying expert judgement guided by a set of core decision factors.
- Collectively the decision factors define the potential viability of an option. They have a strong influence on scale of cost and benefits of an option and its deliverability. Decision factors will be developed to be binary (yes/no) in order to exclude particular options for further consideration.
Develop framework to filter long list to a short list:
- Develop a semi quantitative assessment framework and define indictors (reflecting each project objective). Some indictors may be generic others would need to be specific to a local context (and developed during the undertaking of a study).
- Assess options using the assessment framework.
- Assess delivery risks and refine options where required.
- Prioritise portfolios to identify a short list for subsequent detailed analysis.

Preliminary Assessment Method (PAM) for Integrated Water Management Strategies Final Report
45
Figure A1
Defining the steps of the Preliminary Assessment Method (PAM)

Preliminary Assessment Method (PAM) for Integrated Water Management Strategies Final Report
46
- - - - - - - - - - - - - - - - - - - - - - - - - - - - - - - - - - - - - - - - - - - - - - - - - - - - - - - - - - - -
Attachment B – Reference Tables for the PAM - - - - - - - - - - - - - - - - - - - - - - - - - - - - - - - - - - - - - - - - - - - - - - - - - - - - - - - - - - - -
List of tables
Table B1: Essential contextual questions ....................................................................... 47
Table B2: Reference rates of stormwater runoff from pervious and impervious land for various locations with different mean annual rainfall ............................................. 51
Table B3: Typical percentage of stormwater volume which can be harvested without significant impacts on land take ................................................................................ 52
Table B4: Typical wastewater yields ............................................................................... 53
Table B5: Typical pollutant loads from urban areas ........................................................ 54
Table B6: Typical roof water proportions of stormwater runoff from impervious areas and pollutants .................................................................................................. 54
Table B7: Typical major water demands based on the yearly average across winter and summer months ........................................................................................ 55
Table B8: Example long list of options ............................................................................ 57
Table B9: Typical benefits relevant to IWM studies and suggested methods to quantify or assess those benefits ............................................................................... 59
Table B10: PERFORMANCE BAND A: % potable water use reduction relative to the overall consumption of urban development ......................................................... 62
Table B11: PERFORMANCE BAND B: Energy use factors of increase or decrease relative to conventional water and sewerage services .............................................. 63
Table B12: PERFORMANCE BAND C: % wastewater discharge reduction from urban development ............................................................................................. 64
Table B13: PERFORMANCE BAND D: % stormwater discharge reduction from urban development ............................................................................................. 65
Table B14: Cost factors to be reviewed .......................................................................... 66
Table B15: Hierarchy of use for selecting fit for purpose water sources ......................... 76

Preliminary Assessment Method (PAM) for Integrated Water Management Strategies Final Report
47
Table B1: Essential contextual questions
Question Why the answer is important
Water services
Are potable water services subject to:
- source availability constraints (bulk supply and network)? - cost constraints (due to intensive treatment or distribution)? - environmental risks (e.g. energy use or catchment impacts)? - cultural risks (e.g. recreational use of reservoirs)? - climate risks?
An understanding of the current and future potable water sources will underpin objectives for potable water use reduction and alternative water use.
Are non-potable water services subject to:
- source availability constraints? - cost constraints (due to intensive treatment or distribution)? - environmental risks (e.g. energy use)? - climate risks? - restricted demands? E.g. plant only operates at full capacity for short
period due to highly variable demand (e.g. tourism)
An understanding of the current and future non-potable water sources will underpin objectives for alternative water use.
Are sewerage services subject to:
- treatment capacity constraints? - sewer capacity constraints? - excessive emergency discharges? - failing septic tanks? - increasingly stringent discharge licencing requirements?
Current or future strains on sewerage service provision due to development and changing uses can underpin objectives for wastewater reduction and flow management.

Preliminary Assessment Method (PAM) for Integrated Water Management Strategies Final Report
48
Question Why the answer is important
Are stormwater services subject to:
- drainage capacity constraints? - combined drainage/sewer networks?
Current or future strains on drainage service provision due to development and changing land uses can underpin objectives for stormwater quality and/or reduction and flow management.
Is stormwater from the study area likely to result in significant increases in flood risk downstream?
Changes in water management in the study area could increase flood risk downstream. This can be used to underpin objectives for stormwater reduction and detention.
Is groundwater currently being used as a resource by the community or impacting ecosystems? Is groundwater subject to:
- declining quality? - depleting yields?
Current or future strains on groundwater resources can underpin objectives for aquifer recharge using alternative water supplies or replacement of groundwater with an alternative supply source.
Receiving Environments
Is wastewater discharged to a waterway or body of water where ecological or cultural value could be affected by discharges?
Are there potential adverse or positive effects due to changes in:
- water quality? - quantity? - timing?
An understanding of the current state of receiving environments, and their sensitivity to future changes in quality and flows will help to define objectives for management of wastewater. This can be used to underpin objective criteria for water treatment, flow management or seasonal flow controls.

Preliminary Assessment Method (PAM) for Integrated Water Management Strategies Final Report
49
Question Why the answer is important
Is stormwater discharged to a waterway or body of water where ecological or cultural value could be affected by discharges?
Are there potential adverse or positive effects due to changes in:
- water quality? - quantity? - timing?
An understanding of the current state of receiving environments, and their sensitivity to future changes in quality and/or flows will help to define objectives for management of stormwater. This can be used to underpin objectives for water treatment, flow management or seasonal flow controls.
Is rainwater or other water sources infiltrated or injected into the ground, where groundwater could be affected?
Are there potential adverse or positive effects due to changes in:
- water quality? - quantity? - timing?
Groundwater could be a receiving environment that requires protection or offers opportunities for storage. Areas with groundwater dependent ecosystems could be sensitive to changes in infiltration due to development which decreases infiltration or water management practices that increase infiltration. This can be used to underpin objectives for infiltration.
Land use and amenity
Is water desirable in the local landscape to:
- support trees, vegetation and open space? - support agricultural activities? - support amenity features? - support recreational assets? - support cultural flows (Aboriginal water rights allocations)? - support environmental flows?
An understanding of changing ambitions for urban and rural amenity and productivity which can be supported by water can underpin objectives for retention and use of water locally.

Preliminary Assessment Method (PAM) for Integrated Water Management Strategies Final Report
50
Question Why the answer is important
Is the local water demand profile subject to change due to:
- growth or decline? - water use practices (e.g. demand management)? - land use changes? - transfer losses? - climate changes?
An understanding of the demand profile is key to IWM. This may underpin objectives for water use provisions/reductions or the proportion of potable and non-potable use.

Preliminary Assessment Method (PAM) for Integrated Water Management Strategies Final Report
51
Table B2: Reference rates of stormwater runoff from pervious and impervious land for various locations with different mean annual rainfall (refer to Melbourne Water’s MUSIC guidelines and rainfall regions to select appropriate region)
Location Mean annual rainfall (mm/yr)
Flow from 1 ha pervious land (ML/yr)
Flow from 1 ha impervious land (ML/yr)
Little River 472 0.13 3.68
Melbourne Airport 575 0.67 4.62
Melbourne Regional 708 1.31 5.83
Koo Wee Rup 769 1.56 6.30
Narre Warren North 932 2.65 7.92
Toolangi 1221 5.01 10.70

Preliminary Assessment Method (PAM) for Integrated Water Management Strategies Final Report
52
Table B3: Typical percentage of stormwater volume which can be harvested without significant impacts on land take (assuming local demands exist)
Type of harvesting project Typical % of annual volume which can be harvested
Retrofit of stormwater harvesting within an existing area 20-30% typically accessible but economic feasibility dependant on storage and local demands
Inclusion of stormwater harvesting from a wetland within a retarding basin in new development area
40-60%

Preliminary Assessment Method (PAM) for Integrated Water Management Strategies Final Report
53
Table B4: Typical wastewater yields (note, only a portion of the yield may be accessible based on harvesting mechanism)
Land use Dry weather flow to sewer
Existing development (if included in strategy area)
Existing residential Existing data likely to be available for area from water retailer
Existing employment areas
Existing data likely to be available for area from water retailer
New development
New residential – large lot (735m2)*
387 (l/household/day)
New residential – medium lot (500m2)*
372 (l/household/day)
New residential – small lot (350m2)*
259 (l/household/day)
New employment areas* 5,625 (l/ha/day)
* Data drawn from the Yarra Valley Water Demand Builder Tool for new development. Assumed 50% of tap and miscellaneous use is for human consumption and does not flow to sewer. Assumes 35% of sewerage system is located below the groundwater table and receives non-rainfall dependant infiltration.

Preliminary Assessment Method (PAM) for Integrated Water Management Strategies Final Report
54
Table B5: Typical pollutant loads from urban areas (kg/ML/yr)
Stormwater (untreated)*
Pollutant load generated off pervious surface types (kg/ML)
Pollutant load generated off impervious surface types
(kg/ML) TSS TP TN TSS TP TN
Average 18 0.2 2.2 207 0.4 2.9 Min 14 0.2 2.2 203 0.4 2.9 Max 26 0.2 2.2 208 0.4 2.9 Stormwater (treated to best practice) Pollutant: TSS TP TN Reduction required: 80% 45% 45% Wastewater (treated) Typically total nitrogen (TN) ranging between 5-10 kg/ML
* Average pollutant loads per ML were estimated. These are consistent across rainfall regions for impervious areas but can vary widely for pervious areas, for which loads are much lower. These figures are acceptable for high level analysis but more detailed modelling is required where pervious area flows and pollutant loads are significant or of interest.
Table B6: Typical roof water proportions of stormwater runoff from impervious areas and pollutants (from a typical new development in City of Casey)
Proportion of total stormwater 37%
Proportion of total TSS 6%
Proportion of total TP 17%
Proportion of total TN 38%

Preliminary Assessment Method (PAM) for Integrated Water Management Strategies Final Report
55
Table B7: Typical major water demands based on the yearly average across winter and summer months
Land use Total demand Potable portion Non-potable portion
Existing development (if included in strategy area)
Existing residential Existing data likely to be available for area
~100% in most cases Requires retrofit to supply to non-potable uses
Existing employment areas Existing data likely to be available for area
~100% in most cases Requires retrofit to supply to non-potable uses
New Development
New residential – large lot (735m2)* 549 (l/household/day) 274 (l/household/day)
275 (l/household/day)
Seasonal rates:
Summer: 395 (l/household/day)
Winter: 108 (l/household/day)
New residential – medium lot (500m2)*
494 (l/household/day) 274 (l/household/day)
220 (l/household/day)
Seasonal rates:
Summer: 300 (l/household/day)
Winter: 108 (l/household/day)

Preliminary Assessment Method (PAM) for Integrated Water Management Strategies Final Report
56
Land use Total demand Potable portion Non-potable portion
New residential – small lot (350m2)* 324 (l/household/day) 193 (l/household/day)
131 (l/household/day)
Summer: 171 (l/household/day)
Winter: 75 (l/household/day)
New employment areas** 6,450 (l/ha/day) 50% 50%
Open space**
Active open space 3-7 (ML/ha/year) Assume 100% non-potable, though existing areas will require retrofit to link non-potable supply. Local council requirements for water quality for irrigation may vary. Generally class B standard is acceptable for night time use, while class A is acceptable for all use.
Passive open space 1-3 (ML/ha/year)
Rural demands
Agriculture Area dependant Generally class B standard is acceptable for agricultural uses.
Stock and domestic Area dependant Potable standard required where water may be utilised for domestic purposes, unless customers are notified.
Environmental flows Waterway dependant Standard stipulated by waterway manager.
* Data drawn from the Yarra Valley Water Demand Builder Tool for new development. Seasonal water demands for irrigation should be adjusted based on location.
** Data from previous IWM studies

Preliminary Assessment Method (PAM) for Integrated Water Management Strategies Final Report
57
Table B8: Example long list of options
Source Option Applicability yes/no
PO Water supply leakage reduction PO Advanced water efficient practices - outdoor PO Advanced water efficient practices - buildings GW Groundwater harvesting for open space irrigation GW Groundwater harvesting for non-potable uses in buildings GW Groundwater harvesting for supplementary potable supply GW Groundwater harvesting for agricultural irrigation RW Rainwater harvesting for garden irrigation RW Rainwater harvesting for open space irrigation RW Rainwater harvesting for non-potable uses in buildings RW Rainwater intercepted by green roofs RW Rainwater intercepted by permeable ground surface SW Stormwater harvesting for open space irrigation SW Stormwater harvesting for non-potable uses in buildings SW Stormwater harvesting for supplementary potable supply SW Stormwater harvesting for agricultural irrigation SW Stormwater managed by vegetated device on-lot SW Stormwater managed by vegetated device in streets SW Stormwater managed by vegetated device in open space SW Stormwater managed by non-vegetated device on-lot SW Stormwater managed by non-vegetated device in streets SW Stormwater managed by non-vegetated device in open space SW Stormwater managed by detention device on-lot SW Stormwater managed by detention device in streets

Preliminary Assessment Method (PAM) for Integrated Water Management Strategies Final Report
58
Source Option Applicability yes/no
SW Stormwater managed by detention device in open space SW Treated stormwater distributed to lake or water feature SW Treated stormwater distributed to land SW Treated stormwater distributed to evapotranspiration fields SW Treated stormwater distributed to environmental flows in waterway WW Wastewater managed by class B treatment device WW Wastewater managed by class A treatment device WW Treated wastewater distributed to lake or water feature WW Treated wastewater distributed to land WW Treated wastewater distributed to evapotranspiration fields WW Treated wastewater distributed to environmental flows in waterway WW Treated wastewater harvesting for open space irrigation WW Treated wastewater harvesting for non-potable uses in buildings WW Treated wastewater harvesting for agricultural irrigation SW+WW Shandied treated wastewater and treated stormwater for local uses
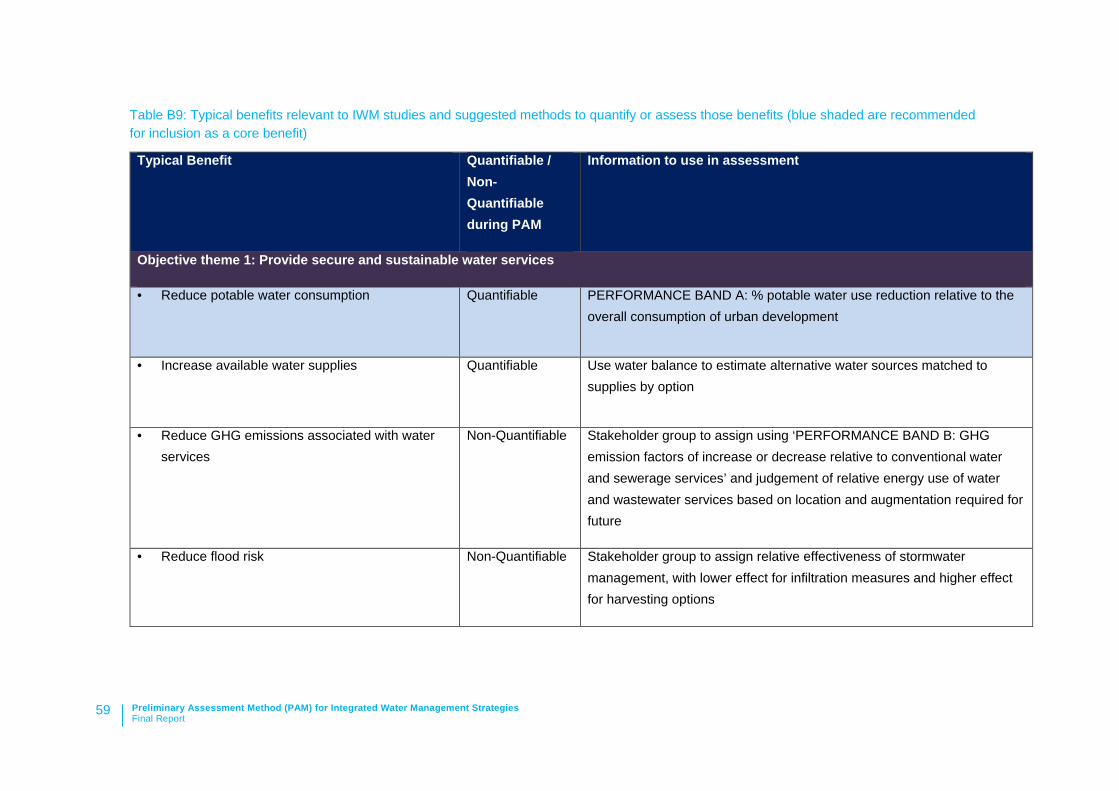
Preliminary Assessment Method (PAM) for Integrated Water Management Strategies Final Report
59
Table B9: Typical benefits relevant to IWM studies and suggested methods to quantify or assess those benefits (blue shaded are recommended for inclusion as a core benefit)
Typical Benefit Quantifiable / Non-Quantifiable during PAM
Information to use in assessment
Objective theme 1: Provide secure and sustainable water services
• Reduce potable water consumption
Quantifiable PERFORMANCE BAND A: % potable water use reduction relative to the overall consumption of urban development
• Increase available water supplies
Quantifiable Use water balance to estimate alternative water sources matched to supplies by option
• Reduce GHG emissions associated with water services
Non-Quantifiable Stakeholder group to assign using ‘PERFORMANCE BAND B: GHG emission factors of increase or decrease relative to conventional water and sewerage services’ and judgement of relative energy use of water and wastewater services based on location and augmentation required for future
• Reduce flood risk Non-Quantifiable Stakeholder group to assign relative effectiveness of stormwater management, with lower effect for infiltration measures and higher effect for harvesting options

Preliminary Assessment Method (PAM) for Integrated Water Management Strategies Final Report
60
Objective theme 2: Protect and enhance health of receiving environments
• Reduce wastewater discharge to the environment
Quantifiable PERFORMANCE BAND C: % wastewater discharge reduction from urban development
• Improve wastewater discharge quality Quantifiable Estimate using water balance and % reduction in PERFORMANCE BAND C: % wastewater discharge reduction from urban development
• Reduce stormwater discharge to the environment Quantifiable PERFORMANCE BAND D: % stormwater discharge reduction from urban development
• Improve stormwater discharge quality Quantifiable For treatment only options:
If higher than base case, estimate using urban developer or MUSIC.
For harvesting options:
Estimate using water balance and % reduction in PERFORMANCE BAND D: % stormwater discharge reduction from urban development
• Increase environmental flows contribution in regional areas
Quantifiable Estimate additional flow contribution using water balance

Preliminary Assessment Method (PAM) for Integrated Water Management Strategies Final Report
61
Objective theme 3: Support liveability of the places we live and work
• Increase local infiltration and soil moisture Non-Quantifiable Stakeholder group to assign based on relative scale of use of infiltration systems and irrigation
• Increase water availability for recreational and cultural purposes
Quantifiable Estimate open space and cultural water contribution using water balance
• Enhance amenity and microclimate through protection, enhancement or introduction of natural features
Non-Quantifiable Stakeholder group to assign based on relative scale of use of vegetation or exposed water
• Minimise impact on of water management assets on land value (visual, odour)
Non-Quantifiable Stakeholder group to assign based on inclusion of local infrastructure and treatment plants

Preliminary Assessment Method (PAM) for Integrated Water Management Strategies Final Report
62
Table B10: PERFORMANCE BAND A: % potable water use reduction relative to the overall consumption of urban development2
2 Performance of options in reducing potable consumption will depend on a number of factors including local demand for alternative sources, distances to key infrastructure, topography and geology. See Table B14 for factors affecting cost.
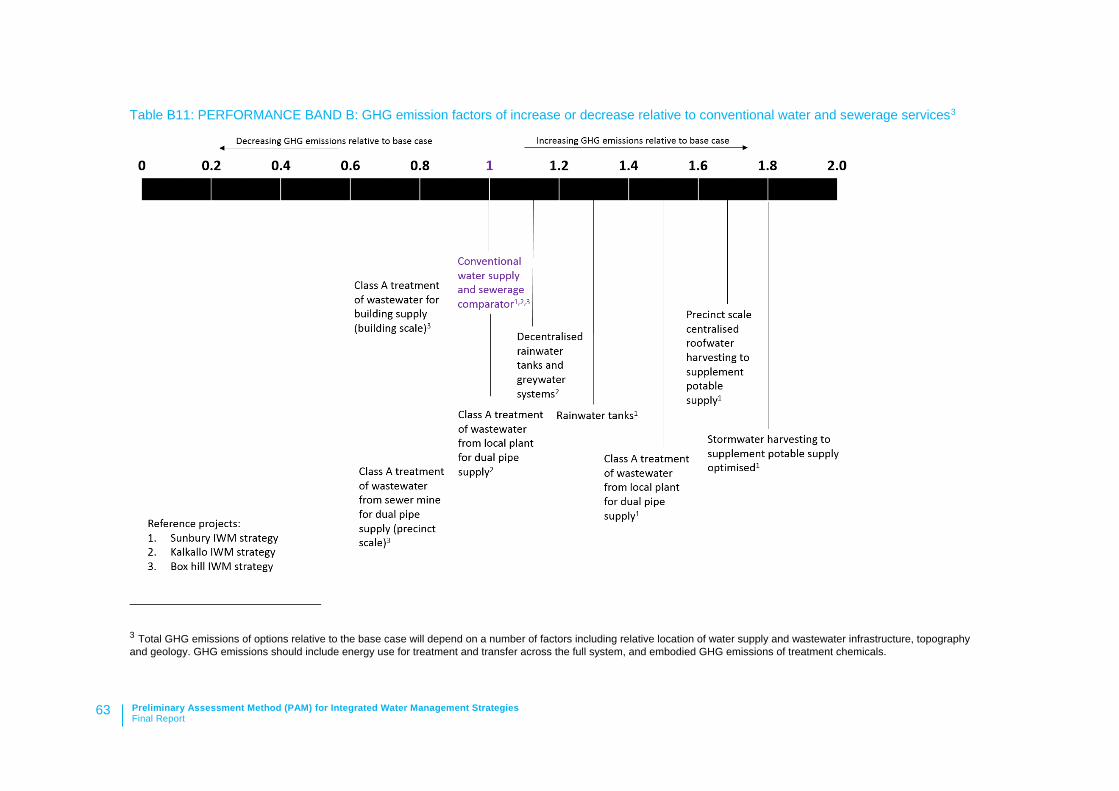
Preliminary Assessment Method (PAM) for Integrated Water Management Strategies Final Report
63
Table B11: PERFORMANCE BAND B: GHG emission factors of increase or decrease relative to conventional water and sewerage services3
3 Total GHG emissions of options relative to the base case will depend on a number of factors including relative location of water supply and wastewater infrastructure, topography and geology. GHG emissions should include energy use for treatment and transfer across the full system, and embodied GHG emissions of treatment chemicals.

Preliminary Assessment Method (PAM) for Integrated Water Management Strategies Final Report
64
Table B12: PERFORMANCE BAND C: % wastewater discharge reduction from urban development4
4 Performance of options in reducing wastewater discharge will depend on a number of factors including local demand for recycled wastewater, distances to and sizes of key infrastructure, treatment requirements, topography and geology. See Table B14 for factors affecting cost.

Preliminary Assessment Method (PAM) for Integrated Water Management Strategies Final Report
65
Table B13: PERFORMANCE BAND D: % stormwater discharge reduction from urban development (from total catchment)5
5 Performance of options in reducing stormwater discharge will depend on a number of factors including local demand for treated stormwater, distances to and sizes of key infrastructure, treatment requirements, topography and geology. See Table B14 for factors affecting cost.

Preliminary Assessment Method (PAM) for Integrated Water Management Strategies Final Report
66
Table B14: Cost factors to be reviewed
Cost influencing factors Which options are likely to be affected
Existing or committed infrastructure
Presence of stormwater treatment measures to treat stormwater for ‘ready non-potable use’. This could include WSUD/Wetlands delivered in new development to meet Clause 56 requirements or in existing areas by local councils for environmental improvement. This is effectively a sunk cost.
Advantaged options:
- Stormwater treatment options - Stormwater harvesting for:
o Open space o Non-potable demands in buildings o Agriculture o Land o Lake or water feature o Environmental flows o Evapotranspiration fields
- Stormwater harvesting to supplement potable supply. - Shandied stormwater and wastewater supply:
o Open space o Non-potable demands in buildings o Agriculture

Preliminary Assessment Method (PAM) for Integrated Water Management Strategies Final Report
67
Cost influencing factors Which options are likely to be affected
Presence of retarding basins in new development which can be designed to incorporate storage for harvesting.
Advantaged options:
- Stormwater harvesting for: o Open space o Non-potable demands in buildings o Agriculture o Land o Lake or water feature o Environmental flows o Evapotranspiration fields
- Stormwater harvesting to supplement potable supply. - Shandied stormwater and wastewater supply:
o Open space o Non-potable demands in buildings o Agriculture
Wastewater treatment plant nearby (with required additional capacity) or a major sewer which can be accessed (sewer mining).
Advantaged options:
- All wastewater options - All shandied stormwater and wastewater options

Preliminary Assessment Method (PAM) for Integrated Water Management Strategies Final Report
68
Cost influencing factors Which options are likely to be affected
Class A recycled water plant nearby (with required additional capacity). Advantaged options:
- Treated wastewater for: o Non-potable demands in buildings o Agriculture (particular types) o Open space o Evapotranspiration fields
Disadvantaged options:
May be cost increases (due to shared treatment and distribution infrastructure to deliver a single water quality) for complimentary options for:
- Treated wastewater for: o Agriculture (class B users)

Preliminary Assessment Method (PAM) for Integrated Water Management Strategies Final Report
69
Cost influencing factors Which options are likely to be affected
Local large (>20ML) storages which are disused, have capacity or could be repurposed.
Advantaged options:
Options that require large balancing storages to match seasonal differences in supply and demand (also depends on location relative to source and destination). These will include:
- Stormwater harvesting for: o Non-potable demands in buildings o Agriculture o Land application o Supplementing potable supply o Environmental flows
- Treated wastewater for: o Non-potable demands in buildings o Agriculture o Land application o Supplementing potable supply o Environmental flows

Preliminary Assessment Method (PAM) for Integrated Water Management Strategies Final Report
70
Cost influencing factors Which options are likely to be affected
Availability of free or reduced cost transfers due to
b) Presence of transfer pipes or reticulation which is disused or could be repurposed.
c) Presence of pre-commissioned or adjacent works that will create easements or trenches where other transfers could be included more easily.
Advantaged options:
Options that could utilise the transfers to access sources, storages or demands (location dependant).
Local land characteristics
Potential to utilise aquifer storage and recovery (ASR) due to suitable geological and water quality conditions.
Advantaged options:
Options that require large balancing storages to match seasonal differences in supply and demand. These will include:
- Stormwater harvesting for: o Open space o Non-potable demands in buildings o Agriculture o Land application o Supplementing potable supply
- Treated wastewater for: o Non-potable demands in buildings o Open space o Agriculture and land application

Preliminary Assessment Method (PAM) for Integrated Water Management Strategies Final Report
71
Cost influencing factors Which options are likely to be affected
Availability of low cost land nearby (<5km) Advantaged options:
Options that require large balancing storages or areas for treatment plants to match seasonal differences in supply and demand. These will include:
- Stormwater harvesting for: o Open space o Non-potable demands in buildings o Agriculture o Land application o Supplementing potable supply
- Treated wastewater for: o Non-potable demands in buildings o Open space o Agriculture o Land application o Supplementing potable supply
- Wastewater managed by class B treatment device - Wastewater managed by class A treatment device - Interception of stormwater for treatment (potentially offsite where
land cost is lower).

Preliminary Assessment Method (PAM) for Integrated Water Management Strategies Final Report
72
Cost influencing factors Which options are likely to be affected
Sandy soils Advantaged options:
Options that utilise infiltration.
Shallow soils above a rock layer, or presence of soil contamination, fill soils or acid sulphate soils.
Disadvantaged options:
Options requiring significant excavation to create deep storages or underground storage.
Sodic soils which risk saline water rising up into transfers, storages or treatment devices.
Advantaged options:
- Shandied supply of treated wastewater and stormwater (with stormwater decreasing salt levels).
Disadvantaged options:
Options with in-ground unsealed storages, treatment devices or transfers that might be susceptible to saline intrusion.

Preliminary Assessment Method (PAM) for Integrated Water Management Strategies Final Report
73
Cost influencing factors Which options are likely to be affected
Development characteristics
High proportion of open space (>10% of developable area) Advantaged options:
- Interception of stormwater for treatment - Treated stormwater distributed to:
o Evapotranspiration fields o Lake or water feature
- Treated wastewater distributed to: o Evapotranspiration fields o Lake or water feature
- Stormwater harvesting for open space - Wastewater treatment for open space
Higher density development (>40 dwellings/ha) Advantaged options:
- Water efficient buildings - Options utilising dual pipe reticulation for non-potable uses - Greywater reuse - Roofwater harvesting (precinct scale) to supplement potable supply. - Green roofs
Lower density development (<20 dwellings/ha) Advantaged options:
- Rainwater tanks on-lot.
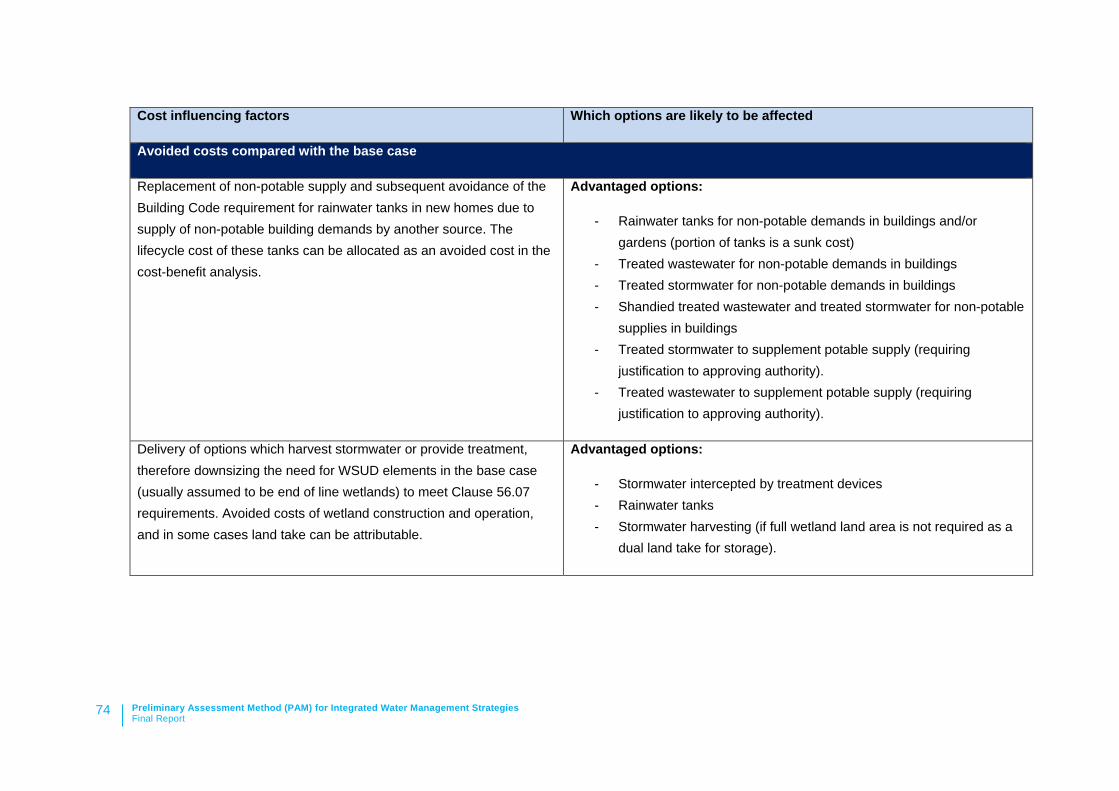
Preliminary Assessment Method (PAM) for Integrated Water Management Strategies Final Report
74
Cost influencing factors Which options are likely to be affected
Avoided costs compared with the base case
Replacement of non-potable supply and subsequent avoidance of the Building Code requirement for rainwater tanks in new homes due to supply of non-potable building demands by another source. The lifecycle cost of these tanks can be allocated as an avoided cost in the cost-benefit analysis.
Advantaged options:
- Rainwater tanks for non-potable demands in buildings and/or gardens (portion of tanks is a sunk cost)
- Treated wastewater for non-potable demands in buildings - Treated stormwater for non-potable demands in buildings - Shandied treated wastewater and treated stormwater for non-potable
supplies in buildings - Treated stormwater to supplement potable supply (requiring
justification to approving authority). - Treated wastewater to supplement potable supply (requiring
justification to approving authority).
Delivery of options which harvest stormwater or provide treatment, therefore downsizing the need for WSUD elements in the base case (usually assumed to be end of line wetlands) to meet Clause 56.07 requirements. Avoided costs of wetland construction and operation, and in some cases land take can be attributable.
Advantaged options:
- Stormwater intercepted by treatment devices - Rainwater tanks - Stormwater harvesting (if full wetland land area is not required as a
dual land take for storage).
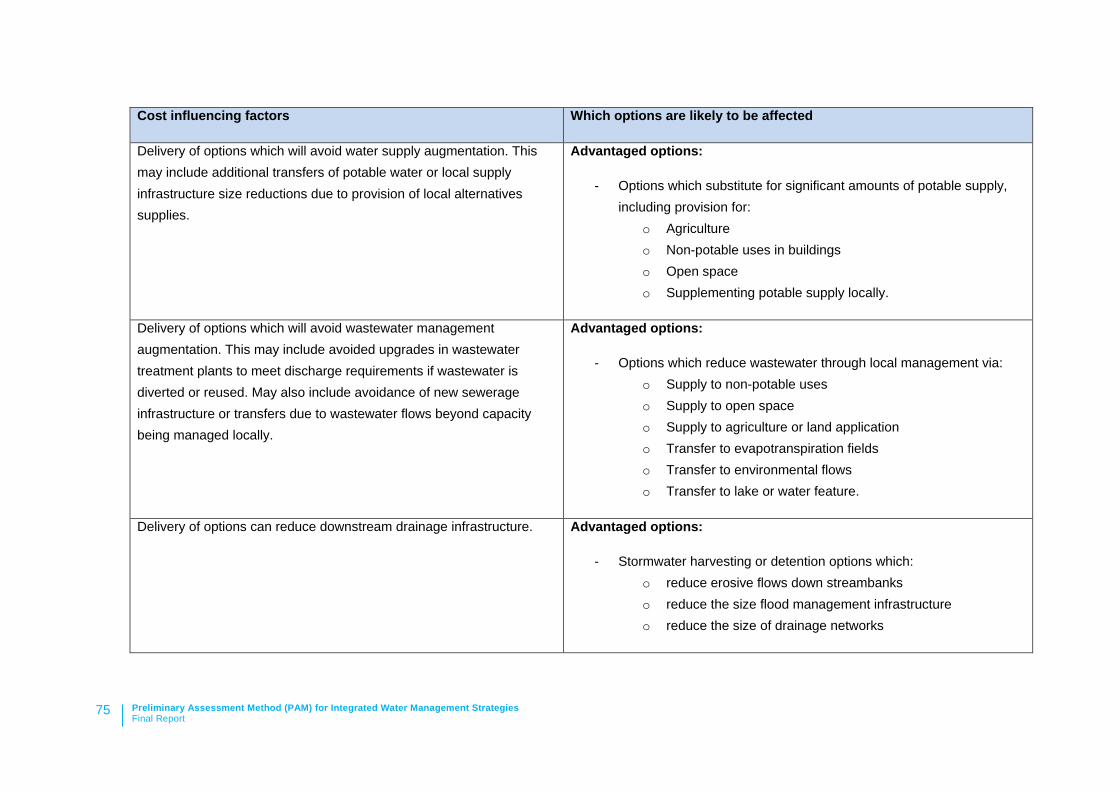
Preliminary Assessment Method (PAM) for Integrated Water Management Strategies Final Report
75
Cost influencing factors Which options are likely to be affected
Delivery of options which will avoid water supply augmentation. This may include additional transfers of potable water or local supply infrastructure size reductions due to provision of local alternatives supplies.
Advantaged options:
- Options which substitute for significant amounts of potable supply, including provision for:
o Agriculture o Non-potable uses in buildings o Open space o Supplementing potable supply locally.
Delivery of options which will avoid wastewater management augmentation. This may include avoided upgrades in wastewater treatment plants to meet discharge requirements if wastewater is diverted or reused. May also include avoidance of new sewerage infrastructure or transfers due to wastewater flows beyond capacity being managed locally.
Advantaged options:
- Options which reduce wastewater through local management via: o Supply to non-potable uses o Supply to open space o Supply to agriculture or land application o Transfer to evapotranspiration fields o Transfer to environmental flows o Transfer to lake or water feature.
Delivery of options can reduce downstream drainage infrastructure. Advantaged options:
- Stormwater harvesting or detention options which: o reduce erosive flows down streambanks o reduce the size flood management infrastructure o reduce the size of drainage networks

Preliminary Assessment Method (PAM) for Integrated Water Management Strategies Final Report
76
Table B15: Hierarchy of use for selecting fit for purpose water sources
Preferred use: D
rinki
ng/ f
ood
prep
arat
ion/
ba
thro
om c
old
wat
er
Hot
wat
er/
was
hing
mac
hine
Irrig
atio
n/ g
arde
n/
toile
ts/ a
ir co
nditi
onin
g un
its
Toile
t/ ga
rden
Irrig
atio
n/ g
arde
n /to
ilet /
air
cond
ition
ing
units
Source of supply / Demand
Drinking/mains water
Rainwater
Stormwater (harvested urban excess)
Recycled water
Shandy supply (recycled water & stormwater)
Cold 1 2 2 4 4 Toilet 3 2 1 1 1 Garden (residential)
3 2 1 1 1
Active POS 3 3 1 2 1 Passive POS 3 3 1 2 1 Washing machine 2 1 3 3 3 Hot water 2 1 4 4 4 Fire fighting 1 4 4 1 1 Air conditioning units (commercial)
2 1 1 1 1
1 – Preferred source of supply to meet end use demand
2 – Possible source of supply to meet end use demand
3 – Not recommended source of supply to meet end use demand
4 – Unacceptable source of supply to meet end use demand

Preliminary Assessment Method (PAM) for Integrated Water Management Strategies Final Report
77
- - - - - - - - - - - - - - - - - - - - - - - - - - - - - - - - - - - - - - - - - - - - - - - - - - - - - - - - - - - -
Attachment C – Worked Example: Sunbury Growth Areas IWM Portfolio Shortlisting - - - - - - - - - - - - - - - - - - - - - - - - - - - - - - - - - - - - - - - - - - - - - - - - - - - - - - - - - - - -

Preliminary Assessment Method (PAM) for Integrated Water Management Strategies Final Report
78
Stage 1: Preparation
Review of Water Cycle Context The township of Sunbury has been earmarked for significant growth, with the allocation of three PSP areas adjacent to the existing settlement (excluding Sunbury West). The proposed developments governed by the PSPs are planned to deliver 21,150 new homes plus an employment zone and community facilities. This growth adds to infill development and the development underway to the southwest of the town in Diggers Rest. Figure B1 shows the PSP boundaries and the expected land uses.
Figure C1: Growth areas in Sunbury

Preliminary Assessment Method (PAM) for Integrated Water Management Strategies Final Report
79
Table C1: Contextual questions and answers for the Sunbury Growth Areas Question Answer
Water services
Are potable water services subject to:
- Source availability constraints - Cost constraints (due to intensive treatment or
distribution) - Environmental risks (e.g. energy use or
catchment impacts) - Cultural risks (e.g. recreational use of reservoirs) - Climate risks
Existing potable supplies are predominantly sourced from Rosslynne Reservoir, the reservoir does not have capacity to cater for the predicted growth. The area is connected to the Melbourne System, this connection could be used to service future demands. However, transfer of water would be costly, both financially and environmentally.
Are non-potable water services subject to:
- Source availability constraints - Cost constraints (due to intensive treatment or
distribution) - Environmental risks (e.g. energy use) - Climate risks
The Sunbury Recycled Water Plant provides Class B water to local agricultural customers and for irrigation of most active open spaces in Sunbury. Wastewater for new growth is available for allocation. Planned upgrades will be necessary sufficient capacity to meet growth expectations and satisfy discharge conditions to Jacksons creek in the near future.
Are sewerage services subject to:
- Treatment capacity constraints - Drainage capacity constraints
Wastewater from the existing township is currently managed at the Sunbury Recycled Water Plant. The management of wastewater from the majority of new growth areas is still subject to management decisions from Western Water.
Are stormwater services subject to:
- Drainage capacity constraints
The capacity of the existing drainage in Sunbury will not substantially influence this IWM Strategy. The capacity of new stormwater services will comply with existing regulations.
Is stormwater from the study area likely to result in significant increases in flood risk downstream?
The majority of new development will not drain into existing stormwater networks. Consequently, the risk of flooding to existing developments is very low. Downstream riverine flooding may increase, consideration of this risk/impact is beyond the scope of this IWM strategy.
Receiving Environments
Is wastewater discharged to a waterway or body of water where ecological or cultural value could be affected by discharges?
The Sunbury Recycled Water Plant discharges into Jacksons Creek, a highly valued by the local community and supports a range of species, including platypus and threatened species of frogs and fish.

Preliminary Assessment Method (PAM) for Integrated Water Management Strategies Final Report
80
Are there potential adverse or positive effects due to changes in:
- Water quality? - Quantity? - Timing?
The creek currently experiences a shortage of flow in winter.
Is stormwater discharged to a waterway or body of water where ecological or cultural value could be affected by discharges?
Are there potential adverse or positive effects due to changes in:
- Water quality? - Quantity? - Timing?
The area is flanked by two waterways: Jacksons Creek and Emu Creek. The two Creeks are in a different physical and ecological condition. Jacksons Creek has experienced significant modification due to the upstream reservoir, discharge from the Sunbury Recycled Water Plant and farming and urban land use within the catchment. The creek currently experiences a shortage of flow in winter. Emu Creek would benefit from significant reductions in runoff leaving any new developments.
Is rainwater or other water sources infiltrated or injected into the ground, where groundwater could be affected?
Are there potential adverse or positive effects due to changes in:
- Water quality? - Quantity? - Timing?
There is currently no major injections of rainwater or other water sources into the ground. Development could decrease infiltration. Review shows no major issues for groundwater dependant ecosystems.
Land use and amenity
Is water desirable in the local landscape to:
- support trees, vegetation and open space - support agricultural activities - support amenity features - support recreational assets
There is a desire for enhanced greening in the new PSP areas via the irrigation of open spaces and trees in the urban environment.
Is the local water demand profile subject to change due to:
- growth or decline - water use practices - land use changes - transfer losses - climate changes
The level of growth predicted for the area is large relative to the considerable existing urban footprint. Local supplies are susceptible to long term drought but can call on water from the Melbourne Supply. However, in the future the Melbourne System may be similarly susceptible to drought if predicted metropolitan wide growth occurs. Community desire for quality green space is expected to remain high, however, climate change scenarios predict a warmer and drier climate in the future.

Preliminary Assessment Method (PAM) for Integrated Water Management Strategies Final Report
81
Objectives Table C2: Objectifies for the Sunbury Growth Areas
1. Provide secure and sustainable water services
2. Protect and enhance health of receiving environments
3. Support liveability of the places we live and work
1.1 Create significant new alternative water supplies to substitute for potable water supplies and to reduce reliance on supply from the Melbourne system and delay the need to augment the desalination plant in the future.
2.1 Achieve significant reductions in stormwater runoff volumes from new growth areas released to local waterways.
2.2 Reduce the discharge to Jacksons Creek of treated wastewater arising from new growth areas to Jacksons Creek, with preference to reducing summer flows.
2.3 Benefit the flow regime of local waterways by supporting the natural flow patterns where possible.
3.1 Healthy open spaces and trees should be supported through the provision of irrigation supply.
Water balance Process:
• Collate key land use and development statistics, utilise assumptions based on experience/observation where necessary (e.g. proportion of roof per lot).
• Use statistics and PAM assumptions to generate preliminary water balance and pollutant balance.
Summary of findings:
• Total new residential demand of ~3.8 GL, 45% of this demand could be serviced with non-potable water.
• Open space demand is substantial (0.5 GL/yr) but smaller than the residential non-potable demand, open space demands could be serviced with non-potable water

Preliminary Assessment Method (PAM) for Integrated Water Management Strategies Final Report
82
• The total non-potable demand is approximately 2.4 GL/yr. Given the scale of wastewater and stormwater generation the majority, if not entirety, of this demand could be serviced by recycled wastewater or treated stormwater.
• The volume of wastewater and stormwater discharged substantially exceeds the total potable and non-potable demands.
• Roofwater makes up a substantial proportion of stormwater runoff.
Table C2: Demands and alternative water sources
Demands ML/yr Residential non-potable demand 1,698
Residential potable demand 2,115 Employment area non-potable demand 128
Employment area potable demand 128 Open Space non-potable demand 552
Alternative water sources ML/yr Wastewater generation (res+emp) 3,094
Stormwater generation (total) 7,126 Roofwater generation (res+emp) 2,636
Stormwater generation (total – roofwater) 4,489 Potential stormwater harvesting yield 4,275
Figure C2: Sunbury Growth Area water balance

Preliminary Assessment Method (PAM) for Integrated Water Management Strategies Final Report
83
Table C3: Key PAM assumptions
Assumptions # Unit
New residential – medium lot (456m2) Potable 274 l/hh/day Non-potable 220 l/hh/day
New employment areas Potable 3,225 l/ha/day Non-potable 3,225 l/ha/day
Open Space non-potable demand Active 6.0 ML/ha/year Passive 2.5 ML/ha/year
Wastewater generation Residential 372 l/hh/day Employment 5,625 l/ha/day
Roofwater as a proportion of total stormwater 37 % Stormwater runoff from 1ha or impervious land 4.62 ML/ha/year Stormwater runoff from 1ha or pervious land 0.67 ML/ha/year
Potential stormwater harvesting yield 60 % of total stormwater
Table C4: Residential lot breakdown
Lot type # of lots Average lot area
Proportion of roof area per lot
Proportion of non-roof area per lot
Medium 21,147 456.5 60% 40% Table C5: Breakdown of land use imperviousness
Land use % impervious Area (ha) Roof (residential) 100 579 Roof (employment) 100 46 Non-roof (residential) 50 386 Non-roof (employment) 60 30 POS pervious 0 159 POS impervious 100 33 Other - 1010 Total - 2377
The base case Under the existing framework of legislation and practice, we can assume water management will entail:
• Installation of rainwater tanks or solar hot water systems on each new home under the Building Code. Typically around 30% of house builders opt for a rainwater tank.
• Stormwater management under Clause 56 in the Victorian Planning Provisions, requiring the treatment of stormwater to Best Practice Environmental Management standards. This is expected to be delivered through the provision of wetlands in most cases.
• Implementation of a Development Services Scheme (DSS) to provide adequate land drainage, flood mitigation and protection of drainage channels. This is likely to include the construction of retarding basins and adequate conveyance of flow to local waterways.
• Conveyance of wastewater to the Sunbury Recycled Water Plant, with upgrades to the existing plant required to provide capacity for adequate treatment to meet EPA discharge licence conditions unless an alternative use is found.
• Provision of potable water supply from the Melbourne System.
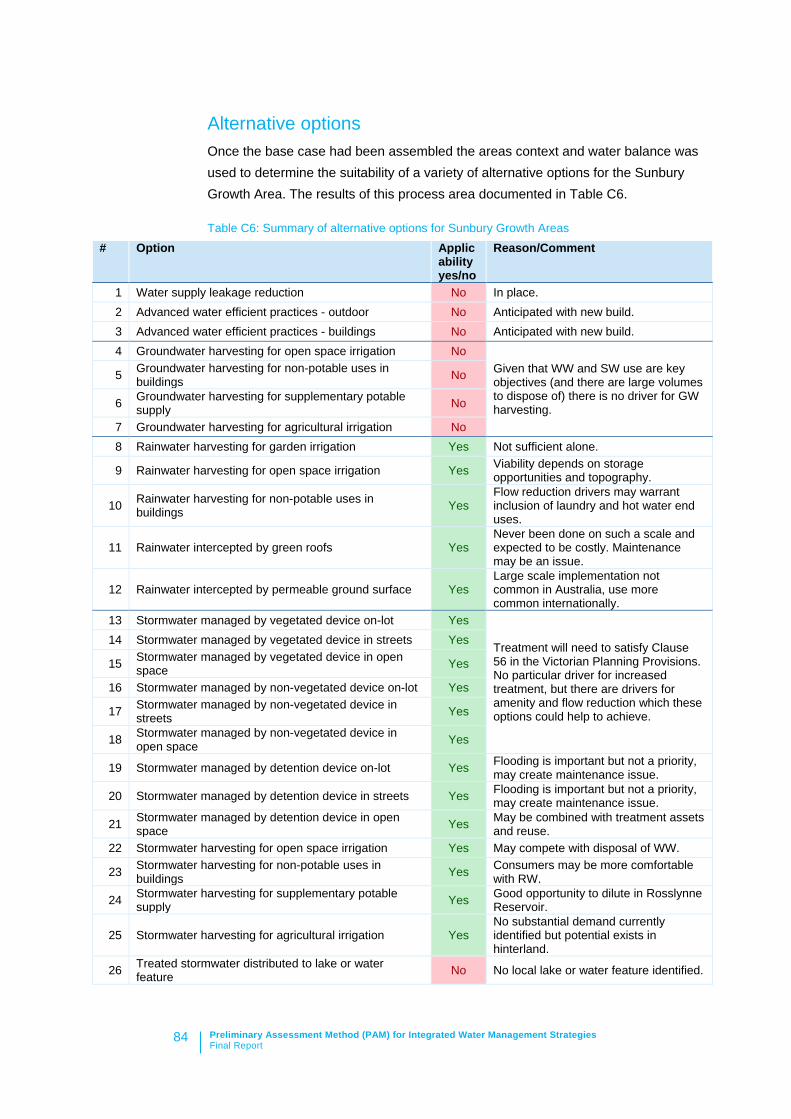
Preliminary Assessment Method (PAM) for Integrated Water Management Strategies Final Report
84
Alternative options Once the base case had been assembled the areas context and water balance was used to determine the suitability of a variety of alternative options for the Sunbury Growth Area. The results of this process area documented in Table C6.
Table C6: Summary of alternative options for Sunbury Growth Areas # Option Applic
ability yes/no
Reason/Comment
1 Water supply leakage reduction No In place. 2 Advanced water efficient practices - outdoor No Anticipated with new build. 3 Advanced water efficient practices - buildings No Anticipated with new build. 4 Groundwater harvesting for open space irrigation No
Given that WW and SW use are key objectives (and there are large volumes to dispose of) there is no driver for GW harvesting.
5 Groundwater harvesting for non-potable uses in buildings No
6 Groundwater harvesting for supplementary potable supply No
7 Groundwater harvesting for agricultural irrigation No 8 Rainwater harvesting for garden irrigation Yes Not sufficient alone.
9 Rainwater harvesting for open space irrigation Yes Viability depends on storage opportunities and topography.
10 Rainwater harvesting for non-potable uses in buildings Yes
Flow reduction drivers may warrant inclusion of laundry and hot water end uses.
11 Rainwater intercepted by green roofs Yes Never been done on such a scale and expected to be costly. Maintenance may be an issue.
12 Rainwater intercepted by permeable ground surface Yes Large scale implementation not common in Australia, use more common internationally.
13 Stormwater managed by vegetated device on-lot Yes
Treatment will need to satisfy Clause 56 in the Victorian Planning Provisions. No particular driver for increased treatment, but there are drivers for amenity and flow reduction which these options could help to achieve.
14 Stormwater managed by vegetated device in streets Yes
15 Stormwater managed by vegetated device in open space Yes
16 Stormwater managed by non-vegetated device on-lot Yes
17 Stormwater managed by non-vegetated device in streets Yes
18 Stormwater managed by non-vegetated device in open space Yes
19 Stormwater managed by detention device on-lot Yes Flooding is important but not a priority, may create maintenance issue.
20 Stormwater managed by detention device in streets Yes Flooding is important but not a priority, may create maintenance issue.
21 Stormwater managed by detention device in open space Yes May be combined with treatment assets
and reuse. 22 Stormwater harvesting for open space irrigation Yes May compete with disposal of WW.
23 Stormwater harvesting for non-potable uses in buildings Yes Consumers may be more comfortable
with RW.
24 Stormwater harvesting for supplementary potable supply Yes Good opportunity to dilute in Rosslynne
Reservoir.
25 Stormwater harvesting for agricultural irrigation Yes No substantial demand currently identified but potential exists in hinterland.
26 Treated stormwater distributed to lake or water feature No No local lake or water feature identified.

Preliminary Assessment Method (PAM) for Integrated Water Management Strategies Final Report
85
# Option Applicability yes/no
Reason/Comment
27 Treated stormwater distributed to land Yes May be required to achieve desirable level of flow reduction in Emu Creek. 28 Treated stormwater distributed to evapotranspiration
fields Yes
29 Treated stormwater distributed to environmental flows in waterway Yes Relevant to Jacksons Creek.
30 Wastewater managed by class B treatment device Yes Can build on existing scheme.
31 Wastewater managed by class A treatment device Yes Widens the potential end uses that could be serviced by WW.
32 Treated wastewater for open space irrigation Yes Improved environmental outcome and assists with satisfaction of discharge licence.
33 Treated wastewater for non-potable uses in buildings Yes Consumers may be more comfortable with RW.
34 Treated wastewater for supplementary potable supply Yes Good opportunity to dilute in Rosslynne
Reservoir.
35 Treated wastewater for agricultural irrigation Yes No substantial demand currently identified but potential exists in hinterland.
36 Treated wastewater distributed to lake or water feature No No local lake or water feature identified.
37 Treated wastewater distributed to land Yes Could be used to minimise discharge to Jacksons Creek (over summer).
38 Treated wastewater distributed to evapotranspiration fields Yes
Low driver as land for evapotranspiration fields better used to reduce flow to Emu Creek.
39 Treated wastewater distributed to environmental flows in waterway Yes Jacksons Creek over winter.
40 Shandied treated wastewater and treated stormwater for open space irrigation Yes Oversupply may be an issue.
41 Shandied treated wastewater and treated stormwater for non-potable uses in buildings Yes Oversupply may be an issue.
42 Shandied treated wastewater and treated stormwater for agriculture Yes Oversupply may be an issue.
Stage 2: Assessment of Options
Comparison of Benefits, Costs and Risks Viable alternative options were then included in the long list. Options in the long list were assessed in terms of the scale of benefits they can provide. Assessment was conducted using the quantifiable and non-quantifiable benefits listed in Table C7. A high level assessment of each option against a variety of key cost factors was also completed, followed by a review of risks in a variety of key areas.
All of the results of these steps are compiled in the final comparison matrix in Table C8. At this stage, a potential groupings of options that affect the same water stream but could be combined to enhance benefit were also identified and added as a new options in Table C9.

Preliminary Assessment Method (PAM) for Integrated Water Management Strategies Final Report
86
Table C7: Benefits used to assess the long list of options
Reason for inclusion
Type High benefit Mid benefit Low benefit Data source
Objective theme 1
Reduce potable water consumption
Objective 1.1 Quantifiable Achieves more than a 55% reduction in total water demand in the Sunbury Growth Areas
Achieves more than a 35% reduction in total water demand in the Sunbury Growth Areas
Achieves less than a 30% reduction in total water demand in the Sunbury Growth Areas
BAND A
Increase available water supplies
Objective 1.1 Quantifiable The Sunbury Growth Areas generate more than 1500 ML/yr of alternative water supply
The Sunbury Growth Areas generate more than 500 ML/yr of alternative water supply
The Sunbury Growth Areas generate less than 500 ML/yr of alternative water supply
Water balance
Objective theme 2
Reduce wastewater discharge to the environment
Objective 2.2* Quantifiable Volume of recycled water used within the Sunbury Growth Areas is more than 60% of the wastewater volume generated
Volume of recycled water used within the Sunbury Growth Areas is more than 35% of the wastewater volume generated
Volume of recycled water used within the Sunbury Growth Areas is less than 35% of the wastewater volume generated
BAND C
Reduce stormwater discharge to the environment
Objective 2.1** (focus on Emu Creek)
Quantifiable Achieves more than 90% volume reduction of post-development flow from the Sunbury Growth Areas
Achieves more than 60% volume reduction of post-development flow from the Sunbury Growth Areas
Achieves less than 60% volume reduction of post-development flow from the Sunbury Growth Areas
BAND D
Increase environmental flows contribution in regional areas
Objective 2.3 (Jacksons Creek only)
Quantifiable Over 1.25 GL of water is available for environmental flows in Jacksons Creek over the winter
Over 0.5 GL of water is available for environmental flows in Jacksons Creek over the winter
Less than 0.5 GL of water is available for environmental flows in Jacksons Creek over the winter
Water balance
Objective theme 3
Enhance amenity and microclimate through introduction of natural features
Objective 3.1* Non-Quantifiable
Increase in vegetation or exposed water within the development
Increase in vegetation or exposed water within public open spaces
Reduction, no change or only a very limited increase in vegetation or exposed water within public open spaces
Stakeholder group
* In Sunbury wastewater discharge reductions takes precedence over wastewater quality improvements. Furthermore, reducing wastewater discharge will lead to improved wastewater quality outcomes. Based on this priority and overlap only wastewater discharge reductions are included in the assessment of benefits. ** In Sunbury stormwater discharge reductions takes precedence over stormwater quality improvements. Furthermore, stormwater quality will be addressed to a large extent by the existing Victorian Planning Provisions and reducing stormwater discharge will also benefit stormwater quality outcomes. Based on this priority and overlap only stormwater discharge reductions are included in the assessment of benefits. ** In Sunbury stormwater the liveability focus is on amenity and microclimate, increased water availability for recreational and cultural purposes will be addressed by default as satisfaction of the high wastewater and stormwater discharge objectives will necessitate a substantial volume of water being made available for recreational purposes (e.g. public open space irrigation).
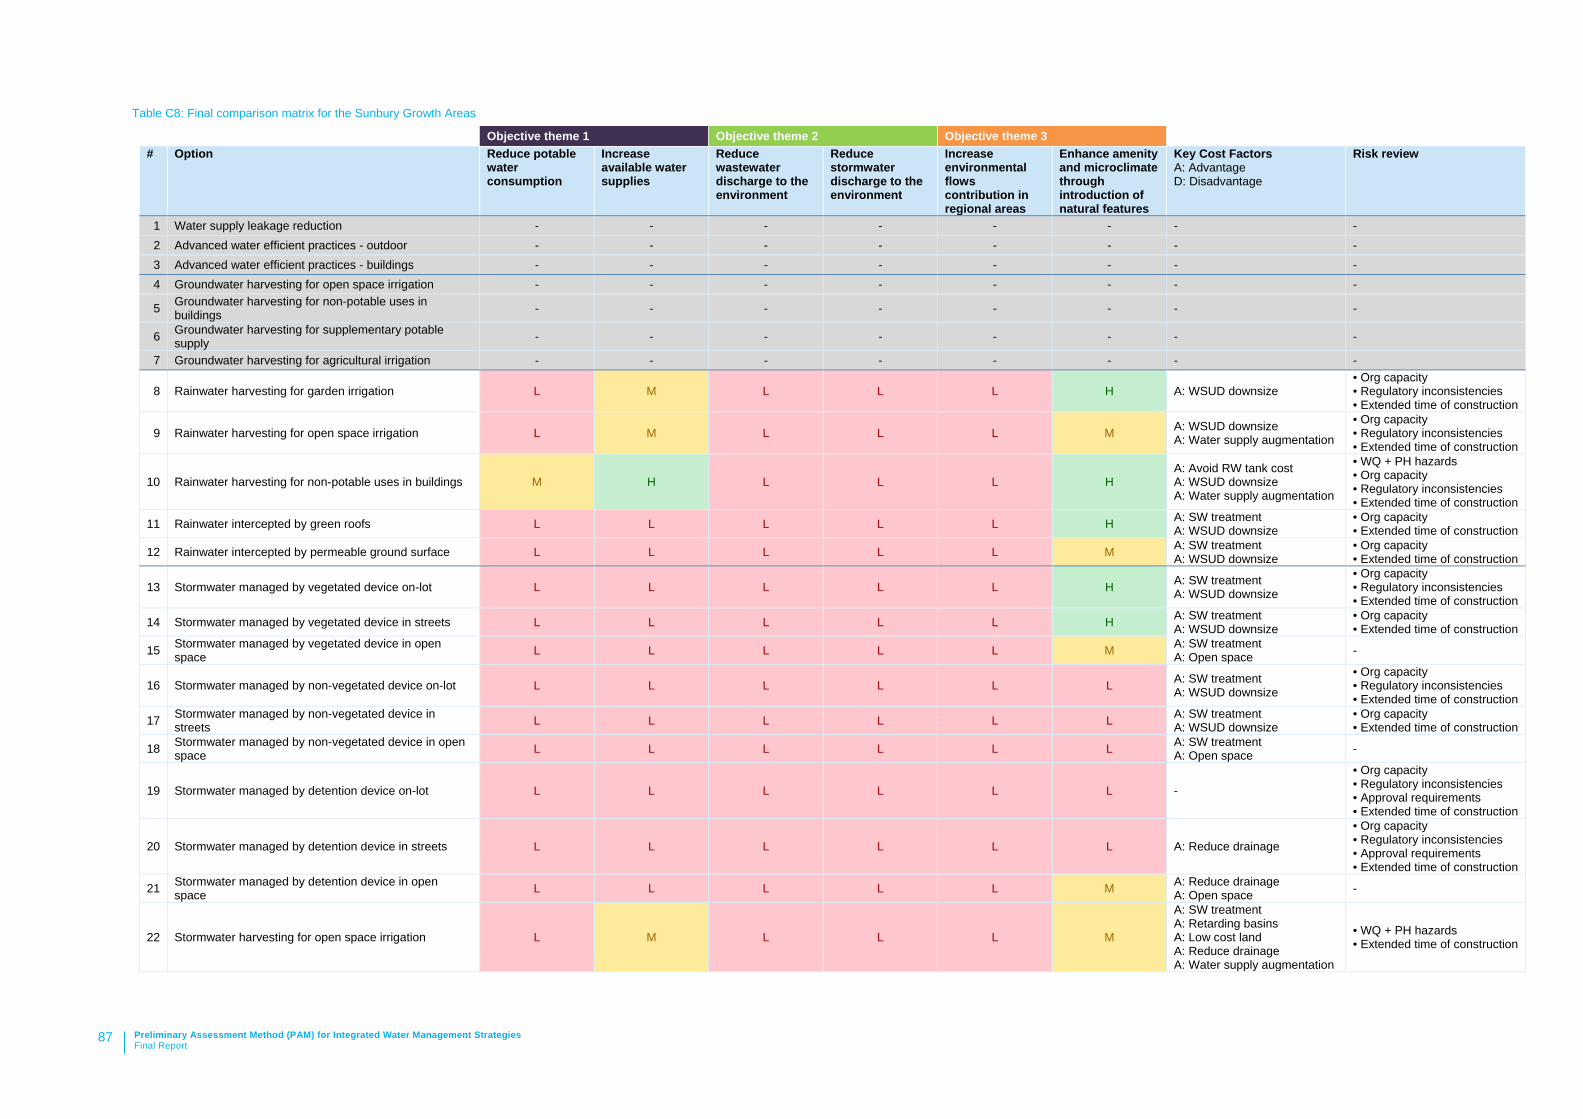
Preliminary Assessment Method (PAM) for Integrated Water Management Strategies Final Report
87
Table C8: Final comparison matrix for the Sunbury Growth Areas
Objective theme 1 Objective theme 2 Objective theme 3 # Option Reduce potable
water consumption
Increase available water supplies
Reduce wastewater discharge to the environment
Reduce stormwater discharge to the environment
Increase environmental flows contribution in regional areas
Enhance amenity and microclimate through introduction of natural features
Key Cost Factors A: Advantage D: Disadvantage
Risk review
1 Water supply leakage reduction - - - - - - - - 2 Advanced water efficient practices - outdoor - - - - - - - - 3 Advanced water efficient practices - buildings - - - - - - - - 4 Groundwater harvesting for open space irrigation - - - - - - - -
5 Groundwater harvesting for non-potable uses in buildings - - - - - - - -
6 Groundwater harvesting for supplementary potable supply - - - - - - - -
7 Groundwater harvesting for agricultural irrigation - - - - - - - -
8 Rainwater harvesting for garden irrigation L M L L L H A: WSUD downsize • Org capacity • Regulatory inconsistencies • Extended time of construction
9 Rainwater harvesting for open space irrigation L M L L L M A: WSUD downsize A: Water supply augmentation
• Org capacity • Regulatory inconsistencies • Extended time of construction
10 Rainwater harvesting for non-potable uses in buildings M H L L L H A: Avoid RW tank cost A: WSUD downsize A: Water supply augmentation
• WQ + PH hazards • Org capacity • Regulatory inconsistencies • Extended time of construction
11 Rainwater intercepted by green roofs L L L L L H A: SW treatment A: WSUD downsize
• Org capacity • Extended time of construction
12 Rainwater intercepted by permeable ground surface L L L L L M A: SW treatment A: WSUD downsize
• Org capacity • Extended time of construction
13 Stormwater managed by vegetated device on-lot L L L L L H A: SW treatment A: WSUD downsize
• Org capacity • Regulatory inconsistencies • Extended time of construction
14 Stormwater managed by vegetated device in streets L L L L L H A: SW treatment A: WSUD downsize
• Org capacity • Extended time of construction
15 Stormwater managed by vegetated device in open space L L L L L M A: SW treatment
A: Open space -
16 Stormwater managed by non-vegetated device on-lot L L L L L L A: SW treatment A: WSUD downsize
• Org capacity • Regulatory inconsistencies • Extended time of construction
17 Stormwater managed by non-vegetated device in streets L L L L L L A: SW treatment
A: WSUD downsize • Org capacity • Extended time of construction
18 Stormwater managed by non-vegetated device in open space L L L L L L A: SW treatment
A: Open space -
19 Stormwater managed by detention device on-lot L L L L L L -
• Org capacity • Regulatory inconsistencies • Approval requirements • Extended time of construction
20 Stormwater managed by detention device in streets L L L L L L A: Reduce drainage
• Org capacity • Regulatory inconsistencies • Approval requirements • Extended time of construction
21 Stormwater managed by detention device in open space L L L L L M A: Reduce drainage
A: Open space -
22 Stormwater harvesting for open space irrigation L M L L L M
A: SW treatment A: Retarding basins A: Low cost land A: Reduce drainage A: Water supply augmentation
• WQ + PH hazards • Extended time of construction

Preliminary Assessment Method (PAM) for Integrated Water Management Strategies Final Report
88
Objective theme 1 Objective theme 2 Objective theme 3 # Option Reduce potable
water consumption
Increase available water supplies
Reduce wastewater discharge to the environment
Reduce stormwater discharge to the environment
Increase environmental flows contribution in regional areas
Enhance amenity and microclimate through introduction of natural features
Key Cost Factors A: Advantage D: Disadvantage
Risk review
23 Stormwater harvesting for non-potable uses in buildings M H L L L H
A: SW treatment A: Retarding basins A: Storage A: Low cost land A: Avoid RW tank cost A: Reduce drainage A: Water supply augmentation
• WQ + PH hazards • Org capacity • Regulatory inconsistencies • Extended time of construction
24 Stormwater harvesting for supplementary potable supply H H L H L M
A: SW treatment A: Retarding basins A: Storage A: Low cost land A: Avoid RW tank cost A: Reduce drainage D: Shallow soils A: Water supply augmentation
• WQ + PH hazards • Org capacity • Regulatory inconsistencies • Approval requirements
25 Stormwater harvesting for agricultural irrigation L L L L L L
A: SW treatment A: Retarding basins A: Storage A: Low cost land A: Reduce drainage D: Shallow soils A: Water supply augmentation
• WQ + PH hazards • Regulatory inconsistencies
26 Treated stormwater distributed to lake or water feature - - - - - - - -
27 Treated stormwater distributed to land L L L L L L
A: SW treatment A: Retarding basins A: Storage A: Low cost land A: Reduce drainage D: Shallow soils
• Approval requirements
28 Treated stormwater distributed to evapotranspiration fields L L L L L M
A: SW treatment A: Retarding basins A: Open space
• WQ + PH hazards • Approval requirements
29 Treated stormwater distributed to environmental flows in waterway L H L L H M
A: SW treatment A: Retarding basins A: Storage
• WQ + PH hazards • Regulatory inconsistencies • Approval requirements
30 Wastewater managed by class B treatment device L L L L L L A: WW treatment A: Storage A: Low cost land
-
31 Wastewater managed by class A treatment device L L L L L L A: WW treatment A: Storage A: Low cost land
-
32 Treated wastewater for open space irrigation L M L L L M
A: WW treatment A: Storage A: Low cost land A: Water supply augmentation A: WW augmentation
• WQ + PH hazards • Extended time of construction
33 Treated wastewater for non-potable uses in buildings M H M L L H
A: WW treatment A: Storage A: Low cost land A: Avoid RW tank cost A: Water supply augmentation A: WW augmentation
• WQ + PH hazards • Extended time of construction
34 Treated wastewater for supplementary potable supply H H H L L M
A: WW treatment A: Storage A: Low cost land A: Avoid RW tank cost
• WQ + PH hazards • Org capacity • Regulatory inconsistencies • Approval requirements

Preliminary Assessment Method (PAM) for Integrated Water Management Strategies Final Report
89
Objective theme 1 Objective theme 2 Objective theme 3 # Option Reduce potable
water consumption
Increase available water supplies
Reduce wastewater discharge to the environment
Reduce stormwater discharge to the environment
Increase environmental flows contribution in regional areas
Enhance amenity and microclimate through introduction of natural features
Key Cost Factors A: Advantage D: Disadvantage
Risk review
A: Water supply augmentation A: WW augmentation D: Shallow soils
35 Treated wastewater for agricultural irrigation L L L L L L
A: WW treatment A: Storage A: Low cost land A: Water supply augmentation A: WW augmentation D: Shallow soils
• WQ + PH hazards
36 Treated wastewater distributed to lake or water feature - - - - - - -
37 Treated wastewater distributed to land L L M L L L
A: WW treatment A: Storage A: Low cost land A: WW augmentation D: Shallow soils
• Approval requirements
38 Treated wastewater distributed to evapotranspiration fields L L M L L M
A: WW treatment A: Open space A: Storage A: WW augmentation
• WQ + PH hazards • Approval requirements
39 Treated wastewater distributed to environmental flows in waterway L H H L H M
A: WW treatment A: Storage A: WW augmentation
• WQ + PH hazards • Regulatory inconsistencies • Approval requirements
40 Shandied treated wastewater and treated stormwater for open space irrigation L H L L L M
A: SW treatment A: Retarding basins A: WW treatment A: WSUD downsize A: Storage A: Low cost land
• WQ + PH hazards • Org capacity • Regulatory inconsistencies • Approval requirements • Extended time of construction
41 Shandied treated wastewater and treated stormwater for non-potable uses in buildings L H M L L H
A: SW treatment A: Retarding basins A: WW treatment A: Avoid RW tank cost A: WSUD downsize A: Storage A: Low cost land A: Water supply augmentation A: WW augmentation A: Reduce drainage
• WQ + PH hazards • Org capacity • Regulatory inconsistencies • Approval requirements
42 Shandied treated wastewater and treated stormwater for agriculture L L L L L L
A: SW treatment A: Retarding basins A: WW treatment A: WSUD downsize A: Storage A: Low cost land A: Water supply augmentation D: Shallow soils
• WQ + PH hazards • Org capacity • Regulatory inconsistencies • Approval requirements

Preliminary Assessment Method (PAM) for Integrated Water Management Strategies Final Report
90
Table C9: Final comparison matrix for the Sunbury Growth Areas – additional option combinations that utilise the same water source for greater benefit
Objective theme 1 Objective theme 2 Objective theme 3 # Option Reduce potable
water consumption
Increase available water supplies
Reduce wastewater discharge to the environment
Reduce stormwater discharge to the environment
Increase environmental flows contribution in regional areas
Enhance amenity and microclimate through introduction of natural features
Key Cost Factors A: Advantage D: Disadvantage
Risk review
8+10 Rainwater harvesting for garden irrigation + Rainwater harvesting for non-potable uses in buildings
M H L L L H A: Avoid RW tank cost A: WSUD downsize A: Water supply augmentation
• WQ + PH hazards • Org capacity • Regulatory inconsistencies • Extended time of construction
8+10+14+22
Rainwater harvesting for garden irrigation + Rainwater harvesting for non-potable uses in buildings + Stormwater managed by vegetated device in streets + Stormwater harvesting for open space irrigation
M H L H L H
A: SW treatment A: Retarding basins A: Low cost land A: Reduce drainage A: Water supply augmentation
• WQ + PH hazards • Extended time of construction
22+23
Stormwater harvesting for open space irrigation + Stormwater harvesting for non-potable uses in buildings
M H L M L H
A: SW treatment A: Retarding basins A: Storage A: Low cost land A: Avoid RW tank cost A: Reduce drainage A: Water supply augmentation
• WQ + PH hazards • Org capacity • Regulatory inconsistencies • Extended time of construction
22+23+27
Stormwater harvesting for open space irrigation + Stormwater harvesting for non-potable uses in buildings + Treated stormwater distributed to land
M H L H L H
A: SW treatment A: Retarding basins A: Storage A: Low cost land A: Avoid RW tank cost A: Reduce drainage A: Water supply augmentation
• WQ + PH hazards • Org capacity • Regulatory inconsistencies • Extended time of construction
32+33 Treated wastewater for open space irrigation + Treated wastewater for non-potable uses in buildings
M H M L L H
A: WW treatment A: Storage A: Low cost land A: Avoid RW tank cost A: Water supply augmentation A: WW augmentation
• WQ + PH hazards • Extended time of construction
32+33+37
Treated wastewater for open space irrigation + Treated wastewater for non-potable uses in buildings + Treated wastewater distributed to land
M H H L L H
A: WW treatment A: Storage A: Low cost land A: Avoid RW tank cost A: Water supply augmentation A: WW augmentation
• WQ + PH hazards • Extended time of construction
40+ 41
Shandied treated wastewater and treated stormwater for open space irrigation + Shandied treated wastewater and treated stormwater for non-potable uses in buildings
L H M L L H
A: SW treatment A: Retarding basins A: WW treatment A: Avoid RW tank cost A: WSUD downsize A: Storage A: Low cost land A: Water supply augmentation A: WW augmentation A: Reduce drainage
• WQ + PH hazards • Org capacity • Regulatory inconsistencies • Approval requirements

Preliminary Assessment Method (PAM) for Integrated Water Management Strategies Final Report
91
Stage 3: Shortlisting of Portfolios The ‘optimisation’ method of shortlisting was adopted in order to achieve the best cost-benefit for the objectives of the project.
The two objectives under theme 2, which relate to wastewater and stormwater discharge reductions, were selected as minimum levels of service to help filter out core options. Only options with a ‘Mid’ to ‘High’ score in one or more of these categories were considered to be core options. Review of the comparison matrix with individual options (Table C8) resulted in the identification of the following core options:
A. #24: Stormwater harvesting for supplementary potable supply B. #33: Treated wastewater for non-potable uses in buildings C. #34: Treated wastewater for supplementary potable supply D. #39: Treated wastewater distributed to environmental flows in waterway
Review of the additional combinations of options in Table C9 which utilise combinations within the same water stream which could increase benefits (though also increase cost through multiple investments). By comparing combinations of options in the same water stream in terms of the relative gain in benefit compared to the increase in infrastructure delivery (and likely cost), the following additional core options were identified:
E. Combo 1: #8 + #10 + #14 + #22: Rainwater harvesting for garden irrigation + Rainwater harvesting for non-potable uses in buildings + Stormwater managed by vegetated device in streets + Stormwater harvesting for open space irrigation
F. Combo 2: #22 + #23: Stormwater harvesting for open space irrigation + Stormwater harvesting for non-potable uses in buildings
G. Combo 3: #32 + #33: Treated wastewater for open space irrigation + Treated wastewater for non-potable uses in buildings
Option G was deemed to supersede option B as the combination of supply to non-potable supply in buildings and to open space, leaving six core options for analysis.
These options meet the minimum levels of service as they disposal of large quantities of wastewater or stormwater. This can be achieved by supplementing the potable supply with these alternative water sources. Other demands serviced by the core options include non-potable uses in buildings and environmental flows. The comparison matrix also indicates that the core options are capable of achieving considerable benefits under objectives themes 1 and/or 3.
Once the core options had been collated other strongly performing options were cross referenced to identify whether or not they could be complimentary. The results are presented in Table C10.

Preliminary Assessment Method (PAM) for Integrated Water Management Strategies Final Report
92
Using the summary of core options and complimentary options, and informed by a consideration of supply/demand conflicts and hierarchy of use to create portfolios for analysis. The priority portfolios are summarised in Table C11.
As there are too many portfolios in the priority list for detailed analysis, the portfolios were assembled in a benefit assessment (by combining benefits attributable to core options and complimentary options). The results are shown in Table C12. Based on this assessment a first round of shortlisted portfolios were identified for detailed analysis.
• Portfolio 1b: Stormwater harvesting for supplementary potable supply + Treated wastewater distributed to environmental flows in waterway
• Portfolio 2a: Combo 3 (Treated wastewater for non-potable uses in buildings + open space) + Stormwater harvesting for supplementary potable supply
• Portfolio 5a: Combo 2 (Rainwater harvesting for garden irrigation + Rainwater harvesting for non-potable uses in buildings + Stormwater managed by vegetated device in streets + Stormwater harvesting for open space irrigation) + Treated wastewater for supplementary potable supply
• Portfolio 5c: Combo 1 (Rainwater harvesting for garden irrigation + Rainwater harvesting for non-potable uses in buildings + Stormwater managed by vegetated device in streets + Stormwater harvesting for open space irrigation) + Treated wastewater distributed to environmental flows in waterway
During the detailed analysis, it may be that the stakeholders gain more insight into the relative performance and costs of options, leading to options being refined or replaced and another iteration of detailed analysis taking place. The PAM results should be revisited and adjusted at this stage to keep a record of decisions.

Preliminary Assessment Method (PAM) for Integrated Water Management Strategies Final Report
93
Table C10: Assembly of core options and complimentary options
Core options Complimentary options6 Comments 24 Stormwater harvesting
for supplementary potable supply
22 Stormwater harvesting for open space irrigation Hierarchy of use would support extraction of stormwater for irrigation before it is treated to potable standard. 29 Treated stormwater distributed to environmental flows in waterway Hierarchy of use would support extraction of stormwater for environmental flows before it is treated to potable standard. 32 Treated wastewater for open space irrigation Hierarchy of use would support use of wastewater treated to a Class A standard. 33 Treated wastewater for non-potable uses in buildings The combination of option #33 and #24 makes more sense from a hierarchy of use perspective than a combination of
option #24 and #34. The former combination would require a dual pipe network whereas the latter wouldn’t. 34 Treated wastewater for supplementary potable supply Could shandy both of these alternative water supplies. However, there would be an oversupply of alternative water as
stormwater alone is likely sufficient to cover all new potable demands. This may be suitable if alternative water is exported for use in existing developments within Sunbury via the Rosslynne Reservoir.
37 Treated wastewater distributed to land No supply/demand conflict. 38 Treated wastewater distributed to evapotranspiration fields Preferable to use stormwater treated to a non-potable standard for this application. 39 Treated wastewater distributed to environmental flows in waterway No supply/demand conflict. 41 Shandied treated wastewater and treated stormwater for non-potable uses
in buildings Could shandy both of these alternative water supplies. However, wastewater alone is likely sufficient to cover the all non-potable uses in buildings. May need to consider shandied supply for supplementary potable supply as an alternative option.
32+ 33
Treated wastewater for non-potable uses in buildings + open space
8 Rainwater harvesting for garden irrigation No supply/demand conflict as wastewater is not proposed to service these demands. On their own the combination of #33 with any of these complimentary options would fail to deliver a ‘Mid’ or “High’ reduction in stormwater discharge. However, combination #33 with one or more of these options, as well as options #11, #12, #25, #27, #28 or #29 may be able to satisfy this objective. Alternative, commination #33 with #24 would meet the stormwater objective with no other combinations required. Inclusion of #10 as a minimum stormwater benefit suggested.
9 Rainwater harvesting for open space irrigation
10 Rainwater harvesting for non-potable uses in buildings
22 Stormwater harvesting for open space irrigation
24 Stormwater harvesting for supplementary potable supply Could shandy both of these alternative water supplies. However, there would be an oversupply of alternative water as stormwater alone is likely sufficient to cover all new potable demands. This may be suitable if alternative water is exported for use in existing developments within Sunbury via the Rosslynne Reservoir. The combination of option #33 and #24 makes more sense from a hierarchy of use perspective than a combination of option #24 and #34.
29 Treated stormwater distributed to environmental flows in waterway Limited supply/demand conflict as there is insufficient wastewater to supply all non-potable uses in buildings and environmental flows.
34 Treated wastewater for supplementary potable supply The natural extension or expansion of this option, going directly to this option would avoid the considerable cost of dual reticulation. However, the provision of dual reticulation does not preclude a staged progression from #33 to #34.
37 Treated wastewater distributed to land Limited supply/demand conflict as there is insufficient wastewater to supply all non-potable uses in buildings and apply to land.
38 Treated wastewater distributed to evapotranspiration fields Use of treated stormwater distributed to evapotranspiration fields (option # 28) is preferable for this application. 39 Treated wastewater distributed to environmental flows in waterway There is insufficient wastewater to supply all non-potable uses in buildings and environmental flows with wastewater.
Consequently combination with option # 29 may be preferable. 41 Shandied treated wastewater and treated stormwater for non-potable uses
in buildings Could shandy both of these alternative water supplies. However, wastewater alone is likely sufficient to cover the all non-potable uses in buildings. May need to consider shandied supply for supplementary potable supply as an alternative option.
34 Treated wastewater for supplementary potable supply
8 Rainwater harvesting for garden irrigation Limited supply/demand conflict as there is insufficient wastewater to supply all potable demands. On their own the combination of #34 with any of these complimentary options would fail to deliver a ‘Mid’ or “High’ reduction in stormwater discharge. However, combination #34 with one or more of these options, as well as options #11, #12, #25, #27, #28 or #29 may be able to satisfy this objective. Alternative, commination #34 with #24 would meet the stormwater objective with no other combinations required. Inclusion of #10 as a minimum stormwater benefit suggested.
9 Rainwater harvesting for open space irrigation
10 Rainwater harvesting for non-potable uses in buildings
22 Stormwater harvesting for open space irrigation
24 Stormwater harvesting for supplementary potable supply Could shandy both of these alternative water supplies. However, there would be an oversupply of alternative water as stormwater alone is likely sufficient to cover all new potable demands. This may be suitable if alternative water is exported
6 Only options that delivered ‘Mid’ to ‘High’ benefits across one or more of the objectives were considered, bold denotes a complimentary core option, italics denotes a complimentary option that delivered ‘Mid’ to ‘High’ benefits across three or more of the objectives.

Preliminary Assessment Method (PAM) for Integrated Water Management Strategies Final Report
94
for use in existing developments within Sunbury via the Rosslynne Reservoir. The combination of option #33 and #24 makes more sense from a hierarchy of use perspective than a combination of option #24 and #34.
29 Treated stormwater distributed to environmental flows in waterway Limited supply/demand conflict as there is insufficient wastewater to supply all potable demands. Also supported by the hierarchy of use as stormwater need not be treated to potable standard for this application.
32 Treated wastewater for open space irrigation Creates a demand conflict as there is insufficient wastewater to supply all potable demands. Hierarchy of use would support use of wastewater treated to a Class A standard for this application, making less wastewater available to augment the potable supply.
38 Treated wastewater distributed to evapotranspiration fields Creates a demand conflict as there is insufficient wastewater to supply all potable demands. Hierarchy of use would support use of wastewater treated to a Class A standard for this application, making less wastewater available to augment the potable supply. Use of treated stormwater distributed to evapotranspiration fields (option # 28) is preferable for this application.
39 Treated wastewater distributed to environmental flows in waterway There is insufficient wastewater to supply all potable demands and environmental flows with wastewater. Consequently combination with option # 29 may be preferable.
41 Shandied treated wastewater and treated stormwater for non-potable uses in buildings
Could shandy both of these alternative water supplies. However, wastewater alone is likely sufficient to cover the all non-potable uses in buildings. May need to consider shandied supply for supplementary potable supply as an alternative option.
39 Treated wastewater distributed to environmental flows in waterway
8 Rainwater harvesting for garden irrigation No supply/demand conflict as wastewater is not proposed to service these demands. On their own the combination of #39 with any of these complimentary options would fail to deliver a ‘Mid’ or “High’ reduction in stormwater discharge. However, combination #39 with one or more of these options, as well as options #11, #12, #25, #27 or #28 may be able to satisfy this objective. Alternative, commination #39 with #24 would meet the stormwater objective with no other combinations required.
9 Rainwater harvesting for open space irrigation
10 Rainwater harvesting for non-potable uses in buildings
22 Stormwater harvesting for open space irrigation
23 Stormwater harvesting for non-potable uses in buildings
24 Stormwater harvesting for supplementary potable supply Limited supply/demand conflict as it would probably be uneconomical to use stormwater to supply all potable demands and environmental flows.
32 Treated wastewater for open space irrigation Hierarchy of use would support use of wastewater treated to a Class A standard. There is sufficient wastewater to supply both of these demands with treated wastewater,
33 Treated wastewater for non-potable uses in buildings Creates a demand conflict as there is insufficient wastewater to supply all environmental flows and non-potable uses in buildings. Hierarchy of use would support use of wastewater treated to a lower standard for environmental flows. This use would have priority, making less wastewater available to supply non-potable uses.
34 Treated wastewater for supplementary potable supply Creates a demand conflict as there is insufficient wastewater to supply all environmental flows and new potable demands. Hierarchy of use would support use of wastewater treated to a lower standard for environmental flows. This use would have priority, making less wastewater available to augment the potable supply
#8 + #10 + #14 + #22
Combo 1: Rainwater harvesting for garden irrigation + Rainwater harvesting for non-potable uses in buildings + Stormwater managed by vegetated device in streets + Stormwater harvesting for open space irrigation
29 Treated stormwater distributed to environmental flows in waterway Possible conflict due to limited availability of stormwater following prior use. 32 Treated wastewater for open space irrigation Supply conflict. 33 Treated wastewater for non-potable uses in buildings Supply conflict with rainwater tanks, though rainwater could be used for hot water only. 34 Treated wastewater for supplementary potable supply No supply/demand conflict. 37 Treated wastewater distributed to land No supply/demand conflict. 38 Treated wastewater distributed to evapotranspiration fields Preferable to use stormwater treated to a non-potable standard for this application. 39 Treated wastewater distributed to environmental flows in waterway No supply/demand conflict. 41 Shandied treated wastewater and treated stormwater for non-potable uses
in buildings Wastewater alone is likely sufficient to cover the all non-potable uses in buildings. May need to consider shandied supply for supplementary potable supply as an alternative option.
#22 + #23
Combo 2: Stormwater harvesting for non-potable uses in buildings + open space
29 Treated stormwater distributed to environmental flows in waterway Possible conflict due to limited availability of stormwater following prior use. 32 Treated wastewater for open space irrigation Supply conflict. 33 Treated wastewater for non-potable uses in buildings Supply conflict. 34 Treated wastewater for supplementary potable supply Stormwater preferable for potable supply, and if not harnessed here as an option, wastewater for potable supply is unlikely. 37 Treated wastewater distributed to land No supply/demand conflict. 38 Treated wastewater distributed to evapotranspiration fields Preferable to use stormwater treated to a non-potable standard for this application. 39 Treated wastewater distributed to environmental flows in waterway No supply/demand conflict. 41 Shandied treated wastewater and treated stormwater for non-potable uses
in buildings Stormwater alone is likely sufficient to cover the all non-potable uses in buildings. May need to consider shandied supply for supplementary potable supply as an alternative option.

Preliminary Assessment Method (PAM) for Integrated Water Management Strategies Final Report
95
Table C11: Priority portfolios (with duplicates struck out) Portfolio 1 Core option #24: Stormwater harvesting for supplementary potable supply Complimentary options
a) Treated wastewater distributed to land b) Treated wastewater distributed to environmental flows in waterway
Portfolio 2 Core option #32 + #33: Treated wastewater for non-potable uses in buildings + open space Complimentary options
a) Stormwater harvesting for supplementary potable supply b) Rainwater harvesting for non-potable uses in buildings
Portfolio 3 Core option #34: Treated wastewater for supplementary potable supply Complimentary options
a) Rainwater harvesting for non-potable uses in buildings
Portfolio 4 Core option #39: Treated wastewater distributed to environmental flows in waterway Complimentary options
a) Stormwater harvesting for supplementary potable supply (duplicate of 1b) Portfolio 5 Core option combo 1 (#8+#10+#14+#22): Rainwater harvesting for garden irrigation + Rainwater harvesting for non-potable uses in buildings + Stormwater managed by vegetated device in streets + Stormwater harvesting for open space irrigation Complimentary options
a) Treated wastewater for supplementary potable supply b) Treated wastewater distributed to land c) Treated wastewater distributed to environmental flows in waterway
Portfolio 6 Core option combo 2 (#22 + #23): Stormwater harvesting for non-potable uses in buildings + open space Complimentary options
a) Treated wastewater distributed to land b) Treated wastewater distributed to environmental flows in waterway

Preliminary Assessment Method (PAM) for Integrated Water Management Strategies Final Report
96
Table C12: Portfolio comparison matrix
Objective theme 1 Objective theme 2 Objective theme 3 # Portfolio Reduce potable
water consumption Increase available water supplies
Reduce wastewater discharge to the environment
Reduce stormwater discharge to the environment
Increase environmental flows contribution in regional areas
Enhance amenity and microclimate through introduction of natural features
1a
Stormwater harvesting for supplementary potable supply + Treated wastewater distributed to land
H H M H L M
1b Stormwater harvesting for supplementary potable supply + Treated wastewater distributed to environmental flows in waterway
H H H H H M
2a Treated wastewater for non-potable uses in buildings + open space + Stormwater harvesting for supplementary potable supply
H H M H L H
2b Treated wastewater for non-potable uses in buildings + open space + Rainwater harvesting for non-potable uses in buildings
M H M L L H
3a Treated wastewater for supplementary potable supply + Rainwater harvesting for non-potable uses in buildings
H H H L L M
5a
Rainwater harvesting for garden irrigation + Rainwater harvesting for non-potable uses in buildings + Stormwater managed by vegetated device in streets + Stormwater harvesting for open space irrigation + Treated wastewater for supplementary potable supply
H H H H L H
5b
Rainwater harvesting for garden irrigation + Rainwater harvesting for non-potable uses in buildings + Stormwater managed by vegetated device in streets + Stormwater harvesting for open space irrigation + Treated wastewater distributed to land
M H M H L H
5c
Rainwater harvesting for garden irrigation + Rainwater harvesting for non-potable uses in buildings + Stormwater managed by vegetated device in streets + Stormwater harvesting for open space irrigation + Treated wastewater distributed to environmental flows in waterway
M H H H H H
6a Stormwater harvesting for non-potable uses in buildings + open space + Treated wastewater distributed to land
M H M M L H
6b Stormwater harvesting for non-potable uses in buildings + open space + Treated wastewater distributed to environmental flows in waterway
M H H M L H