marmot review: fair society, healthy livescfoaservices.co.uk/pdf/professorsirmichaelmarmot.pdf ·...
TRANSCRIPT
Marmot Review: Fair Society, Healthy Lives
Professor Sir Michael Marmot Dying for Data Conference 30th April 2014
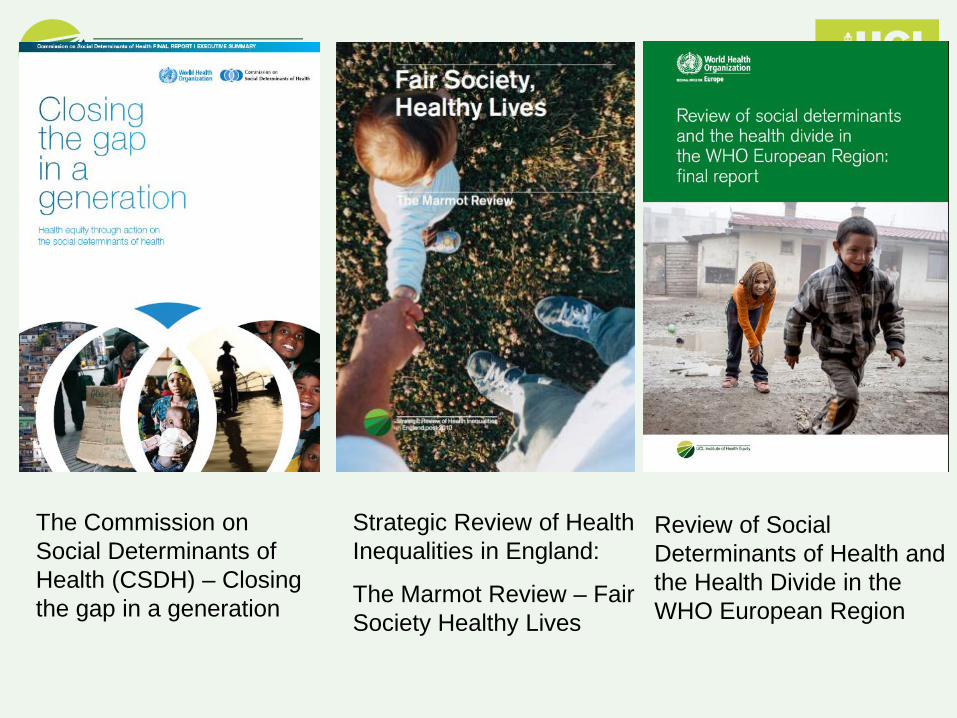
The Commission on Social Determinants of Health (CSDH) – Closing the gap in a generation
Strategic Review of Health Inequalities in England:
The Marmot Review – Fair Society Healthy Lives
Review of Social Determinants of Health and the Health Divide in the WHO European Region
A. Give every child the best start in life B. Enable all children, young people and adults to maximise
their capabilities and have control over their lives C. Create fair employment and good work for all D. Ensure healthy standard of living for all E. Create and develop healthy and sustainable places and
communities F. Strengthen the role and impact of ill health prevention
Fair Society, Healthy Lives: 6 Policy Recommendations
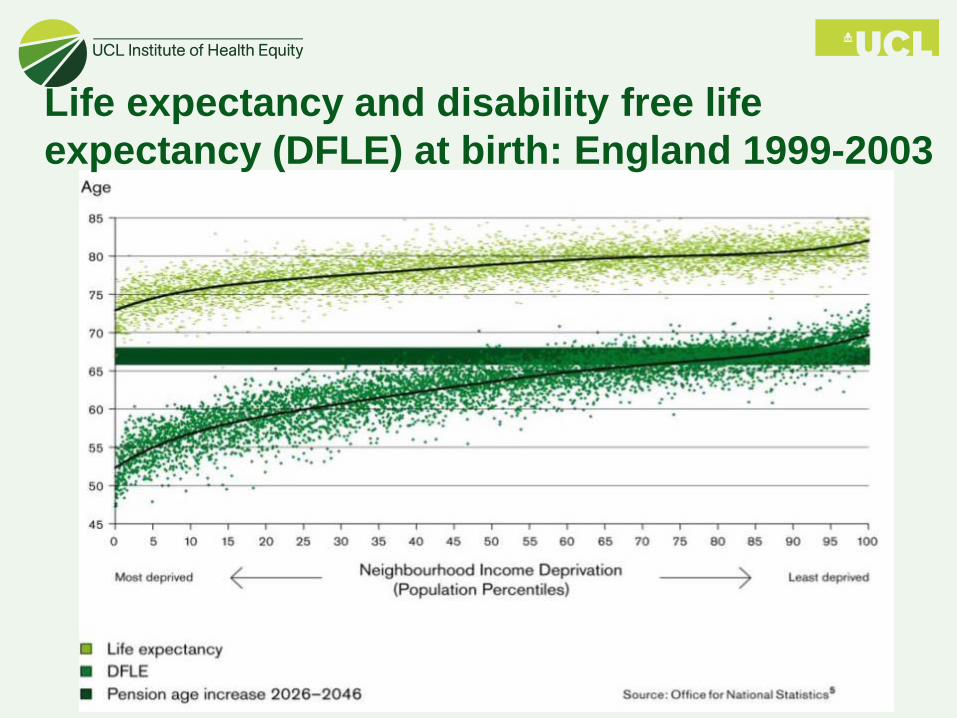
Life expectancy and disability free life expectancy (DFLE) at birth: England 1999-2003
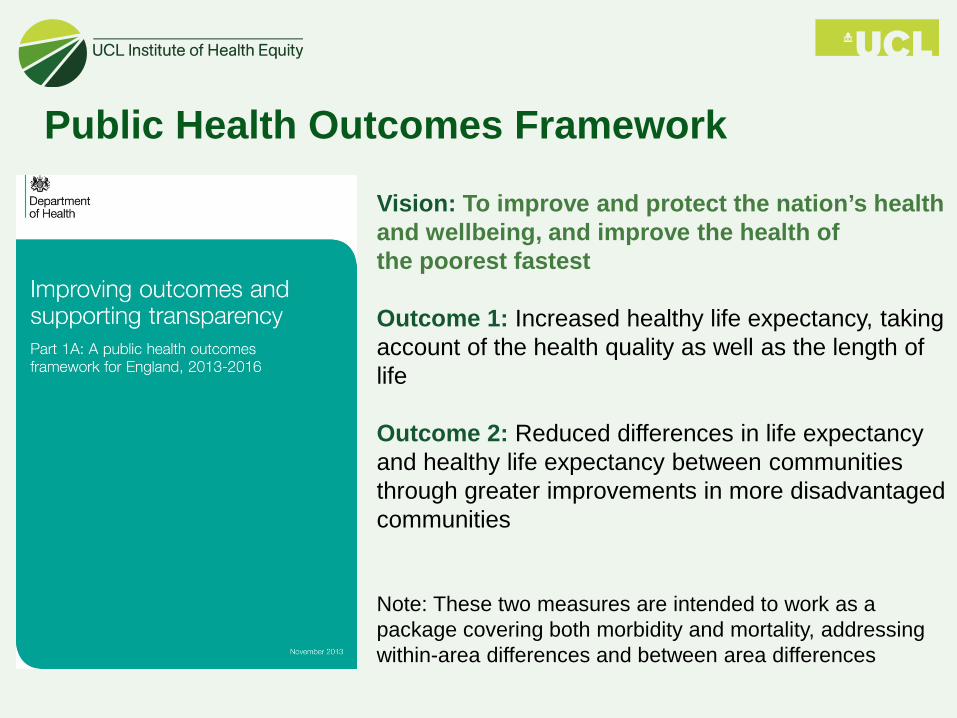
Public Health Outcomes Framework
Vision: To improve and protect the nation’s health and wellbeing, and improve the health of the poorest fastest Outcome 1: Increased healthy life expectancy, taking account of the health quality as well as the length of life Outcome 2: Reduced differences in life expectancy and healthy life expectancy between communities through greater improvements in more disadvantaged communities Note: These two measures are intended to work as a package covering both morbidity and mortality, addressing within-area differences and between area differences
Health and Social Care Act 2012
• Legal duties to reduce health inequalities for the first time
• Public Health transfers to Local Authorities • Health and Well Being Boards in operation • Platform for joining up health services, social
care services and health-related services at local level
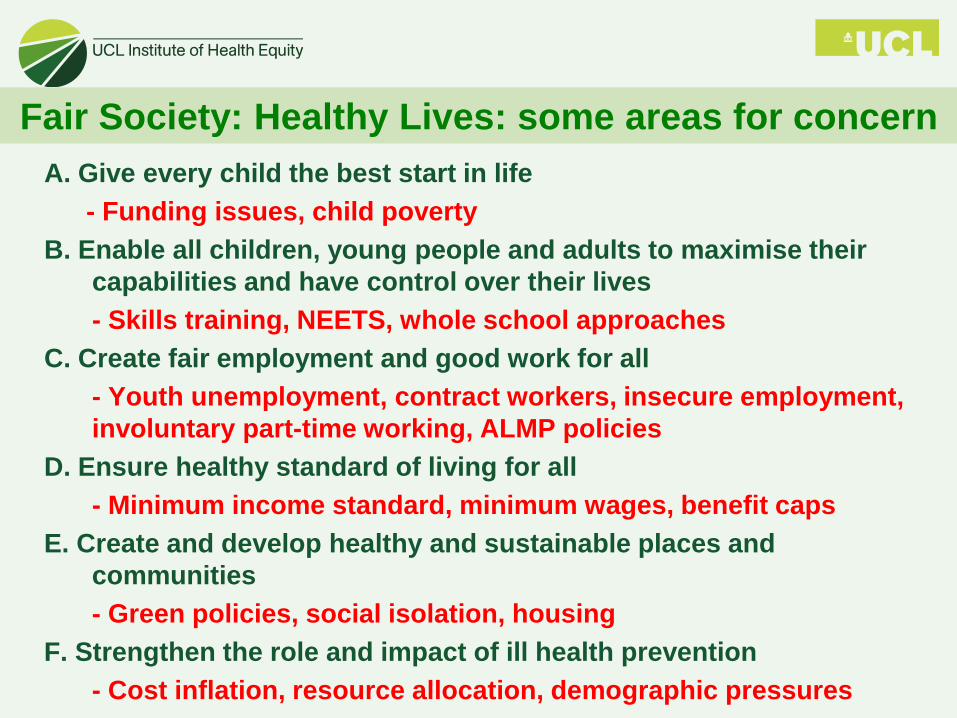
A. Give every child the best start in life - Funding issues, child poverty
B. Enable all children, young people and adults to maximise their capabilities and have control over their lives
- Skills training, NEETS, whole school approaches C. Create fair employment and good work for all - Youth unemployment, contract workers, insecure employment,
involuntary part-time working, ALMP policies D. Ensure healthy standard of living for all - Minimum income standard, minimum wages, benefit caps E. Create and develop healthy and sustainable places and
communities - Green policies, social isolation, housing F. Strengthen the role and impact of ill health prevention - Cost inflation, resource allocation, demographic pressures
Fair Society: Healthy Lives: some areas for concern

6.7 million of the 13 million people in poverty are in working households, UK 2011/12
(JRF 2013 using DWP data)
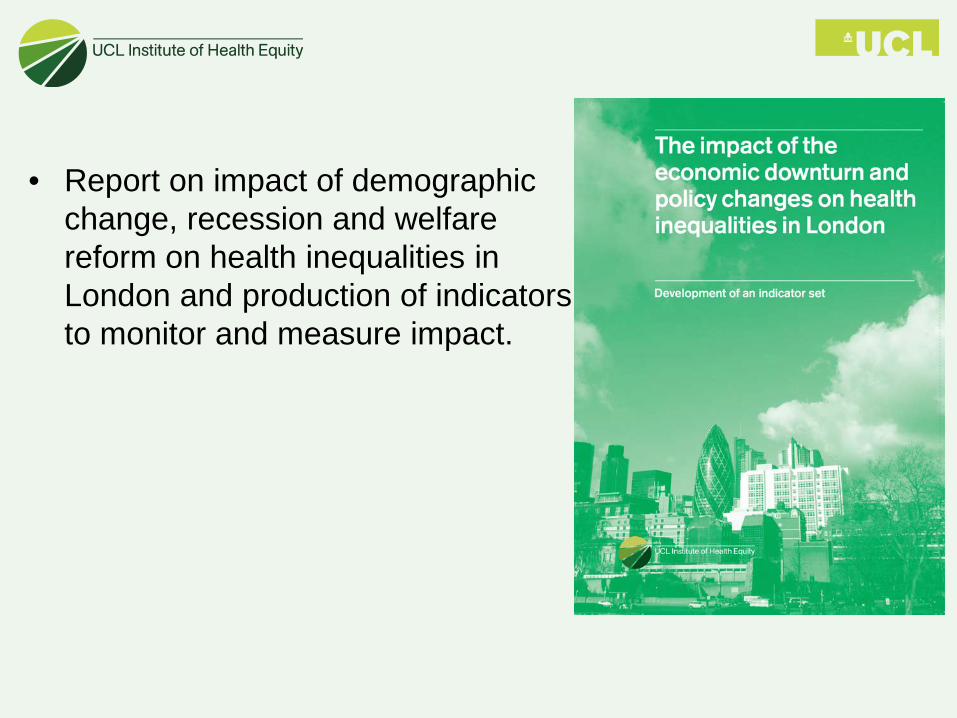
• Report on impact of demographic change, recession and welfare reform on health inequalities in London and production of indicators to monitor and measure impact.
Recession indicators • Piloted in 4 London boroughs
• Data now for available for all London boroughs
http://www.lho.org.uk/lho_topics/data/economicdownturn.aspx These data will need to be supplemented by data that is only available locally
Lambeth as example: profile of social determinants of health during the economic downturn
• Four domains: – Employment – Economic security – Housing – Health and well being
Published at http://www.instituteofhealthequity.org 3rd March 2014
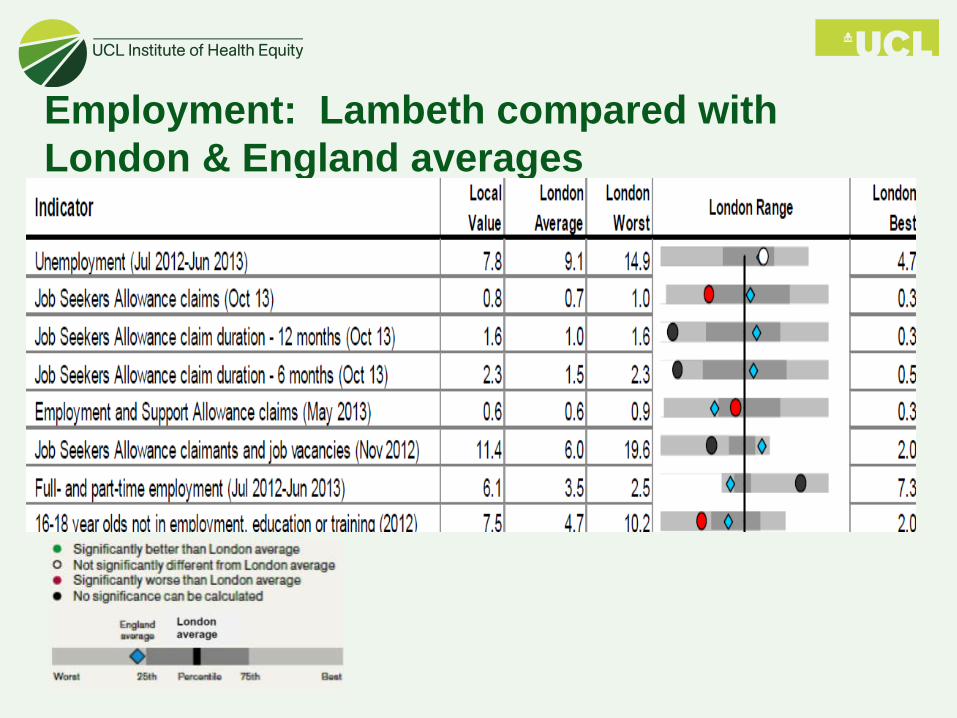
Employment: Lambeth compared with London & England averages
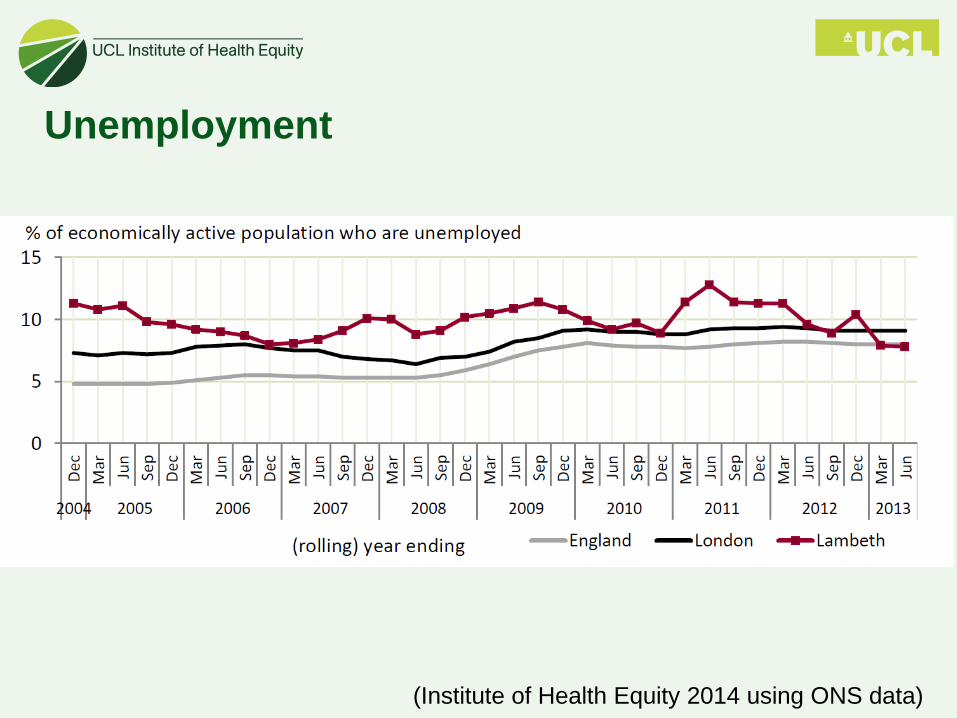
Unemployment
(Institute of Health Equity 2014 using ONS data)
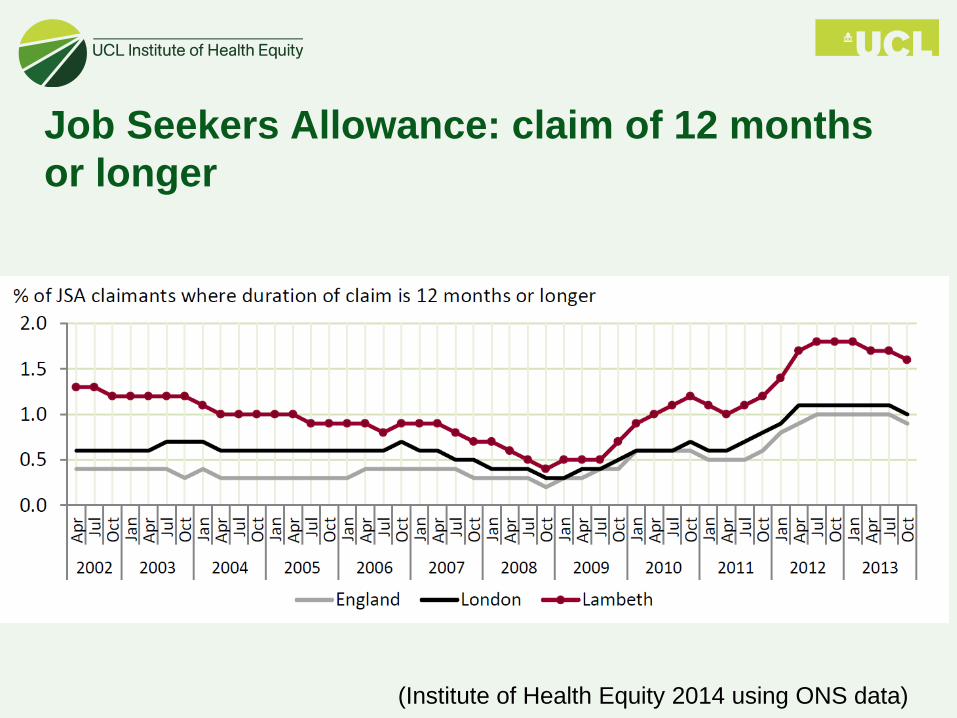
Job Seekers Allowance: claim of 12 months or longer
(Institute of Health Equity 2014 using ONS data)
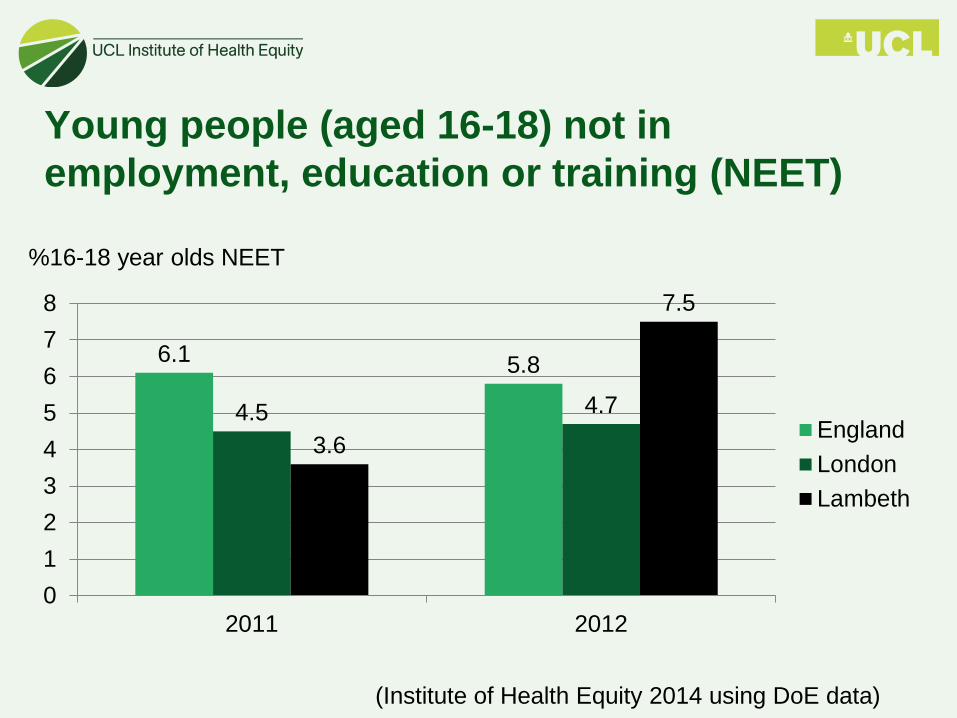
Young people (aged 16-18) not in employment, education or training (NEET)
6.1 5.8
4.5 4.7
3.6
7.5
012345678
2011 2012
EnglandLondonLambeth
(Institute of Health Equity 2014 using DoE data)
%16-18 year olds NEET

Economic security: Lambeth compared with London & England averages
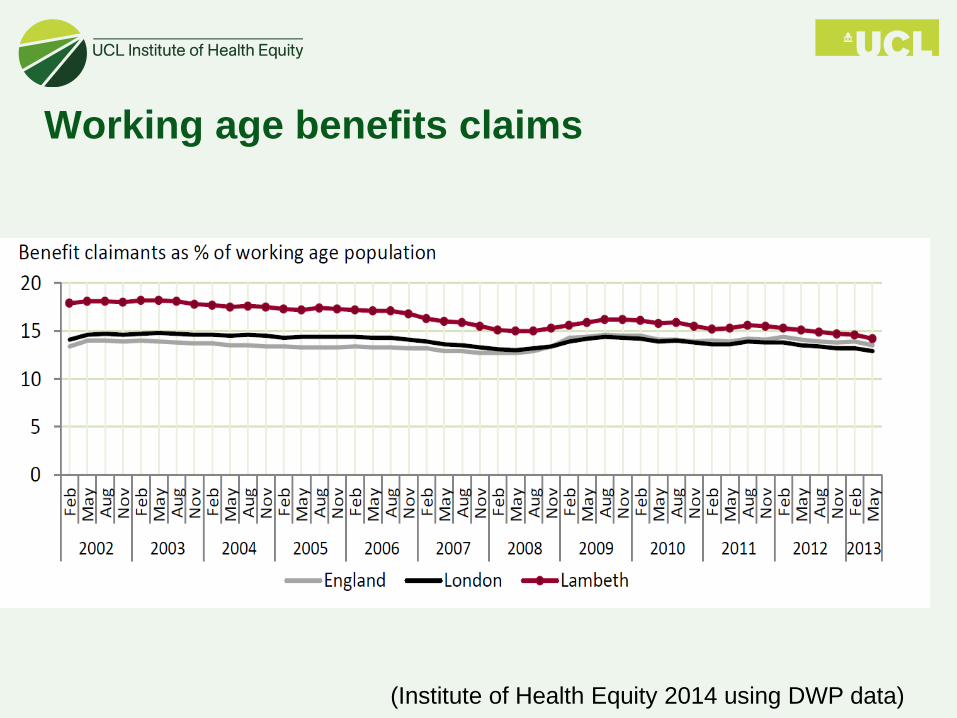
Working age benefits claims
(Institute of Health Equity 2014 using DWP data)
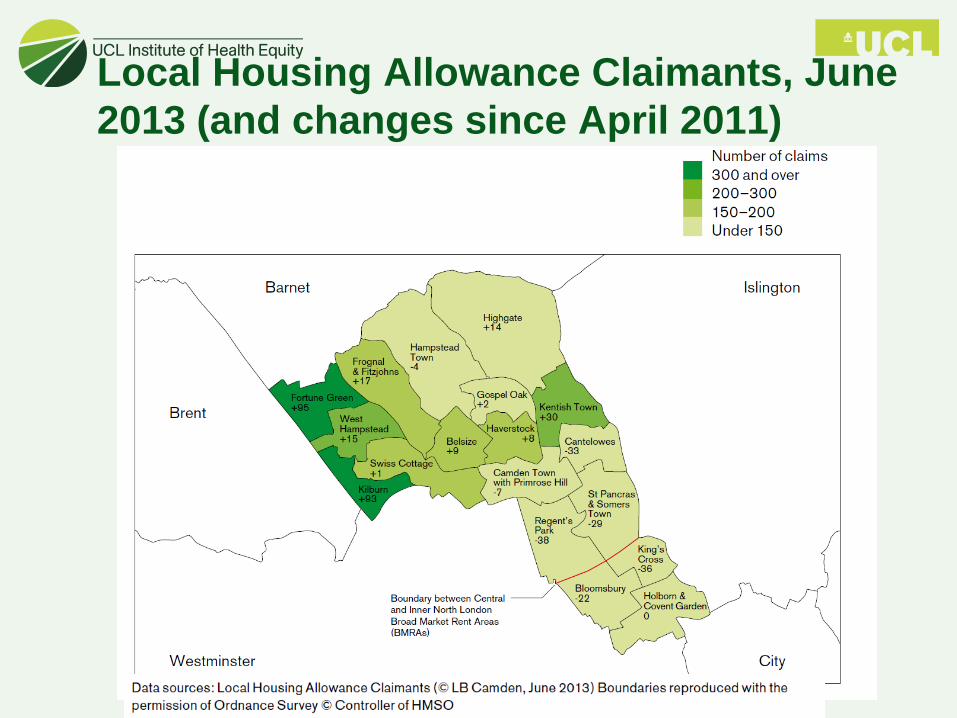
Local Housing Allowance Claimants, June 2013 (and changes since April 2011)
Insufficient incomes
• Fall in collection performance of housing rents between April and May 2013 (Lambeth);
• Increase in rent arrears; • 10% households in London in fuel poverty (2011
data)
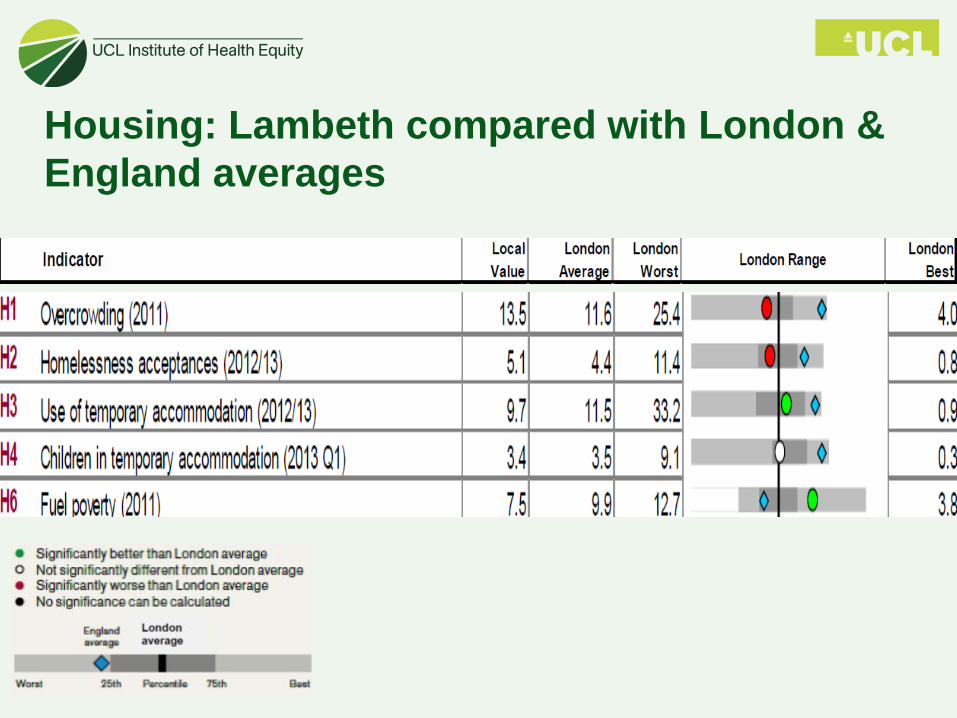
Housing: Lambeth compared with London & England averages

Overcrowding
4.8
11.6 13.5
02468
10121416
England London Lambeth
% of overcrowded households
(Institute of Health Equity 2014 using DCLG data)
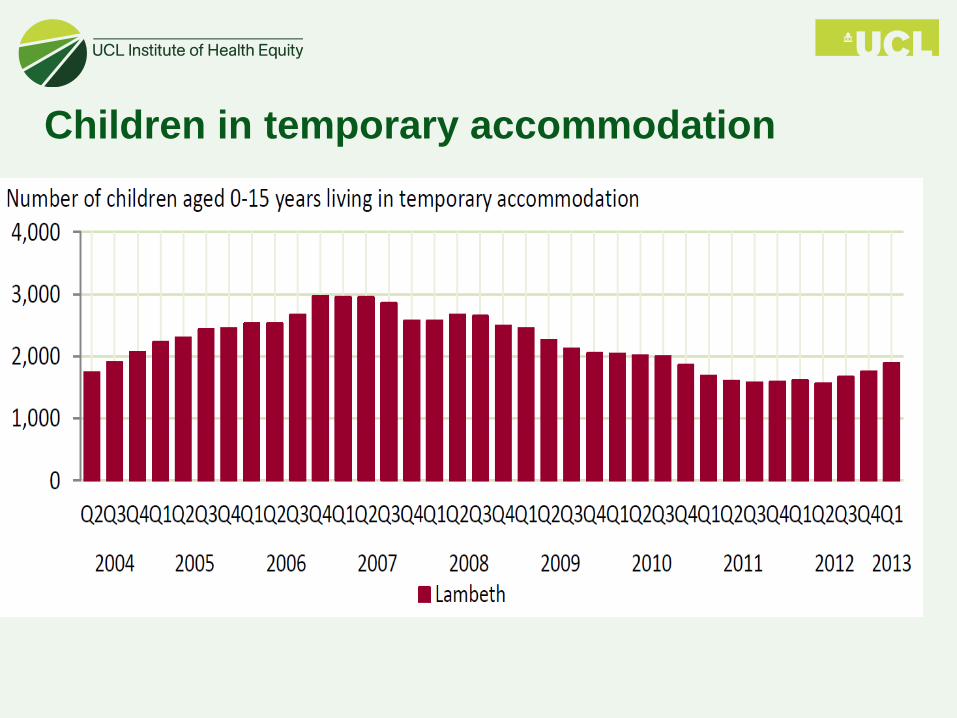
Children in temporary accommodation
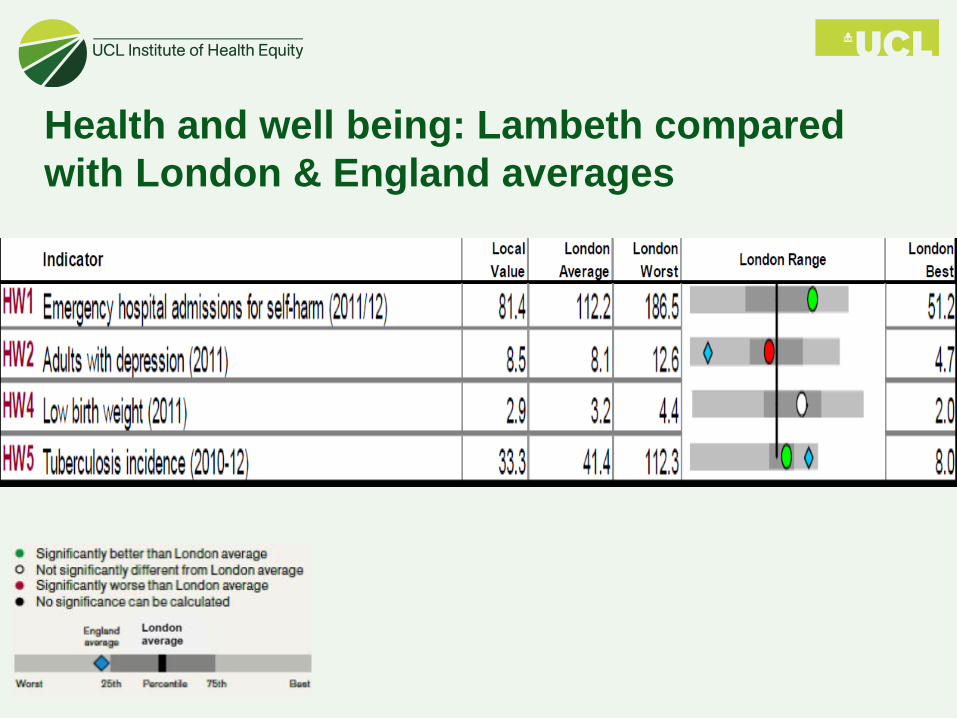
Health and well being: Lambeth compared with London & England averages
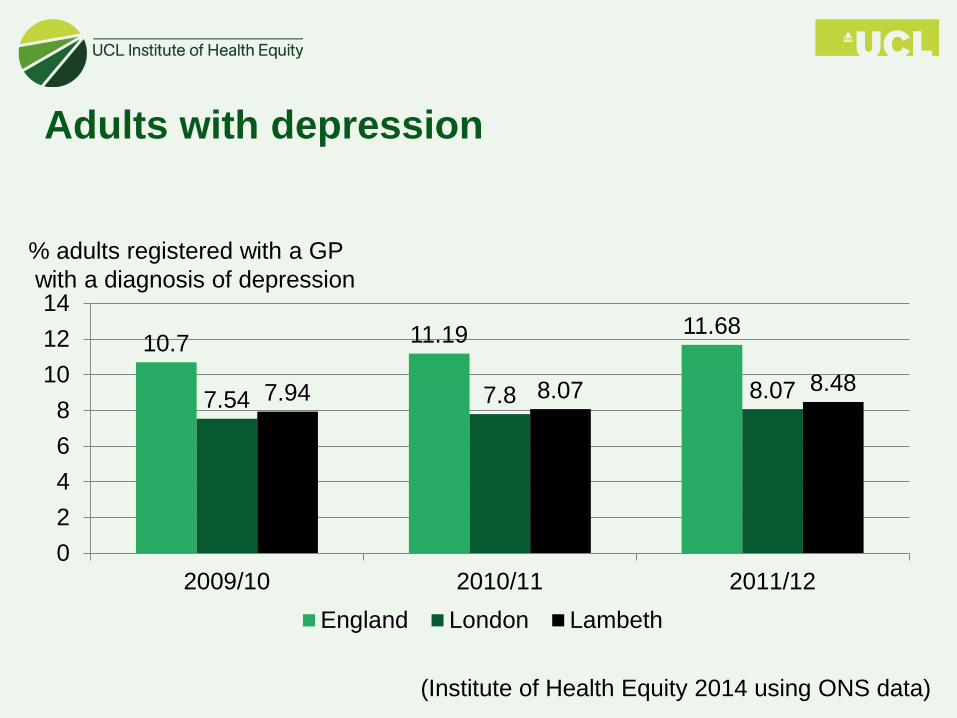
Adults with depression
10.7 11.19 11.68
7.54 7.8 8.07 7.94 8.07 8.48
02468
101214
2009/10 2010/11 2011/12England London Lambeth
% adults registered with a GP with a diagnosis of depression
(Institute of Health Equity 2014 using ONS data)
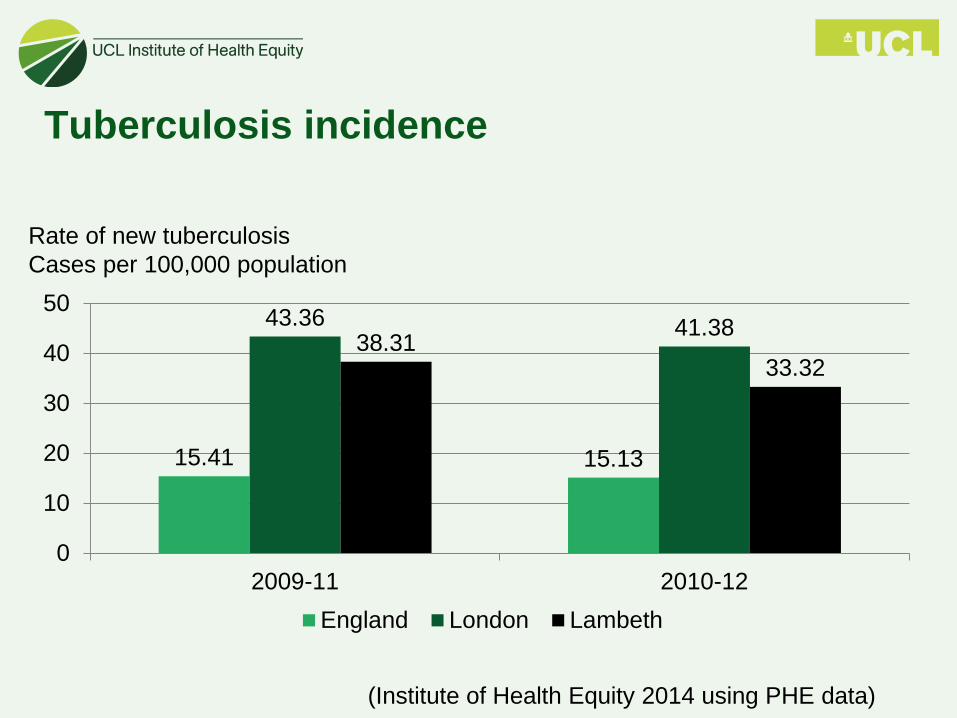
Tuberculosis incidence
15.41 15.13
43.36 41.38 38.31 33.32
0
10
20
30
40
50
2009-11 2010-12England London Lambeth
Rate of new tuberculosis Cases per 100,000 population
(Institute of Health Equity 2014 using PHE data)
LOCAL ACTION: • Local authorities
– 75% of local authorities have been significantly influenced by Marmot, evidence by their Health and Well-being Strategies and JSNAs (joint Strategic Needs Assessments)
– We have worked directly with 40 plus local authorities
• English Partnership Local government partnership between IHE and 7-8 local authorities until 2014/15 – intensive working to develop SDH approach to health inequalities. Disseminate findings
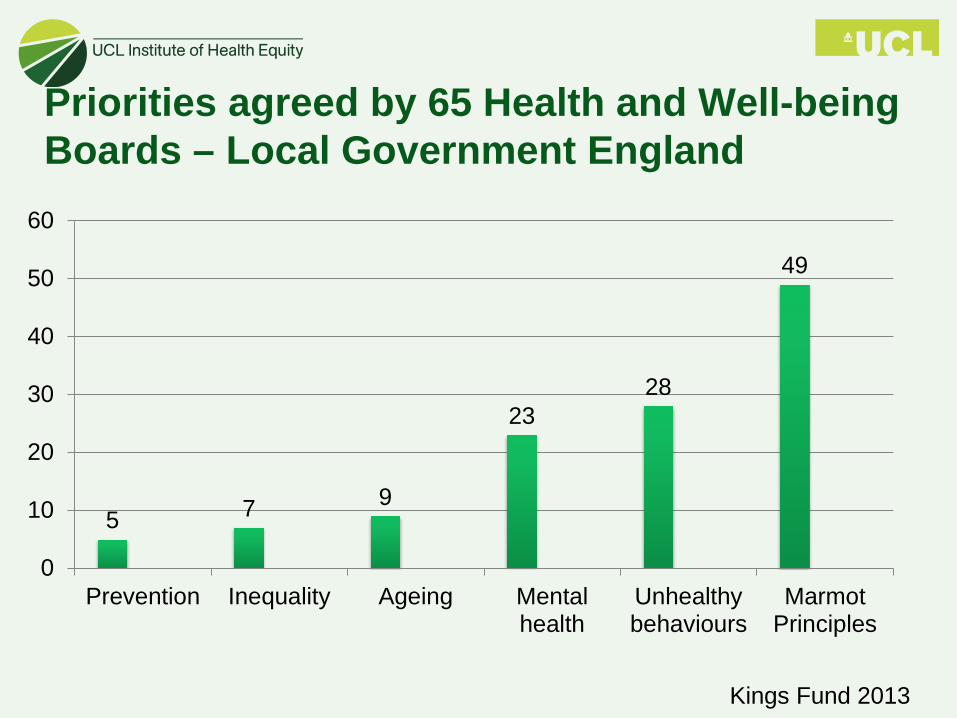
Priorities agreed by 65 Health and Well-being Boards – Local Government England
Kings Fund 2013
5 7 9
23 28
49
0
10
20
30
40
50
60
Prevention Inequality Ageing Mentalhealth
Unhealthybehaviours
MarmotPrinciples
Michael Marmot
Do something Do more Do better
UCL Health and Society Summer School: Social Determinants of Health
14-18 July 2014
For further information email: [email protected]; www.ucl.ac.uk/summer-school-social-determinants-health