markvcid plasma neurofilament light biomarker kit protocol
TRANSCRIPT

Plasma NfL Fluid Biomarker Kit Protocol | v.10.30.19 | 1
MarkVCID Plasma Neurofilament Light Biomarker Kit Protocol
1. Executive summary
Neurofilament light (NfL) is part of the neurofilament complex that help maintain axonal caliber. Fluid NfL has been related to neuronal damage, and the risk and progression of a variety of neurological disorders, as well as to pathological correlates. Our primary hypothesis is that elevated concentrations of NfL will be related to presence or absence of vascular cognitive impairment and to lower cognitive performance. Our secondary hypothesis is that elevated concentrations of NfL will be related to a higher burden of MRI cerebral small vessel disease. We anticipant a timeline of 2 years for the validation of this biomarker across MarkVCID participating sites.
2. Kit overview
a. Application to clinical trial: susceptibility/risk stratification for enrollment in clinical trials
b. Kit components, IP considerations
In a previous study, we have found that the most sensitive assay for measuring circulating
concentrations of NfL is the Quanterix Single Molecule Array (Simoa) assay. We are proposing to use the ‘Neurology 4-plex A’ kit from Quanterix, which measures NfL, together with GFAP, total tau, and UCHL11. Although this kit will not cross-validate GFAP, total tau, or UCHL, we are suggesting the 4-plex because of several factors that makes it a better-value choice:
NfL concentrations correlate highly between the neuro four-plex and the NfL singlicate, with R² = 0.9945 in n=20 control samples, and R² = 0.87625 in a biologically informative sample of n=36 participants from CARDIA.
Other proteins measured in the four-plex, such as GFAP and total tau, are likely to be informative in future analyses of VCID.
The University of Vermont (UVM) under the leadership of Dr. Russel Tracy has negotiated a price for MarkVCID sites, making the pricing for the Neuro 4-plex comparable to the NfL singlicate.
General characteristics of the NfL test included in the Neurology 4-Plex A The Simoa NfL assay is a digital immunoassay for the quantitative determination of NfL in serum, plasma and CSF. Table 1 provides the general characteristics of the immunoassay in serum/plasma.
Table 1. General characteristics of Neurology 4-Plex A immunoassay
Calibration range 0-~500 pg/mL
Dynamic range ~2000 pg/mL
Lower limit of detection (2.5 SD; 3 reps x 24 estimates across 12 runs, 3 instruments, 2 lots; mean LoD)
0.104 pg/mL [0.104 x 4 = 0.416 pg/mL at 1:4 dilution]
Lower limit of quantification (12 runs, 3 instruments, 2 reagent lots, mean LoQ)
0.241 pg/mL [0.241 x 4 = 0.964 pg/mL at 1:4 dilution]
Spike-recovery: serum/plasma (NfL spiked into 3 serum, 3 plasma samples at 15 and 150 pg/mL, mean)
90.1%
Linearity (high NfL plasma sample fractionally admixed with low NfL serum sample, mean of 10 levels)
94.9%
Dilution linearity: serum (spiked serum diluted 2X serially from MRD to 128-fold w/ Sample Diluent; mean recovery)
118.8%
Inter lot CV (Pool of CVs from 5 samples tested with 2 reagent lots across 2 runs x 3 instruments)
3.5%
Inter instrument CV (Pool of CVs from 5 samples tested with 3 instruments across 2 runs x 2 reagent lots)
2.5%
Typical serum/plasma sample volume (Includes dead volume; see Package Insert for details)
46 μL
Plasma NfL Fluid Biomarker Kit Protocol | v.10.30.19 | 2
Important considerations The Neurology 4-Plex A assay is temperature-sensitive. Assay sensitivity and precision are compromised when laboratory temperatures exceed 22°C. Prior to running the assay, your laboratory temperature must be ≤22°C and the instrument must be configured for increased heat dissipation. Refer to Technical Bulletin TECH-0012 for details.
c. Kit rationale
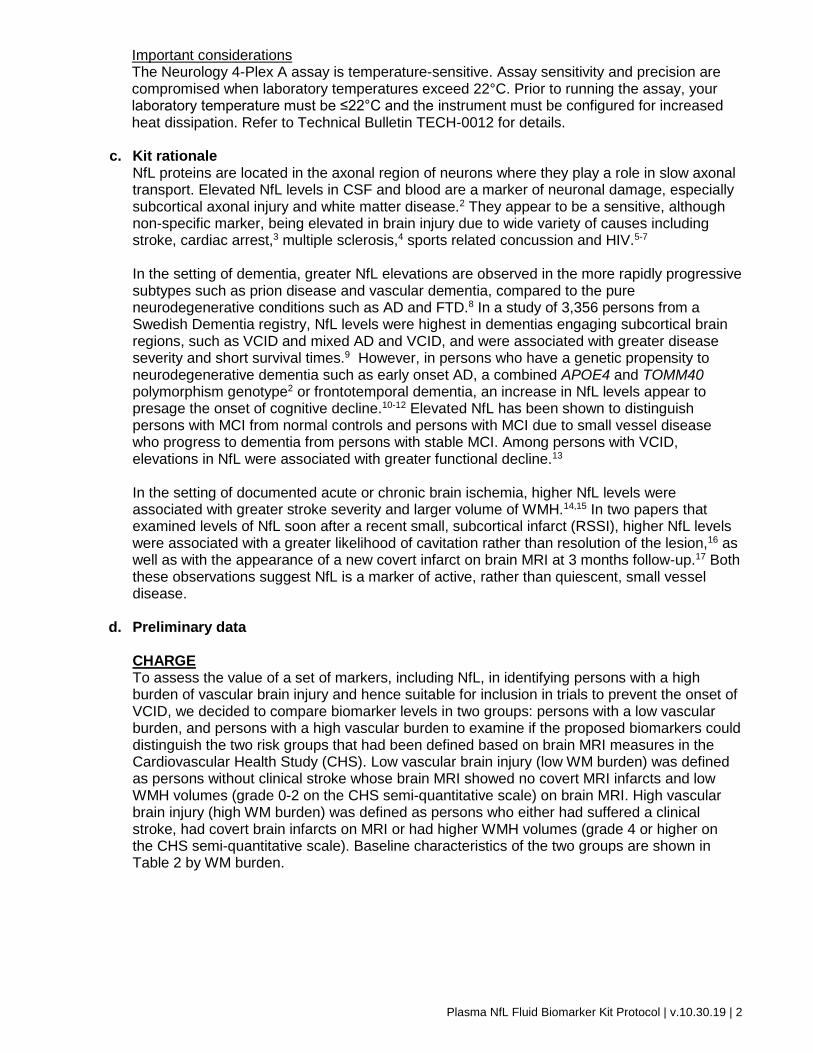
NfL proteins are located in the axonal region of neurons where they play a role in slow axonal transport. Elevated NfL levels in CSF and blood are a marker of neuronal damage, especially subcortical axonal injury and white matter disease.2 They appear to be a sensitive, although non-specific marker, being elevated in brain injury due to wide variety of causes including stroke, cardiac arrest,3 multiple sclerosis,4 sports related concussion and HIV.5-7 In the setting of dementia, greater NfL elevations are observed in the more rapidly progressive subtypes such as prion disease and vascular dementia, compared to the pure neurodegenerative conditions such as AD and FTD.8 In a study of 3,356 persons from a Swedish Dementia registry, NfL levels were highest in dementias engaging subcortical brain regions, such as VCID and mixed AD and VCID, and were associated with greater disease severity and short survival times.9 However, in persons who have a genetic propensity to neurodegenerative dementia such as early onset AD, a combined APOE4 and TOMM40 polymorphism genotype2 or frontotemporal dementia, an increase in NfL levels appear to presage the onset of cognitive decline.10-12 Elevated NfL has been shown to distinguish persons with MCI from normal controls and persons with MCI due to small vessel disease who progress to dementia from persons with stable MCI. Among persons with VCID, elevations in NfL were associated with greater functional decline.13 In the setting of documented acute or chronic brain ischemia, higher NfL levels were associated with greater stroke severity and larger volume of WMH.14,15 In two papers that examined levels of NfL soon after a recent small, subcortical infarct (RSSI), higher NfL levels were associated with a greater likelihood of cavitation rather than resolution of the lesion,16 as well as with the appearance of a new covert infarct on brain MRI at 3 months follow-up.17 Both these observations suggest NfL is a marker of active, rather than quiescent, small vessel disease.
d. Preliminary data
CHARGE To assess the value of a set of markers, including NfL, in identifying persons with a high burden of vascular brain injury and hence suitable for inclusion in trials to prevent the onset of VCID, we decided to compare biomarker levels in two groups: persons with a low vascular burden, and persons with a high vascular burden to examine if the proposed biomarkers could distinguish the two risk groups that had been defined based on brain MRI measures in the Cardiovascular Health Study (CHS). Low vascular brain injury (low WM burden) was defined as persons without clinical stroke whose brain MRI showed no covert MRI infarcts and low WMH volumes (grade 0-2 on the CHS semi-quantitative scale) on brain MRI. High vascular brain injury (high WM burden) was defined as persons who either had suffered a clinical stroke, had covert brain infarcts on MRI or had higher WMH volumes (grade 4 or higher on the CHS semi-quantitative scale). Baseline characteristics of the two groups are shown in Table 2 by WM burden.

Plasma NfL Fluid Biomarker Kit Protocol | v.10.30.19 | 3
Table 2 Low WM Burden
(N=200) High WM Burden
(N=165)
Age, years 76.0 (3.5) 79.5 (4.95)
Female, % 58.5% 61.2%
African-American, % 6% 13.3%
White Matter Grade (0-9) 0.91 (0.3) 5.9 (1.04)
3MSE 95.3 (5.5) 91.7 (7.6)
DSST 44.4 (12.8) 34.5 (12.6)
We found that higher NfL concentrations were associated with increasing WMH burden and poorer cognition as evidenced by lower scores in the global 3MSE test and the digit symbol substitution test (DSST) for psychomotor speed (Table 3). Additionally, our results suggest that NfL concentrations remain predictive of cognitive performance in individuals with a lower vascular burden.
Table 3 Outcome
Univariate
Stratified
Low WM Burden High WM Burden
Beta p-value Beta p-value Beta p-value
NfL WMH Grade 0.4 2×10⁻¹³
High vs. low (p=2×10⁻¹¹)
3MSE −2.3 0.0002 −2.5 0.005 −0.48 0.6
DSST −5.4 1×10⁻⁵ −5.3 0.01 −0.8 0.6
Furthermore, we examined the incremental predictive ability of NfL, as well as additional biomarkers of astroglial injury (GFAP, Quanterix SIMOA) and microglial injury (YKL-40, R&D Systems ELISA) beyond demographic characteristics (age, sex, and race) and conventional vascular risk factors (hypertension, diabetes, and smoking) by fitting logistic regression models and testing the area under the ROC curves (AUC) for improvement. NfL was the most informative single marker, although the inclusion of all three biomarkers improved the ROC
above demographics and vascular risk factors (Figure and Table 4).
Table 4 Beta SE p-value
(Intercept) -32.0043 6.8284 2.80E-06
sCD-14 1.1171 0.5395 0.03841
NFL 0.7722 0.2179 0.00039
YKL-40 0.2677 0.1204 0.02615
GFAP 0.1765 0.2256 0.43395
diabetes 0.0829 0.4334 0.84827
hypertension 0.6691 0.2638 0.01119
smoking 0.1474 0.5225 0.77781
age 0.1315 0.0341 0.00012
sex -0.1839 0.2897 0.52571
race 1.3316 0.5009 0.00785

Plasma NfL Fluid Biomarker Kit Protocol | v.10.30.19 | 4
UCSF Additional analyses in 120 participants recruited at UCSF showed that higher concentrations of NfL are related to poorer processing speed (increasing times to complete the Modified Trails), visual memory (lower scores in the modified Rey 10-minute recall) and general cognition (lower MMSE scores), and smaller gray matter volume (Table 6).
Table 5 N Beta SE P
Cognitive test
Modified trails 120 0.032 0.007 <.0001*
Ray 10-min recall 122 -0.243 0.047 <.0001*
MMSE 141 -0.005 0.001 <.0001*
MRI
Gray matter volume 126 -0.002 0.001 0.0017*
WMH burden 131 0.005 0.009 0.5479
3. Participating sites UCSF/UCD, UKY, UTHSA, and CHARGE (UVM) have acquired the Simoa Analyzer by Quanterix and will be able to run the Neuro 4-plex assay. We can support other MarkVCID sites collecting blood samples if required, such as UNM, JHU, and USC, or legacy samples with stored blood such as Rush or UCD, to run the assays for their samples at one of our sites (UVM or UTHSA).
4. Protocol for fluid acquisition Blood samples will be collected according to the MarkVCID Fluid-Sample Best Practices under “blood guidelines” and “sharing and dissemination of fluid samples”, and the MarkVCID Fluid Biosample Requirements. Please refer to the MarkVCID website for the most updated manuals. NfL can be estimated in both serum and plasma, but we recommend the use of frozen plasma aliquots at a volume of 250 uL. This volume considers pipetting loss. Additional sample collection recommendations from Quanterix include:
Insufficient sample processing may cause inaccurate results. Specimens should be free of fibrin, red blood cells, or other particulate matter. Do not use
grossly hemolyzed specimens. Specimens thawed after frozen storage must always be mixed THOROUGHLY by low-speed
vortexing or inverting 10 times. Visually inspect the specimens. If layering or stratification is observed, continue mixing until specimens are visibly homogeneous.
Centrifuge all specimens prior to assay. Centrifugation conditions should be sufficient to efficiently remove particulate matter and to clarify the sample, for example 5 minutes at 10,000 g for serum or plasma. Note that interfering levels of fibrin may be present in samples that do not have obvious or visible particulate matter.
Centrifuged specimens with a lipid layer on the top should be transferred to a secondary tube. Care must be taken to transfer only the clarified specimen without the lipemic material.
Serum and plasma should be immediately removed from the red cells (after centrifugation) and put in a separate tube that can then be aliquoted and frozen for future use. For freshly drawn serum specimens, ensure that complete clot formation has taken place prior to centrifugation.
Multiple freeze-thaw cycles of specimens should be avoided.
Site Quanterix instrument
UCSF/UCD HD-1
UKY HD-1
UTHSA HD-1
CHARGE (UMV) HD-X

Plasma NfL Fluid Biomarker Kit Protocol | v.10.30.19 | 5
Specimens with obvious microbial contamination should not be used. Specimen stability in different storage conditions has not been validated for this assay.
However, the CHS specimens had been stored for over a decade before the assays were run and gave good intra- and inter-observer CVs <10%.
5. Additional data collection required for analysis
Data collection should include age, sex, educational level, and race (covariates), cognitive scores derived from neuropsychological evaluation (primary outcome), as well as brain MRI measures of white matter hyperintensity volumes assessed at least with a Fazekas score (secondary outcome). Consortium sites have agreed to collect these variables as part of their clinical measures.
6. Protocol for fluid analysis
The Simoa™ Advantage Assay Kits contain ready-to-use reagents for running 96 tests of target
analyte(s) on the Simoa HD-1 Analyzer using Single Molecule Array (Simoa) technology. The following equations and table describe the volume required for each sample. Samples diluted at the bench will be run using the Neat protocol. Plasma or serum samples to be diluted by the instrument will be run using the standard 4x protocol.
The components of the NfL Simoa kit include:
Simoa Advantage Reagent Kit for 96 Tests
Bead Reagent
1 bottle Store at 2-8°C Capture antibody coated beads in buffer with protein stabilizers.
Detector Reagent
1 bottle Store at 2-8°C Biotinylated detector antibody in buffer with protein stabilizers.
SBG Reagent
1 bottle Store at 2-8°C Streptavidin-ß-galactosidase (SBG) in buffer with protein stabilizers.
RGP Reagent
2 bottles Store at 2-8°C Resorufin ß-D-galactopyranoside (RGP) in buffer with a surfactant.
Calibrators 2 vials per level
Store at -80°C Antigen in buffer with protein stabilizers.
Controls 2 vials per level
Store at -80°C Antigen in buffer with protein stabilizers.
Sample Diluent
1 – 2 bottles
Store at 2-8°C Buffer with protein stabilizers, a heterophilic blocker.
Materials required but not provided
Simoa HD-1 Analyzer
Simoa HD-1 System Wash Buffer 1
Simoa HD-1 System Wash Buffer 2
Simoa HD-1 Sealing Oil
Simoa cuvettes*
Simoa disposable pipettor tips*
Simoa Discs* *Cuvettes, Pipettor Tips and Discs are sold as consumable unit “Simoa Disc Kit 2.0”

Plasma NfL Fluid Biomarker Kit Protocol | v.10.30.19 | 6
Step-by-step Simoa Analyzer protocol for SIMOA N4PA Advantage Kit
Prepare Instrument 1. Prepare the instrument by turning on the HD-1 Analyzer. First turn the switch on and then
initialize the Simoa software. This should take 3 minutes. The system will tell you when it is ready.
2. If this is the first time the Simoa has been turned on that day, perform pre-run maintenance by going to the maintenance tab, checking the start of day task, and clicking run task. This should take 20 min. If the system has been idle for 4 or more hours, run Idle System Prime, which should take 10 min.
3. To import the assay definition, go to the custom assay tab and click import to select the xml file you wish to use. To import the N4PA assay definition, refer to the lot-specific Certificate of Analysis for the concentration of this lot of calibrators and update in the assay definition. NOTE: If you have not downloaded this assay definition before, you must download this definition from the customer portal and install it on the Simoa Analyzer prior to performing the assay.
Set Up Assay 1. Allow calibrators and controls to come to room temperature. Do NOT heat vial to accelerate
thawing. 2. When the calibrators and controls are fully thawed, thoroughly mix by multiple gentle
inversions or vortexing. This is critical for accurate calibration. 3. Prepare samples by selecting a Quanterix supplied 96-well plate. Each well should already
contain 30uL (i.e. dead volume). Using the below table, calculate the required volume of sample to be added to each well. The table does not account for the 30uL already in each well. Samples will generally be run in singlet on HD-1 and HD-X instruments. Samples run on SR-X instruments must be run in duplicate.
Calibrator Volume. NOTE: Calibrators should be run in duplicate.
334uL (for 2 replicates in a 96 well plate)
Sample and Control Dilution factor 4X
Undiluted sample and control volume (1 replicate). This is the volume of plasma that will typically be used.
45uL per well
Undiluted sample and control volume (2 replicates)
90uL per well
Total tests per kit 96
To calculate the required volume of sample per well: Total volume = Dead volume + (number of replicates x protocol aspiration volume) Volume example calculations: Onboard sample dilution protocol with 2 replicates: = 30uL + (2 x 45uL) = 120 uL total/well
4. Mix the thawed samples by gently vortexing OR inverting 10 times. Centrifuge the samples at 10,000 x g for 5 minutes to clear any debris
5. Prepare the plate by pipetting the required volumes (see step 3 above) of calibrators, controls, and samples into the 96 well plates.

Plasma NfL Fluid Biomarker Kit Protocol | v.10.30.19 | 7
Load Instrument and Run Assay 1. Vortex beads for 30 seconds before loading. If beads sit idle for more than 5 minutes,
vortex again. 2. Load beads, detector, and SBG reagents into the reagent rack. Make sure that the beads
are in one of the shaking positions. Select the load reagent tab and select the reagent lane. Use the barcode reader to assign positions of reagents in the reagent rack. Insert the reagent rack. To load RGP, use the barcode reader to assign RGP and insert the rack labelled with an O (the RGP rack). Touch the Done Loading Reagents tab.
3. Create the plate layout by selecting the Setup Run tab and assigning the Batch Name and assigning the Plate Barcode. Click enter on the computer when done.
4. Assign calibrators by selecting the Assign Calibrators tab. Highlight a single well and select assay. Select a calibrator from the Select Calibrator pop up. Click Ascending/Descending to populate the remaining calibrators. Select the number of replicates per well.
5. To assign samples, select the assign sample tab and highlight all wells that contain any controls or samples. Select assay and assign the number of replicates per well.
6. When steps 3-5 are complete, click on List View to confirm the selections. When confirmed, insert plate rack and select Done With Setup.
7. If necessary, load the liquid consumables by filling the secondary containers with System Liquid (DI water), Wash Buffer 1, and Wash Buffer 2.
8. If necessary, load cuvettes, tips, and discs. To load cuvettes, place a full stack of 50 in the cuvette chute. Additional stacks must be loaded only when the system says ready. To load tips, go to the System Resources tab and select solid resources. Click Unlock Drawers and load the tips. In the software, tap twice in the positions where you loaded new tip racks. The tip positions in the rack diagram will turn light blue. To load disks, select the System Resources tab and use the barcode scanner to scan the barcode on the wrapper. Remove the blue base plate from the old stack from the disc pole. Load the new stack on an empty disc pole and remove the wrapper and the top disc with the Quanterix logo.
9. If necessary, empty solid and liquid waste at the bottom of the cabinet. 10. To start the run, go to the System Resources tab and select all resources. Click Start Run.
If the button is not active, check for flags in Resource Details. To monitor the progress of the run, go to the Current Run tab. The run is finished when this tab reads 00:00 and the status line at the bottom left corner says ready.
Post-Run 1. Remove the sample plate, reagents, and RGP. 2. Review the results and export as a CSV file. 3. Perform post-run maintenance by selecting the maintenance tab and checking the End of
Day task. Click Run Task. This should take 15 minutes. 4. To shut down the instrument, shutdown the software, followed by turning off the instrument,
and finally shutting down the PC.
7. Step-by-step analytic plan
7.1. Instrumental validation
Intra-plate/Inter-plate reliability (same sample and plate/same sample and
different plate) Each site should run at least n=10 samples in duplicate to estimate intra-plate reliability. Ideally, all sites running this kit will have a CV < 20%. Additionally, to measure inter-plate reproducibility, 10 samples must be run on three different plates in singlicate. In our experience, NfL has generally good CV%. The majority of replicates from the CARDIA study (n=715) yielded a CV ≤ 10%. Sample quality plays a critical role in the replicate CV%. Samples with excess fibrin or cellular debris or other “chunky”

Plasma NfL Fluid Biomarker Kit Protocol | v.10.30.19 | 8
contaminants can create high CV%. This is due to analyzer pipetting issues (large clots) and also with the binding of the analyte to the antibodies on the beads (bead aggregation). Therefore, it is highly recommended to centrifuge the samples prior to running on the HD analyzer systems (HD-1 and HD-X).
Inter-site reproducibility (same sample) We propose the shipment of frozen 250 uL plasma aliquots from at least n=20 and up to n=40 participants recruited at each of the participating sites to UMV, UTHSA, UKy and UCSF for assessment of NfL. Samples will be run in duplicate. Because we are using the same platform, we expect no significant inter-rater differences between assessments. Please perform the following analyses to assess any potential bias: a) Compare mean plasma NfL concentrations (log-transform if necessary to achieve
normality) between the parent and replicating sites using paired t-tests. b) Run a correlation analysis between the parent and replicating sites using Lin's
concordance correlation coefficient (LCC).18 Ideally, LCC ≥ 0.7. c) Calculate the intraclass correlation coefficient (ICC). Ideally, ICC ≥ 0.7.
Test-retest repeatability (same subject and site) This analysis will be performed at the UVM. We propose that each of the participating sites collect blood samples at three different time points in ~10 participants: baseline, one week after baseline, and two weeks after baseline. When possible, blood samples should be taken the same day of the week but ±2 days before or after is acceptable. Samples will be run in duplicate. We will use linear mixed models to assess change. We expect no significant intra-individual differences over two weeks in normal conditions (P ≥ 0.05).
7.2. NfL measurement CHARGE (UVM), UTHSA, UCSF/UCD and UKy will assess NfL concentrations at their
own site The UVM has the capacity to perform assays for participating sites that have collected
blood samples but don’t have the Quanterix Simoa analyzer (USC, UNM, JHU, Rush)
7.3. Exclusions for main analysis We will exclude participants with dementia at baseline (limit analyses to cognitively
normal and MCI participants)
7.4. Definition of cognitive domains: Each site is collecting the same neuropsychological measures at baseline and follow-up visits. The following measures will be used to create a composite measure of general
cognitive function, which is our primary outcome:
- Craft Story 21 Recall (Immediate): Total story units recalled or verbatim scoring [0-44] after 20 minutes of first administration.
- Craft Story 21 Recall (Delayed): Total story units recalled or verbatim scoring [0-44] after 20 minutes of first administration.
- Number Span Test Forward: Number of correct trials, [0-14]. - Number Span Test Backward: Number of correct trials, [0-14]. - Category Fluency – Animals: Total number of animals named in 60 seconds, [0-
77] - Phonemic Fluency –Words beginning with F: Number of F-words repeated in 1
minute [0-15] - Trail Making Test A: Total number of seconds to complete test, [0-150].

Plasma NfL Fluid Biomarker Kit Protocol | v.10.30.19 | 9
- Trail Making Test B: Total number of seconds to complete test, [0-300]. - Multilingual Naming Test (MINT): Total correct without any cues (Un-cued) [0-32]
Natural log-transform variables with skewed distributions.
Reverse sign for Trail Making Test A and Trail Making Test B to indicate higher scores
represent better performance.
Standardize individual scores for each one of the previous cognitive measures: z-score T1 = (individual cognitive score at T1 – sample mean for the cognitive test at T1) / sample standard deviation for the cognitive test at T1
Create a composite cognitive score at baseline (T1) by averaging individual z-scores T1.
7.5. Analysis 1 - primary hypothesis: Cross-sectional association between NfL and cognition:
Log-transform NfL if the distribution is skewed
Use linear regression models to regress NfL (predictor) on general cognitive function
(outcome), adjusting for age, sex, education, and race if your site recruited a multiethnic sample* Model: Cognition ~ f(NFL + age + sex + education + race*)
7.6. Analysis 2 - secondary hypothesis: Cross-sectional association between NfL and WMH: We propose an additional analysis to assess the association between NFL and white matter burden. Use linear regression models to regress NfL (predictor) on Fazekas score (outcome),
adjusting for age, sex and race if your site recruited a multiethnic sample*. Model: Fazekas score ~ f(NFL + age + sex + race*)
8. Plan for longitudinal data collection and analysis
Covariates (baseline): age, sex, educational level, and race if your site recruited a
multiethnic sample* Predictors (baseline): NfL Outcome measures (longitudinal): Change in composite measure of general cognitive
function over one year after baseline. Follow the same approach to calculate a composite variable of general cognitive function at follow up but this time using the baseline sample mean and standard deviation when computing the z-scores:
z-score T2 = (individual cognitive score at T2 – sample mean for the cognitive test at T1) / sample standard deviation for the cognitive test at T1
Create a composite cognitive change score (T2) by averaging individual z-scores T2.
Use linear regression models to assess the association between NfL (baseline) and change
in general cognitive score adjusting for covariates.
Model: Change in cognition ~ f(NfL + age + sex + education + race*)

Plasma NfL Fluid Biomarker Kit Protocol | v.10.30.19 | 10
9. Sample size calculation (individual site level)
CHS As described above, a panel of biomarkers including NfL were run for CHS participants using EDTA blood samples drawn at the Year 10 exam. Participants included 146 (40%) men and 34 (9%) African-Americans. The average age at the time of blood draw was 78.56 (±4.59). Since CHS did not administer the same set of cognitive tests as the MarkVCID, we used general cognitive function (G-Factor)19 as a proxy for our primary cognitive outcome. The G-Factor was computed in n=268 participants from tests assessing different cognitive domains at Year 11, which included the Modified Mini Mental Status Examination (3MSE), Digit Symbol Substitution Test (DSST), Benton Visual Retention Test (BVRT), Trails A and Trails B. WMH grade was derived from MRI measures in n=358 participants attending Year 10 (N=297) or Year 11 (N=60) exams. Education was re-coded in agreement to the categories proposed by the MarkVCID (12 = high school or GED, 16 = bachelor’s degree, 18 = master’s degree, 20 = doctorate; or the number of years of education completed toward a certain level if not completed). Association results and power analyses are shown here below.
Cognitive function (n=268): Covariates only NfL only Full model
Beta (SE) Beta (SE) Beta (SE)
Intercept 0.09 (0.08) 0.06 (0.06) 0.08 (0.08) Age at blood draw -0.41 (0.06) *** -0.35 (0.06) *** Male sex -0.04 (0.12) -0.03 (0.12) African-American -0.14 (0.23) -0.19 (0.22) Years of education 0.33 (0.06) *** 0.32 (0.06) *** NfL (log transformed) -0.31 (0.06) *** -0.16 (0.06)* R-squared 0.22 0.08 0.24
*** p < 0.001; ** p < 0.01; * p < 0.05

Plasma NfL Fluid Biomarker Kit Protocol | v.10.30.19 | 11
Based on the R-square of the reduced model and the full model, a sample size of N=300 would be needed to detect associations between NfL and cognitive function with an 80% power and alpha of 5.%. A given sample where NfL explains an additional 1% or 2% of the variability observed in cognitive function, considering age, sex, education and race, a sample of N=199 or N=148 participants would be needed, respectively.
WMH grade (n=354): Covariates only NfL only Full model
Beta (SE) Beta (SE) Beta (SE)
Intercept 1.21 (0.04) *** 1.22 (0.03) *** 1.22 (0.04)***
Age at blood draw 0.25 (0.03) *** 0.18 (0.03)***
Male sex -0.05 (0.07) -0.07 (0.07) African-American 0.26 (0.11)* 0.26 (0.11)*
NfL (log transformed) 0.25 (0.03) *** 0.18 (0.03) ***
R-squared 0.16 0.14 0.22
*** p < 0.001; ** p < 0.01; * p < 0.05
Based on the R-square of the reduced model and the full model, a sample size of N=126 is needed to detect associations between NfL and WMH with an 80% power and alpha of 5%. In a given sample where NfL explains an additional 1% or 2% of the variability observed in WMH, considering age, sex, and race, a sample of N=105 or N=89 participants would be needed, respectively. UCSF We additionally used data collected at UCSF to estimate power. In a sample of n=92 participants without AD dementia, with 55% women, and mean age 74 (±9.4) years. As a proxy cognitive measure, we used the MMSE.
Plasma NfL Fluid Biomarker Kit Protocol | v.10.30.19 | 12
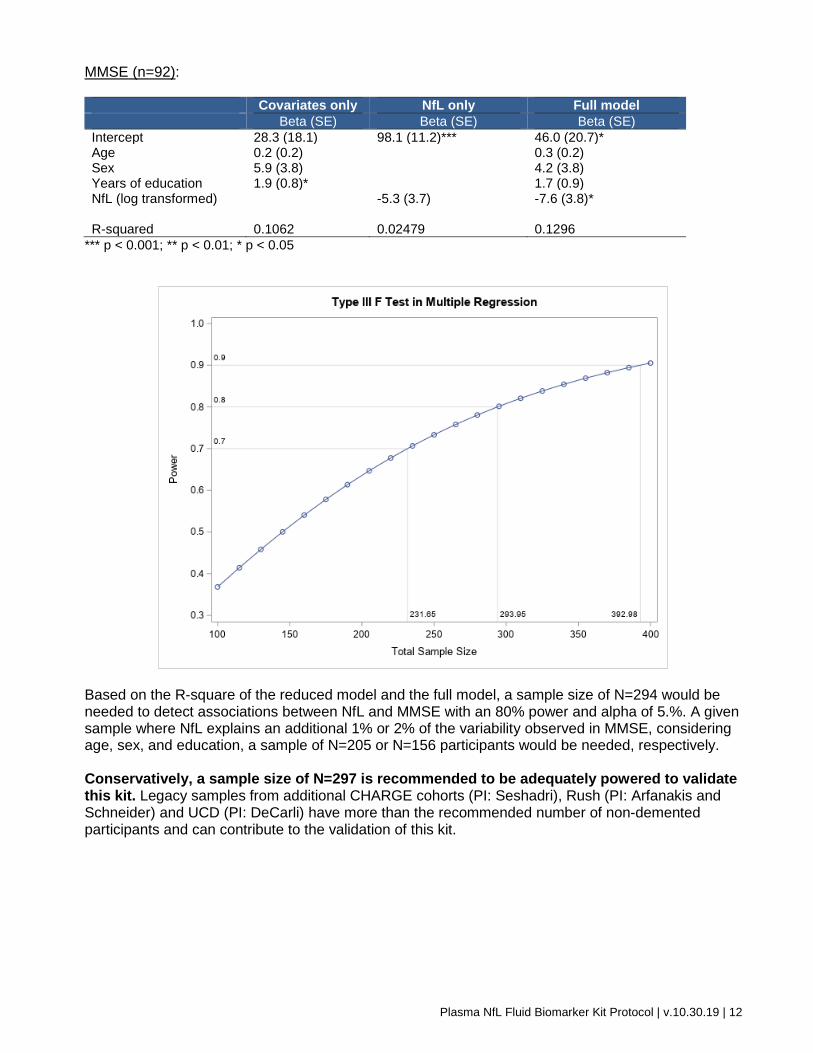
MMSE (n=92): Covariates only NfL only Full model
Beta (SE) Beta (SE) Beta (SE)
Intercept 28.3 (18.1) 98.1 (11.2)*** 46.0 (20.7)* Age 0.2 (0.2) 0.3 (0.2) Sex 5.9 (3.8) 4.2 (3.8) Years of education 1.9 (0.8)* 1.7 (0.9) NfL (log transformed) -5.3 (3.7) -7.6 (3.8)* R-squared 0.1062 0.02479 0.1296
*** p < 0.001; ** p < 0.01; * p < 0.05
Based on the R-square of the reduced model and the full model, a sample size of N=294 would be needed to detect associations between NfL and MMSE with an 80% power and alpha of 5.%. A given sample where NfL explains an additional 1% or 2% of the variability observed in MMSE, considering age, sex, and education, a sample of N=205 or N=156 participants would be needed, respectively. Conservatively, a sample size of N=297 is recommended to be adequately powered to validate this kit. Legacy samples from additional CHARGE cohorts (PI: Seshadri), Rush (PI: Arfanakis and Schneider) and UCD (PI: DeCarli) have more than the recommended number of non-demented participants and can contribute to the validation of this kit.
Plasma NfL Fluid Biomarker Kit Protocol | v.10.30.19 | 13
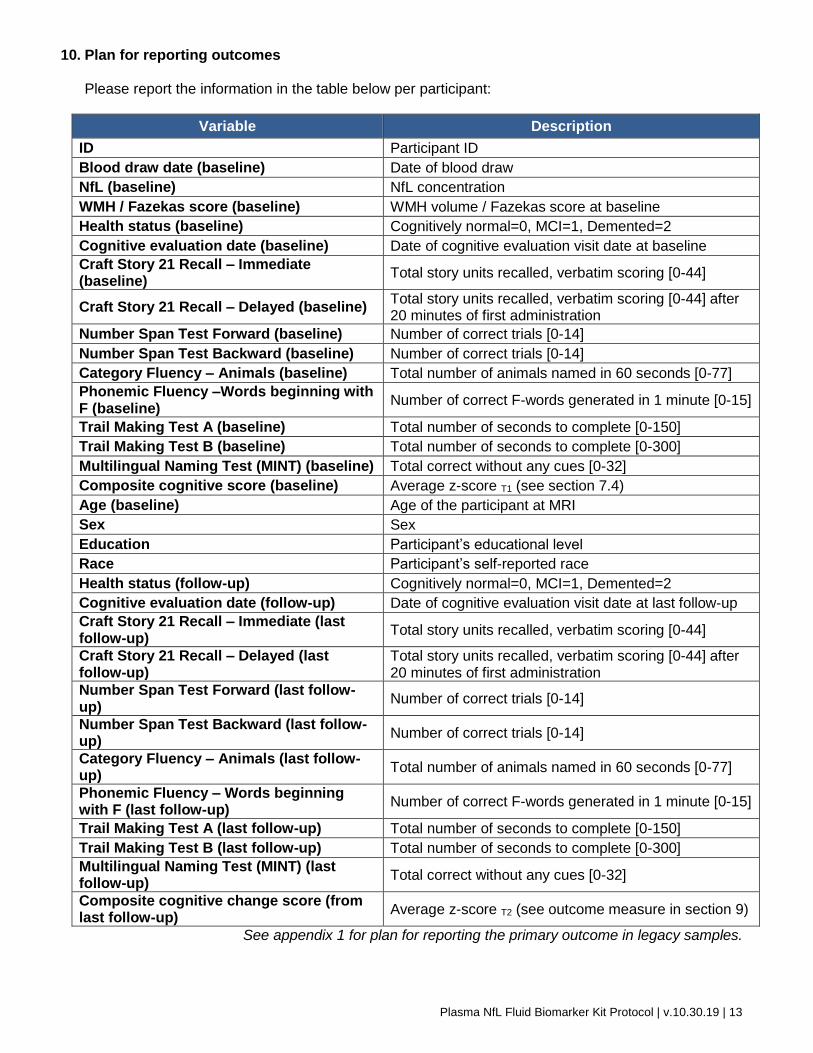
10. Plan for reporting outcomes
Please report the information in the table below per participant:
Variable Description
ID Participant ID
Blood draw date (baseline) Date of blood draw
NfL (baseline) NfL concentration
WMH / Fazekas score (baseline) WMH volume / Fazekas score at baseline
Health status (baseline) Cognitively normal=0, MCI=1, Demented=2
Cognitive evaluation date (baseline) Date of cognitive evaluation visit date at baseline
Craft Story 21 Recall – Immediate (baseline)
Total story units recalled, verbatim scoring [0-44]
Craft Story 21 Recall – Delayed (baseline) Total story units recalled, verbatim scoring [0-44] after 20 minutes of first administration
Number Span Test Forward (baseline) Number of correct trials [0-14]
Number Span Test Backward (baseline) Number of correct trials [0-14]
Category Fluency – Animals (baseline) Total number of animals named in 60 seconds [0-77]
Phonemic Fluency –Words beginning with F (baseline)
Number of correct F-words generated in 1 minute [0-15]
Trail Making Test A (baseline) Total number of seconds to complete [0-150]
Trail Making Test B (baseline) Total number of seconds to complete [0-300]
Multilingual Naming Test (MINT) (baseline) Total correct without any cues [0-32]
Composite cognitive score (baseline) Average z-score T1 (see section 7.4)
Age (baseline) Age of the participant at MRI
Sex Sex
Education Participant’s educational level
Race Participant’s self-reported race
Health status (follow-up) Cognitively normal=0, MCI=1, Demented=2
Cognitive evaluation date (follow-up) Date of cognitive evaluation visit date at last follow-up
Craft Story 21 Recall – Immediate (last follow-up)
Total story units recalled, verbatim scoring [0-44]
Craft Story 21 Recall – Delayed (last follow-up)
Total story units recalled, verbatim scoring [0-44] after 20 minutes of first administration
Number Span Test Forward (last follow-up)
Number of correct trials [0-14]
Number Span Test Backward (last follow-up)
Number of correct trials [0-14]
Category Fluency – Animals (last follow-up)
Total number of animals named in 60 seconds [0-77]
Phonemic Fluency – Words beginning with F (last follow-up)
Number of correct F-words generated in 1 minute [0-15]
Trail Making Test A (last follow-up) Total number of seconds to complete [0-150]
Trail Making Test B (last follow-up) Total number of seconds to complete [0-300]
Multilingual Naming Test (MINT) (last follow-up)
Total correct without any cues [0-32]
Composite cognitive change score (from last follow-up)
Average z-score T2 (see outcome measure in section 9)
See appendix 1 for plan for reporting the primary outcome in legacy samples.

Plasma NfL Fluid Biomarker Kit Protocol | v.10.30.19 | 14
11. Plan for sharing data, sample/images, protocols
We will share all necessary information for blood collection and shipping through the MarkVCID
portal. NfL and outcome data collected in CHARGE participating cohorts through this and previously
funded projects will be shared with other UH2/UH3 investigators. New data generated in the UH3 phase will also be shared with participating sites.

Plasma NfL Fluid Biomarker Kit Protocol | v.10.30.19 | 15
References
1. Korley, F.K. et al. Performance Evaluation of a Multiplex Assay for Simultaneous Detection of Four Clinically Relevant Traumatic Brain Injury Biomarkers. J Neurotrauma (2018).
2. Bruno, D. et al. Levels of cerebrospinal fluid neurofilament light protein in healthy elderly vary as a function of TOMM40 variants. Exp Gerontol 47, 347-52 (2012).
3. Rosen, H., Karlsson, J.E. & Rosengren, L. CSF levels of neurofilament is a valuable predictor of long-term outcome after cardiac arrest. J Neurol Sci 221, 19-24 (2004).
4. van der Vuurst de Vries, R.M. et al. High neurofilament levels are associated with clinically definite multiple sclerosis in children and adults with clinically isolated syndrome. Mult Scler, 1352458518775303 (2018).
5. Shahim, P., Tegner, Y., Marklund, N., Blennow, K. & Zetterberg, H. Neurofilament light and tau as blood biomarkers for sports-related concussion. Neurology 90, e1780-e1788 (2018).
6. Yuan, A., Rao, M.V., Veeranna & Nixon, R.A. Neurofilaments and Neurofilament Proteins in Health and Disease. Cold Spring Harb Perspect Biol 9(2017).
7. Andersson, L.M. et al. Normalisation of cerebrospinal fluid biomarkers parallels improvement of neurological symptoms following HAART in HIV dementia--case report. BMC Infect Dis 6, 141 (2006).
8. Zerr, I. et al. Cerebrospinal fluid neurofilament light levels in neurodegenerative dementia: Evaluation of diagnostic accuracy in the differential diagnosis of prion diseases. Alzheimers Dement (2018).
9. Skillback, T. et al. CSF neurofilament light differs in neurodegenerative diseases and predicts severity and survival. Neurology 83, 1945-53 (2014).
10. Rostgaard, N. et al. CSF neurofilament light concentration is increased in presymptomatic CHMP2B mutation carriers. Neurology 90, e157-e163 (2018).
11. Weston, P.S.J. et al. Serum neurofilament light in familial Alzheimer disease: A marker of early neurodegeneration. Neurology 89, 2167-2175 (2017).
12. Meeter, L.H.H. et al. Poly(GP), neurofilament and grey matter deficits in C9orf72 expansion carriers. Ann Clin Transl Neurol 5, 583-597 (2018).
13. Rolstad, S., Berg, A.I., Eckerstrom, C., Johansson, B. & Wallin, A. Differential Impact of Neurofilament Light Subunit on Cognition and Functional Outcome in Memory Clinic Patients with and without Vascular Burden. J Alzheimers Dis 45, 873-81 (2015).
14. Hjalmarsson, C. et al. Neuronal and glia-related biomarkers in cerebrospinal fluid of patients with acute ischemic stroke. J Cent Nerv Syst Dis 6, 51-8 (2014).
15. Traenka, C. et al. Serum Neurofilament Light Chain Levels Are Associated with Clinical Characteristics and Outcome in Patients with Cervical Artery Dissection. Cerebrovasc Dis 40, 222-7 (2015).
16. Pinter, D. et al. Longitudinal MRI dynamics of recent small subcortical infarcts and possible predictors. J Cereb Blood Flow Metab, 271678X18775215 (2018).
17. Gattringer, T. et al. Serum neurofilament light is sensitive to active cerebral small vessel disease. Neurology 89, 2108-2114 (2017).
18. Lin, L.I. A concordance correlation coefficient to evaluate reproducibility. Biometrics 45, 255-68 (1989).
19. Davies, G. et al. Study of 300,486 individuals identifies 148 independent genetic loci influencing general cognitive function. Nat Commun 9, 2098 (2018).

Plasma NfL Fluid Biomarker Kit Protocol | v.10.30.19 | 16
Appendix 1. Plan for reporting the primary outcome in legacy samples
Cognitive tests based on the MarkVCID protocol Alternative tests to be used by legacy samples
Craft Story 21 Recall – Immediate Logical memory (immediate)
Immediate story recall
Craft Story 21 Recall – Delayed Logical memory (delayed)
Delayed story recall
Number Span Test Forward
Number Span Test Backward
Category Fluency – Animals
Phonemic Fluency –Words beginning with F Consider Color Word Inhibition
as falls in the executive function domain
Trail Making Test A
Stroop word reading
Stroop color naming
Symbol Digit Modality Test
Trail Making Test B Stroop Color Word Inhibition
Multilingual Naming Test (MINT) Boston naming test