marks & channels, data types
TRANSCRIPT
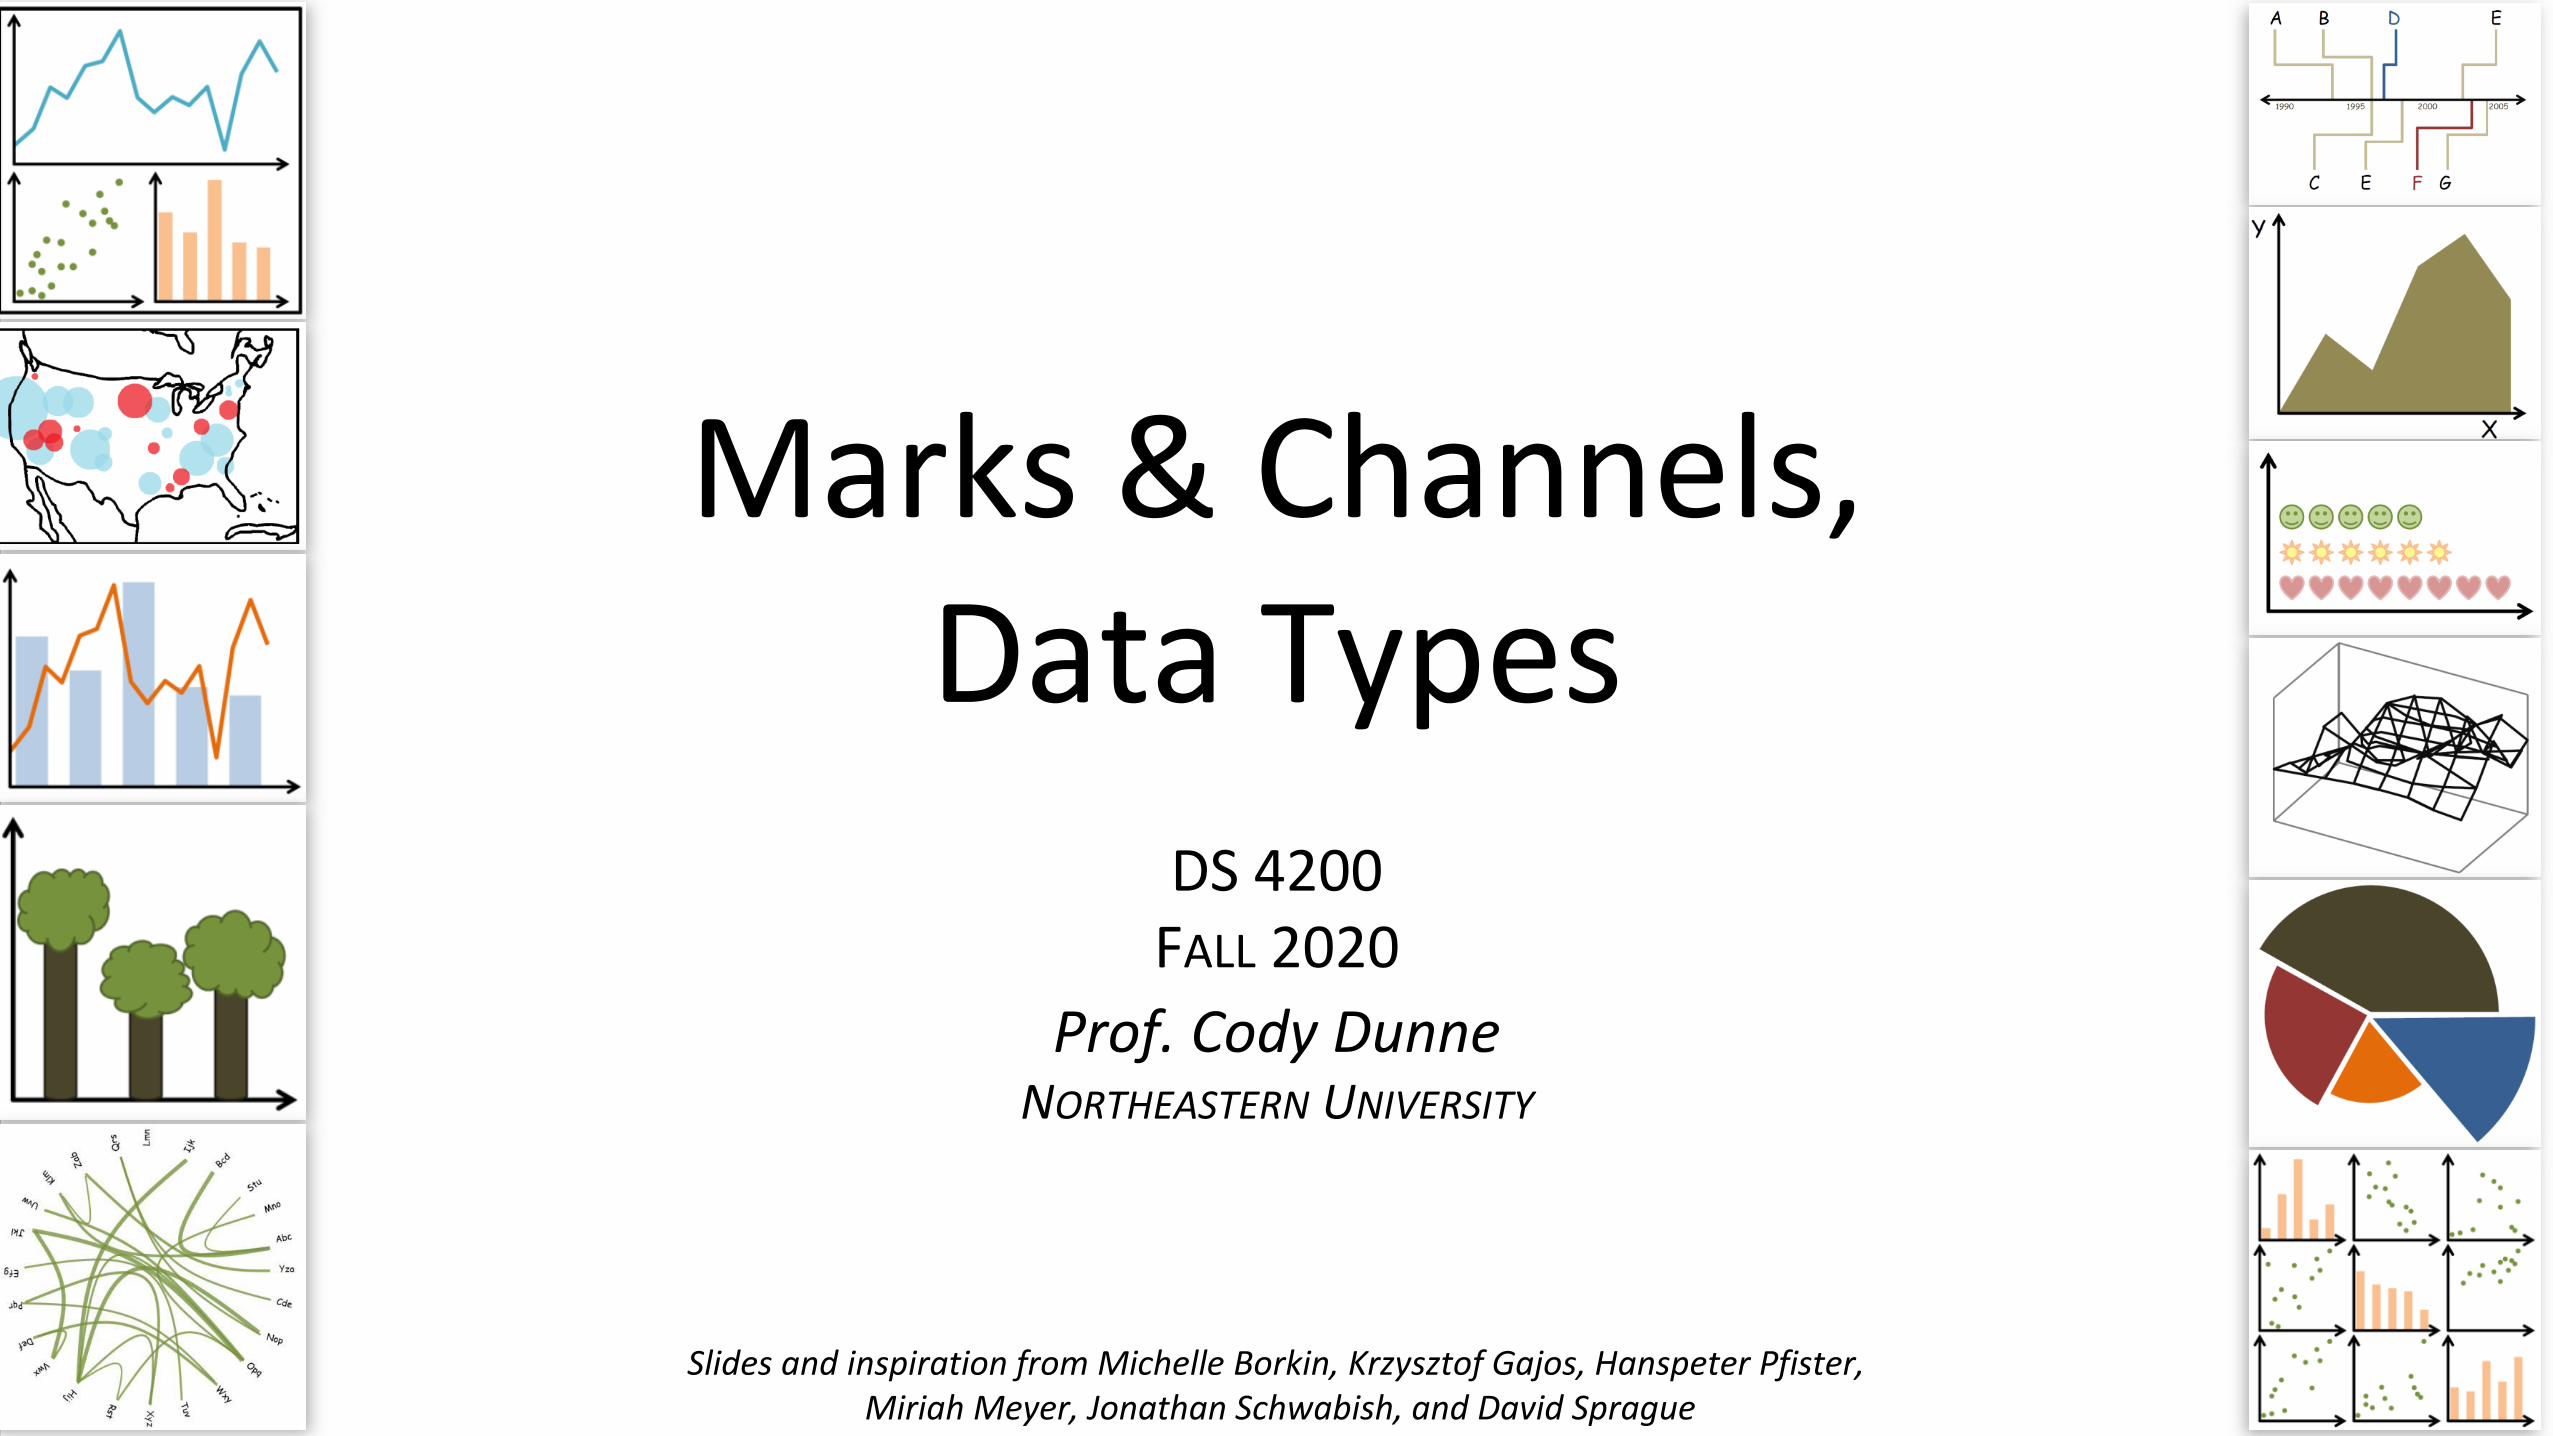
Marks & Channels, Data Types
DS 4200FALL 2020
Prof. Cody DunneNORTHEASTERN UNIVERSITY
1Slides and inspiration from Michelle Borkin, Krzysztof Gajos, Hanspeter Pfister,
Miriah Meyer, Jonathan Schwabish, and David Sprague

CHECK-IN
2

PREVIOUSLY, ON DS 4200…
4

5
Analysis
DATA ABSTRACTION
TASK ABSTRACTION
VISUAL ENCODING

Task Analysis
• Break-out into groups of ~3 people in Teams.• Pretend you are transportation engineers, e.g., for
the MBTA, City of Boston.• Discuss the user tasks and goals and abstract them
using one of these taskonomies.• Save your notes for a later exercise!!!
INSTRUCTIONS:
6
High-level
Low-level
Mid-level
Low-level
Visualization for Public Transit Development
15m

NOW, ON DS 4200…
7
Hall of Fame or Hall of Shame
8

MARKS AND CHANNELS
10
GOALS FOR TODAY
• Learn the basic visual primitives of visualizations (marks and channels)
• Understand how marks and channels are assembled to make visualizations
• Learn which marks and channels are most effective for a given task (“perceptual ordering”)
11

12
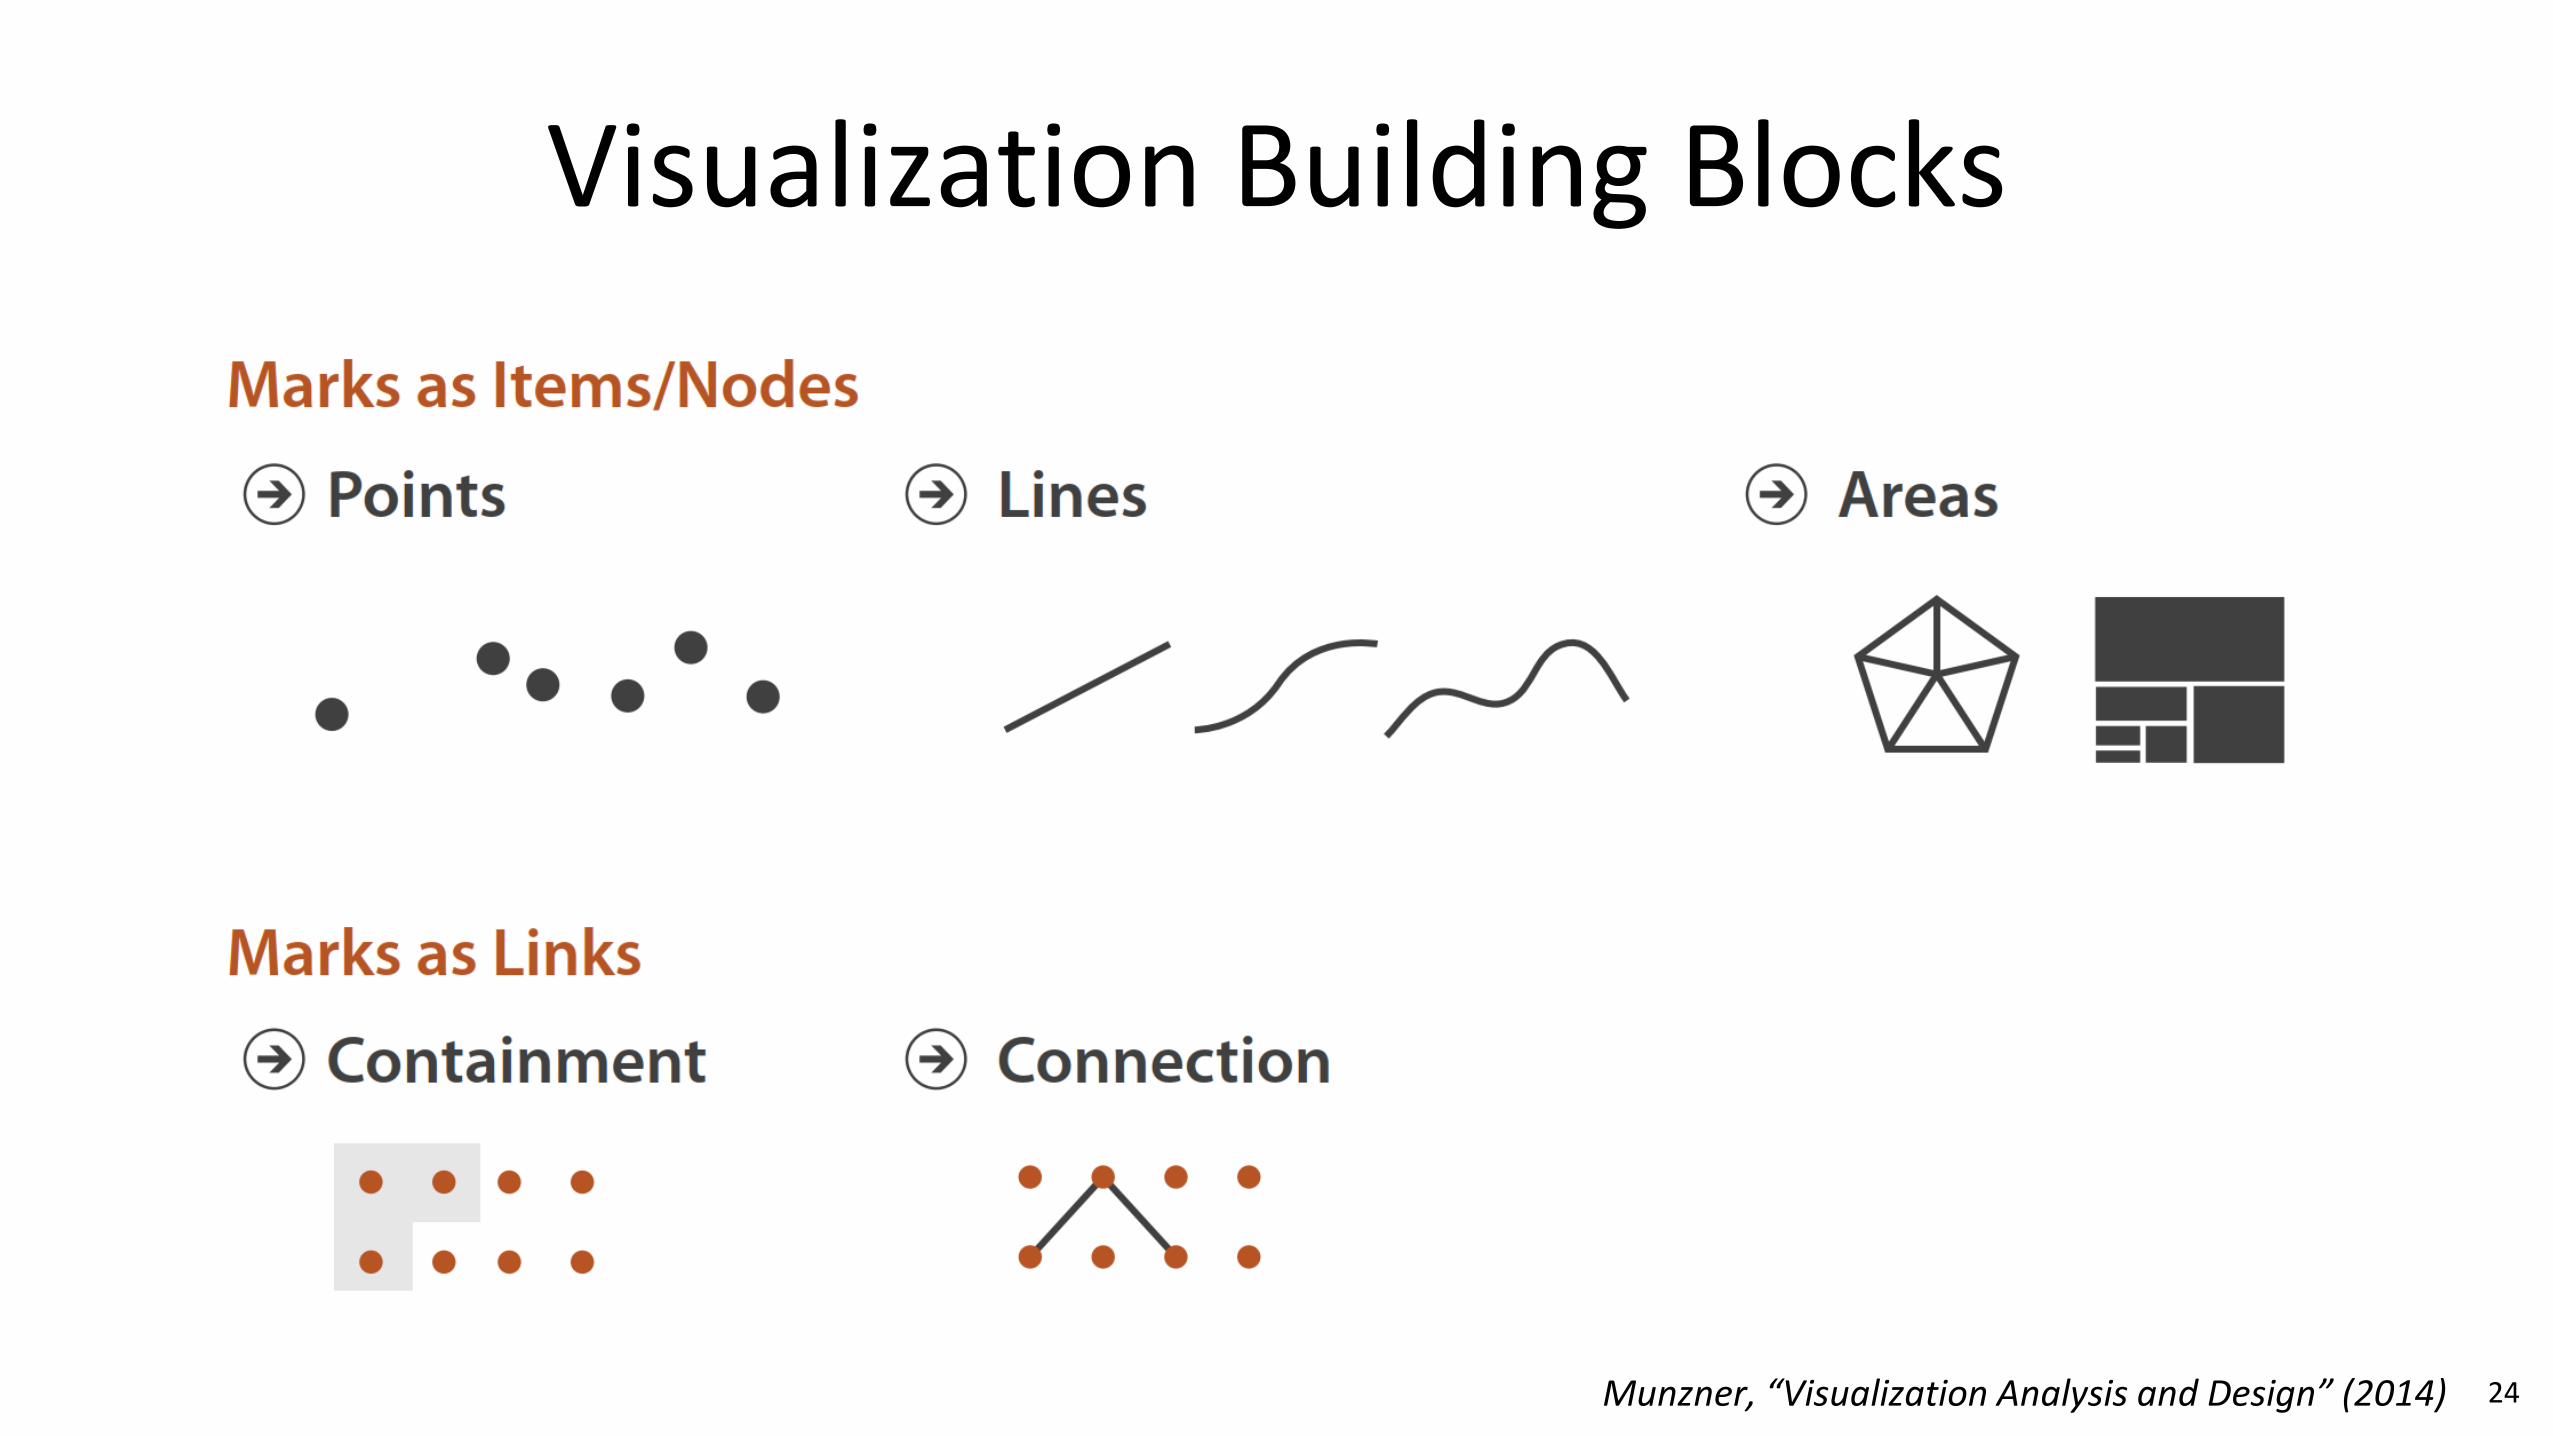
MARK = basic graphical element in an image
Visualization Building Blocks
Munzner, “Visualization Analysis and Design” (2014)
13
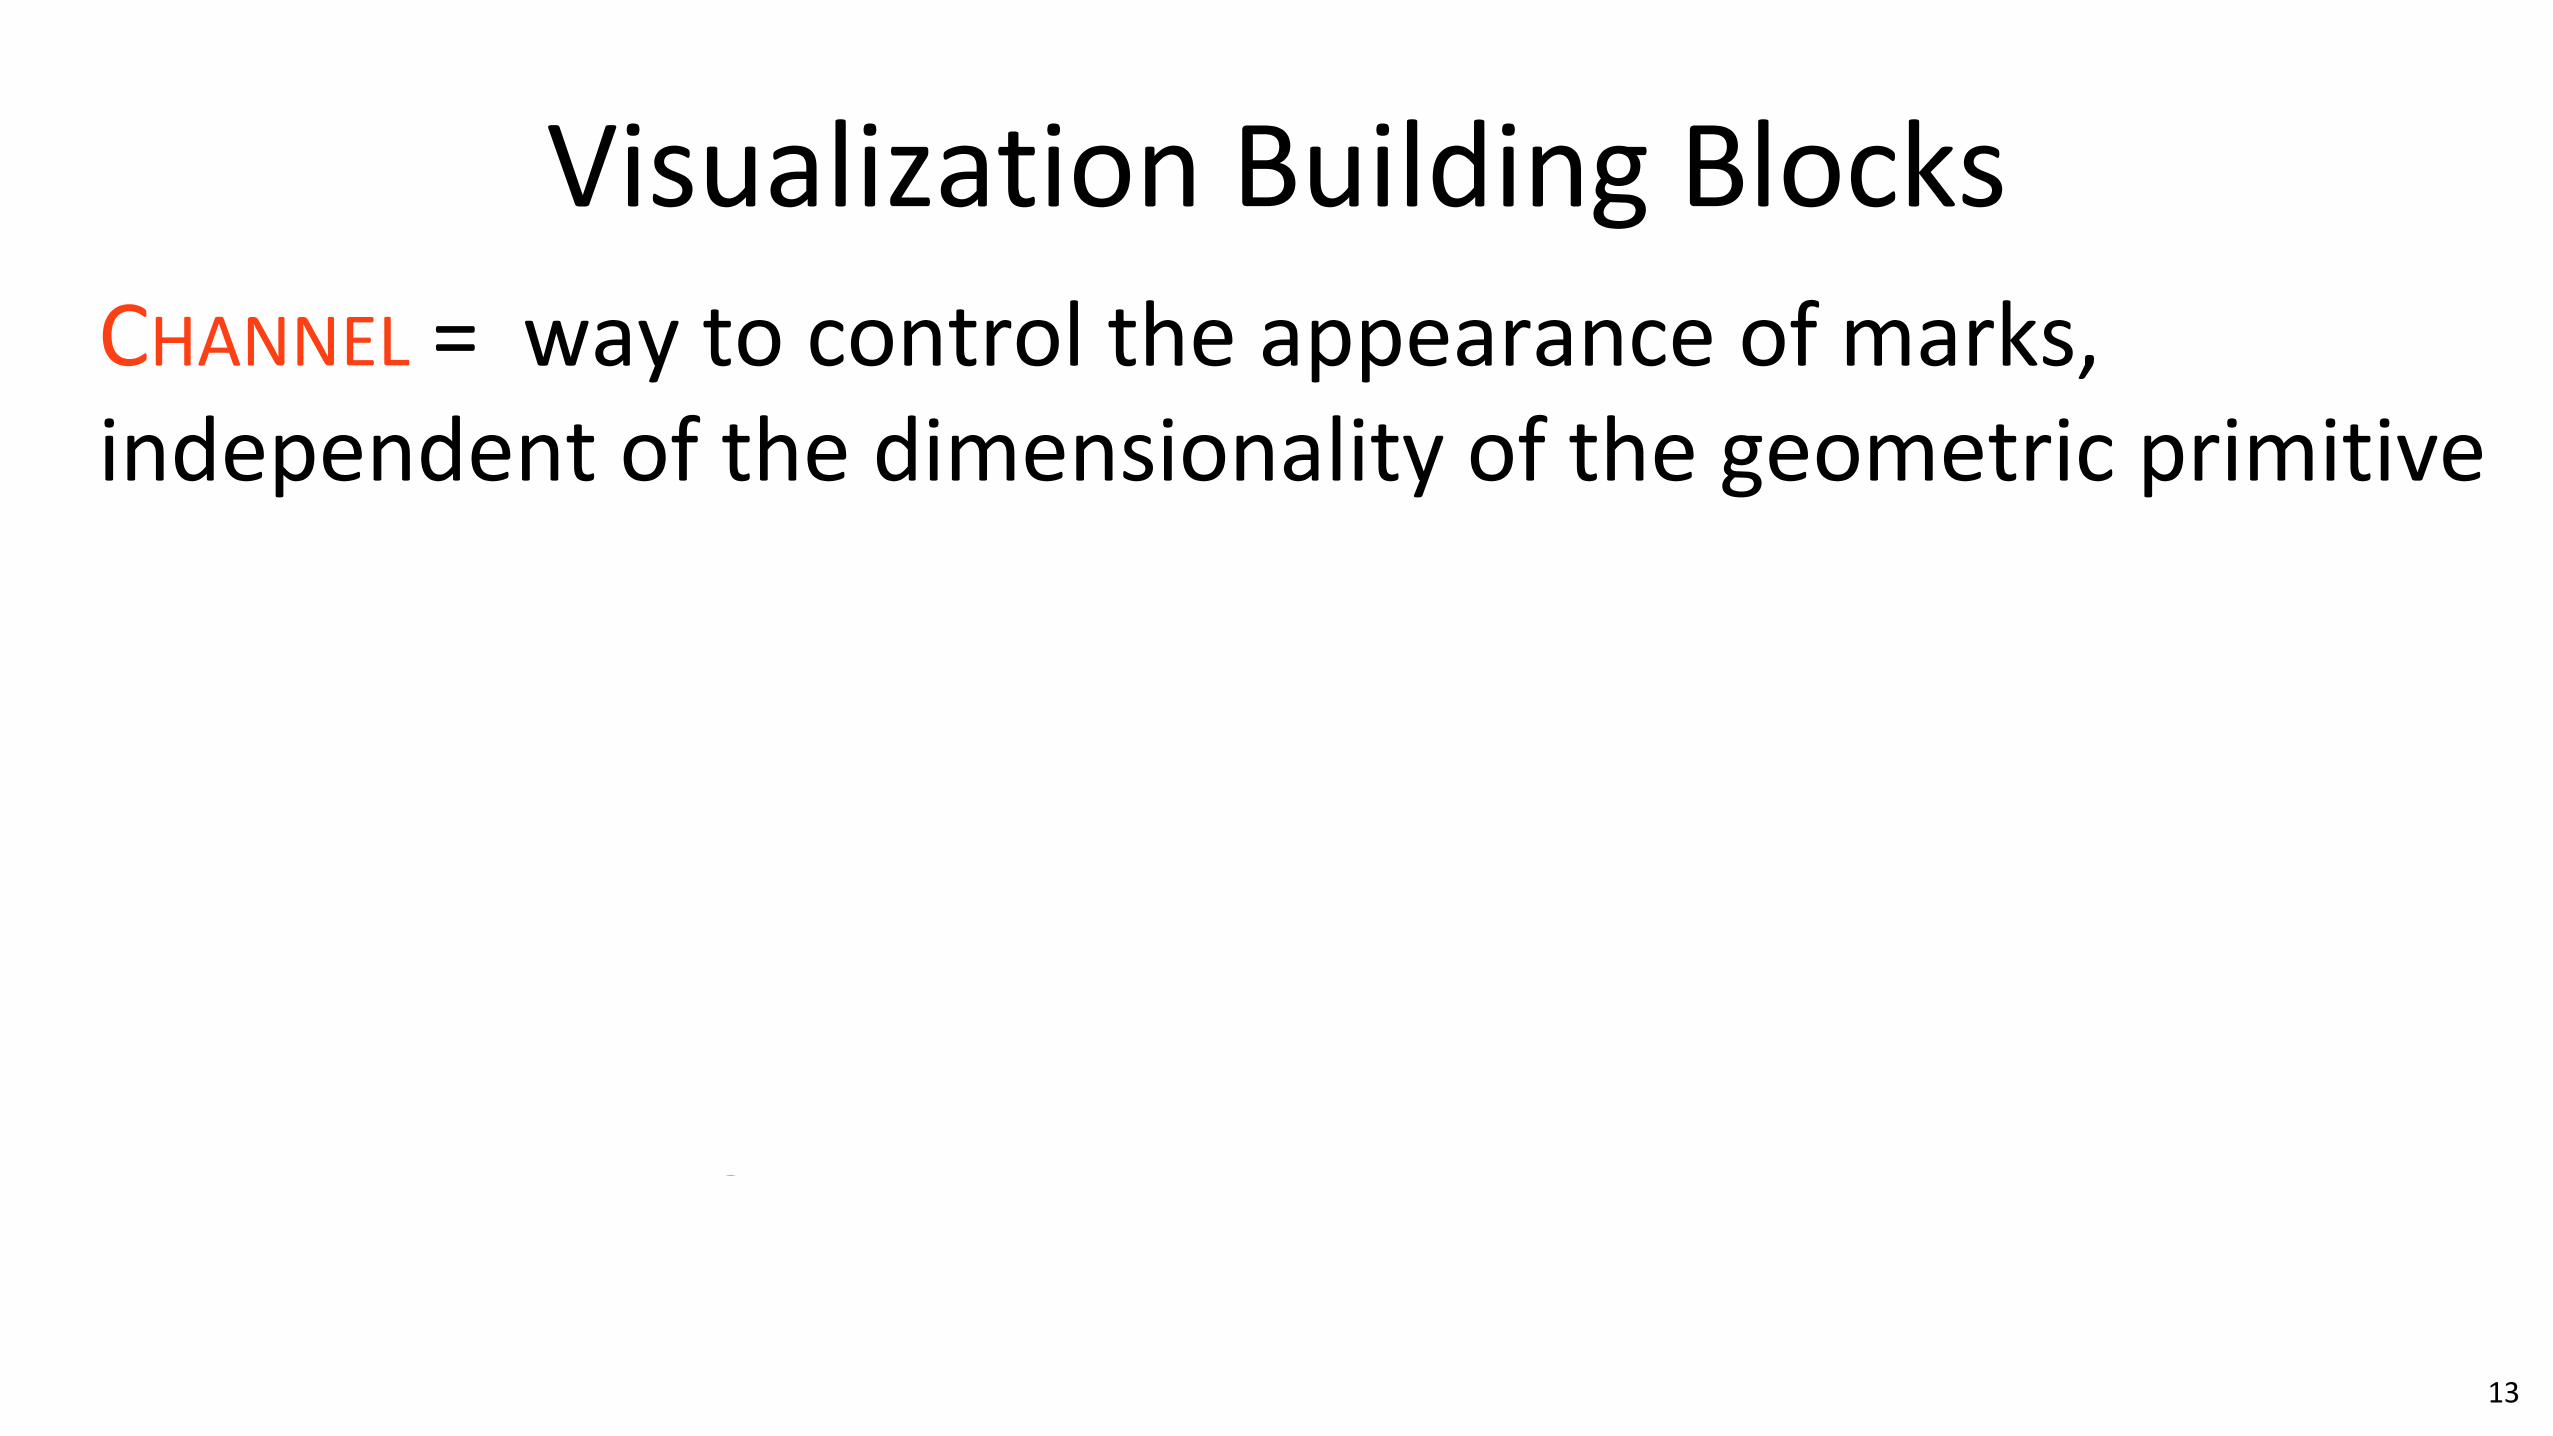
CHANNEL = way to control the appearance of marks,independent of the dimensionality of the geometric primitive
Visualization Building Blocks

14
CHANNEL :
Visualization Building BlocksMARK:# of attributes encoded: 2

15
CHANNEL :
Visualization Building BlocksMARK:# of attributes encoded: 2

16
CHANNEL :
Visualization Building BlocksMARK:# of attributes encoded: 3

17
CHANNEL :
Visualization Building BlocksMARK:# of attributes encoded: 4

18
CHANNEL :
Visualization Building BlocksMARK:# of attributes encoded: 2

19
CHANNEL :
Visualization Building BlocksMARK:# of attributes encoded: 2

20
CHANNEL :
Visualization Building BlocksMARK:# of attributes encoded: 3

21
CHANNEL :
Visualization Building BlocksMARK:
+ position in 3D space
# of attributes encoded: ?


24
Visualization Building Blocks
Munzner, “Visualization Analysis and Design” (2014)

25
Visualization Building Blocks

26
Visualization Building Blocks
Channels :
Note: these are all really important concepts when it comes time to coding your
visualizations...!

How do I pick which marks or channels to use?

28
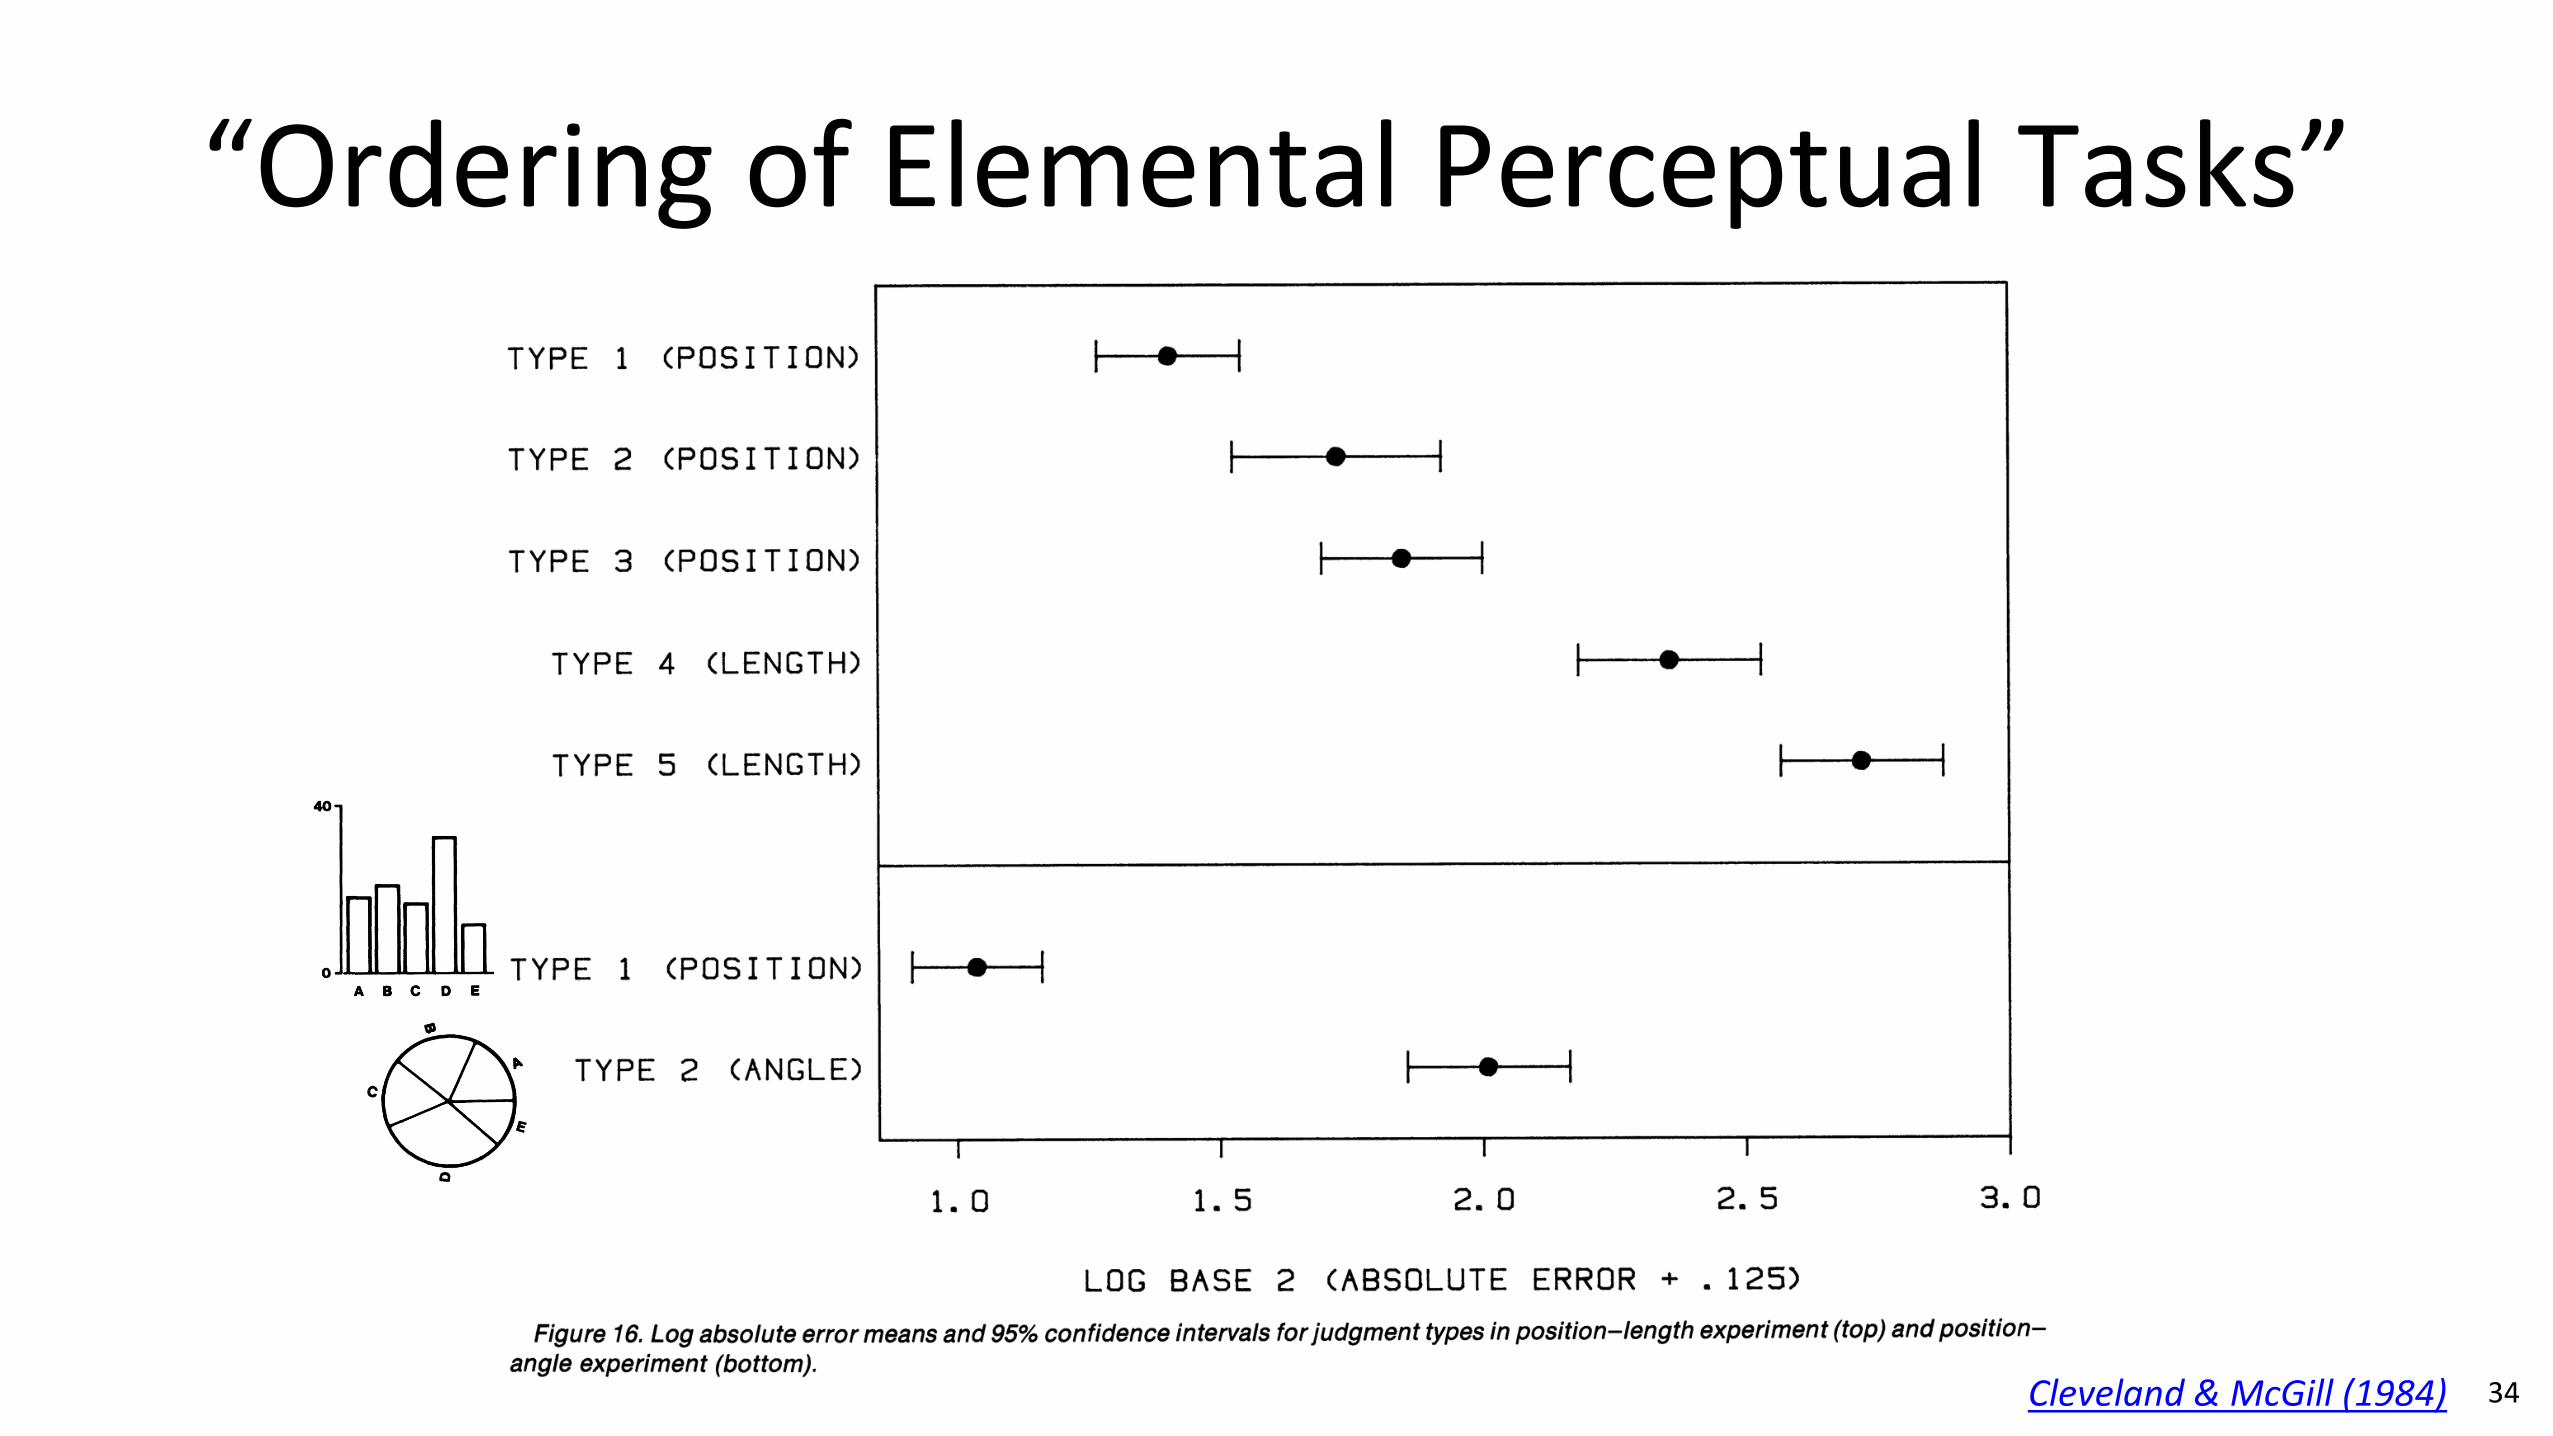
“Ordering of Elemental Perceptual Tasks”
Cleveland & McGill (1984)

29
“Ordering of Elemental Perceptual Tasks”
Cleveland & McGill (1984)
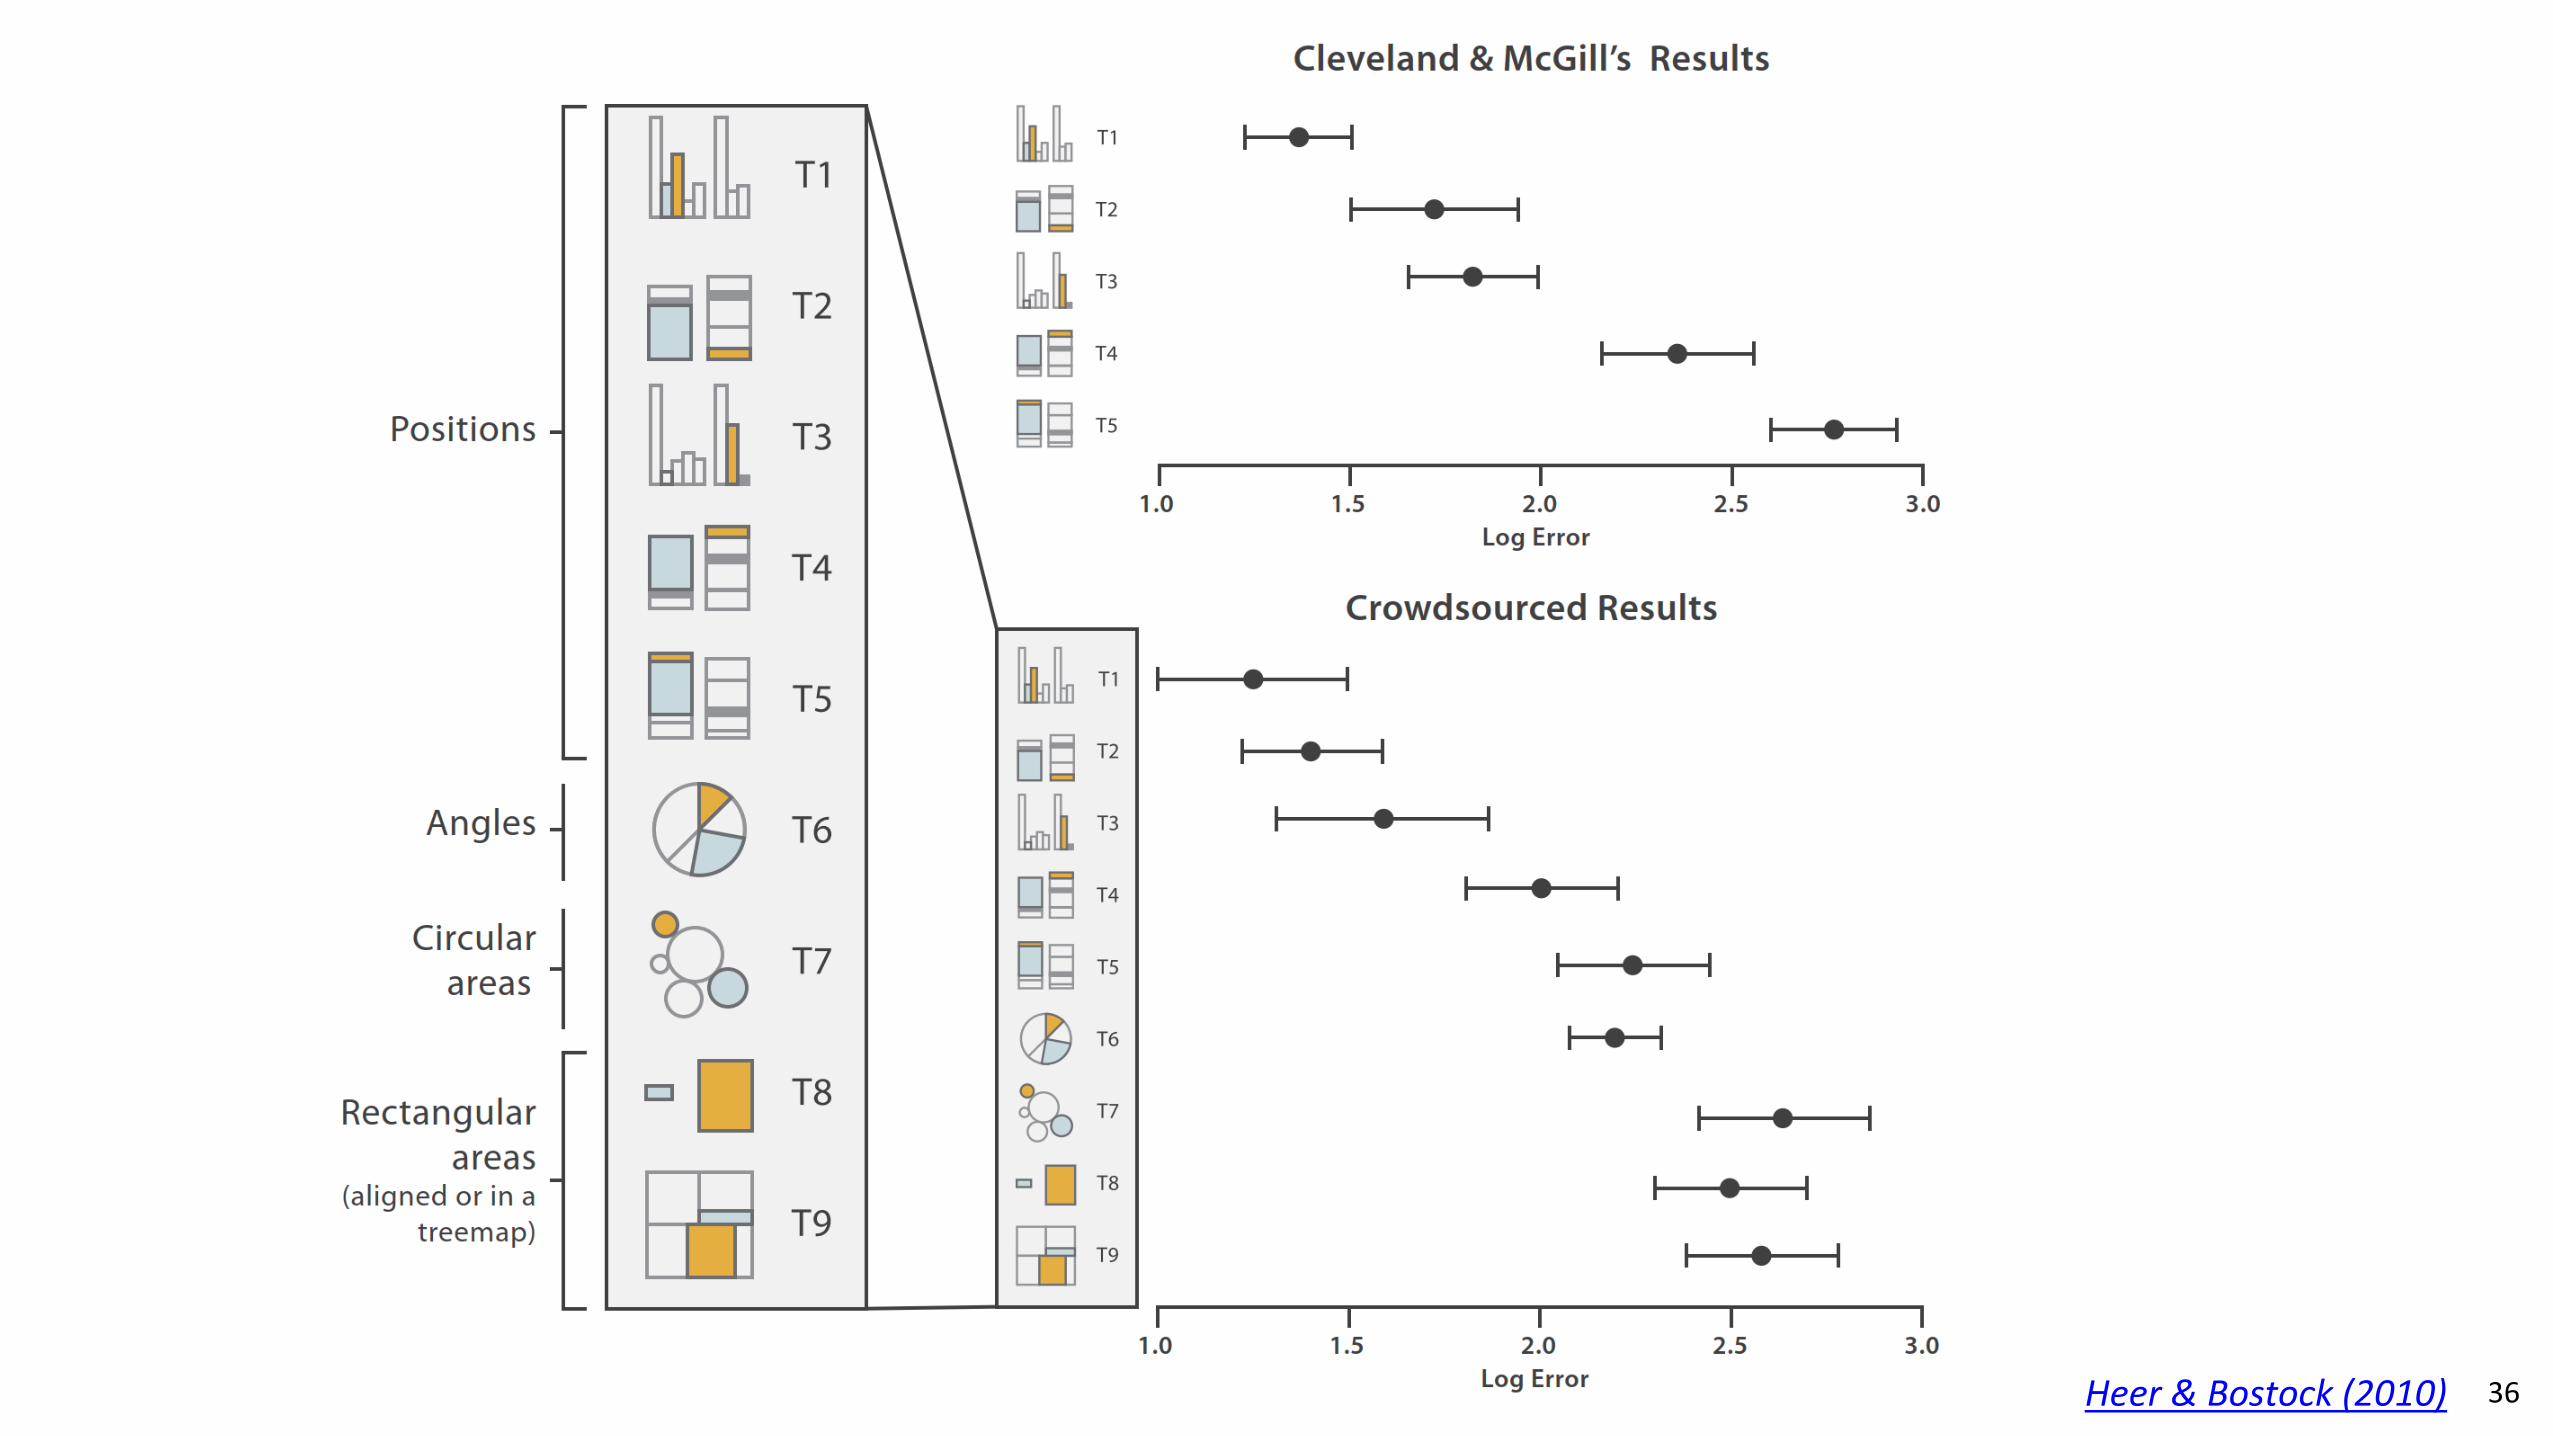
TASK: Which segment/bar is the maximum, and what is its percentage/value?

30
“Ordering of Elemental Perceptual Tasks”
Cleveland & McGill (1984)
This is why pie charts are bad for quantitative tasks

https://www.washingtonpost.com/news/wonk/wp/2013/06/17/the-usefulness-of-pie-charts-in-two-pie-charts/ 31

http://www.datasciencecentral.com/profiles/blogs/10-resources-to-help-you-stop-doing-pie-charts 32

William Playfair (1801) 33
34
“Ordering of Elemental Perceptual Tasks”
Cleveland & McGill (1984)
35
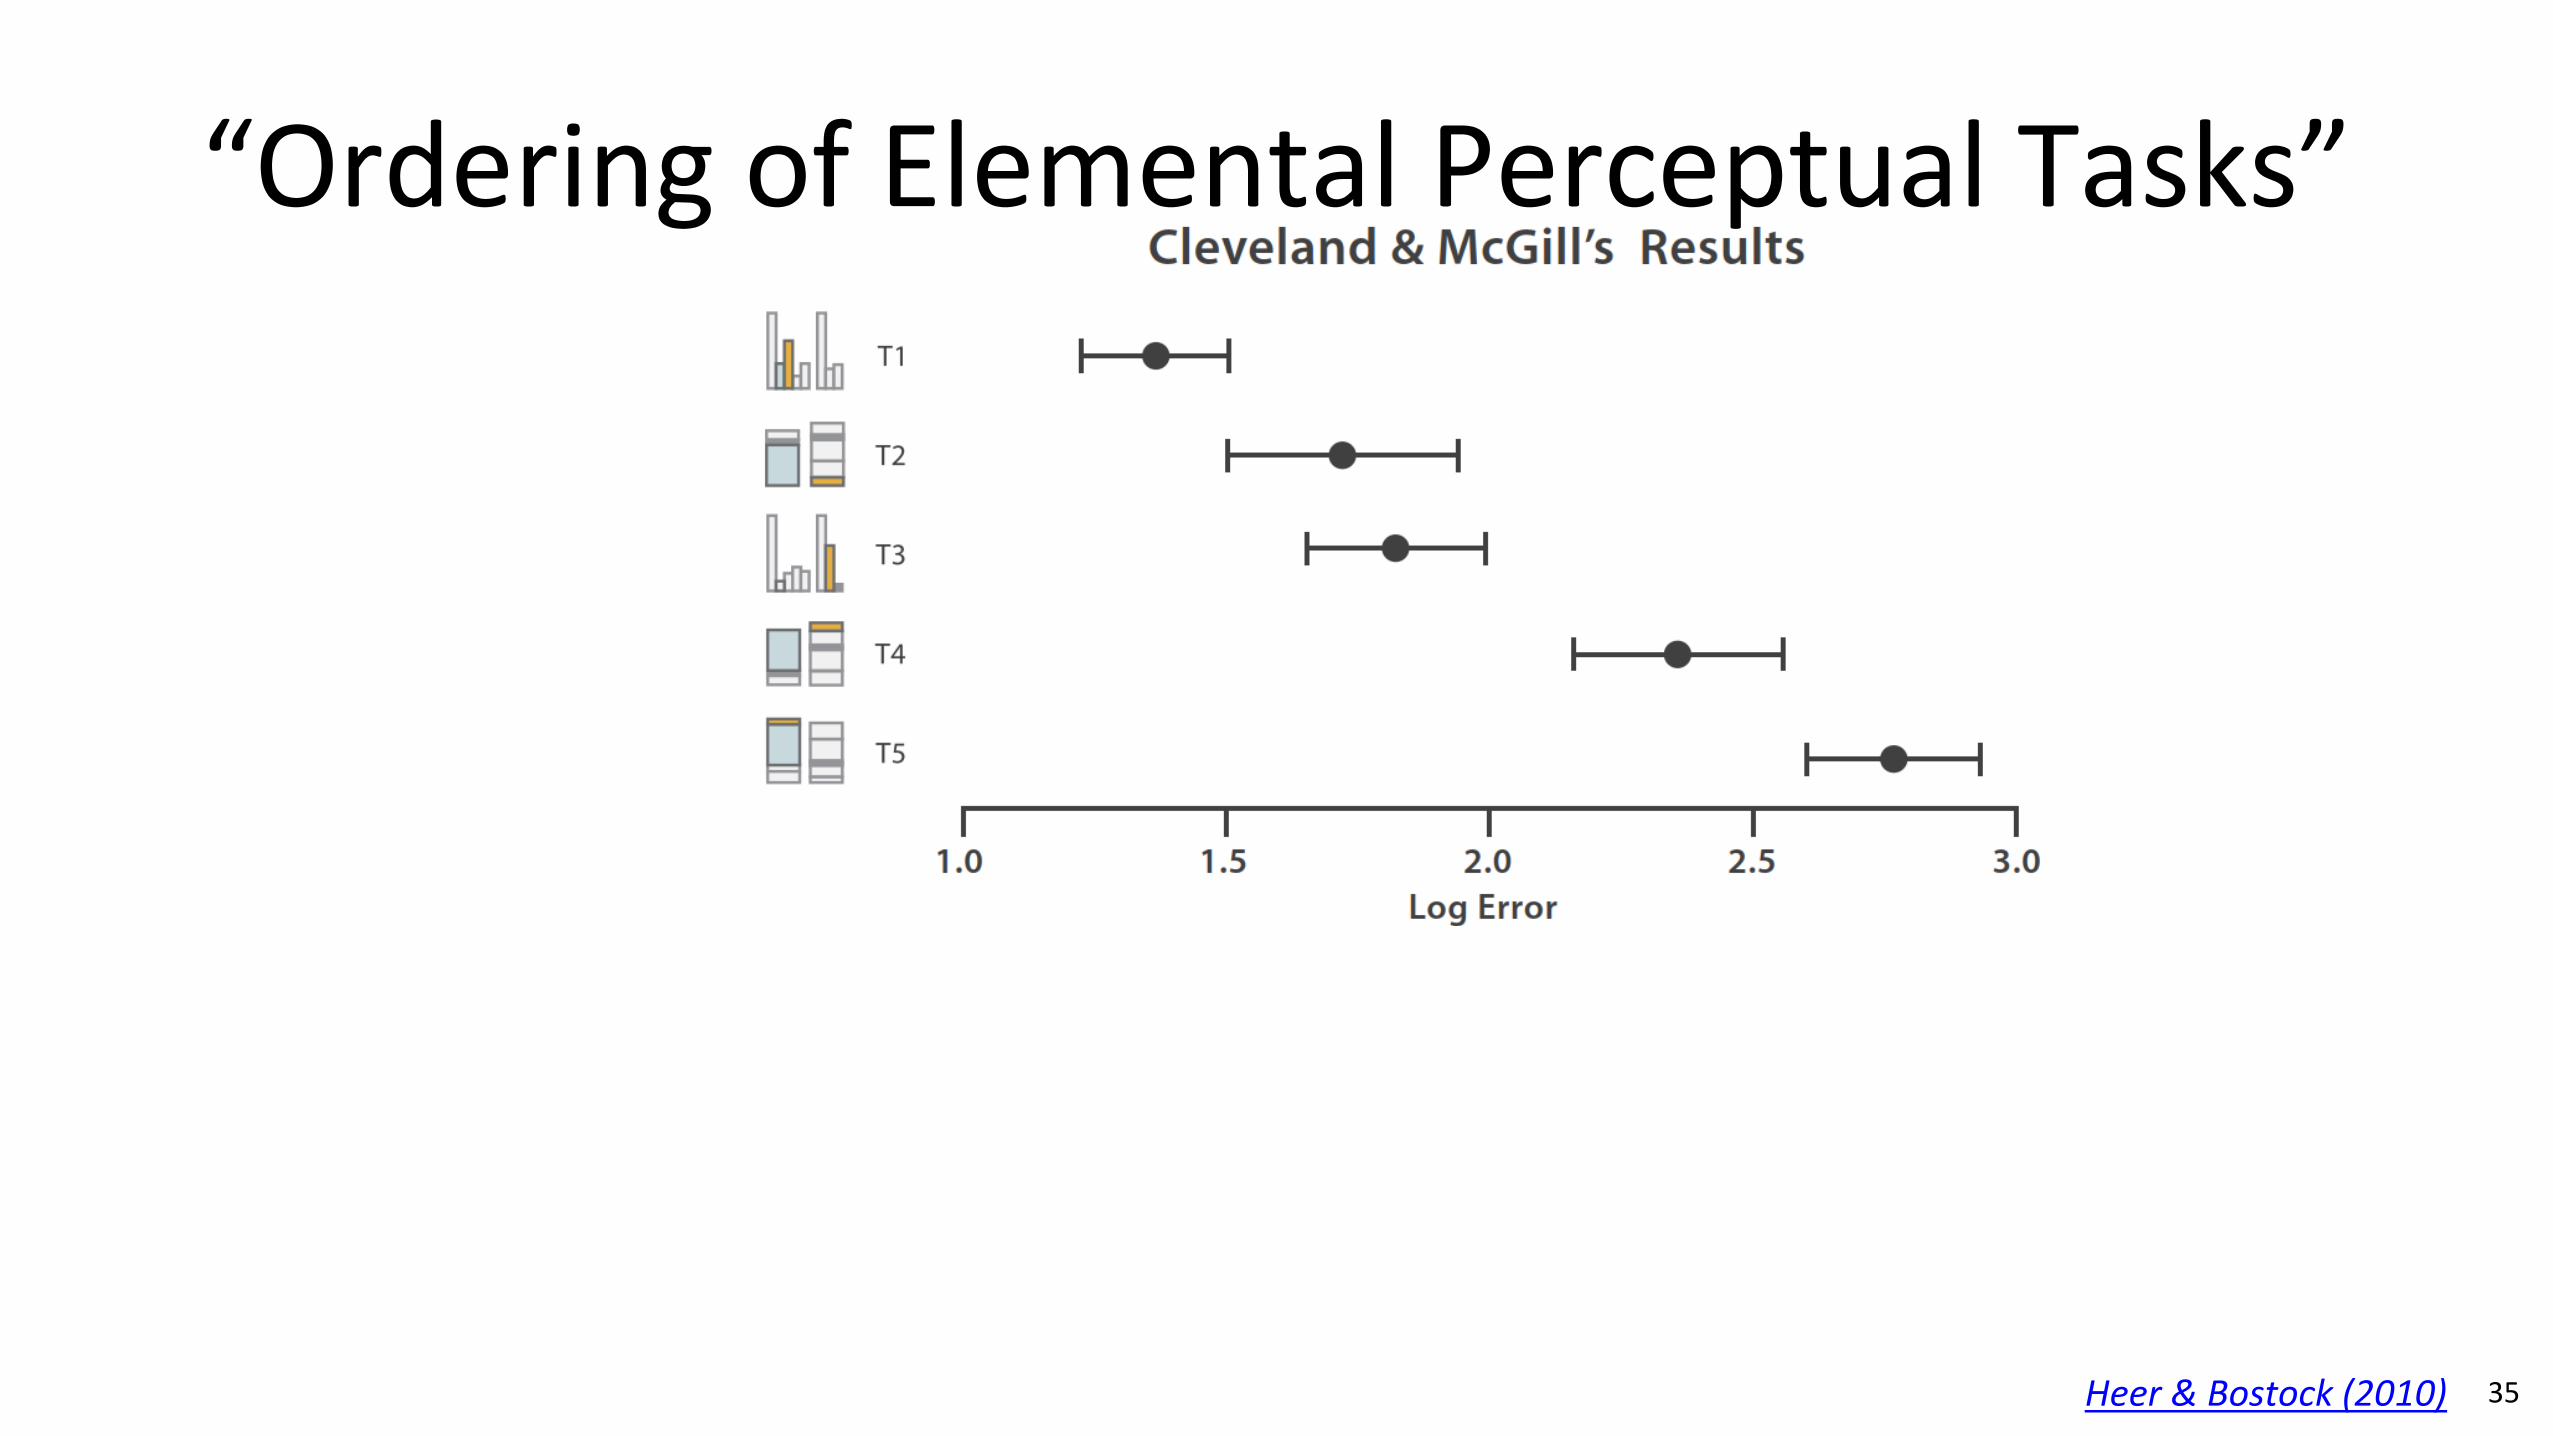
“Ordering of Elemental Perceptual Tasks”
Heer & Bostock (2010)

37

38

39
Expressiveness and Effectiveness
Expressiveness principle: the visual encoding should express all of, and only, the information in the dataset attributes.(i.e., data characteristics should match the channel)
Mackinlay (1986)
Effectiveness principle: the importance of the attribute should match the salience of the channel; that is, its noticeability.(i.e., encode most important attributes with highest ranked channels)

My Summary: Prioritize choosing the most appropriate channel for each attribute

41
Expressiveness and Effectiveness
Mackinlay (1986)

42
Expressiveness and Effectiveness
Mackinlay (1986)

43
Expressiveness and Effectiveness

IN-CLASS EXERCISE
44

3, 12, 42
45

3, 12, 42
Jonathan Schwabish
In-class Sketching: “Three numbers”20m
1. Individually (10m) use pens & post-it notes to sketch as many possible visualizations as you can of these three numbers.
2. No upload required3. As a class (10m) I will call on some of you to show your designs and
discuss common themes.
47

DATA TYPES
48

49
GOALS FOR TODAY
• Learn what are data types and dataset types
• Learn what are attribute types
• Learn how to pick appropriate visual representations based on attribute type and perceptual properties

50
Analysis
What data is shown?
Why is the user analyzing / viewing it?
How is the data presented?

51
Analysis
DATA ABSTRACTION
TASK ABSTRACTION
VISUAL ENCODING

52
Analysis
DATA ABSTRACTION
TASK ABSTRACTION
VISUAL ENCODING

53
TYPE = structural or mathematical interpretation of the data
Data Types
(variable, data dimension)
(row, node) (relationship) (spatial location) (sampling)

54
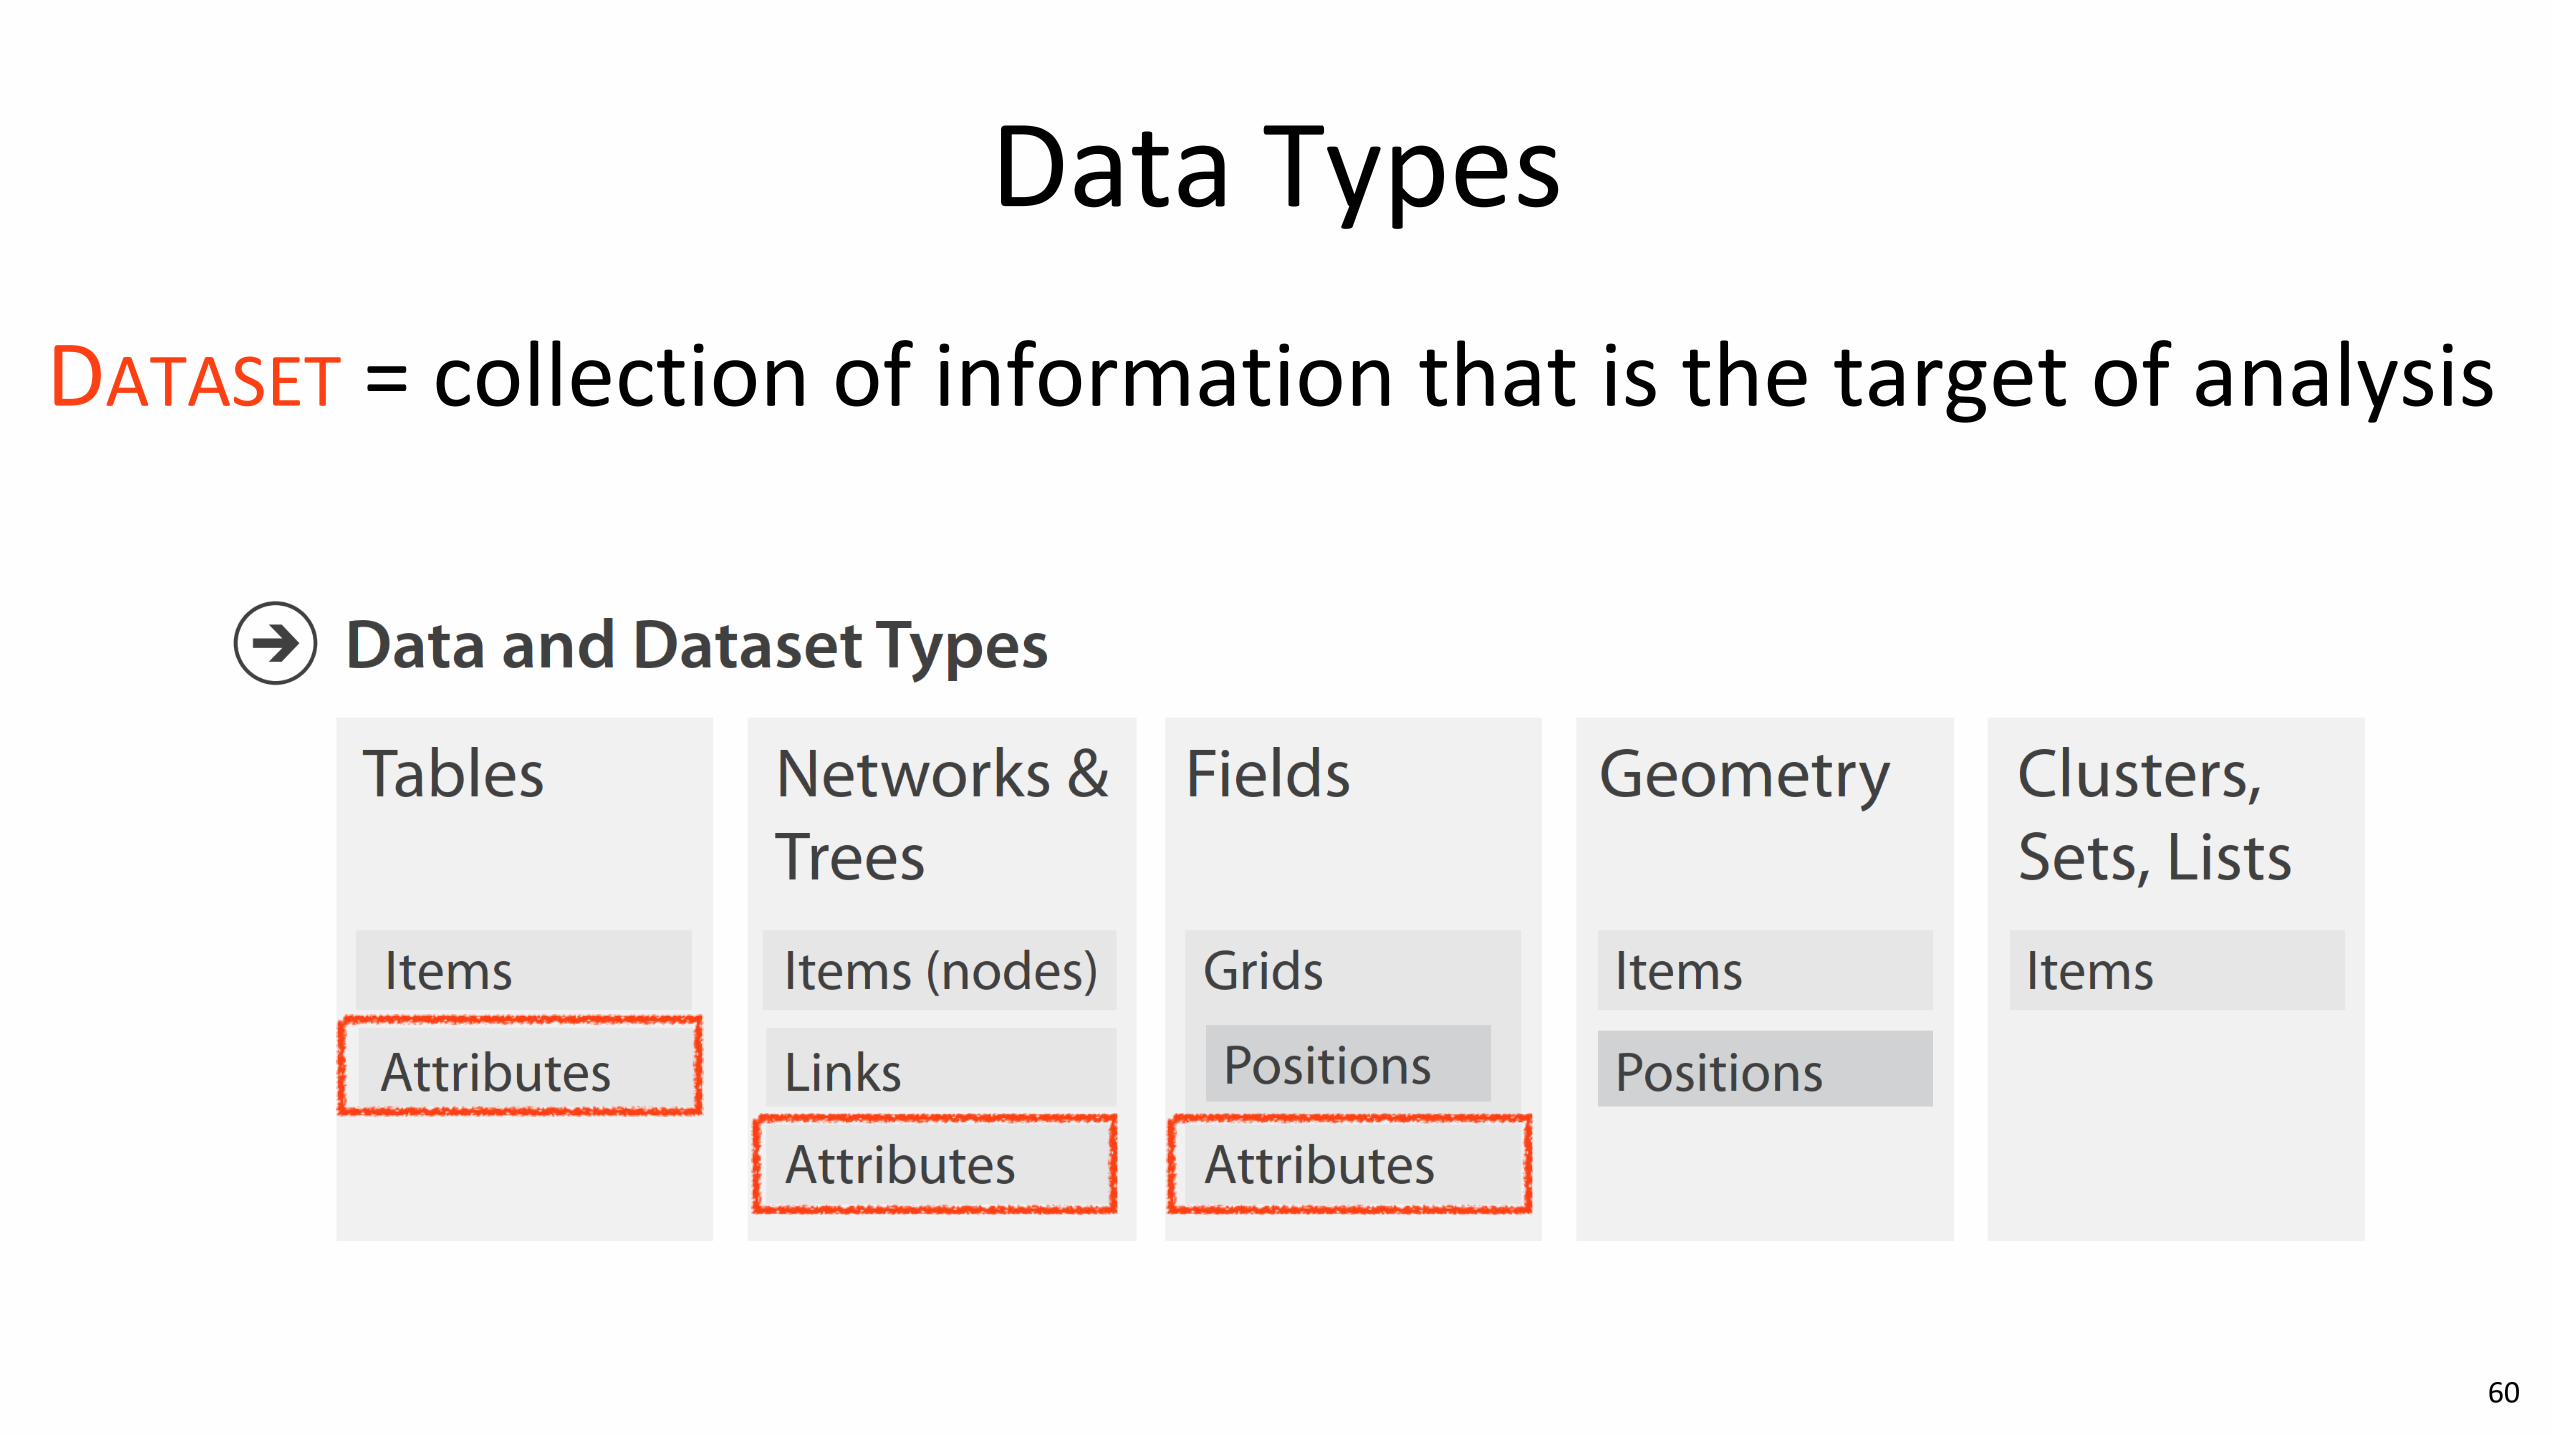
DATASET = collection of information that is the target of analysis
Data Types

55
Data Types
DATASET = collection of information that is the target of analysis


58https://en.wikipedia.org/wiki/Voronoi_diagram
“Voronoi Tessellation”

59Image courtesy of Patrik Jonsson
Voronoi Tessellation for Galaxy Evolution Simulation
60
Data Types
DATASET = collection of information that is the target of analysis

61
Attribute Types
(continuous)
e.g., fruit (apple, pear, grape), colleges (CAMD, Khoury, COE)
e.g.,sizes (xs, s, m, l, xl), months (J, F, M)
e.g., lengths (1’, 2.5’, 5’),population

http://www.nytimes.com/interactive/2016/09/12/science/earth/ocean-warming-climate-change.html
62
Quantitative
?Quantitative / Ordinal?
Categorical

63https://xkcd.com/388/Ordinal
Ordinal
Categorical
Note: On could also argue that Difficulty and Tastiness could be quantitative
(continuous)

64
Categorical
Quantitative

65

(Categorical)
66Mackinlay (1986)
Channel Ranking by Data Type

67Mackinlay (1986)
Channel Ranking by Data Type(Categorical)

68Mackinlay (1986)
Channel Ranking by Data Type
AREA
Quantitative
Ordinal
Categorical

69Mackinlay (1986)
Channel Ranking by Data Type

70
DATA ABSTRACTION

Upcoming Assignments & CommunicationA look at the upcoming assignments and deadlines
• Textbook, Readings & Reading Quizzes
• 2020-10-20Assignment 6 — D3 Event HandlingProject 3 — Interview & Task Analysis
• 2020-10-26 No Class — Attend IEEE VIS
• 2020-10-27Assignment 7a — Critique "Energy Portfolio Analysis"Assignment 7b — Critique "Color Theory“Project 4 — Data Collection & Exploration, Sketches
• 2020-10-28 No Class — Attend IEEE VIS
• 2020-10-30!New! Assignment 7 — IEEE VIS Session Critiques
• 2020-11-03Assignment 8 — Brushing and Linking in D3
https://c.dunne.dev/ds4200f20
Everyday Required Supplies:• 5+ colors of pen/pencil• White paper• Laptop and charger
Use Canvas Discussions for general questions, email the instructor & TAs for questions specific to you.