markets, certification and public perceptions of tilapia in the united states aaron mcnevin, ph.d....
Post on 20-Dec-2015
218 views
TRANSCRIPT
Markets, Certification and Public Perceptions of Tilapia in the United
States
Aaron McNevin, Ph.D.
World Wildlife Fund-US
Washington DC USA

World Wildlife Fund (WWF)
• Approximately 1.2 million members in the U.S. and another 4 million worldwide, WWF is the largest privately financed conservation organization in the world.
• Since 1985, WWF has invested over US$1.2 billion in more than 11,000 projects in 130 countries.
• Identifying global trends, impacts and opportunities
• Interests in reducing impacts of human use of natural resources

US Tilapia Fresh/Chilled Fillet Imports 2005 (Total 22,771 mt)

US Tilapia Frozen Fillet Imports 2005 (Total 55,680 mt)

US Tilapia Frozen Other Imports 2005 (Total 56,665 mt)

Country YearFresh/Chilled
FilletsFrozen Fillets
Frozen Whole/Other
BRAZIL 2005 962.6 1.7 8.3
2004 323.1 0 0
2003 208.3 26.9 0
CHINA 2005 44190.8 30936.4
2004 28076.1 31873.8
2003 15878.6 28782.9
COLOMBIA 2005 172.9 0 0
2004 0 0 0.5
2003 0 0 3
COSTA RICA 2005 3733.8 105.6 9.3
2004 4090.4 2.6 13.6
2003 3996.1 2.5 1.6
ECUADOR 2005 10600.5 266.6 65.1
2004 10163.8 172.1 75.8
2003 9396.9 186.4 143.3
EL SALVADOR 2005 306.7
2004 257.8
2003 188.6
HONDURAS 2005 6571.8
2004 4041.7
2003 2851.1
Country YearFresh/Chilled
FilletsFrozen Fillets
Frozen Whole/Other
INDONESIA 2005 6428.2 200.2
2004 4250.4 2.7
2003 3582.7 5.4
JAMAICA 2005 67.3 0
2004 8.6 4.2
2003 0 18.1
KOREA 2005 39.5 0.5
2004 18.3 37.7
2003 1.2 0
NICARAGUA 2005 68.5 2.8
2004 67.5 10.8
2003 2.9 8.4
PANAMA 2005 83.7 187.2 450.1
2004 92.8 94.3 101.7
2003 95.6 41.5 103.8
TAIWAN 2005 0 3081.1 24203.9
2004 15.9 2700.3 25010.4
2003 281.5 2469.7 19663.6
VIETNAM 2005 41.8 359.5 523.9
2004 0 18.1 24.9
2003 17 73.2 41.4
Note: Import quantities are in metric tons (mt)

Competition???
Country Year Pang. FR/CH Pang. FILL,FZ Pang. FR/CH Pang. FZ CC FILL, FZ CCFIL,FR/CH CC,FILL,FZ
BRAZIL 2005 0 84.8
2004 36.7 34.2
2003 8.6 0
CAMBODIA 2005 430.3 232.7 0 0 262.5
2004 0 118.6 0 39.8 39.9
2003 0 0 0 0 0
CHINA 2005 0 422.4 157.6 0 17.7 1094.2
2004 0 169.2 19.1 347.1 0 245.4
2003 0 0 0 326.1 0 0
HONG KONG 2005 20
2004 0
2003 0
INDONESIA 2005 0 26.3
2004 0 0
2003 0 0
MALAYSIA 2005 193.2 0
2004 0 0
2003 0 7.4
Pang = basa/tra
CC = channel catfish
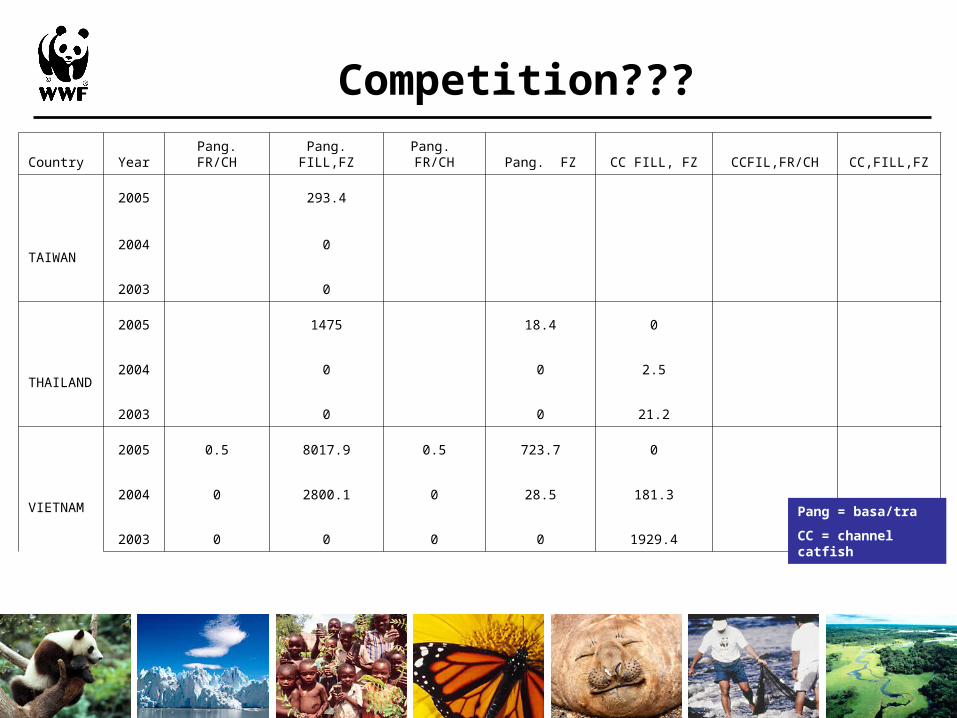
Country Year Pang. FR/CH Pang. FILL,FZ Pang. FR/CH Pang. FZ CC FILL, FZ CCFIL,FR/CH CC,FILL,FZ
TAIWAN
2005 293.4
2004 0
2003 0
THAILAND
2005 1475 18.4 0
2004 0 0 2.5
2003 0 0 21.2
VIETNAM
2005 0.5 8017.9 0.5 723.7 0
2004 0 2800.1 0 28.5 181.3
2003 0 0 0 0 1929.4
Competition???
Pang = basa/tra
CC = channel catfish
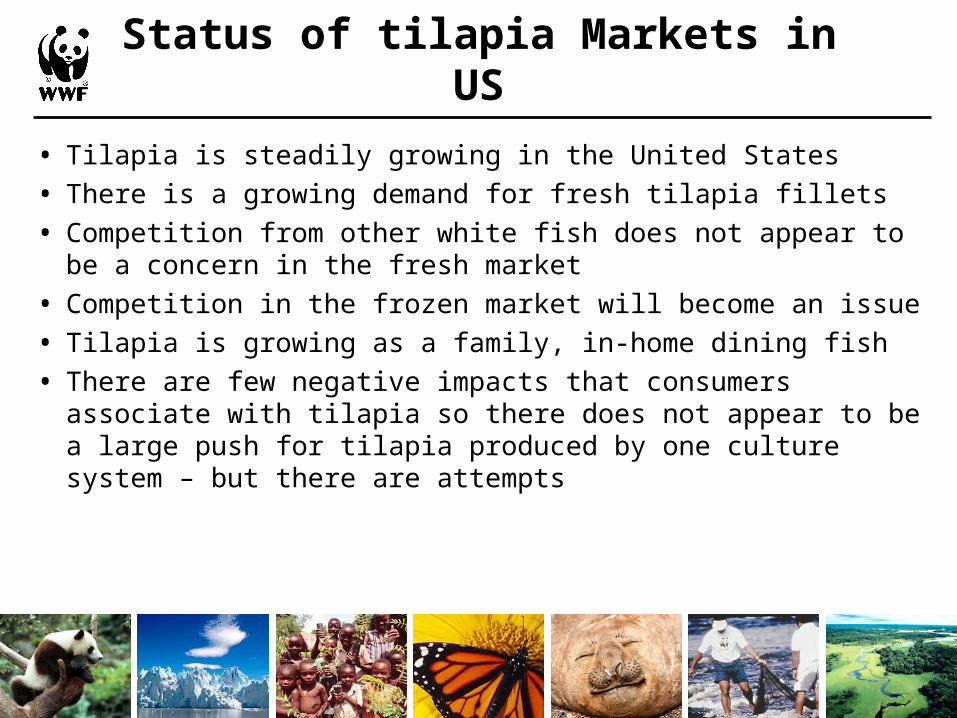
Status of tilapia Markets in US
• Tilapia is steadily growing in the United States
• There is a growing demand for fresh tilapia fillets
• Competition from other white fish does not appear to be a concern in the fresh market
• Competition in the frozen market will become an issue
• Tilapia is growing as a family, in-home dining fish
• There are few negative impacts that consumers associate with tilapia so there does not appear to be a large push for tilapia produced by one culture system – but there are attempts

Globally, what has WWF learned from markets?

Global Market Trends• Seafood exports generate twice as many $ for LDCs as coffee, tea,
rubber, bananas, rice, meat combined—35% from aquaculture
• Producers pitted against producers; race to the bottom
• Declining prices force focus on efficiency, input uses, reduced costs, market access, and market share
• Supply chain management and traceability pass liability back to producers
• Proliferation of corporate purchasing standards (e.g. Eurepgap, Walmart and GAA, Environmental Defense and Wegmans, Seafood Watch and Bon Appetit, Ahold and New England Aquarium) to address health and safety, product quality, and environmental impact.
• Some seafood tested 6 times before reaching the consumer – producer pays

What do retailers want?
• High quality
• Traceability
• Low environmental impact
• Social equity
• Fair labor
Who pays? - producers
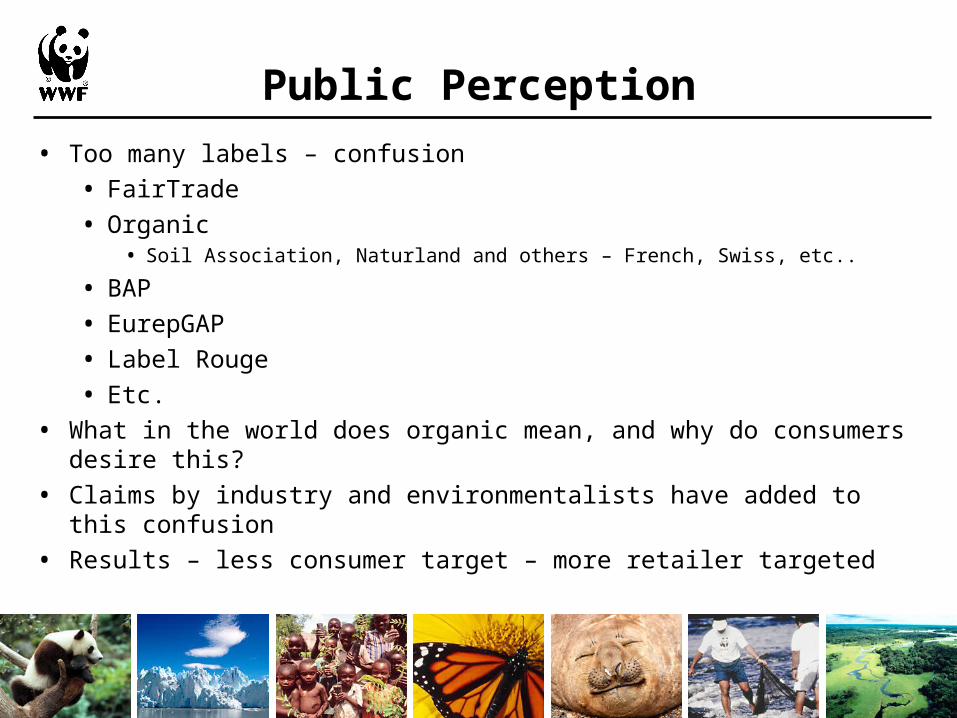
Public Perception
• Too many labels – confusion
• FairTrade
• Organic• Soil Association, Naturland and others – French, Swiss, etc..
• BAP
• EurepGAP
• Label Rouge
• Etc.
• What in the world does organic mean, and why do consumers desire this?
• Claims by industry and environmentalists have added to this confusion
• Results – less consumer target – more retailer targeted

Public Perception
• Monterey Bay Aquarium Seafood Watch
• Blue Ocean Institute
• Environmental Defense
• National Aquarium

Change in views
20041997
“If you’re a seafood company, you don’t crawl under the covers with greenies.”
“The sustainable seafood movement is here to stay. Make no mistake about that.”
“Market demand for sustainable, or environmentally responsible, fish is crossing over from a niche to the mainstream.”

Production Trends
• More efficient, reduction of impacts, but wide variation in performance levels—better and worse producers
• Fish oil most limiting factor followed by fishmeal
• Sustainability of reduction fisheries is key
• Old technologies are spreading to new species
• Net pen technology is being used for cold and warm water species around the world from cod to cobia
• “Ranching” is increasing—creating issues for tuna around take of juveniles from wild and feed
• Offshore aquaculture a reality
• Aquaculture has impacts, meaningful standards are essential

Why WWF and Aquaculture?
• Fastest growing food production system globally—due to both supply (over fishing) and demand issues
• Can either exacerbate or reduce pressure on wild fisheries
• Increasing number of new species produced by aquaculture (cod, hake, halibut, cobiha, tuna)
• New industry—significant potential for innovation
• FAO forecast global increase in seafood consumption of 1.5 kg/person—all from aquaculture
• In US, a 1.5-2 billion kg increase in seafood consumption by 2020, all from aquaculture

Comparison of seafood produced by aquaculture and by capture from the wild
Year
1980 1984 1988 1992 1996 2000 2004
Sea
food
pro
duct
ion
(met
ric to
ns)
0
20
40
60
80
100
120
140
160
180
AquacultureWild Capture
Aquaculture vs. Capture Fisheries

Year
1973 1978 1983 1988 1993 1998 2003
Pro
duct
ion
(m
etric
ton
s x
mill
ions
)
0
10
20
30
40
50
60
70 Pelagic capture for aquaculture feedPelagic capture for other usesAquaulture production
Aquaculture’s Share of Small Pelagics

Aquaculture vs. Capture
Year
1994 1996 1998 2000 2002
Pro
duct
ion
(mt X
1,0
00)
0
2
4
6
8
10
12
14
16
18AquacultureCapture
Tilapia
1993 1995 1997 1999 2001 2003
Pro
duct
ion
(mt x
mill
ions
)
0.0
0.5
1.0
1.5
2.0
2.5
Aquaculture Capture
Molluscs
1994 1996 1998 2000 2002
Pro
duct
ion
(mt x
mill
ions
)
0
2
4
6
8
10
Aquaculture Capture
Seaweed
1994 1996 1998 2000 2002
Pro
du
ctio
n (
mt
X 1
,00
0)
0
2
4
6
8
10
12
AquacultureCapture
Catfish
1992 1994 1996 1998 2000 2002
Pro
duct
ion
(mt
x 10
0,00
0)
0
3
4
5
6
Aquaculture Capture
Trout
AquacultureCapture
1993 1995 1997 1999 2001 2003
Pro
duct
ion
(mt x
mill
ions
)0.0
0.5
1.0
1.5
2.0
2.5 Salmon

Why Aquaculture Certification?
• Governments will only do so much, may discourage the worst but won’t encourage better or best
• Markets are driving production—can be part of solution
• Voluntary programs are key to sustainability, innovation and future BMPs
• Health and safety issues with aquaculture products
• Sustainability of some forms of production is a key issue and need to be addressed beyond compliance
• Certification can result in fewer, reduced impacts
• Certification can provide pond to plate traceability

Benefits to Producers
• May get a price premium (more likely for the first to be certified)
• Will reduce costs of production and net profits• Will reduce transaction costs for marketing• Will create new markets• Will hold on to existing markets• Will be able to forward contract prices further into future
when prices are declining• Will improve staff morale, retention and innovation• Will enhance reputation with regulators, buyers, the public• Will sleep better at night

A Comparison of Aquaculture Standards Development and/or Certification
•Alter-Trade (Fair Trade)
•Global Aquaculture Alliance (Industry)
•Naturland (Organic)
•Thai Marine Shrimp Code (Prod. Country)
•Carrefour (Retail)
•ISO 14,001

Comparing Certification Programs
No Program:• Has broad stakeholder support
• Has entirely measurable standards, is objective
• Is sufficiently transparent
• Could apply to most producers
• Adequately targets social issues
• Reduces producer costs
• Could exist without subsidies
• Guarantees product quality without residues

Elements of a Good Certification System
• Address multiple species with market relevance• Transparent and created in a multi-stakeholder process• Targets the key impacts (usually only 6-10)—landscape and
farm level• Measurably reduces key impacts against a baseline• Addresses both social and environmental impacts• Applies to different kinds of producers and what’s possible• Metric-based standards, by contrast to prescriptive
standards, encourage innovation• Certified by independent third-parties• Addresses chain of custody/traceability

WWF and Certification
• WWF played significant roles in the creation of several certification bodies
• Forest Stewardship Council
• Marine Stewardship Council
• Protected Harvest
• Marine Aquarium Council

WWF’s Goal
Performance Curve
Regulation
Performance
Shift
Best Performance
WWF’s Dialogues – A Forum for Standard Development
• Based on multi-stakeholder shrimp work (Consortium on Shrimp Farming and the Environment WWF/NACA/FAO/World Bank/UNEP
• Work began in 2002 with the Salmon Aquaculture Dialogue
• Subsequent dialogues – molluscs, catfish, and tilapia
• Multi-stakeholder oriented
• Science based (consensus)
• Transparent
How do we get standards?
• Bring wide range of stakeholders together• Consensus on goals and objectives• Consensus on key areas of impacts• Consensus on research gaps• Fund or help find funding to fill research gaps• Consensus on acceptable levels of impacts• Consensus on principles, criteria, and standards

Status and Developments
• Status
• Salmon
• Tilapia
• Molluscs
• Catfish
• Shrimp
• Future
• Trout
• Seaweed
• Tuna?

Where are we with tilapia?
• Identified and agreed on main areas of impacts• Developed goals and objectives for Tilapia Aquaculture Dialogue• Developed roles for components of dialogue• Formed steering committee
• William Marshall (Rainforest Aqaculture)• Alfonso Delfini, Jr. (AQUAMAR SA)• Mike Picchietti (Regal Springs)• Michael Tlusty (New England Aquarium)• Aaron McNevin (WWF)• 3rd NGO pending
• Drafted principles for responsible tilapia aquaculture (out for comment)• All found on our website (last slide)

Tilapia Aquaculture Dialogue Structure

Impacts (final)1. Effluent (nitrogen, phosphorus, recycling, downstream impacts, temperature,
microflora in waste, mortality)2. Ecological Integrity
• Siting (where you place or build production facility)• Disease transmission• Loss of biodiversity and habitat alterations• Conversion of natural habitat• Predator control (birds, fish)
3. Inputs (Feed, chemicals, medications [MT/YY], energy)4. Invasives (population, community, hybridization, GMO)5. Food safety/quality (labeling, carbon monoxide [tasteless smoke], human
health)6. Socio-economic
• Social (employees, community, good neighbors)• Resource-use conflicts (land, water, systems of allocation)• Economic (out-competition of local businesses)

Principles for Responsible Tilapia AquacultureThe Tilapia Aquaculture Dialogue (draft)
Preamble• The goal of the Tilapia Aquaculture Dialogue is to develop and implement
verifiable environmental and social performance levels that; 1) measurably reduce or eliminate key negative impacts of tilapia farming and
are acceptable to stakeholders, 2) address food safety and human health concerns as they relate to tilapia culture, processing, distribution and labeling and 3) recommend standards that achieve these performance levels while permitting the tilapia farming industry to remain economically viable. To achieve this goal the Tilapia Aquaculture Dialogue has developed 8 principles to be the basis for the development of acceptable performance-based standards.
To ensure proper application and objectivity the following guiding principle has been developed: No tilapia production facility will be prejudged as environmentally or socially acceptable or unacceptable based solely on its nationality, ownership, location, culture method, or the specific strain of tilapia cultured.

Principles for Responsible Tilapia Aquaculture (draft)
• Principle 1: Locate and operate tilapia farms according to national planning within established legal frameworks so that farms do not compromise environmental, social and economic sustainability.
• Principle 2: Design, construct and operate tilapia farms in ways that minimize environmental damage.
• Principle 3: Minimize the impact of water use on water resources.• Principle 4: Shall not be the primary conduit for the introduction of an
exotic species.• Principle 5: Utilize feeds and feed management practices that make
efficient use of available feed resources, promote efficient tilapia growth, and minimize waste and nutrient production and discharge.
• Principle 6: Health management plans should be adopted that aim to reduce stress, minimize the risks of disease affecting both the cultured and wild stocks, and increase food safety.
• Principle 7: Ensure food safety and the quality of tilapia products, whilst reducing the risks to ecosystems and human health.

Thank You
http://www.worldwildlife.org/cci/aquaculture_dialogues.cfm
http://groups.yahoo.com/group/tilapia
comments and [email protected]