markets are a mechanism that brings buyers and sellers together to exchange goods, services, and...
Post on 21-Dec-2015
225 views
TRANSCRIPT


Markets Are a mechanism that brings buyers and sellers
together to exchange goods, services, and resources….
…it is a device for allocating or rationing goods, services, and resources.
• Product market: where consumer goods are bought and sold. Business firms are the seller, consumers are the buyers
• Resource market: where the resource services are bought and sold. Resource owners(consumers) are the sellers and business firms are the buyers

Definition: relationship between the price and the quantity demanded of a good.
• Quantity demanded: amount of an item that buyers are willing and able to purchase over a certain time period, at a specific price, ceteris paribus.
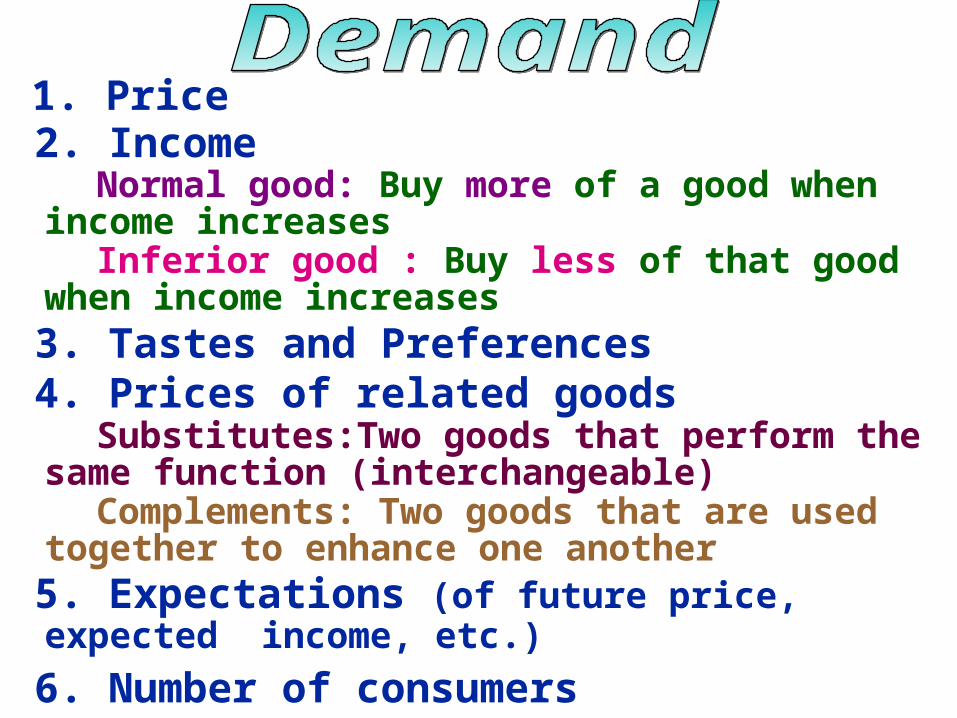
1. Price 2. Income Normal good: Buy more of a good when income
increases Inferior good : Buy less of that good when income
increases 3. Tastes and Preferences 4. Prices of related goods Substitutes:Two goods that perform the same function
(interchangeable) Complements: Two goods that are used together to
enhance one another 5. Expectations (of future price, expected income, etc.)
6. Number of consumers

• By holding all other variables constant we get our first prediction (hypothesis)...
… Law of Demand: The price and quantity demanded of a good are inversely related, ceteris paribus.
• Demand schedule: A list of possible pricespossible prices with the corresponding quantity demandedquantity demanded at that price.
It is a representation of the law of demand.• What if the price was......... then what would be
quantity demanded at that price.• Think of it like answering a survey.…
…no other variable changes except the one you ask about
1. Price

Example: A demand schedule For Coffee
Price (per pound) Quantity Demanded (pounds per week)
$7.00 1,000$6.50 2,000$6.00 3,000$5.50 4,000$5.00 5,000$4.50 6,000$4.00 7,000$3.50 8,000$3.00 9,000

Demand curve - a curve representing the law of demand.
Price Quantity
Demanded
$7.00 1,000
$6.50 2,000
$6.00 3,000
$5.50 4,000
$5.00 5,000
$4.50 6,000
$4.00 7,000
$3.50 8,000
$3.00 9,000
Price
Quantity Demanded (QD) (In thousands)
0
$1.00
$2.00
$3.00
$4.00
$5.00
$6.00
$7.00
1 2 3 4 5 6 7 8 9 10
Connect the dots and we get......
A Demand Curve!
As the price price of a good decreasesdecreases, buyers are willing and able to purchase more purchase more of this good, all other variables constant
Plot the demand schedule on the graph....
Price
Quantity Demanded (QD) (In thousands)
0
$1.00
$2.00
$3.00
$4.00
$5.00
$6.00
$7.00
1 2 3 4 5 6 7 8 9 10
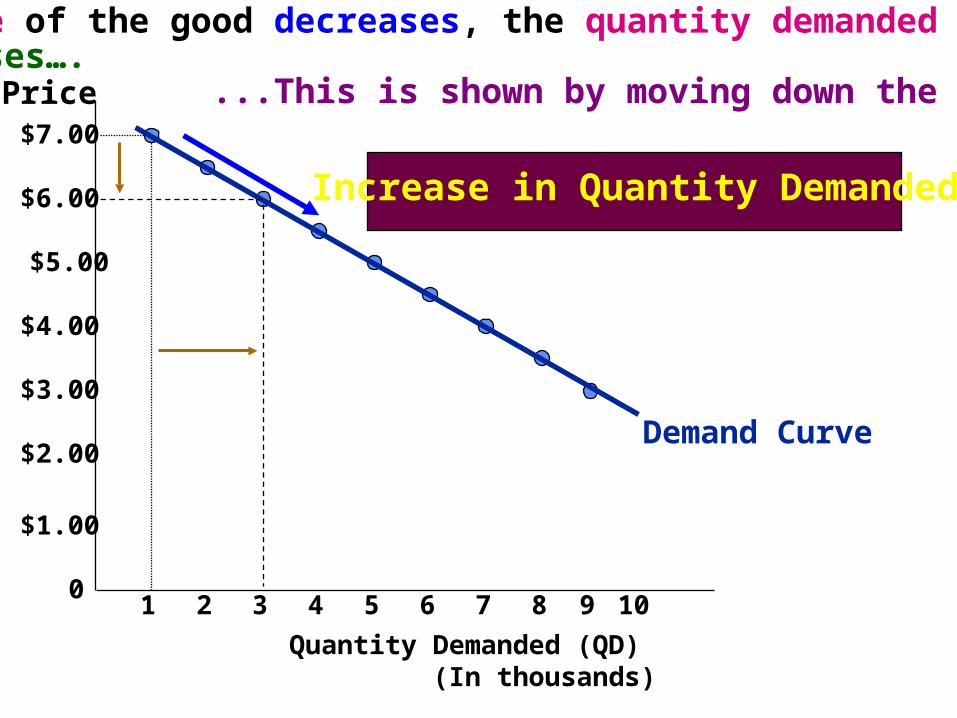
If the price of the good decreases, the quantity demanded of the good increases…. ...This is shown by moving down the demand curve
Demand Curve
Increase in Quantity Demanded

What about the other variables?• To construct a demand curve a number of
variables are held constant...(Income, Expectations, prices of related goods, etc)
• What would happen to the demand curve if one of these variables were to change?
• Example: Suppose consumers income increases and coffee is a normal good.
People will want to buy more coffee...
...not just at one specific price but at all prices...

Price
Quantity Demanded (QD) (In thousands)
0
$1.00
$2.00
$3.00
$4.00
$5.00
$6.00
$7.00
1 2 3 4 5 6 7 8 9 10
Demand Curve
Increase in Demand
Price Quantity QD Demand (new) $7.00 1,000 2,000 $6.50 2,000 3,000 $6.00 3,000 4,000 $5.50 4,000 5,000 $5.00 5,000 6,000 $4.50 6,000 7,000 $4.00 7,000 8,000 $3.50 8,000 9,000 $3.00 9,000 10,000
Which means all points on the Demand curve SHIFT to the RIGHT...
...So if the price were $7.00, coffee drinkerswould by 2,000 pounds instead of 1,000
If the price were $4.00coffee drinkers would buy 8,000 pounds instead of 7,000
Demand Curve(after income increase)
…in other words the Demand curve has SHIFTED to the right

Price
Quantity Demanded (QD) (In thousands)
0
$1.00
$2.00
$3.00
$4.00
$5.00
$6.00
$7.00
1 2 3 4 5 6 7 8 9 10
Demand Curve
Demand Curve(after income decrease)
Decrease in Demand
What if consumers incomeincome went down went down instead; then they would buy less at all prices.....causing the Demand curve to shift to the left shift to the left.

Changes in demand vs. Changes in quantity demanded• If one of the variables held constant when first
constructing the demand curve (all other variables besides the price of the good) were to change...
... this would shift the demand curve either to the right (increase in demand) or to the left (decrease in demand).
• If the price of the good were to change then there would be either a decrease in quantity demanded (if price rises) or an increase in quantity demanded (if price falls)…
…this is shown by moving up or down the original demand curve

Price
Quantity Demanded
Changes in quantity demanded(caused by the price of the good)
Original Demand curve
Changes in Demand (caused by a “ceteris paribus” variable)Will shift the position of the demand curve.
Changes in demand vs. Changes in quantity demanded

How do the other “ceteris paribus” variables affect the demand curve?
1. Prices of related goods• Substitutes If the price of tea increasesincreases, then consumers will wish to
buy more coffee...since coffee is now cheaper compared to tea.
In general, as the price of a substitute goodprice of a substitute good increases increases, the demand for the other good(coffee) increases.increases.
• Therefore, there is a direct relationship between the demand for a good and the price of a substitute good.
• Other examples: Foreign cars - American cars, chicken - beef, Coke - Pepsi, etc.
• Consumers always purchase more of the good that is now cheaper relative to the other good.

“Ceteris paribus” Variables1. Prices of related goods• Complements • If the price of sugar and cream were to increaseincrease, then
consumers will desire to buy less coffee. As the price of a complementary goodprice of a complementary good increases increases, the
demand for the other good(coffee) decreasesdecreases.• Therefore, there is an inverse relationship between the
demand for a good and the price of a complementary good.
• Other examples: Cars - gasoline, Computers - software, Compact discs - Compact disc players, Hot dogs - mustard
• Demand decreases because the two joined products (Coffee-sugar-cream) now are more expensive.

“Ceteris paribus” Variables2. Tastes & Preferences
If consumers prefer a good there is an increase in demand. If a good falls out of favor there is a decrease in demand
Advertising could have an effect on tastes & preferences
3. Expectations Of future prices, availability of goods, income. If you believe that prices will increase in the future, you
will want to buy more today before the price increase (increase in demand)
Important for prices of commodities, stocks, and bonds
4. # of consumers: more consumers, increase in demand
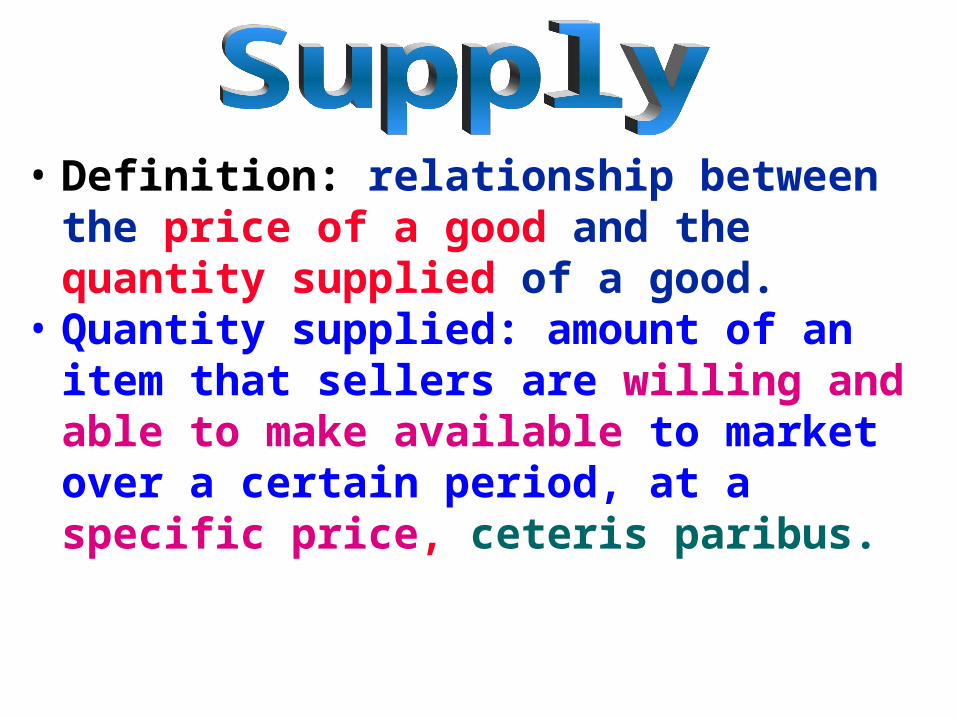
• Definition: relationship between the price of a good and the quantity supplied of a good.
• Quantity supplied: amount of an item that sellers are willing and able to make available to market over a certain period, at a specific price, ceteris paribus.

1. Price of the good
2. Price of inputs (resources)
3. Technology
4. Prices of other goods that can be produced by the firm
5. Expectations of future price
6. Number of Firms
7. Taxes and Subsidies

• By holding all other variables constant we get our second prediction (hypothesis).
Law of Supply: The price and quantity supplied of a good are directly related, ceteris paribus.
• Supply schedule: A list of possible pricespossible prices with the corresponding quantity suppliedquantity supplied at that price.
It is a representation of the law of supply.• What if the price was... then what would be quantity
supplied at that price.
1. Price

Example: A supply schedule For Coffee
Price (per pound) Quantity Supplied (pounds per week)
$7.00 9,000
$6.50 8,000
$6.00 7,000
$5.50 6,000
$5.00 5,000
$4.50 4,000
$4.00 3,000
$3.50 2,000
$3.00 1,000
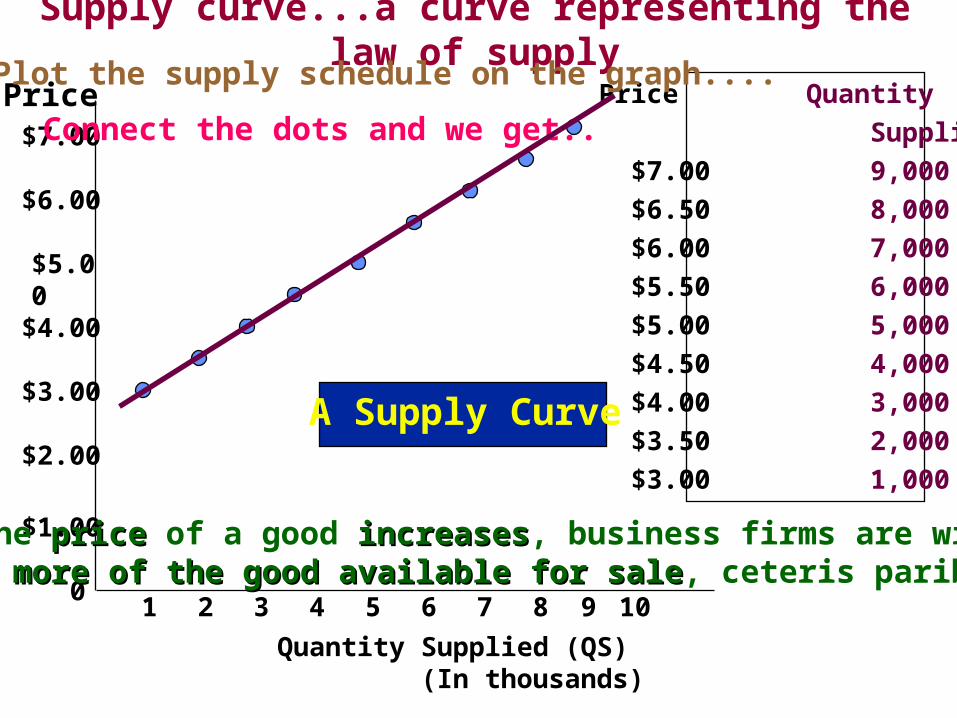
Supply curve...a curve representing the law of supply
Price
Quantity Supplied (QS) (In thousands)
0
$1.00
$2.00
$3.00
$4.00
$5.00
$6.00
$7.00
1 2 3 4 5 6 7 8 9 10
Connect the dots and we get..
A Supply Curve
As the price price of a good increasesincreases, business firms are willing to make more of the good available for salemake more of the good available for sale, ceteris paribus
Price Quantity
Supplied
$7.00 9,000
$6.50 8,000
$6.00 7,000
$5.50 6,000
$5.00 5,000
$4.50 4,000
$4.00 3,000
$3.50 2,000
$3.00 1,000
Plot the supply schedule on the graph....
Price
Quantity Supplied
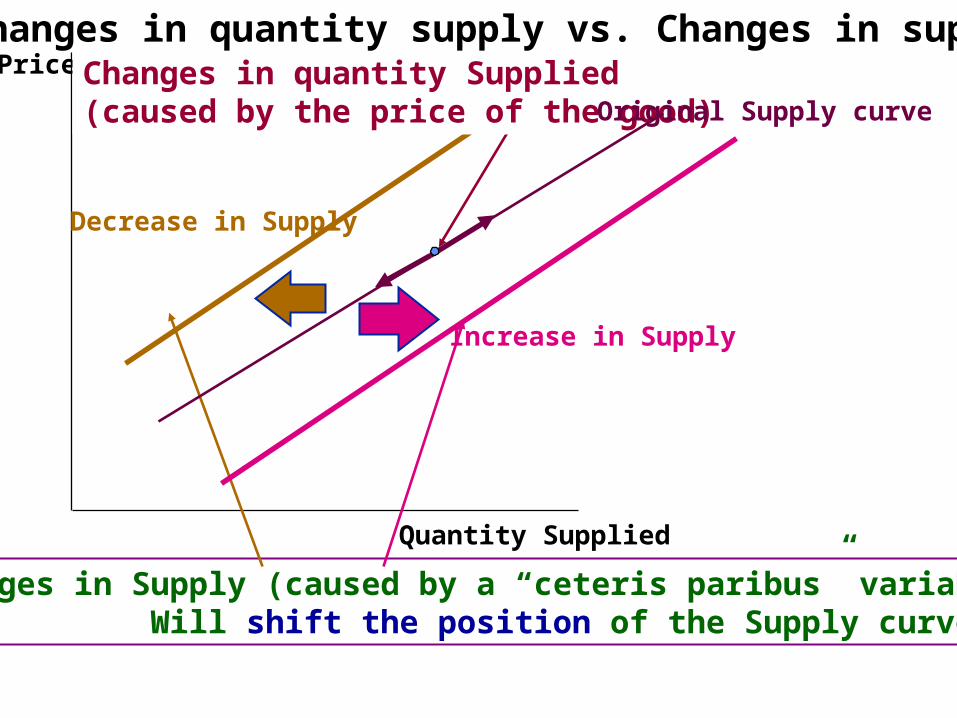
Changes in quantity Supplied(caused by the price of the good)
Changes in Supply (caused by a “ceteris paribus” variable) Will shift the position of the Supply curve.
Changes in quantity supply vs. Changes in supply
Increase in Supply
Decrease in Supply
Original Supply curve

How do the “ceteris paribus” variables affect the Supply curve?
• Price of inputs (resources)If the price of an input increases (labor, materials,etc) this
makes a good more expensive to produce (raises costs).
This lowers the potential profit of the firm and the firm will wish to decrease the supply of the good
• Opposite example: The decline in the price of computer processors and chips makes costs decline for computer manufacturers and they increase supply
• Summary: A decline in input prices increases supply. A rise in input prices decreases supply.

“Ceteris paribus” variables (Supply)• Technology...allows a firm to produce the same
amount of a good with less resources, which results in lower costs and an increase in supply
• Price of other goods the firm can produce... Example: If a farmer who grows coffee beans finds that
another crop will pay them more…… they devote less land to coffee(a decrease in supply)
and more land to the other crop• Expectations...of future prices If firms expect higher prices in the future they will
make less available today (decrease in supply). Why? So they will have more to sell in the future (at the higher
prices
“Ceteris paribus” variables (supply)• Number of firms The more firms that produce the good the greater is
the supply of the good (more it shifts to the right)
• Taxes and Subsidies Excise taxes...a tax on a good (gas, cigarette,etc)• An increase in excise taxes will raise the cost of the
good, lower potential profits, cause a decrease in supply
• A subsidy gives money (directly or indirectly) to firms, lowers the cost of the good and will increase supply.
• Examples: Public colleges and universities receive money from state governments.
• Immunizations are also subsidized by the government
Market Equilibrium• Equilibrium: Definition -
At rest, no tendency to change, forces in balance.
• Market equilibrium…
…the price, once reached, when there will be no tendency to change. The price the market comes to rest at and there are forces in balance.
• This can only occur when the…
Quantity demand (QD) = Quantity supplied (QS)• Price is a rationing device…
…based on willingness and ability to pay
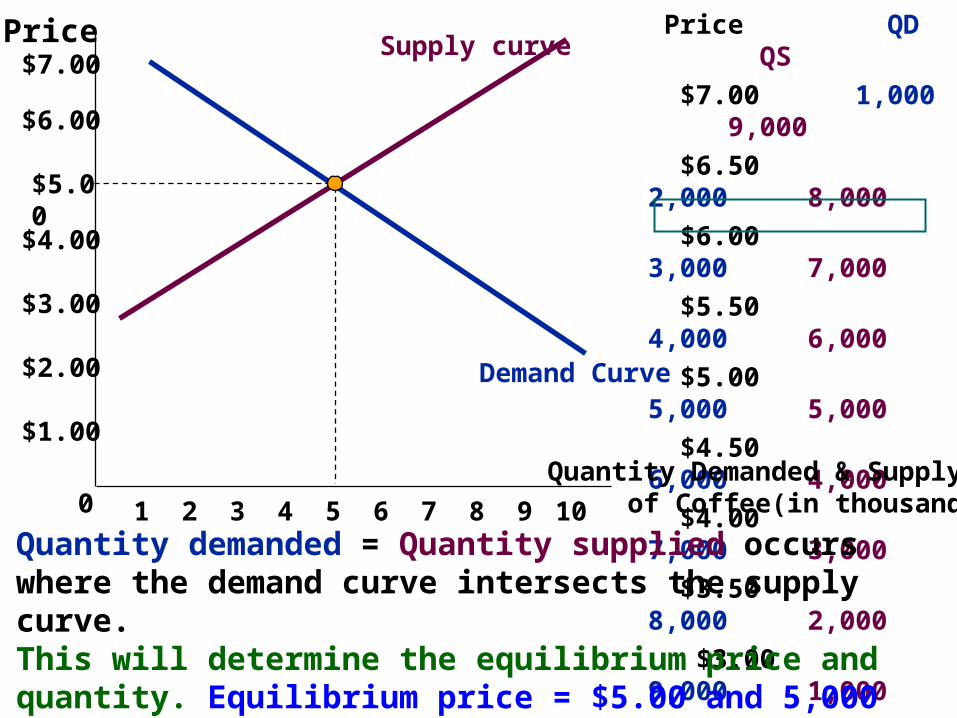
Price QD QS
$7.00 1,000 9,000
$6.50 2,000 8,000
$6.00 3,000 7,000
$5.50 4,000 6,000
$5.00 5,000 5,000
$4.50 6,000 4,000
$4.00 7,000 3,000
$3.50 8,000 2,000
$3.00 9,000 1,000
Price
Quantity Demanded & Supply of Coffee(in thousands)0
$1.00
$2.00
$3.00
$4.00
$5.00
$6.00
$7.00
1 2 3 4 5 6 7 8 9 10
Demand Curve
Quantity demanded = Quantity supplied occurs where the demand curve intersects the supply curve. This will determine the equilibrium price and quantity. Equilibrium price = $5.00 and 5,000 pounds of coffee are bought and sold at that price
Supply curve

Price QD QS
$7.00 1,000 9,000
$6.50 2,000 8,000
$6.00 3,000 7,000
$5.50 4,000 6,000
$5.00 5,000 5,000
$4.50 6,000 4,000
$4.00 7,000 3,000
$3.50 8,000 2,000
$3.00 9,000 1,000
Price
Quantity Demanded & Supply of Coffee(in thousands)0
$1.00
$2.00
$3.00
$4.00
$5.00
$6.00
$7.00
1 2 3 4 5 6 7 8 9 10
Demand Curve
Supply curve
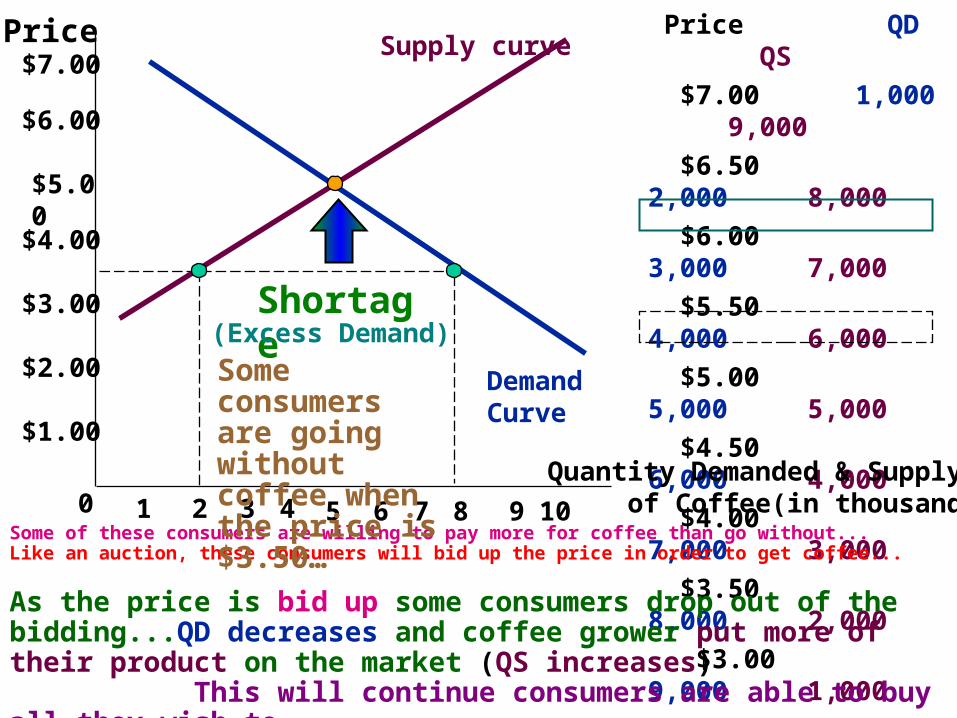
Economically (not graphically), how would equilibrium be reached?Suppose that the price for coffee were $3.50 instead........
...At the price of $3.50 QS = 2,000 and QD = 8,000 ( QD > QS)• Consumers wish to buy more coffee than firms are willing to
make available at $3.50. This means we have a...
Shortage (Excess Demand)
Price QD QS
$7.00 1,000 9,000
$6.50 2,000 8,000
$6.00 3,000 7,000
$5.50 4,000 6,000
$5.00 5,000 5,000
$4.50 6,000 4,000
$4.00 7,000 3,000
$3.50 8,000 2,000
$3.00 9,000 1,000
Price
Quantity Demanded & Supply of Coffee(in thousands)0
$1.00
$2.00
$3.00
$4.00
$5.00
$6.00
$7.00
1 2 3 4 5 6 7 8 9 10
Demand Curve
Supply curve
Some of these consumers are willing to pay more for coffee than go without...Like an auction, these consumers will bid up the price in order to get coffee...
Shortage (Excess Demand)
Some consumers are going without coffee when the price is $3.50…
As the price is bid up some consumers drop out of the bidding...QD decreases and coffee grower put more of their product on the market (QS increases) This will continue consumers are able to buy all they wish to. Only when QD = QS can this occur. Which is at the equilibrium price!

Price QD QS
$7.00 1,000 9,000
$6.50 2,000 8,000
$6.00 3,000 7,000
$5.50 4,000 6,000
$5.00 5,000 5,000
$4.50 6,000 4,000
$4.00 7,000 3,000
$3.50 8,000 2,000
$3.00 9,000 1,000
Price
Quantity Demanded & Supply of Coffee(in thousands)0
$1.00
$2.00
$3.00
$4.00
$5.00
$6.00
$7.00
1 2 3 4 5 6 7 8 9 10
Demand Curve
Supply curve
Suppose that the price for coffee were $6.00 instead...At the price of $6.00 QS = 7,000 and QD = 3,000 ( QD < QS)Coffee growers would like to sell more coffee than consumers wish to
buy at $6.00. This means we have a…
Surplus (Excess Supply)
At the price of $6.00 some coffee growers are not able to sell all they wish to…
Some growers will want to sell more and to do so will cut prices!cut prices!

Price QD QS
$7.00 1,000 9,000
$6.50 2,000 8,000
$6.00 3,000 7,000
$5.50 4,000 6,000
$5.00 5,000 5,000
$4.50 6,000 4,000
$4.00 7,000 3,000
$3.50 8,000 2,000
$3.00 9,000 1,000
Price
Quantity Demanded & Supply of Coffee(in thousands)0
$1.00
$2.00
$3.00
$4.00
$5.00
$6.00
$7.00
1 2 3 4 5 6 7 8 9 10
Demand Curve
Supply curve
As prices are decreased, consumers will wish to buy more (QD increases), and some coffee growers will take their product off the market (QS decreases)
This will continue until all growers are able to sell all they wish to.Only when QS = QD can this occur. It is at the Equilibrium price!
Surplus (Excess Supply)

Price
Quantity of Coffee (In thousands)0
$1.00
$2.00
$3.00
$4.00
$5.00
$6.00
$7.00
1 2 3 4 5 6 7 8 9 10
Demand Curve
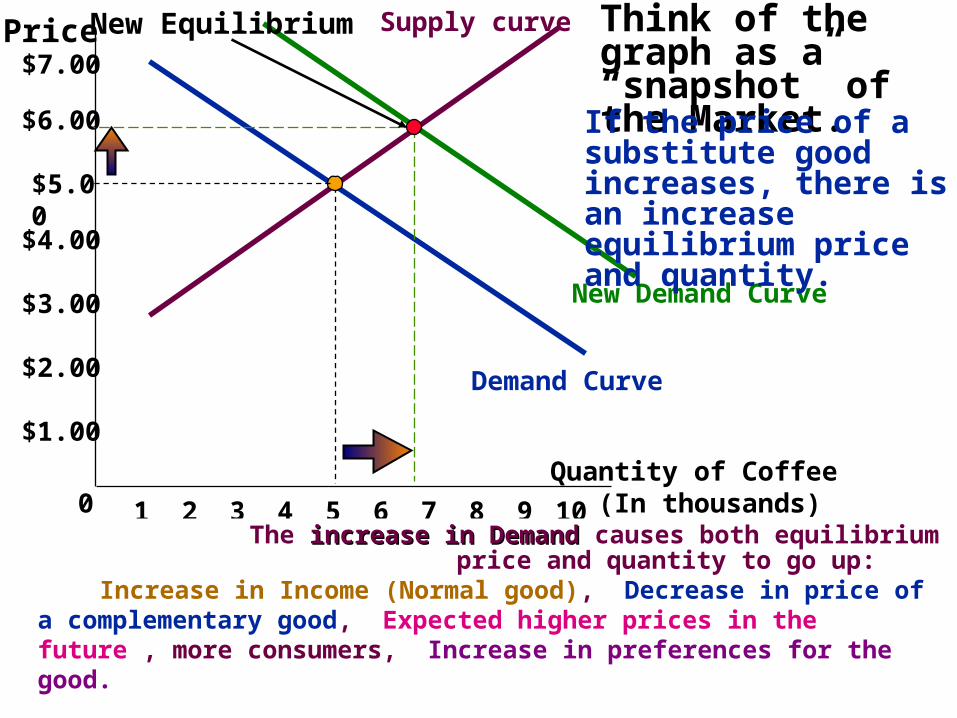
Supply curve Think of the graph as a “snapshot” of the Market.
If something changes(the Supply or Demand curve shifts) in the Market the “snapshot” will change...
Example: If the price of tea(a substitute good) increases, consumers will want more coffee (increase in demand)
New Demand Curve
New Equilibrium
If the price of a substitute good increases, there is an increase equilibrium price and quantity.
The increase in Demandincrease in Demand causes both equilibrium price and quantity to go up:
Increase in Income (Normal good), Decrease in price of a complementary good, Expected higher prices in the future , more consumers, Increase in preferences for the good.
Price
Quantity of Coffee (In thousands)0
$1.00
$2.00
$3.00
$4.00
$5.00
$6.00
$7.00
1 2 3 4 5 6 7 8 9 10
Demand Curve
Supply curve1
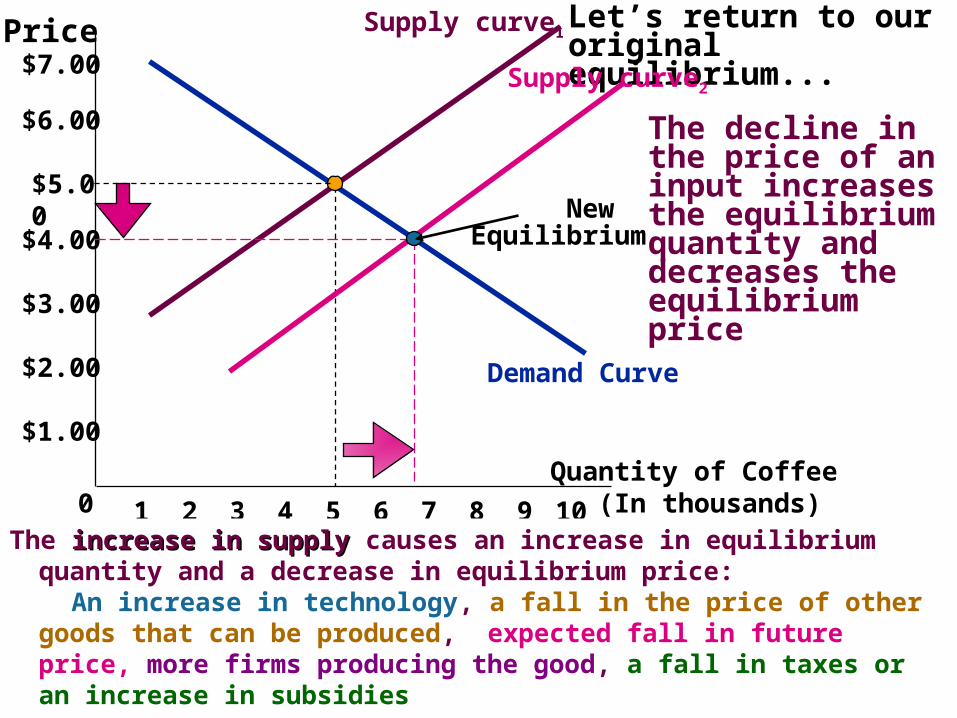
Suppose the price of land(for growing coffee) decreases......the decline in the price of an input will increase the
profitability of coffee growers who will want to produce more (increase in supply)…..
Let’s return to our originalequilibrium...
Supply curve2
New Equilibrium
The decline in the price of an input increases the equilibrium quantity and decreases the equilibrium price
The increase in supplyincrease in supply causes an increase in equilibrium quantity and a decrease in equilibrium price:
An increase in technology, a fall in the price of other goods that can be produced, expected fall in future price, more firms producing the good, a fall in taxes or an increase in subsidies

Other ExamplesMaking predictions about
price and quantity
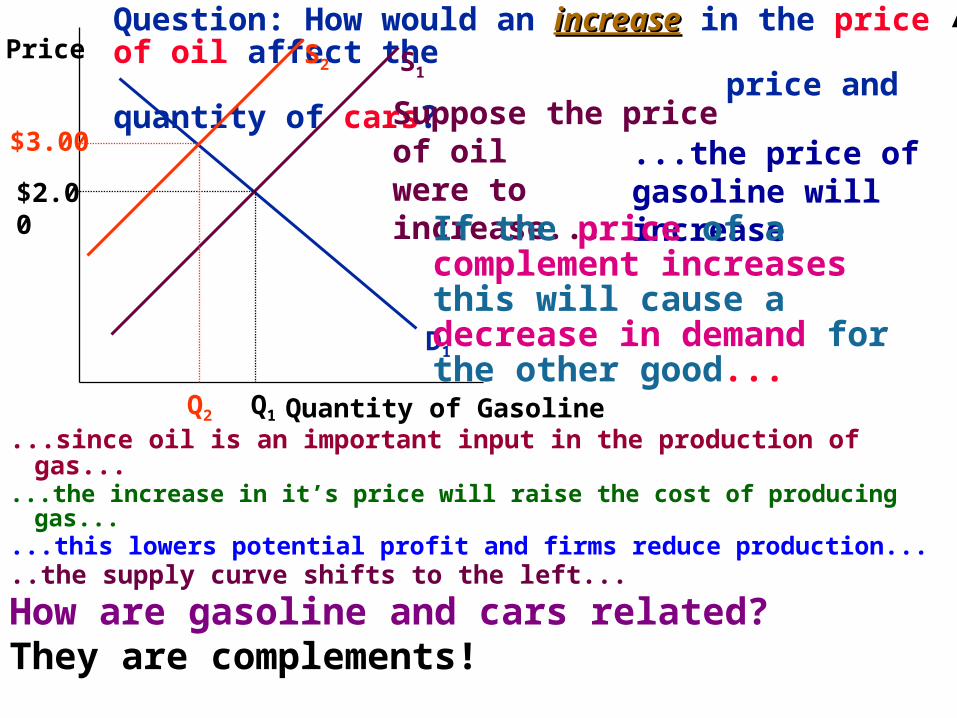
Question: How would an increaseincrease in the price of oil affect the price and quantity of cars?Price
Quantity of Gasoline
D1
S1
$2.00
Q1
Suppose the price of oil were to increase...
7
...since oil is an important input in the production of gas...
...the increase in it’s price will raise the cost of producing gas...
...this lowers potential profit and firms reduce production...
..the supply curve shifts to the left...
...the price of gasoline will increase
How are gasoline and cars related?They are complements!
If the price of a complement increases this will cause a decrease in demand for the other good...
S2
$3.00
Q2
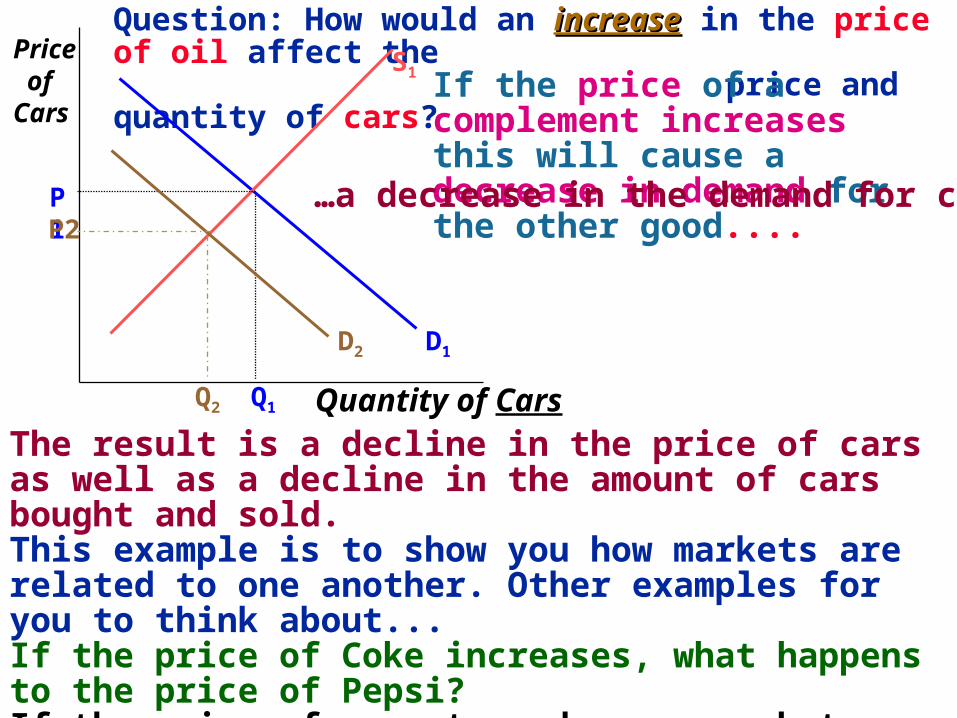
Question: How would an increaseincrease in the price of oil affect the price and quantity of cars?Price
ofCars
Quantity of Cars
D1
S1
P1
Q1
If the price of a complement increases this will cause a decrease in demand for the other good....
…a decrease in the demand for cars!
The result is a decline in the price of cars as well as a decline in the amount of cars bought and sold.This example is to show you how markets are related to one another. Other examples for you to think about...If the price of Coke increases, what happens to the price of Pepsi?If the price of computers decrease, what happens to the price of computer software?
D2
P2
Q2

Summary of Demand and Supply Curves Shifting
• Increase in Demand Increase Increase• Decrease in Demand Decrease Decrease• Increase in Supply Decrease Increase• Decrease in Supply Increase Decrease
Shift Effect on Effect on Eq. Price Eq. Quantity

Example: Both Demand and Supply curves shifting at the same time

Price
Quantity of Cellular phones
D1988
S1988
$800
Q1
Today, many people besides the wealthy have a cellular phone....in other words there has been a large increase in demand the last 20
years
Around 1988, the cellular phone was just beginning to be used....it’s price was veryhigh, and only wealthy individuals used them..
D2008
S2008
According to this graph the price of cellular phones should be over $1,000. Yet good ones today are around $50. Yet we know that demand has increased...How to explain this? There has also been a large increase in Supply as well the last 20 years!
$50
Q2

Price
Quantity of Cellular phones
D1988
S1988
$800
Q1
D2008
S2008
The increase in supply causes prices to decrease
1. Decrease in price of inputs2. Increase in technology3. Increase in number of firms making cellular phones
The increase in supply is greater than the increase in demand.Increase in Demand: Increase Price, Increase QuantityIncrease in Supply: Decrease Price, Increase QuantityWhen added together: We observe the quantity increasesquantity increases, both supply and demand cause quantity to go up(re-enforce one another) Since we know price goes down it must be that the force pushing price down( supply) > force pushing the price up(demand).
Q2
$50

Question: What would happen if everyone expects the price of an item to increase?Price
Quantity of oil (billions of bbls.)
D1
S1
$40
Q1
Suppose most market participants expect continued economic growth in China...
Oil consumers will want to buy more oil today before the expected price increase......
..But those non-OPEC producers of oil would rather sell in the future when it’s price is higher...
...which means selling less today...
...Demand increase, Supply decreases
The price of oil increases today based on future expectations!
D2
S2
$65

What if markets are not allowed to reach
equilibrium?
Government intervention in Market(Price not used as a rationing device)

How does the market ration?• Through the equilibrium prices that are set......Based on willingness and ability to pay.
• Changes in prices re-allocate resources in the economy.• Example: Suppose the demand for computer software
increases…
...This increases the price of software, which leads to more profitability of software firms...
…and encourages more firms to produce more software...
…to do this they need to hire more computer programmers, by increasing wages...
…which will encourage more people to become computer programmers.

Price
Quantity of Concert Tickets
D1
S1
$30
20,000
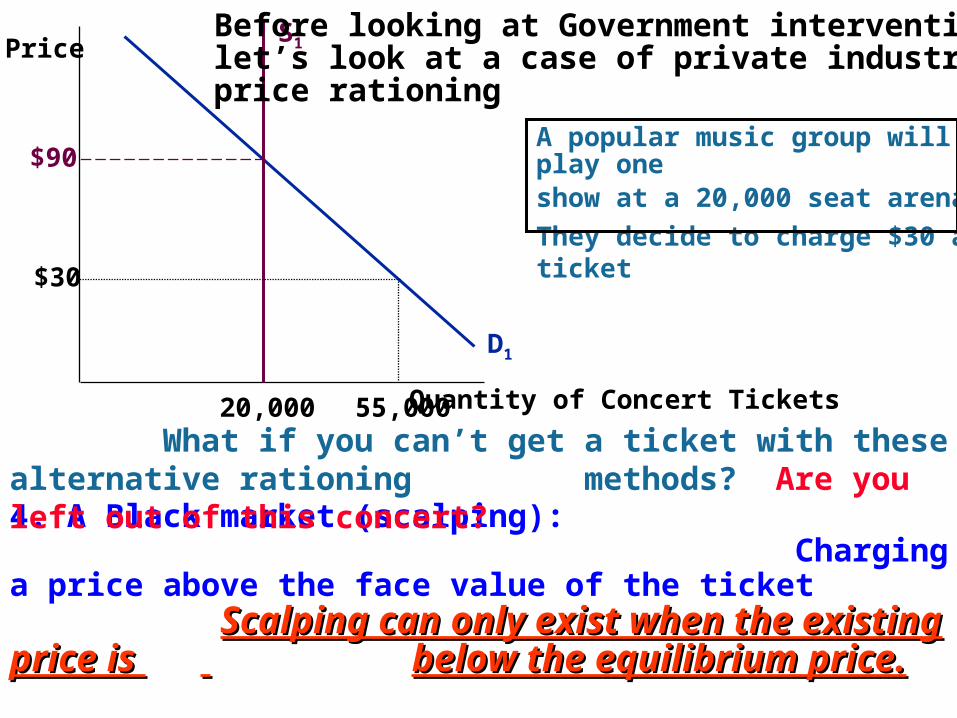
Before looking at Government interventionlet’s look at a case of private industry and price rationing
• A popular music group will play one show at a 20,000 seat arena.....The supply curve of seats is fixed at 20,000• They decide to charge $30 a ticket so their fans can afford it
However at the price of $30 there are 55,000 people who want to see the concert. There is a shortage at the price of $30 a ticket
Price is no longer being used as a rationing device..The alternatives?1. Waiting in line(queuing). Getting there first gets you the tickets2. Hold a lottery to determine who can buy tickets (ration coupons)3. Dealers can hold some tickets to best (favored) customers
55,000
$90
Price
Quantity of Concert Tickets
D1
S1
$30
20,000
Before looking at Government interventionlet’s look at a case of private industry and price rationing
55,000
$90A popular music group will play one show at a 20,000 seat arena
They decide to charge $30 a ticket
4. A Black market (scalping): Charging a price above the face value of the ticket Scalping can only exist when the existing price is Scalping can only exist when the existing price is below the equilibrium price.below the equilibrium price. This only happens at popular events.
What if you can’t get a ticket with these alternative rationing methods? Are you left out of this concert?

How would government intervention achieve the same effects as seen with low price tickets?Price
Quantity of Bread
D1
S1
$2.00
100,000Suppose the equilibrium price of bread were $2.00 per loaf.Enough people complain that this price is too high for low income
people to afford.The government can pass a law that says it is illegal to charge more
than $0.60 for a loaf of bread. What will be the effect?
1. As price decreases, the QD of Bread will increase2. As price decreases, the QS of Bread will decrease
Prices are kept artificially low
This is called a Price ceiling: a maximum legal price that can be charged for a good. Price is no longer used as a rationing device.Must use one (or more) of the 4 alternatives just mentioned.
This was the reason long lines were observed in the Soviet Union for bread, meat, and toilet paper
Price Ceiling
$0.60
60,000 140,000QDQS
Shortage

How would government intervention achieve the same effects as seen with low price tickets?Price
Quantity of Bread
D1
S1
$2.00
100,000
1. As price decreases, the QD of Bread will increase2. As price decreases, the QS of Bread will decrease
This is called a Price ceiling: a maximum legal price that can be charged for a good. Price is no longer used as a rationing device.Must use one (or more) of the 4 alternatives just mentioned.
Price Ceiling
$0.60
60,000 140,000QDQS
Shortage
Who benefits? Consumers who can get the good at $0.60Who is hurt? Firms that product bread, consumers who can’t find bread.When the government intervenes it creates winners and losers with the policy.
Prices are kept artificially lowThis was the reason long lines were observed in the Soviet Union for bread, meat, and toilet paper

Wage
Quantity of hours workers
D1
S1
$5.00
300,000
• The government can say that $6.50/hour will be the minimum price that can be charged…
The Minimum wage: a Price FloorSuppose the equilibrium wagefor non-skilled workers was $5.00/hour
Who benefits? Those who are still employed at the higher wages Who is hurt? Those who are now unemployed, those who can’t find jobs, employers.
$6.50
275,000 375,000
Unemployment
Of course, the equilibrium wage could always go above the minimum wage…...for example if supply goes down or demand goes up...
S2
D2
$7.50
…the minimum wage will become irrelevant
...Price Floor...a minimum price that can be legally charged.
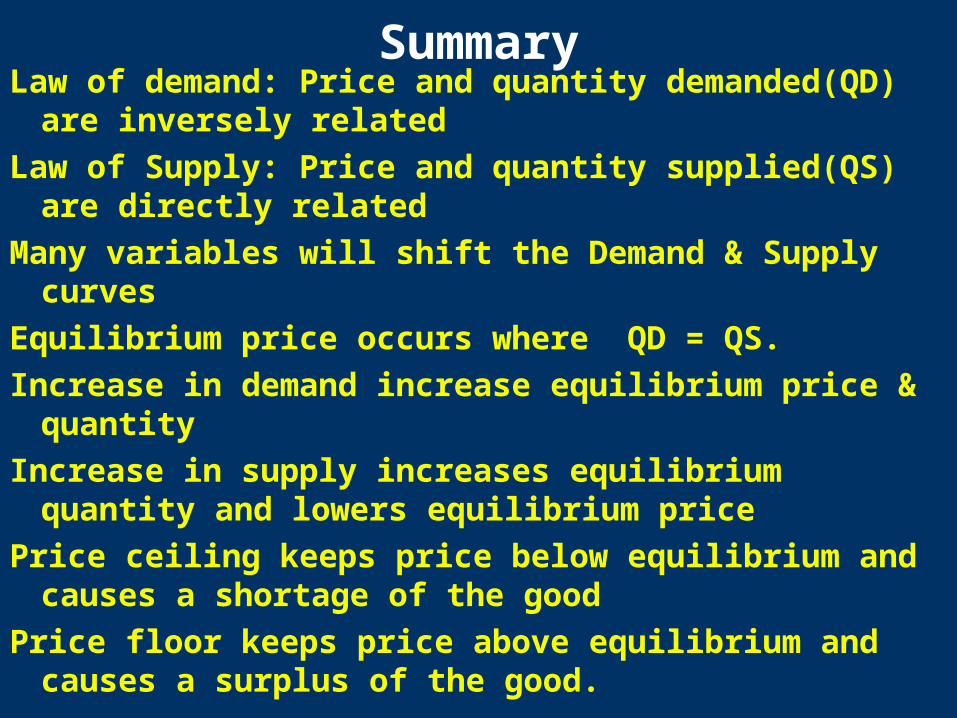
SummaryLaw of demand: Price and quantity demanded(QD) are
inversely related
Law of Supply: Price and quantity supplied(QS) are directly related
Many variables will shift the Demand & Supply curves
Equilibrium price occurs where QD = QS.
Increase in demand increase equilibrium price & quantity
Increase in supply increases equilibrium quantity and lowers equilibrium price
Price ceiling keeps price below equilibrium and causes a shortage of the good
Price floor keeps price above equilibrium and causes a surplus of the good.