marketing study on organic and other selected special ... · marketing study on organic and other...
TRANSCRIPT
1
Marketing study on organic and other selected special quality products from Croatia
Final Publishable Report Produced under the obligations of LoA TCP/CRO/2902 by Polytechnic University of Marche – DIIGA Prof. Raffaele Zanoli, coordinator of the study Dr. Nikolina Jukic, research assistant November, 2005
2
Table of contents
1. INTRODUCTION .....................................................................................................................5 1.1. Background........................................................................................................................5 1.2. Project aims........................................................................................................................6 1.3. Material and methods.........................................................................................................7
Part one ............................................................................................................................................10 2. DESK ANALYSIS AND LITERATURE REVIEW ..............................................................10
2.1. General trends of Croatian agriculture.............................................................................10 2.2. Production........................................................................................................................11
2.2.1. Agricultural production............................................................................................11 2.2.2. Stock farming...........................................................................................................14 2.2.3. The fisheries sector ..................................................................................................14 2.2.4. Self-sufficiency of Croatian agriculture...................................................................15 2.2.5. The food-processing industry ..................................................................................15
2.3. State support.....................................................................................................................17 2.4. Distribution, prices and demand ......................................................................................17 2.5. Foreign trade ....................................................................................................................18 2.6. Organic agriculture in Croatia .........................................................................................20
2.6.1. Introduction..............................................................................................................20 2.6.2. Organic production ..................................................................................................21 2.6.3. Subsidies ..................................................................................................................27 2.6.4. Labels of organic food, certification process and labelling .....................................28
2.7. Protected geographic indication and designation of origin of food products ..................30 2.7.1. Introduction..............................................................................................................30 2.7.2. Legal framework......................................................................................................31 2.7.3. Other labels ..............................................................................................................33
Part two ............................................................................................................................................36 3. RESULTS OF THE FIELDWORK.........................................................................................36
3.1. Introduction......................................................................................................................36 3.2. Sample description...........................................................................................................36 3.3. General information about the purchase of food products...............................................38
3.3.1. Croatian consumers..................................................................................................38 3.3.2. Tourists ....................................................................................................................41
3.4. Comparison of the food purchasing habits of Croatian consumers and tourists..............43 3.5. Level of acquaintance of interviewees with organic farming and some food logos........44
3.5.1. Organic farming .......................................................................................................44 3.5.2. The “Croatian quality” and “Croatian creation” logos ............................................47
3.6. Organic food ....................................................................................................................48 3.6.1. Croatian consumers..................................................................................................48 3.6.2. Tourists ....................................................................................................................55
3.7. Purchasing habits of organic food of Croatian consumers and tourists...........................60 3.8. The “Croatian creation” and “Croatian quality” logos ....................................................61
3.8.1. Croatian consumers..................................................................................................61 3.8.2. Tourists ....................................................................................................................64
3.9. Consumer awareness of Croatian protected geographic indication products ..................68 3.9.1. Sample description...................................................................................................68 3.9.2. Results......................................................................................................................68 3.9.3. Concluding remarks .................................................................................................70

3
3.10. Interviews to distributors and producers......................................................................71 3.10.1. Sample description and results.................................................................................71
4. PROPOSALS FOR A STRATEGY FOR CROATIAN ORGANIC, PDO, PGI AND TSG PRODUCTS.....................................................................................................................................79
4.1. Introduction......................................................................................................................79 4.2. Proposals for a strategy for Croatian organic and PDO, PGI and TSG products ............80
4.2.1. Organic market.........................................................................................................80 4.2.2. Demand for organic food in Croatia ........................................................................80 4.2.3. Supply of organic food in Croatia............................................................................82
Strenghts ..............................................................................................................................82 Weaknesses ..........................................................................................................................83 Opportunities........................................................................................................................84 Risks and threats ..................................................................................................................85
4.2.4. Overall marketing strategies ....................................................................................86 4.2.5. Special quality (PDO, PGI and TSG) products .......................................................87
REFERENCES ................................................................................................................................89 APPENDIX 1...................................................................................................................................93
4
Executive Summary
This document contains the results of a study conducted to collect information to be used in
devising a marketing strategy for Croatian organic and Protected designation of origin (PDO),
Protected geographic indication (PGI) and Traditional specialty guaranteed (TSG) products.
In part one, the main performance indicators of Croatian agriculture are analysed with an
emphasis on organic farming and an overview of legislation governing organic farming and PDO,
PGI and TSG products.
Part two reports the results of the fieldwork carried out by means of direct interviews to
Croatian and foreign consumers, producers, distributors and policymakers to collect data to
achieve a better understanding of the demand for and supply of organic food in the Country.
Finally, the current situation and the strengths, weaknesses, opportunities and threats for the
development of Croatian organic production are described. Some indications for the marketing
strategy for organic and PDO, PGI, and TSG products are also proposed.

5
1. INTRODUCTION
1.1. Background
The current situation of Croatian agriculture must be examined and assessed in the light of
some recent factors that have influenced its performance.
The war and the transition of the economy from State-planned to market-oriented caused a
significant reduction in agricultural production in the early 1990s which, coupled to the sector’s
traditional inability to meet the internal demand in terms of quality, resulted in an increased and
alarming dependence on food imports. In the mid 1990s, the urgent need was thus felt to raise
production and make it more competitive both on national and international markets.
The upgrading of Croatian agriculture began in 1995 with the adoption of the Agriculture
Development Strategy, whereby family farms were proclaimed the pillars of its development.
Croatian WTO membership in 2000, the approach to the EU, and the signing of numerous bilateral
free trade agreements brought new challenges in the form both of opportunities –new markets—
and requirements. Among the latter, the need to meet international food quality and safety
standards led to the adoption of legislation on various aspects of food quality, signally the Food
Act (N.N. 117/03).
Many other laws and regulations, passed over the last few years, have focused on
competitiveness, with an emphasis on quality, sustainability and rural development, the principal
being the Agricultural Act (N.N. 66/01, 83/02), the Farming Land Act (N.N. 66/01, 87/02), the
Organic Production Act (N.N. 12/01), the Agricultural Strategy (N.N 89/02), the law regulating
State subsidies in agriculture, fisheries and forestry (N.N. 87/02), and the Wine Act (96/03).
Given the new objectives of Croatian agriculture, i.e. to increase production of high-quality
produce meeting international standards and competing on foreign markets, organic farming and
labelling of high-quality food products (protection of designation of origin, of geographic
indication and traditional specialty) clearly have strategic importance.
Organic production and protection of designations of origin have recently been regulated.
However, whereas the Organic Production Act, passed in 2001 and completed by numerous
ordinances, is operative, the measures regarding protection of designations of origin and
geographic indications, which are regulated in the Food Act, will become effective only in 2006, a
situation that is giving rise to different growth rates of the respective production sectors.

6
1.2. Project aims
The present study was undertaken to contribute to the development of environment-friendly
agricultural production in Croatia by analysing its market potential and requirements for a number
of crop and livestock products (organic, PDO1, PGI2, TSG3), and to propose recommendations for
product development, marketing, and organization. To do this, the main supply channels and the
regulations governing production and distribution were analysed and the demand for organic and
special-quality products was evaluated with reference both to domestic and international markets.
The study was organized into distinct and complementary phases, making it possible to set
specific goals for each phase.
The first consisted of a literature search and data collection on the main aspects of the
Croatian agri-food sector. Given that organic farming suffers from either the specific and the
general traditional problems of Croatian agriculture, this broader context was investigated by
evaluating agricultural land, employment, farm structure, production, domestic demand and
supply, trade with the main commercial partners and the main import and export goods.
The legislative framework governing organic as well as the PDO, PGI and TSG status of
products, and their processing, distribution and certification process were evaluated; statistical data
were collected and the main indices of organic production calculated.
The scarcity of official data required gaining further information through fieldwork (second
phase), which consisted of direct interviews and telephone or paper-and-pencil interviews. For a
more exhaustive study of the demand for and supply of organic food, a sample of producers,
importers, wholesalers and marketers of organic products were interviewed. Four different
questionnaires were devised to collect information that might allow policymakers to devise a
marketing strategy for Croatian organic and high-quality food products4.
1 Protected designation of origin. 2 Protected geographic indication. 3Traditional specialty guaranteed. 4 The fieldwork was preceded by an analysis of previous studies of organic and special-quality products. Among these, a prominent role had a 2001 study by EKO LIBURNIJA “Analysis of consumer levels of acquaintance with organic food products in the Republic of Croatia”, not only for its contents but also for the size of the sample investigated: 600 interviewees from rural and urban areas throughout the Country. The study provides important data on the habits of Croatian consumers with regard to the purchase of food products: the places where they shop, the importance of logos and quality labels, and their attention to the information reported on products. The study also contains interesting data on their degree of acquaintance with organic products and their ability to distinguish organic from home-grown food, as well as an estimate of current and potential demand for organic food in Croatia. Many of the results of the Eko Liburnija study were confirmed by our work, which was however broader as it included elements such as the habits of Croatian consumers, the characteristics of tourist demand, the level of acquaintance with organic logos, and data on the demand for PDO, PGI and TSG products.
7
1.3. Material and methods
Each phase of the work was characterized by a specific structure and a distinct
methodological approach.
The data collection phase was based on consultation of paper and electronic archives
available at Croatian and Italian university libraries, research centres and institutions (Ministry of
Agriculture, Forestry and Water Management, Croatian Chamber of Commerce). An extensive
Internet search was also performed. Statistical data on conventional and organic farming were
collected from institutional sources (Croatian Bureau of Statistics, Croatian Chamber of
Commerce) and the Ministry of Agriculture, Forestry and Water Management. Data on registered
PGI were provided directly by the State intellectual property office.
The fieldwork consisted of personal interviews with consumers. The characteristics of
domestic demand were estimated by interviewing Croatian consumers; the potential demand for
Croatian organic and labelled products from tourists and foreign markets was estimated by
interviewing tourists. Given both the short time available in which to perform the study and the
limited resources, 200 Croatian consumers and 200 tourists were interviewed based on their place
of residence, occupation and family composition.
The 200 Croatian consumers were selected as follows:
- 25% living in Zagreb, 25% in Split, 25% in Rijeka and 25% in Dubrovnik, with a view to
sampling the main Croatian cities and, at the same time, the areas where tourists would also be
found. This resulted in the study being conducted only in the coastal areas, leaving out the
northern areas of the country.
- 50% of interviewees aged 25 to 46 years and 50% aged 46 to 65 years; younger and older
subjects were excluded because their food-shopping habits are scarcely rep of the pop.
- At least 10% of singles/widowed subjects.
- No more than 5% of unemployed individuals. Considering the high level of unemployment
in Croatia, the risk of a sample with an excessive number of unemployed was very high. Since the
unemployed are not significant consumers of organic products, this criterion was directed at
reducing the number of people offering scarce information.
Two general conditions were that interviewees be consumers buying food for themselves and
their families, and that at least 25% be acquainted with organic farming and at least 25% with the
“Croatian quality” and “Croatian creation” certificates.
The tourist sample needed to meet the same requirements was to be made up of at least 50%
of Italians, at least 25% of consumers from other EU countries and, if possible, 25% of non-EU
8
nationals. Meeting of inclusion criteria required interviewing 214 Croatian consumers and 255
tourists.
The questionnaire for Croatian consumers5 was made up of four sections with 37 questions.
The preliminary section – the screening questionnaire – included 9 questions regarding place of
residence, sex, age, job, family composition and level of education. This section also contained
two questions–G and K– that were used to define the proportion of those acquainted with organic
farming and some Croatian special-quality certificates. Only consumers acquainted with at least
two categories of food products were asked to answer the remaining questions.
Section 1 contained 6 questions aimed at understanding and defining the demand for food
products. The main fears of consumers when purchasing food products, the ways to allay those
fears, and the importance of purchasing high-quality food were also investigated in this section.
Section 2 (15 questions) focused on organic food products. Consumer knowledge and
information about organic farming were the subject of the first four questions. An estimate of the
actual demand for organic food and its consumption was also performed. Other questions asked
for opinions concerning the certification process and the characteristics of organic food products,
and served to identify key problems that will need to be addressed when devising a market
strategy for boosting the Croatian organic market.
The subsection entitled WTP (Willingness to pay) contained 5 questions directed at
identifying the priorities of Croatian consumers with reference to the origin (Croatian or EU),
nature (organic or conventional), and price of products. These questions made it possible to
evaluate the additional price that consumers would be willing to pay for healthier and safer food.
This part also tested their willingness to pay for organic extra-virgin olive oil.
Section 3 (14 questions) addressed the demand for certified food products. The legal
discipline and marketing aspects of PDO, PGI and TCG products in Croatia (see part I, chapter
2.3) led to analyse the demand for quality-label products through an evaluation of food bearing the
“Croatian quality” and “Croatian creation” labels. These are different from PDO products and bear
clear logos; their study was thus considered useful to gain information on the influence of quality
marks on Croatian consumers, the attention they pay to labels and certificates, their trust in them,
and how special-quality indications influence purchases. Questions on the level of knowledge and
information about certified products were followed by questions aiming to estimate the effective
demand for and consumption of certified food products. The opinions of Croatian consumers
concerning certified food products were also recorded.
5 This and the other questionnaires, in English and Croatian, are available from requests from the Authors of this study.

9
The questionnaire for tourists was prepared in Croatian, English and Italian. We felt it was
important to interview tourists from Croatia’s main commercial partners (Italy, Bosnia and
Herzegovina, and Slovenia) to evaluate the potential for the expansion of the demand for organic
and special-quality products on foreign markets. The structure of this questionnaire matched the
structure of the questionnaires for Croatian consumers with the exception of the willingness to pay
for organic products. The section on organic food contained questions to evaluate tourist demand
for organic food products both on the Croatian and their national markets.
Finally, a third questionnaire was used to collect information from the main importers,
distributors, marketers and some producers of organic products in Croatia. The questionnaire for
distributors included 26 questions divided into two parts. The first – the screening questionnaire –
was focused on the characteristics of companies (e.g. producers, wholesalers, retailers) and the
proportion of organic products and food articles they sell. Interviews with foreign importers of
Croatian organic food were also envisaged, but during the study it emerged that there is no export
of certified organic food from Croatia. The second part of the questionnaire asked for opinions on
the characteristics of the organic supply in Croatia. Both Croatian and foreign organic food
products were included and respondents were asked to compare them for different aspects of the
marketing mix. Other questions made it possible to better define the Croatian organic food market.
The interviews with producers and distributors were carried out by direct, phone or mail
interviews.
Data were collected in a database using the SPSS software. Data analysis was carried out
using SPSS and non-parametric tests (χ square test, asymptotic significance level, two-tailed
significance level, Z, Wilcoxon’s W and Mann-Whitney U tests).

10
Part one
2. DESK ANALYSIS AND LITERATURE REVIEW
2.1. General trends of Croatian agriculture
Gross domestic product, employment and agrarian structure
In 2002, the overall GDP share of agriculture, hunting, forestry, fisheries and the food-
processing industry was 9.97% (17,558 million Kunas6), with agriculture, hunting, forestry and
fisheries accounting for 6.87% (12,126 million Kunas) and the food-processing industry for 3.1%
(5,432 million Kunas) (Ministry of Agriculture, Forestry and Water Management, 2003).
The role of agriculture in the economy and its share of GDP have continuously declined in
recent years (Diagram 1), with an upturn being recorded only in 2002.
Diagram 1 – GDP share of agriculture (1998 – 2002)
8,5
9
9,5
10
10,5
11
11,5
12
1998 1999 2000 2001 2002
Years
Shar
e (%
) of a
gric
ultu
re in
GD
P
Source: Our processing of Ministry of Agriculture, Forestry and Water Management data, 2003
According to the 2001 census, the agricultural population in that year accounted for 5.5% of
the population, having undergone a continuous decline from 29.1% in 1971 to 15.2% in 19817.
Total employment in agriculture and the food-processing industry was 11.09%, with
farming, hunting, forestry and fisheries accounting for 7.78% (n=105,671) and the food-
processing industry for 3.31% (n = 45,003). Despite its limited share of the economy, the food,
6 Average annual exchange rate in 2002: 1 HRK / 7.863712 USD, Hrvatska Narodna Banka, Godisnji i mjesecni devizni tecajevi, HNB, 2004. 7 Women employed in the agriculture, hunting and forestry sectors are slightly less than in the other sectors, where they account for some 30%. In farming and fisheries they are respectively 23% and 15%.

11
beverages and tobacco industry has performed very well and had the largest total income and
employment rate in the Croatian processing industry (Croatian Chamber of Commerce, 2004). By
contrast, farming jobs are declining.
The average wages in the agricultural sector have risen in the last few years. While the
average salaries in the tobacco processing industry are much higher than the national average, and
those in the food and beverages industry are in line with it, they are considerably lower in
agriculture, particularly in the fisheries8.
As regards resource ownership, State ownership is still predominant in agriculture, hunting
and forestry and accounts for nearly 50% of resources, whereas private ownership is predominant
in the fisheries (73%), followed by mixed ownership (20%); co-operatives have a negligible role.
With reference to land use, some 80% is farmed by private family farms, and the remaining
20% by legal entities and parts of legal entities or is State-owned land not currently used for
agricultural production9.
2.2. Production
Three climatic and geographic zones can be distinguished in Croatia: the lowland North-East
with a continental climate, the coastal zone with a Mediterranean climate, and the mountain area in
the central part of the country. These differences cause an uneven distribution of agricultural
production.
2.2.1. Agricultural production As shown in table 1.1., almost 50% of the agricultural land is arable land. Pastures and
meadows are also extensive, whereas cultures such as vineyards, olive groves and fruit orchards
have a marginal share if the surface used for different cultivations is considered.
There are wide differences among Counties with reference to agricultural production. The
principal stem from the availability of arable land. The largest share of total agricultural
production is in the northern Counties, while some typical productions, such as Mediterranean
produce, are concentrated in limited coastal areas. These productions account for a small
proportion of total agricultural production. The share of the different cultures in the various 8 The average Croatian monthly salary in 2002 was 3,720 Kunas: 3,231 Kunas in agriculture, 2,635 in the fisheries sector, and 4,748 Kunas in the tobacco processing industry. 9 In some Counties, however, the situation is very different, particularly in Lika-Senj, Split-Dalmatia and Zadar where sometimes more than 50% of surfaces are represented by legal entities and parts of legal entities and State-owned land not currently used for agricultural production.

12
Counties is quite variable. Table 1 reports the arable land farmed in each County as of 31 May
2002.
Table 1 – Agricultural land by type, culture, and County, 2002
Agricultural land -
hectares (ha)
Arable land -
hectares (ha)
Fruit-orchards - hectares
(ha)
Olive groves - hectares
(ha)
Vineyard - hectares
(ha)s
Meadow - hectares
(ha)s
Pastures - hectares
(ha) Republic of Croatia 3,143,189 1,461,739 52,963 15,733 57,698 398,863 1,156,193 County of Zagreb 171,032 100,710 4,004 5,537 47,257 13,524 Krapina-Zagorje 70,502 36,653 2,868 3,699 18,020 9,262 Sisak-Mosavina 228,041 125,696 4,564 1,465 52,634 43,682 Karlovac 198,161 74,835 3,066 1,420 23,774 95,066 Varazdin 70,740 44,837 2,382 3,730 14,708 5,083 Koprivnica-Krizevci 103,952 69,702 2,303 2,741 27,007 2,199 Bjelovar-Bilogora 147,801 101,484 3,944 1,746 36,793 3,834 Primorje-Gorski kotar 142,077 13,391 536 1,716 1,145 30,596 94,693 Lika-Senj 268,126 56,184 1,229 132 110 54,661 155,810 Virovitica_Podravina 120,933 99,863 2,007 1,662 10,236 7,165 Pozega-Slavonia 89,375 60,181 2,457 1,132 13,512 12,093 Slavonski Brod-Posavina 116,511 88,999 2,707 933 11,066 12,806 County of Zadar 226,465 23,492 2,336 2,643 4,038 10,238 183,718 Osjek- Baranja 257,595 231,167 3,221 2,701 5,268 15,238 Sibenik-Knin 179,566 23,521 3,063 1,710 4,452 7,692 139,128 Vukovar-Sirmium 150,528 141,638 1,607 1,291 1,611 4,381 Split-Dalmatia 276,290 42,910 2,861 3,926 6,307 3,084 217,202 Istria 167,289 63,747 975 1,371 6,124 15,964 79,108 Dubrovnik-Neretva 76,972 9,885 2,545 4,235 4,814 611 54,882 Medimurje 53,074 37,009 2,948 1,147 10,038 1,932 City of Zagreb 28,159 15,835 1,340 1,504 4,093 5,387 Source: Croatian Bureau of Statistics, 2003
As regards the main destinations of farmed arable land, 50% is devoted to cereals, followed
by sugar-beet, which alone accounts for some 25%, forage crops, aromatic and fibre plants and
potatoes. Other cultures account for a small proportion of the arable land (Diagram 2).

13
Diagram 2 – Arable land farmed in Croatia, 2002 Fallow and
uncultivated arable land
24,8%
Cereals49,1%
Sugar beets1,7%
Potatoes4,4%
Aromatic and fibre plant0,2%
Nurseries, flowers and plants for
seeds and oiser for basket-weaving
0,1%
Other vegetables4,4%
Leguminous0,6%
Tobacco0,4%
Oilseeds6,1%
Forage crops8,2%
Source: our processing of Croatian Bureau of Statistics data, 2003
The amounts of the main crops produced in 1997 – 2002 are reported in Table 1Table 2.
Table 2 – Main crops (1997 – 2002) Products 1997 1998 1999 2000 2001 2002 Total Cereals^ 3,177 3,207 2,881 2,768 3,394 3,657 Wheat^ 834 1,020 558 1,032 965 988 Maize^ 2,183 1,982 2,135 1,526 2,212 2,502 Sugar-beet^ 931 1,233 1,114 482 965 1,183 Olive trees^ 87 162 221 149 157 218 Potatoes^ 620 665 729 554 670 505 Apples^ 58 72 67 81 32 59 Plums^ 47 83 38 40 39 21 Grapes^ 406 421 394 354 359 337 Olives^ 10 21 35 16 19 33 Tropical fruit^ 22 29 25 25 25 22 Cattle^^ 451 443 438 427 438 417 Swine^^ 1,176 1,166 1,362 1,233 1,234 1,286 Poultry^^ 10,945 9,959 10,871 11,256 11,747 11,665 Milk* 621 633 622 607 653 Eggs** 804 818 819 774 787 (^ ,000 tonnes; ^^ ,000 heads; * million litres; ** millions) Source: Croatian Chamber of Commerce, 2003
These data show that over 1997 – 2002 the production structure changed very little in terms
of the main products: cereals, maize and sugar-beet. Poultry was the most significant animal
production. In the same period, olive tree and olive production increased, whereas the production
of grapes, potatoes and, especially, plums decreased.

14
2.2.2. Stock farming Livestock is one of the principal Croatian agricultural productions. The main segment is
represented by cattle, with some 100,000 family farms according to some estimates10. Swine are
bred exclusively on small farms; it is a very low-quality product that cannot therefore be exported.
The main productions are listed in Table 3.
Table 3 – Livestock and livestock products (1997 – 2000) 1997 1998 1999 2000 2001 2002 Cattle (total)* 451 443 438 427 438 417 Beef** 54,238 53,807 65,693 62,908 56,387 68,402 Swine (total)* 1,175 1,166 1,362 1,233 1,234 1,286 Sheep* 453 427 488 528 539 580 Goats* - - 78 79 93 - Poultry* 10,945 9,959 10,871 11,256 11,747 11,665 Horses* - 16 13 11 10 8 Milk ^ n.a. 377,507 368,845 380,037 409,328 444,349 Eggs^^ 804 818 819 774 787 - (* ,000 heads; ** tonnes; ^ ,000 litres; ^ ^ million pieces) Source: Ministry of Agriculture, Forestry and Water Management, 2003
Sheep and goat breeding, including a number of autochthonous breeds, has a long tradition
and is growing, as also demonstrated by the data reported in table 1.3, through intensive and
extensive techniques.
Poultry production is characterized by technologically advanced processes, prevalently on
large and highly specialized farms, while family farms have a modest role. Data are extremely
positive and the main product is eggs.
Horse rearing, again including several autochthonous breeds, has a marginal and declining
role.
2.2.3. The fisheries sector Fisheries is a growing sector. It has undergone profound modifications over the last decade,
since both the operators and the main target species have changed, from public bodies exploiting
small blue-fish for the processing industry to private operators fishing the more appreciated
demersal species. Total marine fish catches are around 26,000 tonnes a year, with small blue-fish
still accounting for 70%.
10 Average herd size=3 cows. The main product of this sector is milk.
15
Aquaculture, a sector with a great potential in Croatia, is still in its infancy. Production in
2001 was some 12,000 tonnes including marine fish (mainly sea bass, gilthead and tuna),
freshwater fish (carp, trout) and shellfish (mussels and oysters). Trout, tuna, mussels and oysters
are the fastest-growing productions. The fisheries used to be the sole sector that favourably
affected the trade balance of the agricultural sector, since both the amount and the value of imports
were far lower than those of exports.
2.2.4. Self-sufficiency of Croatian agriculture Self-sufficiency has been achieved for few products: wheat, wine, eggs, maize and poultry.
For the other products, the production structure is insufficient to meet the domestic demand,
requiring substantial imports. An analysis of the production structure shows that the supply not
only does not exploit the potential of the national market, but neither does it supply competitive
products for export.
Exploitation of the full production potential of Croatian agriculture would meet the domestic
demand, especially for some products, like olive oil, continental fruit and pork. Increased
production of typical and high-quality products would allow their export.
2.2.5. The food-processing industry Like agricultural production, the food-processing industry is concentrated in limited areas,
mainly those where raw materials are produced (primary production areas) i.e. the northern zones.
Some typical productions of coastal areas have stimulated the development of food-
processing plants there, signally fish-processing plants. However, these have diminished
considerably over the last decades, leaving only 11 plants with an annual output of 15 tonnes.

16
Table 4 – Croatian agriculture: supply as a proportion of demand (%), 1997 – 2002 Product 1997 1998 1999 2000 2001 2002 1998-2002 Wheat 85 96 101 146 140 124 121 Wine 105 103 102 101 101 102 102 Eggs 99 105 103 100 100 100 102 Maize 100 109 101 92 92 100 100 Poultry 101 101 101 99 99 99 100 Olives 100 100 99 96 96 100 98 Potatoes 100 98 100 96 92 100 98 Vegetables 90 91 92 92 92 92 92 Sugar 85 92 92 82 82 96 91 Barley 89 90 89 81 81 79 87 Fruit 85 91 89 82 82 79 86 Pork 79 89 89 83 83 80 85 Milk 76 85 89 83 83 87 85 Sheep meat 69 71 79 79 79 75 77 Oil seeds 51 60 85 79 73 60 73 Source: Ministry of Agriculture, Forestry and Water Management, 2003
Table 5 – Industrial output of selected products (1998 – 2002) Product 1998 1999 2000 2001 2002 Wheat flour^ 298 297 276 299 299 Bread^ 140 125 124 124 129 Pasta^ 7 6 7 7 8 Fruit juice^ 12 11 26 30 28 Canned vegetables^ 23 17 16 17 27 Condiments^ 25 23 17 16 19 Fresh meat^ 91 87 91 100 105 Sausage products^ 34 32 35 40 44 Canned meat^ 16 17 13 12 15 Concentrated soups^ 5 4 5 5 6 Baby food^ 4 4 4 4 4 Butter^ 2 2 2 3 3 Cheese^ 19 18 21 23 22 Sugar^ 139 114 57 131 172 Sweets and cocoa products^ 20 20 20 22 24 Biscuits and related products^ 23 23 22 25 27 Canned fish^ 12 10 11 11 13 Edible oil^ 41 38 35 40 41 Margarine^ 15 16 16 16 18 Fresh yeast^ 11 11 11 12 12 Refined alcohol 100%^^ 7 12 13 9 11 Spirits* 241 208 177 163 151 Beer* 3,759 3,663 3,847 3,799 3,624 Wine* 577 426 472 501 435 Soft drinks* 1,919 1,576 1,471 1,657 1,949 Animal feed^ 522 472 484 524 524 Fermented tobacco^ 9 12 8 11 8 Cigarettes** 11,987 12,785 13,692 14,716 15,047 (^ ,000 tonnes; ^^ million litres ; * ,000 hl; ** million pieces) Source: Croatian Chamber of Commerce, 2003
The main products of the food, beverages and tobacco industry in 1998 – 2002 are shown in
Table 5. In terms of volume, in 2002 the main products of the food-processing industry were

17
feeds, wheat, sugar, bread and fresh meat, while beer was the predominant beverage. From 1998 to
2002, output reductions affected six categories, signally condiments (-24%), wine (-25%) and
spirits (-37%); reductions in bread, canned meat and beer production were less dramatic.
By contrast, the output of several products increased, particularly fresh meat and sausages,
fruit juices and soft drinks, whereas sugar production underwent large fluctuations and a large
overall increment. The production of cigarettes rose continuously and steeply (25%).
2.3. State support
Financial State support in agriculture is regulated by a law (O.G 87/02) that pursues two
main objectives: boosting competitiveness and harmonization with EU legislation. It has
introduced significant changes to the previous system, signally a distinction between commercial
and non-commercial farms. The former are those farms that sell at least three production units.
While non-commercial farms are assisted through direct income subsidies and measures for the
protection of autochthonous breeds, the commercial farms benefit from a wider range of support
mechanisms11.
2.4. Distribution, prices and demand
Unfortunately, no detailed distribution information is available. These data would be very
useful given that the distribution process is one of the crucial problems of Croatian agriculture.
In Croatia, the shift to a market-oriented economy has been accompanied by the
concentration of distribution activities in the hands of a small number of commercial and
processing operators, leading to a near-monopoly12. Wholesale functions poorly, and there are no
produce auctions and cattle markets (Ministry of Agriculture, Forestry and Water Management,
2003).
11 A support policy has been introduced to encourage production of specific crops and livestock and particular production techniques. Since one its main aims is to improve the agricultural production structure and orient it towards products that can compete on foreign markets (olive trees, sugar-beet), agricultural productions receive the greatest support. The system also offers incentives for the development of intensive productions, with an emphasis on multiannual crops. Organic productions are also included. Measures in favour of disadvantaged areas (islands, mountain areas, and areas with unfavourable hydrological and soil characteristics) provide different and higher amounts to support production. Another form of support assists producer access to financing. Finally, a special policy for rural development is aimed at the development of country areas, protection of autochthonous breeds, and marketing of agricultural product preparations. 12 Retail food products account for ca. 37% in non-specialized stores and bulk trade for 28% (2001). Intermediation turnover by product in 2001 shows that demand for food products is stagnating, mostly because of declining life standards and the grey economy (Ministry of Agriculture, Forestry and Water Management, 2003).
18
Data regarding prices are available only since 199513.
Until June 2003, when the Food Act14 was passed (O.G. 117/03)15, food quality and safety
were not regulated. This law covers all aspects of food safety and security and hazard control16.
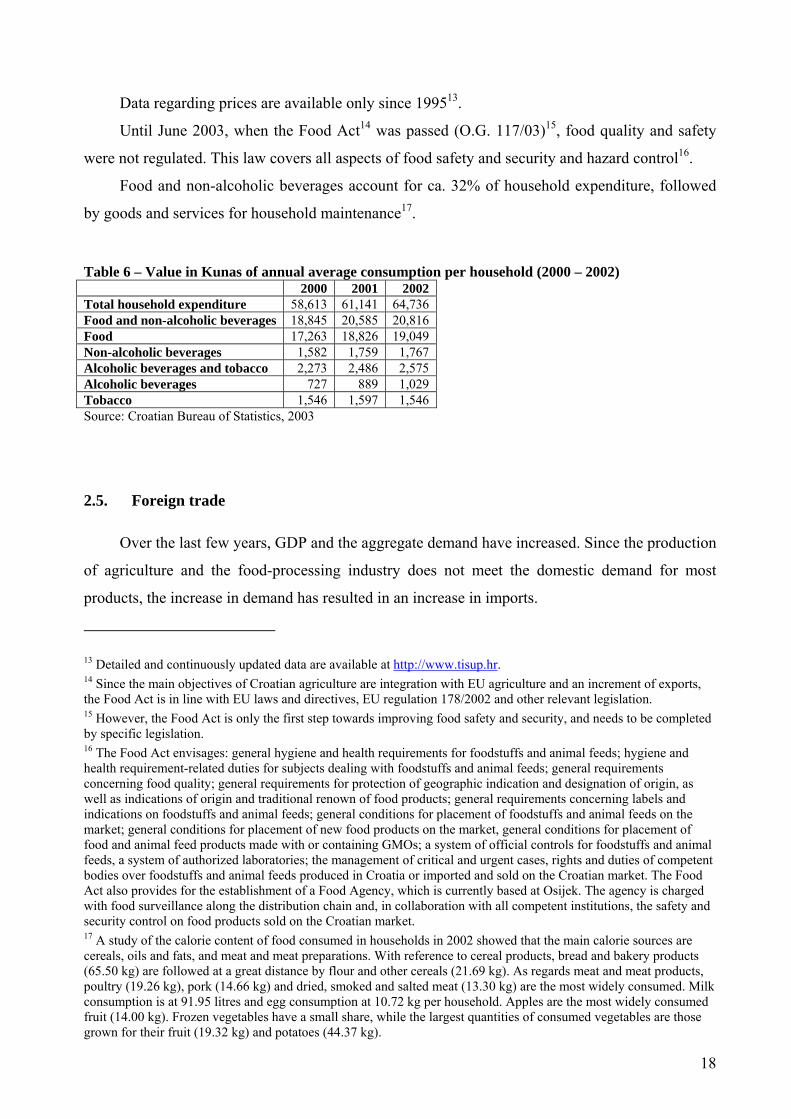
Food and non-alcoholic beverages account for ca. 32% of household expenditure, followed
by goods and services for household maintenance17.
Table 6 – Value in Kunas of annual average consumption per household (2000 – 2002) 2000 2001 2002 Total household expenditure 58,613 61,141 64,736 Food and non-alcoholic beverages 18,845 20,585 20,816 Food 17,263 18,826 19,049 Non-alcoholic beverages 1,582 1,759 1,767 Alcoholic beverages and tobacco 2,273 2,486 2,575 Alcoholic beverages 727 889 1,029 Tobacco 1,546 1,597 1,546 Source: Croatian Bureau of Statistics, 2003
2.5. Foreign trade
Over the last few years, GDP and the aggregate demand have increased. Since the production
of agriculture and the food-processing industry does not meet the domestic demand for most
products, the increase in demand has resulted in an increase in imports.
13 Detailed and continuously updated data are available at http://www.tisup.hr. 14 Since the main objectives of Croatian agriculture are integration with EU agriculture and an increment of exports, the Food Act is in line with EU laws and directives, EU regulation 178/2002 and other relevant legislation. 15 However, the Food Act is only the first step towards improving food safety and security, and needs to be completed by specific legislation. 16 The Food Act envisages: general hygiene and health requirements for foodstuffs and animal feeds; hygiene and health requirement-related duties for subjects dealing with foodstuffs and animal feeds; general requirements concerning food quality; general requirements for protection of geographic indication and designation of origin, as well as indications of origin and traditional renown of food products; general requirements concerning labels and indications on foodstuffs and animal feeds; general conditions for placement of foodstuffs and animal feeds on the market; general conditions for placement of new food products on the market, general conditions for placement of food and animal feed products made with or containing GMOs; a system of official controls for foodstuffs and animal feeds, a system of authorized laboratories; the management of critical and urgent cases, rights and duties of competent bodies over foodstuffs and animal feeds produced in Croatia or imported and sold on the Croatian market. The Food Act also provides for the establishment of a Food Agency, which is currently based at Osijek. The agency is charged with food surveillance along the distribution chain and, in collaboration with all competent institutions, the safety and security control on food products sold on the Croatian market. 17 A study of the calorie content of food consumed in households in 2002 showed that the main calorie sources are cereals, oils and fats, and meat and meat preparations. With reference to cereal products, bread and bakery products (65.50 kg) are followed at a great distance by flour and other cereals (21.69 kg). As regards meat and meat products, poultry (19.26 kg), pork (14.66 kg) and dried, smoked and salted meat (13.30 kg) are the most widely consumed. Milk consumption is at 91.95 litres and egg consumption at 10.72 kg per household. Apples are the most widely consumed fruit (14.00 kg). Frozen vegetables have a small share, while the largest quantities of consumed vegetables are those grown for their fruit (19.32 kg) and potatoes (44.37 kg).

19
At the same time Croatia’s WTO membership since 2000, its approach to the EU and
numerous bilateral free trade agreements have opened new markets for its products as well as its
internal market to foreign producers18. Two different trends can be noted (table 1.7). Imports
fluctuated widely from 1995 to 1999 but overall tended to diminish, whereas exports of
agricultural produce declined continuously. From 1999, imports and exports of agricultural
products both rose, increasing the role of agriculture in the trade balance. Their value and
proportion of total trade are shown in Table 7.
Table 7 – Value in Kunas of annual average consumption per household (2000 – 2002) Years Imports
(000 kunas)
Imports as a proportion of total trade
Export (000
kunas)
Exports as a proportion of total trade
1995 529,426 11.4% 952,408 12.7% 1996 547,280 12.1% 946,048 12.1% 1997 552,200 9.8% 1,020,507 11.3% 1998 536,087 11.8% 864,207 10.3% 1999 431,141 10.0% 706,234 9.1% 2000 422,875 9.5% 710,393 9.0% 2001 486,681 10.4% 870,419 9.5% 2002 579,547 11.8% 1,035,255 9.6% Source: Ministry of Agriculture, Forestry and Water Management, 2003
The main Croatian food exports are shown in Table 8.
Table 8 – Main food exports, 2002 Product Value of exports (m $) Cigarettes 90.1 Sugar (refined) 39.8 Tuna, fresh or chilled 36.8 Vegeta (condiment) 28.5 Wheat 21.1 Biscuits 17.6 Maize 16.9 Chocolate 16.3 Canned sardines and sprat 13.5 Soups 13.0 Source: Ministry of Agriculture, Forestry and Water Management, 2003
The product whose exports have risen most over the last years is sugar, which has become
the main export of the agricultural sector to EU markets since exports were liberalized. Among
imports, cheese imports have risen steeply19 (Table 9).
18 In particular, since January 2001 Croatia has been exporting to the EU several products (with the exception of wine, baby beef products and some fish and canned fish products) free of tariff. Croatia has agreed to apply tax benefits to a number of EU agricultural and food products. Trade liberalization has increased both exports and imports. 19 Large imports of some cheese types hit Croatian producers hard; for EU Gouda cheese the 2002 – 2002 import index reached 1 888.8.

20
Table 9 – Main food imports, 2002 Product Value of imports (m $) Beef cattle 49.2 Soybean 31.4 Frozen pork 30.1 Bananas 21.0 Cheese, hard and semi-hard 19.4 Coffee, not roasted 19.1 Fresh marine fish 18.3 Soybean cake 18.2 Pet food 17.6 Feeds 17.2 Source: Ministry of Agriculture, Forestry and Water Management, 2003
The trade liberalization agreements have changed the main commercial partners of Croatia,
with 80% of foreign trade now being with free-trade areas. The EU and former Yugoslav countries
(in particular of Bosnia and Herzegovina) are the most important partners. Italy and Slovenia are
the main EU markets.
As regards Croatian imports, most are from the EU (45%), mainly Italy, Germany and
Austria, followed at some distance by Hungary, Brazil and Slovenia.
2.6. Organic agriculture in Croatia
2.6.1. Introduction Croatia’s earliest organic farming initiatives date to the early 1980s, when some pioneers of
organic farming – associations like BIOS and individuals like Prof. Jan Čižek – started to promote
and practise this alternative type of farming (Kisic, 2003). Development has been faster in the last
few years, particularly since the introduction of the Organic Production of Agricultural and Food
Products Act (O.G.12/01)20, which is in line with EU organic farming regulations (2092/91) as
well as with IFOAM principles. It defines organic farming as follows:
“Organic (ecological) agriculture is a special system of sustainable management in
agriculture and forestry. It comprises plant growing and animal rearing, production of food, raw
materials and natural fibres, as well as processing of primary products, and includes any
organically, commercially and socially justified technological methods, operations and systems, by
20 The growth of organic farming is one of the main objectives of Croatian agriculture, as reflected in various programmes and strategies: the Croatian National Strategy (1999), the Strategy and Action Plan for the Protection of Biological and Landscape Diversity (2002), the Programme for Sustainable Development of Rural Areas, the 2002 National Agriculture & Fisheries Strategy, the 2004 National and Pilot Agri-Environmental Programme, all aim at the sustainable development of agriculture with organic farming as the main pillar. Particularly ambitious objectives, like 10% of agricultural land (arable and pastures) to be certified as organic within 10 years, have been set by the Rural Development Strategy (2003). (Workshop on National Strategy on Organic Agriculture in Croatia, Draft, October 2004, results, Draft).

21
using in the most convenient ways soil fertility and available water resources, the natural
properties of plants, animals and the landscape, increasing the yield and resistance of plants by
means of natural forces and laws, combined with appropriate use of fertilizers and agents for the
protection of plants and animals, in accordance with internationally adopted standards and
principles”,
This act, which represents an essential condition for the strategic development of organic
farming, created a legal framework and reference point for all Croatian stakeholders in the organic
system. Subsequently, provisions for its concrete application were adopted in 10 ordinances
regulating different aspects of the organic farming chain. These ordinances contain provisions
regarding the adoption of:
- a directive concerning the refund of expenses for inspection services and the assessment of
compliance with the basic rules of organic production (O.G. 101/03, O.G. 85/02)
- regulations for organic production of plants and plant products (O.G. 91/01)
- regulations for a system of evaluation of compliance with the basic rules of organic
production (O.G. 91/01)
- regulations on procedures and conditions to obtain the Eko logo (O.G. 13/02)
- regulations on processing in organic production (O.G. 13/02)
- regulations on organic production of animal products (O.G. 13/02)
- regulations on organic product labels (O.G. 13/02)
- regulations on the conditions and modes of enrolment in organic producer registers (O.G.
13/02)
- regulations on professional inspection services of organic productions (O.G. 13/02)
- regulations on organic fibre processing (O.G. 81/02).
The responsible Ministry is the Ministry of Agriculture, Forestry and Water Management,
sector of sustainable development of country areas.
2.6.2. Organic production Since the State Bureau of Statistics still does not distinguish between conventional and
organic goods in its registers, official data on organic farming are scarce. The only available data
originate from registers of the Ministry of Agriculture, Forestry and Water Management on
producers, importers, inspection bodies and authorized laboratories21.
21 As envisaged by organic production legislation, producers, importers, inspection bodies and authorized laboratories are entered into registers held by the competent Ministry.

22
The organic producers entered in these registers are reported by County in Table 10.
Table 10 – Organic producers by County County No. of producers City of Zagreb 5 County of Zagreb 13 County of Vukovar-Sirmium 9 County of Osijek-Baranja 39 County of Pozega-Slavonia 3 County of Medimurje 6 County of Varazdin 4 County of Koprivnica-Krizevi 5 County of Slavonski Brod-Posavina 3 County of Krapina-Zagorje 2 County of Bjelovar-Bilogora 28 County of Karlovac 3 County of Lika-Senj 1 County of Virovitica-Podravina 6 County of Sisak-Moslavina 2 County of Istria 2 County of Split-Dalmatia 4 County of Zadar 8 County of Sibenik-Knin 9 County of Primorje-Gorski Kotar 1 County of Dubrovnik-Neretva 0 Source: Ministry of Agriculture, Forestry and Water Management, 2004
As of May 2004, 153 organic producers were registered. Considering that they were 130 at
the end of 2003, their numbers have risen by almost 20% in five months. These data also evidence
that the distribution of organic farms is very uneven; the concentration of more than 80% of
producers in the North-East is in line with the general characteristics of Croatian agriculture22.
Furthermore, two Counties –Osijek-Baranja and Bjelovar- Bilogora – account for more than 40%
of producers. They are followed by the County and City of Zagreb, considered as a single
production area, which hosts 12% of producers. By contrast, organic producers are few in coastal
areas, with the sole exception of the Counties of Zadar and Sibenik-Knin. Dubrovnik-Neretva is
the only County where no organic producers are registered (Table 11).
By the end of 2003, about 2,500 ha were under the inspection regime, with 22% (526 ha)
having Eko status and 78% (around 1,000 ha) being converted to organic farming.
22 For a complete list of Croatian organic producers see Appendix 1

23
Table 11 – Land managed with organic methods or undergoing conversion to organic farming by County in ha, 2004 County Register data (ha) Surface (ha) Being converted Eko status City of Zagreb 62.42 62.42 51.24 5.51 County of Zagreb 42.5 42.33 14.75 14.85 Vukovar-Sirmium 32.62 32.62 25.4 7.22 Osijek-Baranja 1,545.39 1,545.39 1,473.29 55.81 Pozega-Slavonia 318.52 318.52 102.91 215.61 Medimurje 5.31 5.31 2.81 2.5 Varazdin 30.99 31.99 27.12 4.87 Koprivnica-Krizevi 13.94 7.44 2.1 Slavonski Brod-Posavina 12.67 15.7 6.37 Krapina-Zagorje 8.26 3.64 Bjelovar-Bilogora 222.19 216.36 11.58 168.5 Karlovac 1.1 1.01 0.8 0.21 Lika-Senj 29.7 29.7 29.7 Virovitica-Podravina 6.97 6.97 2.95 4.03 Sisak-Moslavina 3.48 3.48 Istria 4.3 4.3 4.3 Split-Dalmatia 41.39 41.39 33.21 8.1 Zadar 47.09 45.51 10.51 35 Sibenik-Knin 7.65 10.09 10.09 Primorje-Gorski kotar 0.93 0.93 0.93 Dubrovnik-Neretva 0 0 0 0 Total 3,503.32 2,425 1,809 526 N.B. The surfaces reported in the Register represent agricultural/cultivated land as well as land used for animal production and surface devoted to aquaculture. For this reason, the values reported under “Register data” and those reported under the other columns do not correspond. Source: Ministry of Agriculture, Forestry and Water Management, December 2003
If the land farmed organically and that undergoing conversion are summed, the County of
Osjek–Baranja alone accounts for 63% of the land devoted to organic farming. Pozega–Slavonia is
a distant second (13%), while Bjelovar–Bilogora accounts for only 9%23.
If the land undergoing conversion and the surface certified as organic are summed, the
majority of organic farms are small or very small (Diagram 3). Indeed, almost 70% farm less than
5 ha, and 46% of these less than 1 ha. These farms are followed by those managing 5 to 10 ha, but
in almost 50% of cases the surface is closer to 5 ha than 10 ha. Larger farms are few; those
exceeding 50 or 100 ha are only 3, two of which farm 100 to 300 ha and one almost 1,300 ha.
23 According to the most recent data of the Ministry of Agriculture, Forestry and Water Management, the land with registered Eko status, i.e. certified as farming organically, already covered 1,127 ha by mid 2004.

24
Diagram 3 – Dimensions of organic farms, 2003
69%
15%
6%
6% 2%2%
Under 5 ha
Between 5ha and10haBetween 10ha and20haBetween 20ha and50haBetween 50ha and100haMore than 100 ha
Source: our elaboration data of Ministry of Agriculture, Forestry and Water Management, December 2003
As regards their legal structure, most are family farms (82%), the rest being companies24.
Unfortunately, there are no data on production quantities, as the only available data regard
the surface devoted to different crops and the volume of animal production.
With regard to land destination in 2004, Ministry of Agriculture, Forestry and Water
Management data show that apples account for the largest proportion of the fruit grown
organically. Data are sometimes expressed using two measures (i.e. plants and hectares), so that
the organic apple produce is quantified as 567 trees and 10 ha, plums as 308 trees and 4 ha, and
pears as 165 trees and 1 ha. Vineyards account for ca. 3.5 ha. Strawberry and blackberry cultures
cover together approximately 3 ha.
Of the numerous vegetables productions, which however cover a limited surface, the
principal ones are peppers (ca. 7 ha), clover (56.67 ha), Lucerne (almost 63 ha) and peas (around
12 ha). Potatoes, garlic and carrots account together for about 3 ha. The category of “mixed green
vegetables” covers around 10 ha.
The largest surfaces are devoted to wheat (more than 550 ha), soybean (398 ha), maize
(almost 200 ha), sugar-beet (121 ha), barley and oats (more than 50 ha each), if both organic and
in-conversion land is included.
Herbs are also grown extensively (more than 40 ha), especially chamomile.
With reference to animal production (Table 12), fattened chickens are by far the largest item
(with a high concentration in the County of Zagreb), followed by fattened young bulls (almost
exclusively in Osijek-Baranja). Production of sheep, chickens, goats and young goats, as well as of
pigs, is far lower.
24 It is interesting to note that not only large producers, but also some small and very small farms are companies.

25
Farms producing organic fish (101 tonnes in 2003), mussels (5000 pieces) and honeybees
(50 hives) are also registered.
Table 12 – Organic livestock farming, 2003 Animals Number Cows 66 Calves, 3 months 15 Young bulls 1 year 13 Young bulls 1-2 years 9 Young bulls 2-3 years 14 Fattened young bulls 1,506 Bulls 1 Horses 46 Foals 6 Ponies 4 Breeding cows 47 Pigs 478 Breeding sows 17 Goats 455 Young goats 205 Sheep 726 Lambs 95 Chickens 290 Layers 129 Fattened chickens 5674 Ducks 72 Turkeys 32 Geese 10 Rabbits 62 Source: Ministry of Agriculture, Forestry and Water Management, December 2003
72% of producers are surveyed and inspected by BIOPA, 26% by PEZ (Prva Ekoloska
Zadruga) and 2% by Hrvatske Sume. Croatian Eko logo producers and products as of December
2003 are reported in Table 13. The Eko logo was awarded to 28 producers (or 21% of all
producers registered in 2003) and 33 products. The majority of products bearing the logo are
vegetables and derived products, followed by wheat, soybean, chickens, cereals and cereals-
derived products. In October 2004, the time of the latest update, producers awarded the Eko logo
had risen to 43 (Workshop on National Strategy on Organic Agriculture in Croatia, Draft version,
October 2004, results, Draft version).

26
Table 13 – Producers and products certified with the Croatian Eko logo, 2003 Producers Products IVKA SEVER Cereals, vegetables, chickens, eggs “BUTIĆ”, production, trade and services, d,o,o, Chickens “EKO IMANJE MAVROVIĆ” d,o,o, Cereals-derived products POLJOPRIVREDNO-TURISTIČKOG OBRTA, "BIOPHARM" of Željko Krpan
Products derived from cereals and medical herbs
BRANKO ČEGEC Wine MARICA MARJANOVIĆ Soybean GREKČEVIĆ IMBRO Chickens JOSIP BREZICKI Chickens MARICA JUG Apples HELENA GREBENC Lambs "ŠMIT"uzgoj koza - NIKOLA LONČAR Young goats BAČMAGA FRANJO Soybean MILAN PASTUOVIĆ Honey «ADNOVAS OBRT» Wheat, maize MATE KLARIĆ Vegetables NIKOLA RAPO Vegetables KRPINA IVAN Vegetables TEREZIJA BAŠIĆ Vegetables MIRKO TRBONJAČA Vegetables TOMISLAV PORTADA Vegetables MIRKO GNJIDIĆ Vegetables VASILJ BOJANIĆ Vegetables MILENKO ŠAPONJA Vegetables SLAVENKO MATIĆ Vegetables STJEPAN GUMBAS Wheat, soybean STANKO GRADIŠČANAC Wheat ZLATA NANIĆ Vegetables, Vegetables-derived products RATKO SUMAN Maize, Apples “REPRO STUDIO” Cereals-derived products Source: Ministry of Agriculture, Forestry and Water Management, December 2003
There are no official figures on prices, distribution channels and exports of Croatian organic
produce. The sole official data are those from the Importers Register, held by the Ministry,
according to which there are nine registered importers.
There are no figures for exports of Croatian organic food. However, according to Ministry
sources, large amounts of uncertified organic produce are exported and certified on foreign
markets (Workshop on National Strategy on Organic Agriculture in Croatia, results, Draft version,
October 2004).

27
Table 14 – Organic product importers, 2003
Name Address Date of registration
Extension body
“CANDOR” d.o.o. A. Šenoe 89, 31550 Valpovo 24/10/2003 BIOPA
“SJEMENARNA” d.o.o.- Zagreba Trg kralja Tomislava 19, 10000 Zagreb 3/6/2003 BIOPA
“ENCIAN” d.o.o. Gospodarska bb, Donji Stupnik 3/6/2003 BIOPA
VIVERA d.o.o. Ulica kralja Zvonimira bb, 44400 Glina 24/10/2003 PEZ
dm-drogerie market d.o.o. Baštijanova 52/a, 10000 Zagreb 24/10/2003 PEZ KRESTO d.o.o. Nikole Tesle 6, 40000 Čakovec 24/10/2003 BIOPA ADVENT d.o.o. Šijanska cesta 5, 52100 Pula 24/10/2003 PEZ
BIO-PARTNER d.o.o. Ulica Frana Galovića 26/c, 48000 Koprivnica 24/10/2003 BIOPA
FRIVA AB-GALEB trgovina i usluge d.o.o. Kaptol 7, 10000 Zagreb 24/10/2003 PEZ Source: Ministry of Agriculture, Forestry and Water Management, Importer Register, December 2003
2.6.3. Subsidies The first law envisaging subsidies for organic agriculture is O.G. 87/02, which regulates
separately four categories: i) cultures; ii) seeding material, multiannual cultures (vines, fruit-
gardens, olive trees, lavender) hop and olive oil; iii) livestock and animal products; iv) fisheries.
The beneficiaries of financial subsidies are farms entered in the Organic Producer Register
with certification of compliance with the organic production rules by the appropriate bodies.
Subsidies for farming, animal breeding and aquaculture are paid yearly and are different according
to product and production categories. For farm crops they are 3,000 Kunas/ha.
With reference to organic stock breeding and milk production, the incentives are 30% higher
than for conventional products. Some productions receive subsidies only if they are organic.
The following table reports the amount of subsidies for the different productions.

28
Table 2.6. –Value of subsidies for organic farming, 2003 Product Unit Amount
(Kunas25/unit) Agricultural cultures ha 3,000 Seeding material, multiannual cultures, Olive oil ha 3,000 Olive trees Tree 20.8 Olive oil Litre 5.2 Pasture grounds and meadows ha/head 130 Cow milk Litre 0.85 (1.35*) Milk (sheep, goats) Litre 1.30 (1.75*) Fattened young bulls Head 1,040 (1,400*) Fattened pigs Head 130 Fattened lambs and young goats Head 30 Fattened poultry Head 20 Milk cows Head 1,040 (1,400*) Cow herds Head 2,630 Sheep, rams, goats and he-goats Head 260 Poultry Head 20 Swine Head 390 Horses Head 1.750 Honeybees Beehive 115 Autochthonous demersal species kg 7.0 Mussels kg 1.04 Oysters Piece 0.65 Fish juveniles Piece 0.33 Freshwater fish – group I kg 4.55 Freshwater fish – group II kg 6.25 Source: Ministry of Agriculture, Forestry and Water Management, 2004 Reform * Disadvantaged areas
The aim of subsidies is to support the development and expansion of organic agriculture and
to improve the structure of the organic supply. Despite this substantial State intervention, no
specific measures have been introduced to address the special needs of organic as opposed to
conventional production. The policy provisions are the same for both sectors, with the sole
difference that the amounts are greater for organic farming.
2.6.4. Labels of organic food, certification process and labelling Organic products must bear a label to allow consumers to distinguish them from
conventional products. These statements must provide detailed information on product, producer /
importer, date of production, place of origin, ingredients, net weight, name of the certification
body, certificate number and the indication “organic (eco) product” or “produced on land being
converted to organic production”.
25 The average annual exchange rate in 2002 was 1 Kuna to 7.863712 $, Hrvatska Narodna Banka, Godisnji i mjseceni devizni tecajevi, HNB, 2004.
29
Products from areas being converted to organic production (a period of 1 to 3 years that may
exceptionally last 5) may be called “organic” only if at least 70% of the final product is organic, or
the product is accompanied by a guarantee that it is produced on land being converted.
The certification process to obtain the Eko logo is quite complex (Krstulovic, S, Dalmacija,
2004). After collecting information on the rules governing organic farming (Organic farming Act
and related ordinances), producers contact a certification body – Agribiocert, Zavod za ispitivanje
kvalitete robe, Biotechnicon, Hrvatske sume, Biopa, Prva ekoloska zadruga – authorized by the
Ministry of Agriculture, Forestry and Water Management) for the surveillance and inspection of
organic practices. The next step is an application to be entered into the Register of organic
producers of agricultural and food products. The application must be accompanied by the
following documents:
- a statement by the inspection body that the first inspection has been carried out,
- the producer’s registration as a juridical subject, or a certificate by the competent authority
to the effect that the producer is a registered agricultural producer,
- an extract from the land book and/or the rent contract showing that the lease is guaranteed
for at least 5 years, as well as an ownership certificate or attestation of the right of land use,
- the cadastral plan reporting the parcels assigned to the production unit and their surface,
- a list and indication of dimension of the structures, mechanization and other production
tools,
- a declaration by the legal person or the producer that they are aware of organic farming
rules,
- if the farm is administered by a director of production, a document stating the exact nature
of this business relationship,
- a government stamp (70.00 Kunas).
The producer must keep a book describing the production process and reporting all relevant
operations, to enable the auditors to check the origin, nature and quantities of all inputs, because
all phases of production are subject to control. The result of the inspections must be communicated
to the Ministry and the legal persons responsible for the certification process (AgriBioCert or
Biopa).
The final certificate, issued by one of the two bodies authorized for the certification process,
states the producer’s compliance with organic practices (inspected and guaranteed).
This document reports:
- the name of the legal person who granted it, number of declaration and its protected logo,
- the certificate number,

30
- the name of the farm and its registration number in the organic producer register,
- the name of the producer and the quantities for which the certificate has been granted,
- the regulation under which the certificate has been granted,
- the time period for which the certificate has been granted,
- the place and date of the award of certification with the signature of the responsible person.
The certificate guaranteeing compliance with organic farming rules is awarded based on the
inspection reports and the documentation of the authorized laboratory (Croatiakontrola).
The final step is a written application for the granting of the Eko logo to the Ministry26
reporting:
- the producer’s name and address,
- the registration number in the organic producer register,
- the name of the product for which the logo is being requested,
- the certification granted by the authorized body,
- the amount of production and/or number of products to be sold on the market,
- the number and dimension of packs.
A Ministry-appointed working group is charged with evaluating the applications and, if all
requirements are met, it awards the Eko logo (Figure 1) for 12 months and communicates the
conditions for its use.
Figure 1 – The Croatian Eko logo
2.7. Protected geographic indication and designation of origin of food products
2.7.1. Introduction The protection of designation of origin, geographic indication and traditional specialty of
food articles is one of the main tools that should permit Croatian food products to achieve greater
26 One of the main problems is that the Ministry is directly involved in the control and certification process, including the final authorization to use the official organic logo.
31
visibility and competitiveness both on domestic and international markets and to add value to
special-quality food products while at the same time permitting the diversification of production.
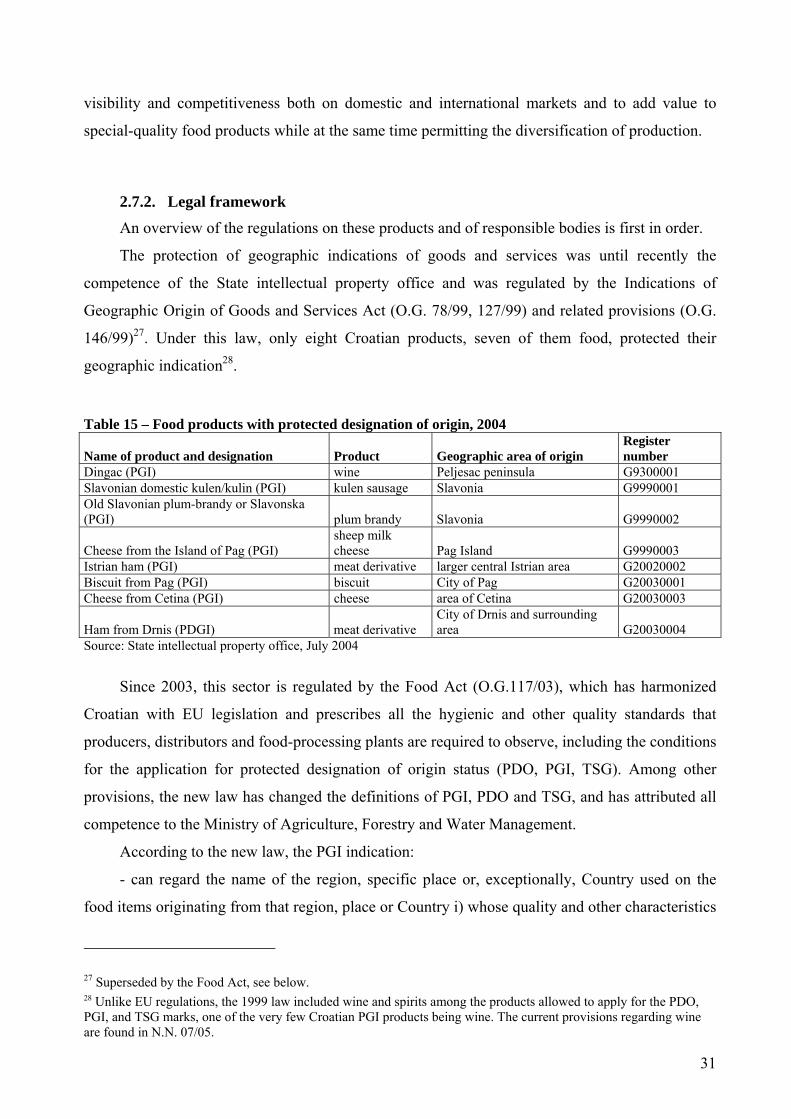
2.7.2. Legal framework An overview of the regulations on these products and of responsible bodies is first in order.
The protection of geographic indications of goods and services was until recently the
competence of the State intellectual property office and was regulated by the Indications of
Geographic Origin of Goods and Services Act (O.G. 78/99, 127/99) and related provisions (O.G.
146/99)27. Under this law, only eight Croatian products, seven of them food, protected their
geographic indication28.
Table 15 – Food products with protected designation of origin, 2004
Name of product and designation Product Geographic area of origin Register number
Dingac (PGI) wine Peljesac peninsula G9300001 Slavonian domestic kulen/kulin (PGI) kulen sausage Slavonia G9990001 Old Slavonian plum-brandy or Slavonska (PGI) plum brandy Slavonia G9990002
Cheese from the Island of Pag (PGI) sheep milk cheese Pag Island G9990003
Istrian ham (PGI) meat derivative larger central Istrian area G20020002 Biscuit from Pag (PGI) biscuit City of Pag G20030001 Cheese from Cetina (PGI) cheese area of Cetina G20030003
Ham from Drnis (PDGI) meat derivative City of Drnis and surrounding area G20030004
Source: State intellectual property office, July 2004
Since 2003, this sector is regulated by the Food Act (O.G.117/03), which has harmonized
Croatian with EU legislation and prescribes all the hygienic and other quality standards that
producers, distributors and food-processing plants are required to observe, including the conditions
for the application for protected designation of origin status (PDO, PGI, TSG). Among other
provisions, the new law has changed the definitions of PGI, PDO and TSG, and has attributed all
competence to the Ministry of Agriculture, Forestry and Water Management.
According to the new law, the PGI indication:
- can regard the name of the region, specific place or, exceptionally, Country used on the
food items originating from that region, place or Country i) whose quality and other characteristics
27 Superseded by the Food Act, see below. 28 Unlike EU regulations, the 1999 law included wine and spirits among the products allowed to apply for the PDO, PGI, and TSG marks, one of the very few Croatian PGI products being wine. The current provisions regarding wine are found in N.N. 07/05.

32
are largely or entirely due to particular natural and human conditions of that specific geographic
area, and ii) whose production, processing and preparation are wholly accomplished in that area;
- geographic indications that have a demonstrated traditional characteristic, exceptional
renown and are well known may be protected with the PGI even though the raw materials
originate from an area that is broader or different from the area where processing takes place,
provided that the area of production is circumscribed and specific conditions for the production of
raw materials in that area obtain. Such raw materials are only livestock, meat and milk.
The food products that can bear the PGI indication, the geographic areas mentioned, and the
inspection methods are to be determined by the competent Ministry.
The PDO indication concerns:
the name of the region, specific place or, in exceptional cases, Country that is used on food i)
originating from that region, place or Country, ii) whose specific quality characteristics, repute or
other peculiarities are ascribed to its geographic origin, and iii) whose production and/or
processing, and/or preparation take place in that specific geographic area.
The food products that can bear the PDO indication, the geographic areas, and the
appropriate inspection methods are to be determined by the competent Ministry.
The TSG indication used on food products originating from particular regions or places can
be registered as PGI if the product characteristics meet all the required conditions. Applications
may be submitted by groups (i.e. any association) of producers and/or processors. Applicants may
be single producers and/or processors provided that:
- at the time of application they produce and/or process only that specific product,
- they use the original, unmodified local methods/practices,
- the geographic area has important characteristics that distinguish it from other areas and/or
the characteristics of the product are substantially different.
Applicants must be registered in the Ministry’s PGI and/or PDO books. The right to use the
three indications follows enrolment in these books.
Even though the Food Act clearly defines the food product designations and assigns the
competence for their attribution to the Ministry of Agriculture, Forestry and Water Management,
the detailed regulations envisaged by the law, to be issued in the three years from its introduction,
have not yet been adopted, and have prevented the implementation of the whole system.
The transition of competences should have been managed by an interinstitution agreement
authorizing the intellectual property office to accept new enrolments and guarantee the protection
of the interests of those already registered until the completion of the system.

33
In the meantime, the new Indications of Geographic Origin of Goods and Services Act (O.G.
173/03) and relevant regulations (O.G. 72/04) have been adopted. This discipline no longer
regulates those products and services whose protection of geographic indication and designation of
origin are regulated by specific laws, as is the case of the food products regulated by the Food Act.
It also provides that the State intellectual property office continue to be responsible only for the
applications that were filed before the new law and have not yet been processed. The books with
the names of products with protected designation of origin or geographic indication are to pass to
the competent bodies, which for food products is the Ministry of Agriculture, Forestry and Water
Management where, at present, no services are qualified for the protection of geographic
indications and designation of origin.
2.7.3. Other labels Since 1997, the Croatian Chamber of Commerce also supports the promotion and labelling
of high-quality Croatian products with the objective to help consumers to identify them more
easily and distinguish them from the rest of Croatian and international products.
The rules governing the award of these labels differ greatly from those regulating the PDO,
PGI and TSG status, and are in line neither with the Croatian nor the EU legislation. The marks
are “Croatian Quality” (Hrvatska kvaliteta) and “Croatian Creation” (Izvorno hrvatsko), which
concern the origin or characteristics of products and make reference to the entire Country rather
than specific regions or areas.
The “Croatian quality” label is granted to products whose characteristics (e.g. contents,
design, ergonomic criteria, and ecological criteria) meet high international standards. These
products must comply with all food safety, security, environmental protection and protection of
consumer’s rights regulations. The products bearing this label present overall characteristics that
can satisfy all expressed or supposed needs of users or other needs that result from specific rules
and specifications guaranteeing their above-average quality.
The “Croatian creation” label is awarded to authentic Croatian products whose quality is
higher than the average quality of similar products. Their quality has to be at least as high as that

34
of “Croatian quality” products, but they are also required to possess unique characteristics that
result from Croatian tradition, research work and Croatian invention and/or innovation29.
Table 16 - Products bearing the “Croatian quality” label Product name Category Producers Jamnica mineral natural water Water Jamnica d.d., Zagreb AB kultura Milk-derivatives Lura d.d,. Zagreb
Cedevita Vitamin supplements Cedevita d.o.o. Zagreb
Jubilarna kava Coffee Franck d.d. Zagreb Cipi Cips - line of products Savoury biscuits Franck d.d. Zagreb Espresso kava Coffee Franck d.d. Zagreb Meso kunica Hare meat Kunis d.d., Bosnjaci Sjeme secerne repe Sugar -beet seed Institut za secernu repu d.d., Osjek Rally bezalkoholno pivo Alcohol-free beer Karlovacka pivovara d.d. Karlovac Karlovacko svijetlo pivo Light beer Karlovacka pivovara d.d. Karlovac Griotte dessert Sweets Kras d.d. Zagreb Sardi riblje konzerve Canned fish Sardina d.d. Postira
Sjeme hibridnog kukuruza Hybrid maize seed Bc Institut za oplemenjivanje i proizvodnju bilja d.d. Zagreb
Dimsi Cheese Lura d.d. Zagreb Ribani parmezan Cheese Lura d.d. Zagreb Podravec Cheese Lura d.d. Zagreb Barun - gorki biljni liker Spirit Zvecevo d.d. Pozega Clementina desert Sweets Zvecevo d.d. Pozega Mikado - milk chocolate with rice Sweets Zvecevo d.d. Pozega Rajnski rizling Spirit Kutjevacki podrum d.d. Kutjevo Grasevina Wine Kutjevacki podrum d.d. Kutjevo Traminac Wine Ilocki podrumi d.d. Ilok Margo (vita nova,classic fit, margo s jogurtom) Milk derivatives Zvijezda d.d. Zagreb Zvijezda stolni margarin Margarine Zvijezda d.d. Zagreb
Ogulinski kiseli kupus Vegetable (sauerkraut) Medig d.d. Ogulin
Zvijezda majoneza od svjezih jaja Mayonnaise Zvijezda d.d. Zagreb Dalmatinska panceta Sausage (bacon) Mesna industrija Braca Pivac d.o.o. Vrgorac Stisnjenja sunka u ovitku Sausage (ham) Sljeme d,d,, Sesvete Krumpir (potatoe) Vegetable Lipovac d.d. Lipovac Luk (garlic) Vegetable Lipovac d.d. Lipovac Mrkva (carot) Vegetable Lipovac d.d. Lipovac Mesni dorucak Canned meat Gavrilovic d.o.o. Petrinja Jetrena pasteta Canned meat Gavrilovic d.o.o. Petrinja Piknik keksi Biscuits Koestlin d.d. Bjelovar Paris-punjeno cajno pecivo Biscuits Koestlin d.d. Bjelovar Cajna pasteta-trajna konzerva Canned meat Sljeme d.d. Sesvete Cajna pasteta u ovitku Canned meat Sljeme d.d. Sesvete Dalmatinska budola "Matas" Sausage (loin) Matas – M.N. d.o.o. Jasenice - Obrovac Delikates sunka bez kosti sausage (ham) Mesnice Fiolic d.o.o. Zagreb
29 The “Croatian quality” and “Croatian creation” marks are registered in the book of the State intellectual property office as collective marks. The labelling process consists of: i) an advisory commission; ii) a Centre for quality improvement; iii) Technical committees for individual groups of products or single products. The applications and documentation are submitted to the Centre for quality improvement for examination of the documents and are passed to the technical commission, which analyses the products characteristics. The right to use the marks is granted for 3 years through a contract between the Chamber of Commerce and producers.

35
Unlike PGI products, “Croatian quality” and “Croatian creation” products bear clear logos
which, together with consistent promotion campaigns by the Chamber of Commerce, guarantee
great visibility to the products bearing them.
This initiative has had a considerable impact on the agri-food industry, since 56% of
“Croatian quality” and 47% of “Croatian creation” marks have been issued for food products.
Table 17 - Food products bearing the “Croatian creation” label Product/s Category Producers Bajadera Chocolate Kras d.d. Zagreb Vegeta Condiments Podravka d.d. Koprivnica Stara sljivovica Spirits Badel 1862 d.d. Zagreb Mlijecni namaz Milk derivative Lura d.d. Zagreb Paprenjak-tradicionalni hrvatski kolac Sweets Paprenjak d.o.o. Zagreb Amarena-vocni sirup Soft drinks Marasak d.d. Zadar Vinjak "Trenk" Spirits Zvecevo d.d. Pozega Izvorni posedarski dalmatinski prsut Sausages (ham) Prsutana d.o.o. Posedarje Paski sir Cheese Sirena-Mala sirana d.o.o. Kolan. Pag Dalmatinski sokol Sausages Prsutana d.o.o. Posedarje Rolana mesnata slanina Sausages Sljeme d.d. Sesvete Pekmez od sljiva-zasladeni Jam Podravka d.d. Koprivnica Gavriloviceva salama Salami Gavrilovic d.o.o. Petrinja Gavrilovicev kulen Sausages (kulen) Gavrilovic d.o.o. Petrinja Domaci prsut - dalmatiko Sausages (domestic ham) Prsut Vostane d.o.o. Trilj Dalmatinski prsut "Matas" (Dalmatian ham) Sausages (dalmatian ham) Matas - M. n. d.o.o. jasenice - ObrovacSvjeze svinjsko meso Fresh pork meat Mesnice Fiolic d.o.o. Zagreb

36
Part two
3. RESULTS OF THE FIELDWORK
3.1. Introduction
The general aim of this study was to evaluate the market situation of Croatian organic and
special-quality food products with a view to devising marketing approaches and strategies to
improve their performance. Given the scarcity of official data, the field study assumed
considerable importance. This had three objectives: to better characterize the demand for Croatian
organic and special-quality food products by Croatian consumers and tourists; to establish the
degree of knowledge of Croatian PDO- and PGI-label products by Croatian consumers; and to
characterize the supply and demand for organic and special-quality products by obtaining
information from producers, distributors and retailers.
3.2. Sample description
As mentioned above, the samples of 200 Croatian consumers and 200 tourists were defined
using criteria that included place of residence, job and family composition. To achieve this
number, 214 interviews with Croatian consumers and 255 interviews with tourist were carried out.
Table 18 – Sample composition: Croatian consumers Gender 36% male, 64% female Age 50% from 25 to 45 years; 50% from 46 to 65 years Place of residence 25% Split, 25% Zagreb, 25% Rijeka, 25% Dubrovnik
Job of interviewee 29% self-employed professionals, 40% office workers/teachers, 3% traders/retailers, 5% unemployed, 6% housewives, 4% students, 13% other
Job of the head of the family
40% self-employed professionals, 40% office workers/teachers, 5% traders/retailers, 15% other
Family composition 30% unmarried; 24% with children < 10 yrs; 34% with children > 10 yrs; 26% other adult family members
Level of education 2% primary school/no education, 54% secondary school, 42% university degree, 1% Master/Ph.D
Since only consumers responsible for their family purchases were interviewed, the Croatian
sample (Table 18) was mostly made up of women. The age composition criteria were strictly
enforced (50% of the sample was aged 25 to 45 years and 50% was aged 46 to 65 years). The
same proportion of interviewees (25%) lived in Zagreb, Split, Rijeka and Dubrovnik.

37
The majority of interviewees were office workers/teachers (40%), followed by self-
employed professionals (29%); there was a reasonable proportion of most representative
categories, such as traders, housewives, students, and unemployed people; “other” interviewees
were mostly pensioners. There were equal proportions of office workers and professionals among
family heads: 5% were traders or retailers, and 15% were “other”, i.e. mainly retired and
unemployed individuals.
As regards family composition (table 4.1), unmarried interviewees (single, divorced or
widowed) accounted for 30%; more than 50% had children less than 10 years old (24%) or older
(34%). A fairly large number of families included other adult members besides the parents.
The level of education of the sample was not very representative, since many interviewees
(up to 42%) had university degrees and few had primary school or no education (2%).
The composition of the tourists sample is shown in Table 19.
Table 19 – Sample composition: tourists Gender 46% male; 53% female Age 58% from 25 to 45 years; 42% from 46 to 65 years Nationality 53% Italian, 15% Other EU, 32% Non-EU
Job of interviewee 36% self-employed professionals, 25% office workers/teachers, 16% artisans/retailers, 10% housewives, 7% students, 6%other
Job of the head of the family 39% self-employed professionals, 33% office workers/teachers, 21% artisans/retailers, 7% other
Family composition 28% unmarried, 22% < 10 yrs, 30% children > 10 yrs, 17% other adult family members
Level of education 14% primary school/no education, 54% secondary school, 27% university degree, 5% Master/Ph.D.
The sample of tourists consisted of almost the same proportion of males as females. EU
tourists accounted for 78%, Italians being the majority. Non-EU tourists were 32%.
The younger age group was more numerous in the tourist sample: 58% of interviewees were
25 to 45 years old and 42% were aged 46 to 65 years.
There was a large number of self-employed professionals both among the interviewees
(36%) and the heads of their families (39%). They were followed by office workers/teachers and
traders and retailers (16% of interviewees and 21% of family heads). Retired and “other”
interviewees were less numerous compared with the sample of Croatian consumers.
As in the Croatian sample, there was a high proportion of unmarried (single, divorced or
widowed) interviewees. Slightly more than 50% had one or more children, while those living with
other adult family members (mostly of-age offspring) were much fewer among tourists.

38
The level of education was more balanced than that of the Croatian sample, as the proportion
of those with primary or secondary school education seemed better to reflect the reality. However,
the number of interviewees with a University degree was still very high.
3.3. General information about the purchase of food products
Given that the development and improvement of marketing strategies for specific products
require first and foremost detailed information on consumers’ habits and their decision-making
process for the purchase of food products, this part of the work aimed at highlighting the main
characteristics of the general demand for food products by Croats and tourists30.
3.3.1. Croatian consumers The Croatian demand for food products seems to be particularly sensitive to quality.
Purchasing and consuming high-quality products is extremely important to 71%, very important to
25%, and important to 4% of respondents.
One of the main indications to emerge from the study is that the places where food is bought
must be distinguished between those selling fresh (fruit, vegetables, meat, fish) and processed
food. Fruit and vegetables are mainly purchased in open-air markets, whereas for other food
products open-air markets come second place31. Among consumers living in urban areas32, there is
a strong conviction that fresh produce sold in open markets is home-grown, thus healthy and safe.
30 These decisions are influenced by a number of variables, such as tradition, habits, living standard, etc. Consumer fears about food quality are also the result of specific events like mad cow disease, GMOs and other recent scares. 31 Research carried out in 2001 by Ekoliburnija showed that ca. 50% of Croatian consumers buy produce, but not meat, meat derivatives and processed food in open-air markets. 32 Since all interviewees lived in urban areas, very few said that they consume home-made food products.
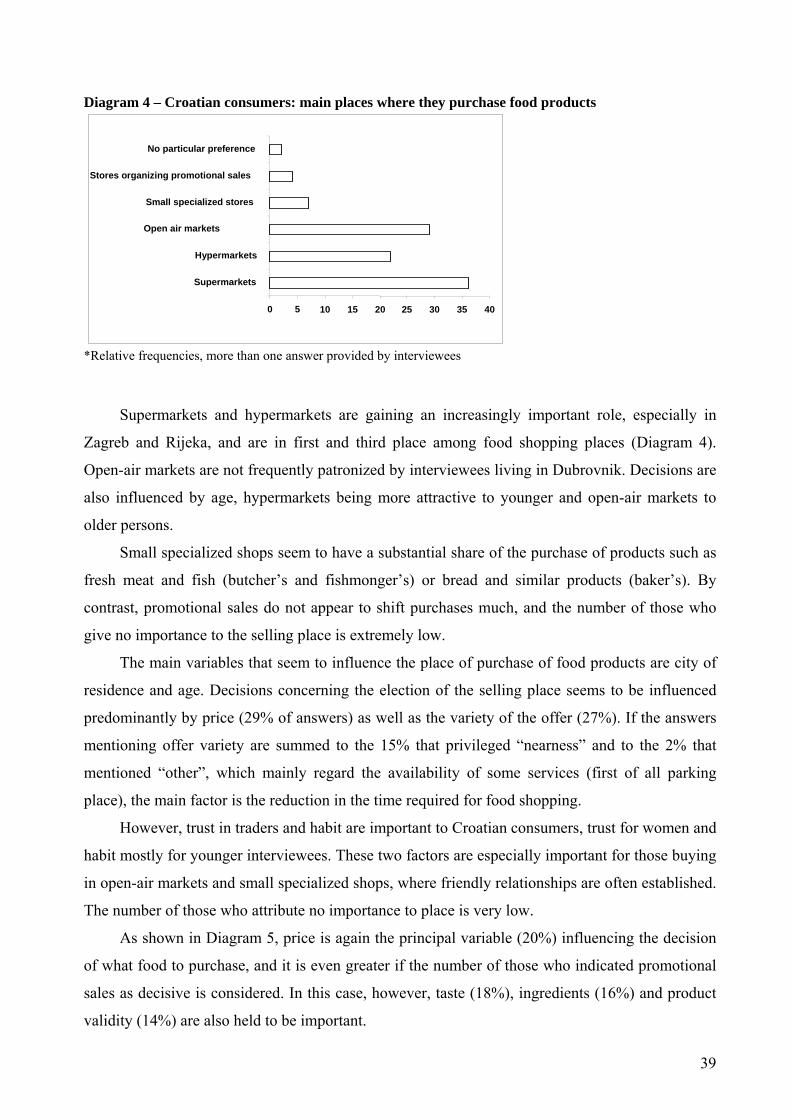
39
Diagram 4 – Croatian consumers: main places where they purchase food products
*Relative frequencies, more than one answer provided by interviewees
Supermarkets and hypermarkets are gaining an increasingly important role, especially in
Zagreb and Rijeka, and are in first and third place among food shopping places (Diagram 4).
Open-air markets are not frequently patronized by interviewees living in Dubrovnik. Decisions are
also influenced by age, hypermarkets being more attractive to younger and open-air markets to
older persons.
Small specialized shops seem to have a substantial share of the purchase of products such as
fresh meat and fish (butcher’s and fishmonger’s) or bread and similar products (baker’s). By
contrast, promotional sales do not appear to shift purchases much, and the number of those who
give no importance to the selling place is extremely low.
The main variables that seem to influence the place of purchase of food products are city of
residence and age. Decisions concerning the election of the selling place seems to be influenced
predominantly by price (29% of answers) as well as the variety of the offer (27%). If the answers
mentioning offer variety are summed to the 15% that privileged “nearness” and to the 2% that
mentioned “other”, which mainly regard the availability of some services (first of all parking
place), the main factor is the reduction in the time required for food shopping.
However, trust in traders and habit are important to Croatian consumers, trust for women and
habit mostly for younger interviewees. These two factors are especially important for those buying
in open-air markets and small specialized shops, where friendly relationships are often established.
The number of those who attribute no importance to place is very low.
As shown in Diagram 5, price is again the principal variable (20%) influencing the decision
of what food to purchase, and it is even greater if the number of those who indicated promotional
sales as decisive is considered. In this case, however, taste (18%), ingredients (16%) and product
validity (14%) are also held to be important.
0 5 10 15 20 25 30 35 40
Supermarkets
Hypermarkets
Open air markets
Small specialized stores
Stores organizing promotional sales
No particular preference

40
Diagram 5 – Croatian consumers: decisive aspects when choosing the food to purchase
*Relative frequencies, more than one answer provided by interviewees
Only middle-aged consumers were concerned with place of production and quality
certificates. However, price and ingredients, together with taste, which reflect habit and tradition,
seem to be the main indicators of food product quality for Croatian consumers. Quality marks and
trust in the selling place and/or trader are much less important.
The “other” answers prevalently concern the quality of food, while some interviewees
expressed a special interest in Croatian food products. Overall, the fieldwork evidenced a lively
interest in Croatian food products and quality food.
The main fear of Croatian consumers when purchasing food products was that they might not
be fresh (29%), and this fear seemed to be mainly influenced by age. Their second preoccupation
was with the healthiness and safety of food (28%).
Another important result to emerge was that Croatian consumers do not particularly trust the
labels on food products, as 28% expressed a lack of confidence in their truthfulness. Female and
older interviewees were particularly concerned about this possibility. The eventuality that food
may originate from polluted and unhealthy areas is next main fear of Croatian consumers.
Interviewees living in Split seemed to be those most concerned.
Many interviewees said they feel almost powerless to reduce the risk of consuming food
whose quality does not match the label, and thus that they “do nothing in particular” to address
this problem (15% of answers). Those who, on the contrary, try to solve the problem do it mainly
by buying products from the same producers (34%) or by purchasing their food in places where
they have established a friendly relationship with the trader (12%).
0 5 10 15 20 25
Brand Products validity (best before)
Ingredients
Price
Taste
Trust in the selling place
Origin of production
Promotional sale
Certified quality Other

41
Labels seem to have great importance in assuaging consumer fears, even though they are not
described as important when choosing food. In fact, although many consumers do not trust the
truthfulness of labels, almost 30% of them said that they read them carefully to allay their fears
about food quality33. By contrast, few Croatian consumers address the problem by purchasing
organic food or products bearing special-quality certificates.
Women were more likely than men to buy products from the same producers and to buy
organic food products to allay their fears. More middle-aged and elderly subjects said they are
attentive to labels than did younger people, may of whom said they to do nothing in particular to
reduce their concern.
Once again, differences were registered in the different cities: the interviewees living in Split
and Dubrovnik often buy products from the same producers or patronize the same places, those
living in Rijeka were more likely to read labels or to do nothing in particular, while the highest
percentage of those who buy organic to assuage their fears lived in Zagreb.
3.3.2. Tourists With reference to the places where food is purchased, tourists expressed strong preferences,
supermarkets being predominant, followed by hypermarkets. Open-air markets were a distant
third. Younger people purchase more frequently at super- and hypermarkets, while older
consumers prefer small specialized shops and open-air markets. The latter are also preferred by
women.
No particular differences emerged with reference to nationality except for promotional sales,
which seem to be particularly appreciated by “other non-EU European tourists”,
The features mainly privileged by tourists when choosing where to buy food are range of the
offer (33%) and price (25%). If “nearness” and “offer variety” are summed, tourists, like Croatian
consumers, try to limit the time spent shopping for food.
However, trust in the traders (11%) and habit (17%) are also important. In this case, some
differences emerged with reference to nationality, as habit seemed to be more decisive among
“other non-EU Europeans” and “other non-EU” tourists, while price seemed to be particularly
important for “other non-EU European” tourists.
33 This result seems to be more in line with data from previous studies (e.g. Ekoliburnija), which revealed that more than 50% of Croatian consumers are attentive to labels and food quality certificates.
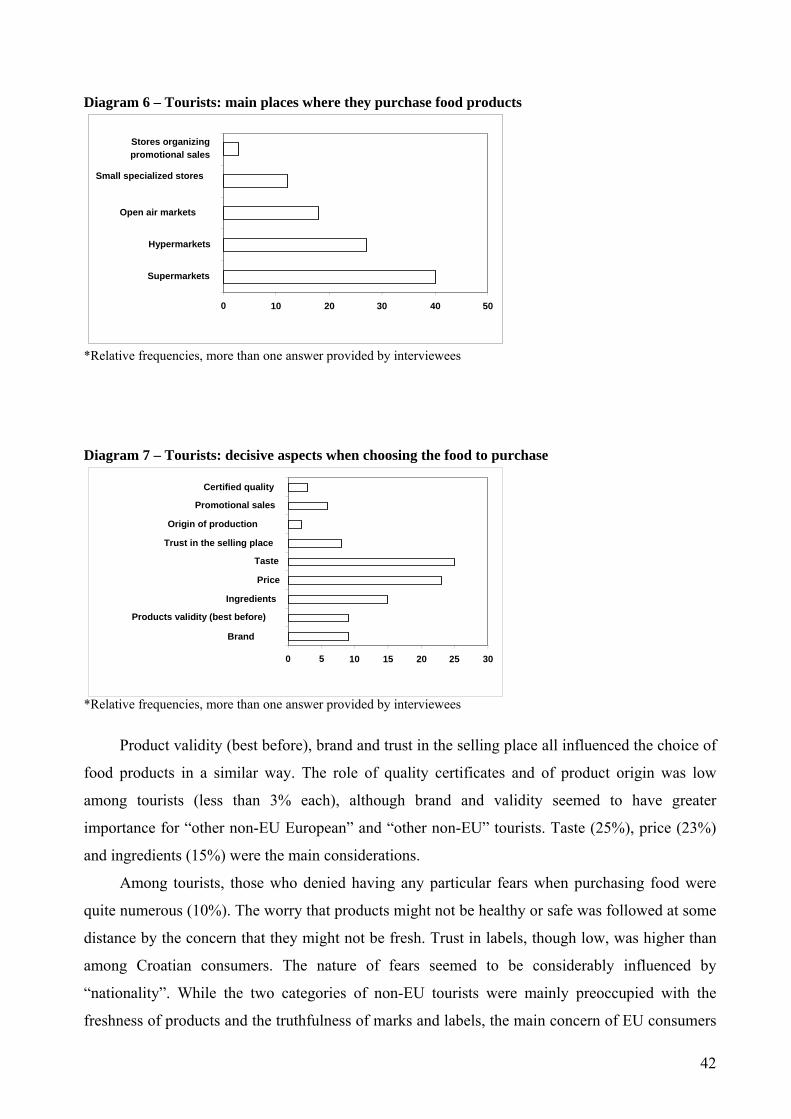
42
Diagram 6 – Tourists: main places where they purchase food products
*Relative frequencies, more than one answer provided by interviewees
Diagram 7 – Tourists: decisive aspects when choosing the food to purchase
*Relative frequencies, more than one answer provided by interviewees
Product validity (best before), brand and trust in the selling place all influenced the choice of
food products in a similar way. The role of quality certificates and of product origin was low
among tourists (less than 3% each), although brand and validity seemed to have greater
importance for “other non-EU European” and “other non-EU” tourists. Taste (25%), price (23%)
and ingredients (15%) were the main considerations.
Among tourists, those who denied having any particular fears when purchasing food were
quite numerous (10%). The worry that products might not be healthy or safe was followed at some
distance by the concern that they might not be fresh. Trust in labels, though low, was higher than
among Croatian consumers. The nature of fears seemed to be considerably influenced by
“nationality”. While the two categories of non-EU tourists were mainly preoccupied with the
freshness of products and the truthfulness of marks and labels, the main concern of EU consumers
0 5 10 15 20 25 30
Brand Products validity (best before)
Ingredients
Price
Taste Trust in the selling place Origin of production
Promotional sales Certified quality
0 10 20 30 40 50
Supermarkets
Hypermarkets
Open air markets
Small specialized stores
Stores organizing promotional sales

43
were healthiness and safety. None of the tourists said they purchase organic food, and very few
that they purchase certified products, to allay these worries. Many interviewees stated that they do
nothing in particular to allay fears concerning food quality (23%). For most interviewees, the main
method to assuage their concern is loyalty to producers (28%) and traders (16%) whose past offer
was satisfactory. Careful reading of labels was the main way to address their worries for as many
as 27% of tourists.
No significant differences where observed among answers provided by EU and non-EU
citizens.
3.4. Comparison of the food purchasing habits of Croatian consumers and tourists
Comparison of family food-shopping habits of Croatian consumers and tourists yielded some
differences.
As regards place, the main difference lies in the number of those who do their shopping in
open-air markets. Indeed, more than 60% of Croatian consumers regularly purchase fresh produce
in these markets. However, a large number of Croatian consumers have no particular preferences
as to where they buy food.
With reference to the decisive factors affecting purchases, the influence of price and distance
was much higher for Croatian consumers than for tourists.
Considerable difference also emerged when the elements affecting the choice of the food to
purchase were analysed. The main difference regards the best before date, which was more
important for tourists than for Croatian consumers. The latter were more concerned about the place
of production and quality labels.
The fears that food might not be fresh or that labels might be untruthful concern Croatian
consumers more than tourist. Analysis of the main actions adopted to allay these fears evidenced
that purchase of organic food is more frequent among Croatian consumers, whereas careful
reading of labels and shopping in the same places seem to be more widespread among tourists.
In partial contrast to what emerged with reference to the importance of marks, Croatian
consumers buy products from the same producers more frequently than tourists to allay their
concern. Although one of their main fears is that labels might be unreliable, they devote more
attention than tourists to reading them. However, the main difference is that some, though few,
Croatian consumers (5%) and no tourist said that they buy organic food to assuage their worries.

44
3.5. Level of acquaintance of interviewees with organic farming and some food logos
The preliminary section of the questionnaires contained questions directed at identifying the
level of acquaintance of Croatian consumers and tourists with organic food products and food
products bearing the “Croatian quality” and “Croatian creation” logos. The level of information of
Croatian consumers and their ability to recognize the Eko logo on Croatian organic food were also
investigated.
3.5.1. Organic farming According to the fieldwork, more than 80% of Croatian interviewees said they are
acquainted with organic food products, while 17% had never heard about them. These very
positive data must be taken with caution and seen in the light of the sample’s composition. A very
high proportion had secondary or university education, and all respondents lived in the largest
Croatian cities, probably resulting in a higher-than-average level of knowledge.
More Croatian consumers than tourists affirmed to be acquainted with organic farming.
Some 29% of foreign interviewees were not acquainted with organic farming. Again, the structure
of the sample should be considered. Respondents with primary school education were more
numerous among tourists than among Croatian consumers, and places of residence, though not
investigated, were presumably more heterogeneous than those of Croatian consumers.
The different nationalities within the tourists sample should also be considered. Even though
EU citizens, who are likely to be more informed about organic farming, were numerous, some
30% of tourists were non-EU citizens.
Language problems that were sometimes encountered when interviewing tourists may also
have affected results.
Altogether, it may be stated that there were no significant differences in the levels of
information of Croatian consumers and tourists regarding organic farming.
Awareness of the Croatian Eko logo was also analysed among Croatian consumers, who
were asked if they had ever seen any of the logos shown in figure 4.1 (where the first and third are
fakes) and to indicate the one appearing on Croatian organic food products. More than 33% said
did not know about the logo, and 11% that they were not certain they recognized it.

45
Figure 2 –Eko logo test
More than 50% of interviewees said they knew the logo, a particularly positive result
considering its recent introduction and the few products that bear it. As concerns the number of
those who correctly recognized it, when consumers were asked to indicate the Croatian Eko logo,
about 40% could tell it from the fakes (or about 70% of those who originally said they knew the
logo); almost 30% of those who said they knew it indicated a fake logo or said it was not among
those shown.
Diagram 8 – Croatian consumers: “Which of these logos is the Croatian Eko logo?” Mark 1
7%I don't know
7%
Mark 314%
Mark 2 (correct)
72%
The very large proportion of correct answers is significant, given that the chance probability
of a correct answer was 33%. Again, these data should be considered with caution and seen in the
light of sample structure, which included a large percentage of persons with secondary or
university education.

46
To gain further information on the knowledge of organic farming by Croatian consumers and
tourists, they were asked to state in their own words which characteristics distinguish these from
conventional products. A wide range of definitions was given by interviewees.
The replies of Croatian consumers are illustrated in Diagram 9. Eight categories of
definitions were identified.
Diagram 9 – Croatian consumers: definitions of organic farming
About 10% of interviewees gave an incorrect answer, and 15% were unable to provide one.
Around 15% offered a correct definition, making reference to the production techniques and/or
compliance with laws regulating organic farming, and distinguished it from their conventional
counterparts. Some also made reference to the certification process. The remaining answers (60%)
were partially correct definitions. Most Croatian consumers are convinced that organic products
are free of pesticides and other chemical inputs (27%) and/or equate organic with home-grown
food (15%). The main fears of Croatian consumers concern pesticides and many believe that
home-grown/made products are free of them34. Other definitions made reference to the production
process (7%) or, again, expressed a conviction that organic products do not contain pesticides or
chemicals. Many interviewees believe that organic food products do not contain GMOs.
34 In 2001, Ekoliburnija, carried out a survey to investigate the level of information of Croatian consumers about organic food. Of 600 Croatian consumers, 36% considered organic products equivalent to home-grown products.
Products free ofGMO5%
Products free of pesticides and otherchemical additives
27%
Products free of GMO, chemical
additivesand preservatives
9%Correct definition15%
Natural products/products
cultivated in a\natural way 7%
Home-grown & home-made products
12%
Other 10%
I don't know/Missing15%

47
Overall, the definitions provided show that the majority of Croatian consumers know what
organic farming is with great approximation. In the tourist sample, many missing answers or “I
don’t knows” (up to 24%) and the low number of correct answers (10%) may, at least partially, be
attributed to language problems.
Diagram 10 – Tourists: definitions of organic farming
About 24% of tourists said that organic food products are free of GMOs, while 18% made
exclusive reference to pesticides and other chemicals, which would not be found in organic food.
A large number of interviewees said that organic food products are natural products (15%),
probably meaning that they are produced using traditional techniques. Only a small proportion of
tourists consider organic and home-grown products to be equivalent.
3.5.2. The “Croatian quality” and “Croatian creation” logos In this preliminary section we also explored the number of Croatian consumers and tourists
who are acquainted with the “Croatian quality” and “Croatian creation” logos. It emerged that
83% of the former and fewer (46%), but still many, tourists are acquainted with products bearing
these labels.
A large number of Italian consumers living in border areas said they regularly purchase food
in Croatia, and showed a high level of information concerning Croatian food products. As regards
the latter question, some 30% of tourists were non-EU citizens, mostly from former Yugoslav
Products free ofGMO9%
Products free of pesticides and other chemical additives
18%
Products free of GMO, chemical additives and preservatives
16%
Correct definition10%
Natural products/products
cultivated in a natural way 15%
Home-grown & home made products
2%
Other 3%
I don't know/Missing 24%
Healthy and safe food/not polluting
techniques3%

48
Countries: these exhibited a good knowledge of Croatian food products, because they regularly
consumed them until recently and because the former Yugoslav Countries are still the main export
markets for Croatian food.
3.6. Organic food
3.6.1. Croatian consumers The level of knowledge and information about organic food products was analysed in detail
in this part of the work. The very first result was that only 42% of Croatian consumers are aware
that conventional agriculture pollutes. Residents of Split and Zagreb gave the highest proportion of
corrects answers, and those of Dubrovnik the largest number of wrong answers.
As regards organic farming, the main source of information are the media in 50% of cases,
followed by friends and colleagues (30%). Promotional sales have a smaller role, while “other”
mainly indicated advice from doctors or information from schools or universities.
Diagram 11 – Croatian consumers: level of information and knowledge about organic food
05
101520253035404550
Very low Quite low Low Neitherlow nor
high
High Quite high
*Relative frequencies
Croatian consumers seemed to be aware of the fact that their level of information and
knowledge about organic farming should be improved. More than 30% of interviewees judged
themselves as having a low or very low level of knowledge; 46% believe they know only the basic
information concerning organic farming, and 24% that their level of knowledge and information is
high or quite high. None defined their level of knowledge as very high. However, when asked to
indicate, among four definitions, the correct description of organic farming, nearly 80% gave the
correct answer and only 1.2% were unable to answer.

49
Table 20 – Croatian consumers: definition of organic farming Definition: Organic farming Absolute
frequencies Relative
frequencies (%) uses limited quantities of mineral fertilizers and pesticides 1 0.6 avoids mineral fertilizers and pesticides and uses methods that restore the land’s original fertility and respect the well being of animals
134 77.5
uses organic ecological components, never pesticides 36 20.8 does not allow the use of machines 0 0 I don't know 2 1.2
One of the objectives of the fieldwork was to define and quantify the demand for and
consumption of organic food in Croatia.
Diagram 12 – Croatian consumers: “Do you buy organic food for yourself or your family?”
Yes33%
I don't know16%
No34%
Don't know what is
organic/Missing17%
To the question “Do you purchase organic food?”, only 40% of those who said they were
acquainted with organic farming answered in the affirmative. Given the number of those who
answered in the negative (34%) and of those who said they are unacquainted with organic farming,
only 33% of Croatian interviewees actually buy organic food products. “I don’t know” answers
(16%) were considered as negative answers, since the purchase of organic food is a conscious
decision and this type of food is highly unlikely to be bought and consumed unaware. In addition,
the majority of Croatian consumers who said they buy organic food do it infrequently: about 38%
from 1 to 3 times a month, and 11% less than once a month.

50
Diagram 13 – Croatian consumers: frequency of purchase of organic food
05
1015202530354045
Less thanonce amonth
1-3 times amonth
Once a week 1-3 times aweek
I don't know
*Relative frequencies
Again, different consumer habits emerged in different cities. The majority of those who said
they purchase organic food live in Dubrovnik and Split, while few residents of Rijeka did.
The purchase of organic food was especially influenced by the level of information and
knowledge of consumers with reference to these products. Those with greater knowledge and
information buy organic products more frequently. Still, even among those interviewees who
defined their level of information as high or very high, there was a surprising percentage of
individuals who are not certain whether they purchase organic food products. Consumers who
spend substantial sums (200 Kunas/month or more) on organic food were predominant. In this
category, which accounts for almost 43% of the answers, 18% of interviewees buy organic food
very frequently, spending more than 500 Kunas/month35. A large number of interviewees (30%)
said they spend 100 to 200 Kunas and around 20% spend less than 100 Kunas. Interviewees living
in Dubrovnik and Split buy organic food more frequently and are also those who spend most,
although the residents of Zagreb also spend substantial sums.
Doubts about the truthfulness and significance of some data were raised by the answers on
the main places where organic food is purchased, since an excessive number of consumers said
they do so in open-air markets even in cities, like Split and Dubrovnik, where no stands sell
organic food (Table 21). Another 33% of interviewees from Dubrovnik said they buy organic food
directly from farmers, even though no organic farms are registered in the County.
These answers evidence that the number of Croatian consumers who actually purchase
organic food is in fact lower than the number obtained in the previous parts of the survey (where
35 Average 2002 annual exchange rate: 1 HRK / 7.863712 $, Hrvatska Narodna Banka, Godisnji i mjesecni devizni tecajevi, HNB, 2004

51
33% said they buy organic food), because some consumers confuse organic with home-grown
food and/or with produce sold in open-air markets.
Table 21 – Croatian consumers: main places of purchase of organic food by city
City Directly from
farmers In specialized organic
food shops In small markets
In supermarkets / hypermarkets
In open-air markets
Dubrovnik 28% 4% 20% 17% 31% Rijeka 23% 33% 11% 33% 0 Split 15% 33% 4% 33% 15% Zagreb 22% 31% 3% 22% 22% *Relative frequencies, more than one answer provided by interviewees
Finally, the minor importance of the Eko marks for Croatian consumers and their high level
of trust in traders were confirmed in this detailed part of the study.
The variables influencing the choice of the place of purchase of organic food are age
(younger interviewees prefer open-air markets) and amounts spent (as those who purchase more
and spend more. i.e. 200 Kunas or more, buy more frequently directly from farmers).
Doubts concerning the numbers actually purchasing organic food were also raised by the
ability to recognize some organic marks sold on the Croatian market. This question was prepared
as a test, since some of the names were invented.
Table 22 – Croatian consumers: “Do you recognize these organic marks?” Marks Yes No Mavrovic 77% 33% Bio Vega 49% 51% Prima Natura 13% 87% Eko Dalmacija 21% 79% MID 0 100% Bio Avent 7% 93% *More than one answer provided by interviewees
As shown in Table 22, the most widely recognized organic marks were “Mavrovic” and
“BioVega”. The first appears to be particularly well known in Rijeka and Zagreb, the second in
Split and Dubrovnik. A number of interviewees recognized “Prima natura” and “Bio Avent”,
which were invented. Many interviewees also said they recognized the “Eko Dalmacija” logo,
which is a real organic label but is sold in limited areas of Dalmatia, so the actual number of those

52
who know it is probably lower. Again, the effective number of those who purchase organic food in
Croatia is thus likely to be much lower than consumer answers lead to expect.
In conclusion, some data and convictions of Croatian consumers concerning organic
products were collected. Few (4%) were dissatisfied with the organic supply in Croatia compared
with 46% who were satisfied and 35% who were very satisfied.
When consumers who purchase organic food and those who are acquainted with but do not
buy it were asked to express their agreement and the intensity of their agreement or disagreement
with some features of organic food products, there emerged a profound trust in the quality
characteristics of products. Those who strongly agreed with product healthiness (61%) and
nutritional characteristics (51%) greatly exceeded the number of those who disagreed or strongly
disagreed. Only 4% disagreed with the statement that organic food products are healthy, and 7%
did not believe that organic food is nutritional. As regards product safety, however, most
consumers agreed (34%) with this statement, whereas those who strongly agreed were fewer
(around 20%). Nearly the same proportion (17%) neither agreed nor disagreed.
With reference to the statement “Organic food has a good taste”, the majority of interviewees
agreed (24%) or strongly agreed (up to 39%), but those who neither agreed nor disagreed were
also numerous (20%).
The strongest conviction of Croatian consumers was that organic food products are free of
GMOs, as 73% strongly agreed, 10% agreed, and only 6% disagreed or strongly disagreed.
Another firmly held conviction was that organic food is too expensive: 49% strongly agreed
with this statement and another 37% agreed, while only 3% did not.
However, consumers are convinced that organic food products are better than conventional
products and that the labels they bear are reliable and guarantee this particular quality.
The convictions expressed by the resident of Split seem to contrast with those of the other
interviewees, particularly those living in Rijeka. The former were those who most doubted the
reliability of organic food labels and were least satisfied with organic food products (safety,
healthiness, nutritional characteristics and absence of GMOs). By contrast, the residents of Rijeka
and Zagreb strongly agreed that organic food is too expensive.
Even though the majority of Croatian consumers strongly disagreed with the statement that
organic farming is a fad (51%), a significant number (18%) were uncertain or agreed (6%). It is
surprising that many of those who strongly believe that organic food is a fad do buy organic food.
The main reasons for the low demand for organic food in Croatia are summarized in Table
23. All interviewees were asked to state the reasons for not buying organic or more organic food.

53
Table 23 – Croatian consumers: main reasons limiting their purchases of organic food Reasons Absolute frequency Relative frequencyPrice 88 22% Conventional food is better 3 1% Conventional food is safe 3 1% Don’t like the taste 10 2% Don’t trust the organic food labels 9 2% Organic food is difficult to find 53 13% Poor offer 100 26% Poor promotion and information 81 20% I don't know where to buy organic food 54 13% *More than one answer provided by interviewees
Price was the main motivation for 22% of the sample, difficulties in finding organic products
for 13%, poor offer for 26%, and scarce information about the places where organic food products
can be purchased for 13%.
The low proportion of interviewees indicating price as the main reason (22%) is surprising,
since this fact emerges as the main reason for the low demand, suggesting a low level of
knowledge of organic food by Croatian consumers. In fact, price was mainly stated as an obstacle
by those who purchase organic food. Those who buy it once a month to once a week are mostly
those who believe that price does not allow them to buy more. Price seems to be more important
for younger and, especially middle-aged, interviewees, whose families are presumably more
numerous and already spend a large share of their income in food purchases.
“Poor offer” was mostly indicated by those who purchase organic food and would appreciate
a broader range. These interviewees also complained of poor promotion of organic food.
Among those who affirmed to be unacquainted with places where to buy organic food, the
highest number and those who do not purchase it lived in Rijeka.
The survey also explored the willingness of Croatian consumers to pay (WTP) for organic
extra-virgin olive oil. The analysis used the contingent valuation method (CVM), a stated-
preference valuation technique. CVM has mainly been used for non-marketed (public) goods,
although several studies on how to apply it to market (private) goods have been conducted. CVM
applied to market goods seeks to answer questions related to the market demand for certain
product attributes (e.g. reduced pesticides residues, fat or cholesterol) or methods of production
(e.g. organic or GMO-free). In this survey we used an open-ended questioning method, i.e.

54
subjects were asked to state their maximum WTP for organic extra-virgin olive oil: 78.6% said
they would be willing to pay a higher price.
The inferred demand curve for organic extra-virgin olive oil is reported below: 70 Kunas is
the average market price for conventional extra-virgin olive oil. If prices were equal, 100% of
consumers would buy organic olive oil, whereas only 5% said they would buy it if it cost more
than 125 Kunas, as is the case at present. The average WTP was 104.5 Kunas, and 51.9% of
consumers would not be willing to pay more than 90 Kunas.
Demand for Organic Extra Virgin Olive Oil in Croatia(Percentage Willing to Pay more than a given Price)
0
20
40
60
80
100
120
70 kunas 80 kunas 90 kunas 105 kunas 125 kunas 150 kunas More than 150kunas
WTP (price in kunas)
% R
espo
nden
ts
Actual Demand
Expected Demand(AssumingNormality)
WTP was correlated to individual consumers characteristics using ordered probit regression
analysis. Higher WTP is directly and significantly correlated with:
• Knowledge of the organic Eko logo
• Parents of young children
• Those who consider themselves as highly informed and knowledgeable about organic
food
• Those who consider price as a decisive factor in choosing a food product.
The WTP data show that demand for organic products could potentially involve up to 5% of
Croatian consumers even if consumer price premia were 78% of the price for the conventional
product. This analysis regarded organic olive oil, a niche luxury product, and cannot be extended
to commodities, but it shows a moderate market potential for the domestic organic demand.

55
3.6.2. Tourists While the tourists acquainted with organic farming were 71% of the sample, those aware of
the negative impact of conventional agricultural techniques on the environment were 35%.
Almost the same number of tourists and Croatian consumers gave a wrong definition of
organic farming (33%), while 32% were uncertain and did not give one. “Other non-EU citizens”
gave the majority of correct answers.
The main sources of information regarding organic farming were the media (58%), followed
by friends and colleagues (26%) and promotional sales (14%). Friends and colleagues are a
particularly important source for non-EU citizens, while the media have a considerable role for
retired interviewees, students and housewives independently of nationality.
A large number of tourists believe to be aware of only the basic information about organic
farming (46%), 25% to have greater-than-average knowledge, and 29% to know little or very little.
Diagram 14 – Tourists: level of information and knowledge concerning organic farming
05
101520253035404550
Very low Quite low Low Neitherlow nor
high
High Quite high
*Relative frequencies
Younger and middle-aged interviewees possessed a higher level of information; an influence
on knowledge was also evidenced for job and education, as self-employed professionals were
again more informed, as were individuals with higher education.
No significant differences were observed between EU and non-EU citizens.
Tourists were also asked to indicate among some different definitions of organic farming the
one they believed to be correct. More than 80% of tourists identified the correct definition, very
few gave a wrong answer and 7% were unable to answer (Table 24).

56
Table 24 – Tourists: definition of organic farming Definition Absolute
frequencies Relative
frequencies uses limited quantities of mineral fertilizers and pesticides 0 0% avoids mineral fertilizers and pesticides and uses methods that restore the land’s original fertility and respect the well being of animals
145 82.9%
uses organic ecological components, never pesticides 18 10.3% does not allow the use of machines 0 0% I don't know 12 6.9%
More than 60% of tourists acquainted with organic farming (45% of the sample) said they
buy organic food at home, accounting for 67% of “other EU” citizens, 71% “other EU” citizens
and 73% of Italians. Among “other non-EU Europeans”, less than 50% buy organic food at home.
A very high proportion of interviewees (86%) buy organic food regularly and more than
once a week, 10% do so once a week, and 4% a few times a month. Despite this, very few said
they had bought or intended to buy organic food products while on vacation in Croatia. It should
be highlighted that this is at least partly due to the fact that tourists take many meals in hotels and
restaurants and do not frequently purchase food from stores and markets36.
Only 15% of tourists who regularly purchase organic food at home were interested in doing
so while in Croatia. Almost 30% of the answers were explicitly negative, while some 25% of those
interviewed did not exclude the possibility, but were not particularly interested.
Diagram 15 – Tourists: intention to purchase organic food in Croatia Yes15%
No29%
I don't know25%
Don't know what is
organic/Missing31%
36 This study should be extended by exploring the demand for organic food by restaurants and hotels.

57
Table 25 – Tourists: intention to purchase organic in Croatia by nationality Nationality Yes No I don't know Total
Italian 22% 35% 43% 100%Other EU 19% 35% 46% 100%non-EU European 17% 61% 22% 100%Other non-EU 31% 38% 31% 100%
There were no significant differences regarding the intention to purchase organic food in
Croatia between EU and non-EU citizens. Whereas middle-aged and older interviewees expressed
some interest, the younger tourists were uninterested even though they did not exclude the
possibility.
Diagram 16 – Tourists: frequency of purchase of organic food during one week of vacation in Croatia
0
10
20
30
40
50
60
70
Once a week 1 - 3 times a week I don’t know
*Relative frequencies
The frequency data show that the majority of interviewees (60%) intended to buy organic
food once during a one-week stay in Croatia and 38% more than once. Given the sums they
intended to spend (in 50% of cases from 50 to 100 Kunas and in another 30% from 20 to 50
Kunas) and the occasional nature of the actual or intended purchases, it can be inferred that these
consumers are just interested in tasting Croatian organic food. Most Italians intended to spend 50 -
100 Kunas (65%), whereas 22.5% of “other non-EU Europeans” intended to spend more. The
younger tourists were again less willing to spend significant sums on organic food while on
vacation.
Table 26 – Tourists: sums they intend to spend on organic food during one week of vacation in Croatia by nationality Nationality 20 – 50 Kunas 50 - 100 Kunas 100 - 200 Kunas I don’t know Total Italian 30% 65% 0 0.5% 100% Other EU 0 100% 0 0 100% non-EU European 37.5% 25% 25% 12.5% 100% Other non-EU 25% 25% 0 50% 100%

58
The large number of tourists who mentioned open-air markets with regard to the main places
where they had purchased organic food in Croatia raise some doubts. Given that tourists were
mostly interviewed on the islands and small coastal towns, where there are no registered organic
food stands, the actual number of those who did purchase organic food must be even lower than
the 15% that emerged from the previous questions. These answers show that also some tourists
confuse organic food with home-grown products sold in open-air markets.
Table 27 – Tourists: main places where organic food was bought by place of interview
City Directly from
farmers
In specialized organic food
stores In small markets
In supermarkets/hypermarkets
In open-air markets
Crikvenica 0 0 29% 29% 42% Dubrovnik 0 0 33.30% 33.30% 33.30% Makarska 0 0 0 0 0 Pag 0 0 40% 20% 40% Rijeka 0 0 40% 20% 40% Split 0 0 0 100% 0 Zadar 0 6% 29% 29% 36% Zagreb 0 0 0 0 0 *Relative frequencies, more than one answer provided by interviewees
Further doubts were raised by the data that emerged when tourists were asked to indicate
some of the organic labels sold on the Croatian market.
Table 28 – Tourists: “Do you recognize any of the following organic labels?” BRAND YES NO Mavrovic 30% 70% Bio Vega 35% 65% Prima Natura 0 100%Eko Dalmacija 76% 24% MID 0 100%Bio Avent 0 100%*Relative frequencies, more than one answer provided by interviewees
Unlike Croatian consumers, none of the tourists said they recognized the fake marks.
However, the very high proportion (76%) who recognized the “Eko Dalmacija” label, which
represents a small association of producers of organic fruit and vegetables that are not sold in
open-air markets or supermarkets but in a limited number of specialized shops, suggests that some
interviewees indicated it because of its plausible name.
Nearly all consumers who had purchased organic food in Croatia indicated a low level of
satisfaction with the Croatian organic supply independently of the place where they were
interviewed or products were purchased. The majority of tourists said that the organic offer is not

59
satisfactory (73%) or extremely unsatisfactory (13%), and very few (3%) of those who had bought
organic food in Croatia thought otherwise.
By contrast, most tourists expressed high (28%), very high (60%) and seldom neutral levels
of satisfaction with the quality of products; there were no negative answers. Consumers who had
purchased “Biovega” were more likely to express a favourable opinion. There were no nationality
differences in the level of satisfaction. The majority of “very high” answers was given by those
who had bought organic food in supermarkets.
The opinions of tourists concerning the characteristics of the organic food sold in Croatia
indicated that their strongest conviction is that it is more nutritional (11% of interviewees agreed
and 78% strongly agreed) and, more in general, better than conventional food (16% and 64%
respectively). Unlike Croatian consumers, tourists also appreciated its taste, as 82% agreed or
strongly agreed with the statement that Croatian organic food has a good taste. Many also believed
that Croatian organic food is safe, although the proportion of those who agreed (56%) was higher
than the proportion of those who strongly agreed (15%) and those who neither agreed nor
disagreed were 27%.
The price of organic food in Croatia does not seem to limit tourist demand. In fact, those
who agreed or strongly agreed with the statement that organic food is too expensive accounted for
25%; another 60% neither agreed nor disagreed, while some 2% disagreed.
A large number of interviewees (75%) said that distribution and promotion of organic food
are not well organized in Croatia, making it difficult to find.
As regards tourists’ desire to find Croatian organic products on their markets, even though
most consumers agreed (52%), many were uninterested (31%) or even disagreed (12%); the
prevalence of “I agree” answers should thus not be interpreted as particularly encouraging37. This
is also confirmed by the fact that a fair number of interviewees did not seem to feel that the
organic supply in Croatia is not worse than the supply in their stores. Up to 28% of those
interviewed neither agreed nor disagreed that “Croatian organic food is worse than the organic
food I purchase in my Country”, and 14% agreed with this statement. However, it is important to
note the high prevalence of consumers who had appreciated both the taste and the quality of the
organic products they had bought, as well as the idea of finding them in their supermarkets.
Italian consumers seemed to be those who most appreciated organic compared with
conventional products, and also strongly believe that they are more nutritional. Although the 37 It is important to note that the organic supply in Croatia, particularly in supermarkets and other stores, is mostly represented by imported products, so that tourists who purchased organic food did not necessarily buy Croatian products. These results are therefore not particularly indicative of the potential of the Croatian organic supply on foreign markets or on the local tourist market.

60
majority did not believe that Croatian organic food products are too expensive, they were the most
numerous of those who are not convinced that Croatian organic food is not worse than the food
they buy at home, and were less interested in finding Croatian organic food in their Country
The main reasons why tourists did not purchase more organic food products during their
vacation in Croatia are shown in the following table. The principal ones seem to be distribution
and promotion inefficiencies that make the supply poor and selling places difficult to find.
Table 29 – Tourists: main reasons limiting their purchases of organic food in Croatia Reasons Absolute Frequencies Relative frequenciesPrice 44 12.0% Croatian conventional food is better 1 0.3% Croatian conventional food is safe 14 3.8% I don't like the taste 1 0.3% I don't trust the organic food labels 1 0.3% Organic food is difficult to find 24 6.5% Poor offer of organic food 88 23.9% Poor promotion and information 103 28.5% I don't know where to buy organic food 81 22.0% Not interested 11 3.0%
Based on nationality, prices and difficulties in finding places offering organic food products
were particularly limiting for “other non-EU citizens”.
3.7. Purchasing habits of organic food of Croatian consumers and tourists
There were no significant differences in the level of information of Croatian consumers and
tourists with reference to conventional and organic farming. Differences emerged in the main
sources of information on organic farming, the media seemingly having a large influence on both
samples, whereas the role of friends and colleagues was much greater among Croatian consumers.
Significant differences emerged with reference to the frequency of purchases of organic food
and the sums spent on it, both of which were higher among tourists.
As regards the organic labels, some Croatian consumers and none of the tourist said they
knew the fake logo (“Prima natura”). “Mavrovic” was mainly recognized by Croatian consumers,
whereas a high proportion of tourists indicated Eko Dalmacija, probably because it is plausible.
Significant differences (χ square and asymptotic significance level tests) were also obtained
for the agreement of different consumer categories with the statements proposed, particularly those
concerning the taste and safety of organic compared with conventional food. In all cases, a much
greater number of Croatian consumers expressed a stronger level of distrust. More Croatian
consumers than tourists disagreed or strongly disagreed that organic food is too expensive,

61
whereas no significant differences emerged with reference to their level of satisfaction with the
organic food products sold in Croatia.
Exploration of the main reasons limiting the purchase of organic food in Croatia highlighted
several significant differences, especially with regard to price, trust in labels, opinion that organic
food is safe, and information about places where to purchase organic food products. Price and lack
of trust in labels seem to affect Croatian consumers more than tourists, while tourist were more
likely to answer that conventional food is as safe as organic food and that they do not know where
to buy organic food in Croatia.
3.8. The “Croatian creation” and “Croatian quality” logos
3.8.1. Croatian consumers As shown in Table 30, although many Croatian consumers said they were acquainted with
the “Croatian creation” and “Croatian quality” labels, those who actually know what they
guarantee were fewer. This was particularly true of “Croatian quality”, for which only 28% gave
the correct answer. The majority of Croatian consumers could not distinguish between the two
labels and thought that they both guarantee Croatian autochthonous and traditional products.
The “Croatian quality” logo suggested to 11% of consumers that products bearing them use
exclusively Croatian raw materials. As regards Croatian creation”, even though the majority of
interviewees gave the correct answer, 17% believed that products bearing it use exclusively
Croatian raw materials. The majority of correct answers were provided by middle-aged and older
citizens, particularly those living in Zagreb and Rijeka.
Table 30 – Croatian consumers: “What do the “Croatian quality” and “Croatian creation” logos guarantee?” Croatian
quality Croatian creation
Definitions Relative frequencies
Relative frequencies
That the raw materials originate from Croatia 11% 17% That product quality meets Croatian regulations 18% 1% That the quality characteristics of products, produced in Croatia, meet international standards 28% 2% That the products and package are designed by Croatian designers 0 1% That they are Croatian autochthonous products, resulting from Croatian tradition, research and technological innovation, and that their quality characteristics meet high international standards 37% 75% Other (specify) 3% 2% I don’t know 3% 2%

62
The predominant source of information concerning these products were the media (80% of
those interviewed); promotional sales seem to have a marginal role (12%). However, when asked
to define their level of information and knowledge about the logos, a minority of Croatian
consumers (22%) said it was high or very high, and 27% defined it as low or very low, while the
majority said they had basic but sufficient information. The level of information did not appear to
be different among age groups or to be influenced by level of education38.
The majority of Croatian consumers (78%) said they buy “Croatian quality” and “Croatian
creation” products (while far fewer said they buy organic food products); few were uncertain
(19%) and only 3% stated that they do not purchase products bearing the logos.
Significant differences were that a particularly high number of consumers purchase labelled
products in Dubrovnik and Rijeka, whereas in Split and Zagreb 30% of interviewees were
uncertain as to whether they occasionally buy them. The number of those who actually buy
“Croatian creation” and “Croatian quality” products is however lower if the answers concerning
product names and the main places where the interviewees said they shop are analysed. Indeed,
23% of interviewees indicated names of products that bear neither logo (“Sirko” cheese), and
another 11% said they buy in open-air markets, where they are not in fact sold.
Overall, the fieldwork evidenced an intense interest by Croatian consumers in Croatian food
products. This suggests that at least part of the answers of this section may reflect a tendency to
buy food “made in Croatia” rather than labelled Croatian food products. Further investigation of
this aspect is clearly warranted.
Some 40% of Croatian consumers said they are influenced by quality labels (for 30% they
are quite important and for 10% they are decisive), 35% are little influenced or not at all, and 23%
are not influenced either positively or negatively. Therefore, although those who attribute
importance to labels are the higher proportion, labels are unimportant to more than 50% of
Croatians. This lends at least partial support to the concept that a large number of Croatian
consumers in fact mean to purchase products “Made in Croatia” (out of a love of tradition, habit, a
desire to help the economy or a conviction that Croatian food is better) rather than to buy quality-
label food.
Again, the interviewees living in Dubrovnik appeared to be those most influenced by the
labels, as for 28% they are decisive when purchasing these products. By contrast, interviewees
from Rijeka, although they said they buy these products frequently, do so for different reasons.
38 Again, it should not be forgotten that the interviewees were exclusively city dwellers with a particularly high proportion of secondary school or University education.

63
Table 31Table 9.2. – Croatian consumers by city: “How much are you influenced by quality labels?” City Not at all, I
would buy the products anyway Little
Neither positively nor
negatively Quite a lot They are decisive
I don’t know
Dubrovnik 4% 11% 5% 52% 28% 0 Rijeka 50% 10% 40% 0 0 0 Split 18% 14% 21% 39% 4% 3% Zagreb 18% 29% 40% 18% 0 0
The main reasons that stimulate those interviewed to buy quality-label products were quality
(83%), a respect of tradition (51%) and a desire to help the economy (48%); safety and security
considerations were mentioned by 22%. Promotions, price and “other” reasons (mainly taste and
the habit to buy some Croatian products) followed at considerable distance. Safety and security
were mostly indicated by the younger interviewees (25-30 years) and tradition mostly by middle-
aged and older consumers.
Diagram 17 – Croatian consumers: main reasons for buying products bearing quality labels
*Relative frequencies, more than one answer provided by interviewees
Difference among cities emerged again, as interviewees from Split and Dubrovnik were
more likely to mention “to help the economy”, whereas tradition seemed to have greater
importance for those living in Rijeka and Zagreb, who were also more concerned about the quality
that the labels guarantee.
The answers regarding some opinions of Croatian consumers highlighted that they value
quality products independently of the label. Nearly 90% of those interviewed agreed or strongly
agreed that those products have a good taste. The interviewees also agreed that they are safe and
that labels are reliable, even though in this respect the level of conviction was lower since those
who strongly agreed diminished while those who neither agreed nor disagreed increased (32% and
0 5 10 15 20 25 30 35 40
Quality Safety and security
Tradition
Help to Croatian economy Packaging
Promotions
Price
Other

64
15%, respectively). Quality-label products are also considered better than those not bearing labels,
despite a large number of “neither agree nor disagree” answers (26%) and 10% of the interviewees
believing that labelled products do not differ from unlabelled ones.
A widely shared opinion was that labels should be used to ensure a better performance of
Croatian food products on foreign markets and to distinguish Croatian autochthonous food
products of the Croatian tradition. Labels should also be used to increase the sales of Croatian food
products on the local seasonal tourist market.
The reasons for not buying more labelled products are reported in Table 32..
Table 32 – Croatian consumers: main reasons limiting the purchase of more quality-label products Reasons Percentages Price 16% Products without certificates are better 0 Products without certificates are safer 1% I don’t like the taste 1% I don’t trust special-quality products labels 1% They are difficult to find 11% Poor offer 27% Poor promotion and information 33% I don’t know where to buy them 6% Other 4% *More than one answer provided by interviewees
The main reason stated was poor promotion of and information about the “Croatian quality”
and “Croatian creation” logos, followed by poor offer of products and difficulties in finding them.
“Other” reasons, mainly the insufficient visibility of logos on products, were also cited. Price was
another considerable problem, whereas none of those interviewed believed that conventional
products are better than organic products.
3.8.2. Tourists
About 50% of tourists were acquainted with the “Croatian quality” and “Croatian creation”
logos. “Other non-EU European” citizens were those better informed.

65
Diagram 18 - Tourists by nationality: level of acquaintance with the “Croatian quality” and “Croatian creation” logos
*Relative frequencies
When tourists were asked to indicate what, in their opinion, the “Croatian quality” and
“Croatian creation” labels guarantee, almost 50% correctly identified the definition of “Croatian
quality”. Even better results were obtained for “Croatian creation” (66% of correct answers).
Table 33 – Tourists: “What do the “Croatian quality” and “Croatian creation” logos guarantee?” Croatian
quality Croatian creation
Definitions Relative frequencies
Relative frequencies
That the raw materials originate from Croatia 6% 13%
That product quality meets Croatian regulations 19% 0 That the quality characteristics of products, produced in Croatia, meet international standards 42% 1% That the products and packaging are designed by Croatian designers 9% 5% That they are Croatian autochthonous products, resulting from Croatian tradition, research and technological innovation, and that their quality characteristics meet high international standards 14% 66% Other (specify) 0% 0% I don’t know 25% 15%
Tourists mentioned numerous sources of information about labels: the role of the media is
predominant (42%), followed by friends and colleagues (26%) and promotional sales (24%). The
media seem to be a particularly important source of information for non-EU tourists, while for
Italian and other EU tourists, promotions and/or friends are particularly important.
When asked to qualify their level of information and knowledge about Croatian food labels,
64% of tourists said it was low (64%) or superficial (18%), while 18% felt it was high or quite
high. Among the latter there were only Italian and non-EU European citizens, while none of the
non-EU European tourists held this conviction.
0
10 20 30 40 50 60 70 80 90
100
Italian Other EU Other non-EU European
Other non-EU
NoYes

66
Although the number of tourists acquainted with the quality labels was quite high, far fewer
had purchased the products or intended to do so. Indeed, only 50% of those acquainted with the
two labels, or 25% of the whole sample, had purchased products or intended to do so. Their actual
number is probably lower, since tourists do not easily distinguish labelled from unlabelled
Croatian products, as demonstrated by the 10% who erroneous thought they had bought quality-
label products (e.g. “Sirko” cheese), and the 4% who said they had bought quality-label products
in open-air markets, where they are not in fact sold. In fact, even though the majority of tourists
said they had bought certified products because they guarantee quality (58%), a desire to taste
traditional local products was in second place (30%).
Table 34 – Tourists: purchases of labelled food products during their vacation in Croatia by nationality Nationality Yes I don’t know TotalItalian 34% 66% 100%Other EU 50% 50% 100%Other non-EU European 81% 19% 100%Other non-EU 38% 62% 100%
Tourists were also found to be particularly influenced by promotional sales, which seemed to
orient some 25% of tourist in an unknown market. This was especially true of EU citizens, while
non-EU citizens were more concerned about safety and security and price.
Diagram 19 – Tourists: main reasons for buying quality-label certified food products
*Relative frequencies, more than one answer provided by interviewees
Those who said they are influenced by quality labels and product origin when buying food
accounted for 45%, those not influenced were about 15%, and 25% said they were indifferent.
0 5 10 15 20 25 30 35 40
Quality Safety and security
Tradition
Help to Croatian economy Packaging
Promotions
Price
Other
I don't know

67
The tourists interviewed were more likely to consider the “Croatian quality” and “Croatian
creation” labels reliable than were Croatian consumers. As regards product safety, those who
strongly agreed (7%) were fewer than those who neither agreed nor disagreed (34%).
For 35% of tourists, the price of Croatian labelled products is too high, while 58% neither
agreed nor disagreed.
Even though tourists seemed to be strongly convinced that Croatian quality-label products
are better than conventional Croatian products, more than 55% were not certain that Croatian food
products were as good as those they purchase at home, especially EU tourists.
As regards the distribution and taste of Croatian quality-label products, the tourists expressed
extremely positive opinions (66% strongly believe that distribution of Croatian labelled products is
well organized and 73% strongly agreed that they have a good taste). Product packaging elicited
mostly negative opinions.
The main reasons that limited the purchase of more of these products are listed in Table 35.
Table 35 – Tourists: main reasons limiting the purchase of more quality-label products in Croatia Main reasons Percentages Price 11% Products without certificates are better 0 Products without certificates are safe 1% I don’t like the taste 0 They are difficult to find 4% Poor offer 37% Poor promotion and information 32% I don’t know where to buy them 15% *More than one answer provided by interviewees
Again, difficulties in finding the products and poor promotion and information were
mentioned as the main obstacles to greater purchases of products with specific characteristics.
Finally, tourists were asked to indicate some food products that they had purchased and
consumed and in which they had found some unique characteristics. It is interesting to note that
only one interviewee mentioned a Croatian PDO product, cheese from the island of Pag, although
some 10% of interviews where carried out on that island, and others took place in the production
areas of other Croatian PDO products. Tourists prevalently indicated Croatian spirits and products
of the Croatian food-processing industry, mainly milk derivatives (Dukat products) and delicacies
made with Mediterranean products, like olives, anchovy and figs (SMS Products).
The fact that no tourist recognized the Croatian PDO products is not surprising, given that
they bear no logos that distinguish them from other food products.

68
3.9. Consumer awareness of Croatian protected geographic indication products
3.9.1. Sample description The questionnaire on PDO, PGI and TCG food products was conceived as a short interview
to explore the level of information and knowledge of Croatian consumers about those products. A
sample of 125 Croatian consumers living in Zagreb and Split was surveyed. No selection criteria
were adopted except that the interviewee is the family member responsible for the food shopping.
The sample composition is shown in the following table.
Table 36 – Sample composition Gender 22% male, 78% female Age 53% between 25 and 45 years, 47 % between 46 and 65 years Job of interviewee
9% self-employed professionals, 59% office workers/teachers, 9% artisan/retailer, 9% housewife, 1% students, 13% other
Job of family head 30% self-employed professionals, 45% office workers, 13% artisan/retailer, 12% other Family composition 13% unmarried, 30% children < 10 yrs, 22% children > 10 yrs, 10% other adult family members Education 1% primary school/no school, 60% High school, 38% University degree, 1% master/Ph.D.
3.9.2. Results The answers to the question “Have you ever heard about Croatian PDO, PGI and TCG food
products?” show that almost half of those interviewed were acquainted with them39. Those who
answered in the affirmative were asked to mention some Croatian PDO and PGI products. The
results are shown in the following diagram.
39 Given the legislative complications and the lack of a logo distinguishing these products, it is surprising that 52% of interviewees said they were aware of Croatian PDO and PGI products. Once again the sample characteristics are important: all interviewees lived in large cities and had a secondary school (60%) or university (38%) education, suggesting that the sample may have been made up of better-than-average informed consumers.
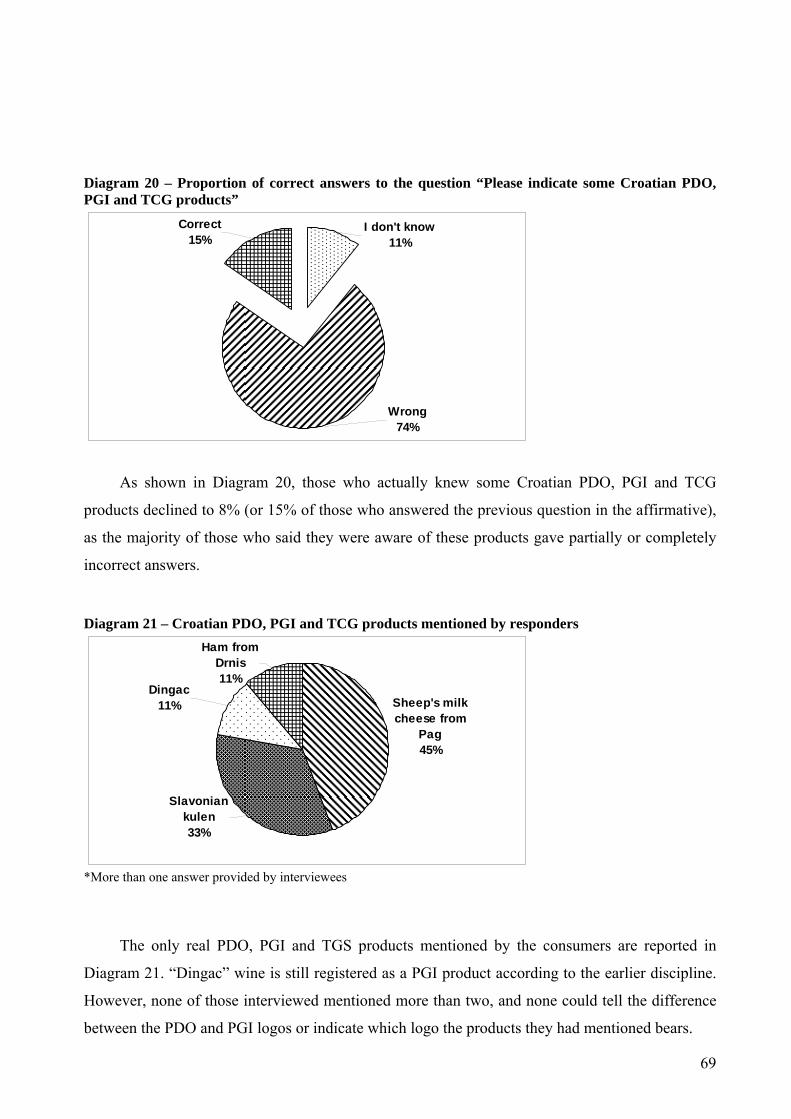
69
Diagram 20 – Proportion of correct answers to the question “Please indicate some Croatian PDO, PGI and TCG products”
Wrong74%
Correct15%
I don't know11%
As shown in Diagram 20, those who actually knew some Croatian PDO, PGI and TCG
products declined to 8% (or 15% of those who answered the previous question in the affirmative),
as the majority of those who said they were aware of these products gave partially or completely
incorrect answers.
Diagram 21 – Croatian PDO, PGI and TCG products mentioned by responders
Sheep's milk cheese from
Pag45%
Slavonian kulen33%
Dingac11%
Ham from Drnis11%
*More than one answer provided by interviewees
The only real PDO, PGI and TGS products mentioned by the consumers are reported in
Diagram 21. “Dingac” wine is still registered as a PGI product according to the earlier discipline.
However, none of those interviewed mentioned more than two, and none could tell the difference
between the PDO and PGI logos or indicate which logo the products they had mentioned bears.

70
The analysis of the wrong answers also provided interesting results, in that it showed that
many Croatian consumers confuse the PDO and PGI marks with controlled origin designations. In
fact, those who mentioned wines as PDO and/or PGI products were predominant. The second
group of wrong answers regarded the “Croatian quality” and “Croatian creation” logos, which are
granted to many food products by the Croatian Chamber of Commerce and were considered by
consumers as equivalent to the PDO and PGI labels.
Diagram 22 – Wrong answers to the question “Please mention some Croatian PDO, PGI and TCG products”
*More than one answer provided by interviewees
The third group of answers shows that Croatian consumers often confuse PDO, PGI and
TCG products with specific, typical local products. These data evidence both a great confusion
about terms such as autochthonous, typical, and original, and a scarce level of information about
the certification process that leads to the granting of special-quality labels. Some interviewees
confused PGI, PDO and TSG products with organic products, and others stated that the were
acquainted only with some foreign PDO and PGI products. Some answers contained both correct
and incorrect elements: among the former, sheep milk cheese from Pag, Slavonian kulen, wine
from Peljesac (Dingac) island and Istrian ham.
3.9.3. Concluding remarks A great confusion was seen to reign with reference to the meaning and import of the various
food quality labels. Among the several logos present on the market, the PDO, PGI and TSG labels
are not well known. The reasons lie both in legislative confusion and in the lack of logos that
would help distinguish visually Croatian PDO, PGI and TSG products. The confusion was
Wines 38%
Typical (local) products
21%
Croatian creation and
Croatian quality
25%
Eko (organic) products8%
No such products in
Croatia 8%

71
generated by the introduction by the Croatian Chamber of Commerce of the collective labels
“Croatian quality” and “Croatian creation”, which consumers frequently consider as equivalent to
the PDO, PGI and TSG labels. The certification process leading to label award is also little known,
as consumers confuse local, typical (but uncertified) food with PDO, PGI and TSG products.
Greater information also seems to be required for special-quality food than for organic products.
Label proliferation risks to cancel the advantages of organic products. Consumers should be
correctly informed about the meaning of each label, not all of which have the same importance and
provide the same guarantee. Secondly, the function of the certification process and logos should be
better explained to help consumers distinguish among the many different terms (e.g. organic,
green, authentic, original, typical food) that are often used haphazardly. The introduction of visible
logos on Croatian PGI products is of primary importance. Finally, organic, special-quality and
local products could be brought under a single logo guaranteeing all those qualities, providing a
greater added value to products and very high-quality food to consumers.
3.10. Interviews to distributors and producers
3.10.1. Sample description and results The companies that participated in the study and their main activities are listed below.
Table 37 – Companies and their main activities Name Main activities DM DrogerieMarket retail trade of cosmetics, drug-store and food articles Irokez distribucija import and distribution of organic products Biopartner d.o.o. import of organic fertilizers used in organic food production
Kalumela retail trade of cosmetics and food articles, specialized shops of "healthy food" and organic food, production of organic food, educational centre
Kerum retail trade of food, supermarket chain Candor d.o.o. import of inputs for organic agriculture, non-certified organic producer Bio Vega import, distribution and retail trade of organic products (Bio&Bio Shops) Zdravi bili retail trade of "healthy food" and organic food and cosmetics, macrobiotic restaurant EkoDalmacija cooperative of 12 producers of organic food
Eko -projekt Mavrović producer of organic food, - 300 ha, 206 organic, 94 in conversion (Eko Imanje) processing and educational and research centre (Eko projekt)
The study involved some important producers and distributors of organic food products and
other inputs for organic farming. No chain stores except “Kerum” agreed to participate. Even
though this fact may be considered as an indication of the relatively small importance of organic
food (and special-quality products) for these stores (which still prevalently sell conventional food
products), their contribution would have been important, especially to gain information on the
market potential of special-quality products.

72
The participating companies often carried out more than one activity, e.g. distribution and
production, processing, education and training or production and processing. The sample included
four “pure” traders - DM Drogerie Market, Kerum, Irokez distribucija and Biovega – the last two
dealing exclusively with organic products. EkoDalmacija and Ekocentar Mavrović are producers
but the latter is also the largest processor of organic food in Croatia and runs important educational
and training programmes. Biopartner and Candor are importers and distributors of non-food
organic articles and are entering organic food production. Kalumela and Zdravi Bili are
specialized shop chains also involved in education, food catering and, in the case of Kalumela,
processing.
No exporter participated due to of the absence of registered exports of organic food.
The variety of activities in which companies are involved permitted to collect and highlight
the needs and reasons of different interest groups.
The incidence of organic items in the total offer and/or sales of companies varies. For DM
Drogerie Market and Kerum it is low or very low (8% and 1% respectively), while in the case of
Zdravi bili and Kalumela, two specialized “healthy food” retailers that do not exclusively sell
organic food, it accounts for 90%. All the other companies deal exclusively in organic products.
Overall, the participating companies encompass food (fresh and processed), organic cosmetics and
cleaning products, inputs for organic farming and other organic products.
The company representatives were first asked to mention all the positive and negative
characteristics of organic food products. All stated that these products are healthier, safer and more
nutritional than conventional products, and that production processes do not have an adverse
impact on the environment. The majority said that organic food has no negative characteristics,
and a small number that price may be considered as its discouraging (not negative) characteristic.
The interviews helped highlight the main characteristics of the Croatian organic food market
and provided insights into the distribution chain. Supermarkets and hypermarkets were reported to
have a growing role, replacing small specialized stores. All the main supermarket chains operating
in Croatia, e.g. Konzum, Billa, and Kaufland, offer organic food.
It also emerged that an analysis of distribution channels must distinguish between fresh
(mainly fruit and vegetables) and processed products. Super and hypermarkets do not have a large
role, if any, in selling fresh produce, given its high price and the fact that selling conditions do not
allow to enhance product specificities. According to the producers interviewed, supermarkets also
apply high margins, making organic products non competitive with conventional products.
For fresh fruit and vegetables, sales at the farm, specialized stores and open-air markets,
where they exist (e.g. Zagreb, Bjelovar, Osijek and Vinkovci), are still the main selling places.

73
Producers complain of greater difficulties in supplying hotels and restaurants, highlighting
that in that segment the pre-eminent requisite of food product is price.
Instead, for processed organic food products – both Croatian and imported –supermarket
chains are the most important distributors. In this case, supermarkets and hypermarkets have
replaced and surpassed small, specialized stores in both the quantity of products offered and
prices. Still, most interviewees consider that small shops play an important role in the educational
process of consumers as they guarantee direct contacts and informal personal relationships.
All retailers interviewed offer both Croatian and imported organic food. However, the
proportion of imported organic food products in the total organic offer in Croatia is, without doubt,
predominant. Here, too, it is necessary to distinguish between fresh and processed food. The
presence of Croatian processed food products is very low and limited to only a few producers,
whereas fresh fruit and vegetables are all Croatian so that national producers are not pitted against
imported food.
Interviewees were asked to express their level of satisfaction with Croatian and imported
organic food products. The following tables demonstrate a preference for imported organic food.
Table 38 – Level of satisfaction of producers and distributors with Croatian organic food Level of satisfaction Relative frequencies
(%) Low 20 Neither low nor high 60 High 20
While the level of satisfaction regarding Croatian organic food is rarely high and prevalently
neutral, it is very high for imported products – mainly from Europe and Japan, but also from other
non-European countries.
Table 39 – Level of satisfaction of producers and distributors with imported organic food Level of satisfaction Relative frequencies
(%)
High 50 High – very high 33 Very high 17
To gain more detailed information, interviewees were asked to rate the different aspects of
the marketing mix which includes both Croatian and imported organic food products. Table 40.
shows once again the need to distinguish between fresh and processed food, because they present
different levels of quality. While there is wide disparity in the ratings given to the quality of
Croatian processed organic food, fresh fruit and vegetables obtained uniformly high ratings.

74
Table 40 – Ratings of the marketing mix of Croatian organic food products Quality Packaging Price Promotion Distribution
high low neither high nor low very low neither high nor low
high low low low low
neither high nor low low neither high nor low low neither high nor low
low low low low low
very high fresh, low processed low high fresh, low processed low low
very high fresh, neither high nor low processed low Low low low
According to interviewees, the only negative characteristic of Croatian fresh produce, is their
visual aspect which, contrary to their taste, does not always meet demand requirements. There is a
diffused conviction among Croatian producers that organic fruit and vegetables should present
poor visual characteristics that would guarantees their healthiness.
Particularly negative rating was given to the packaging and promotion of Croatian organic
food products. Packaging is not only considered unattractive but often does not guarantee the
maintenance of products. Prices and distribution of Croatian organic food were rated slightly
higher but still in the negative sign.
Table 41 – Ratings of the marketing mix of imported organic food products Quality Packaging Price Promotion Distribution high - very high high - very high low very low low very high high - very high low low low high - very high neither low nor high neither low nor high neither low nor high high very high high - very high neither low nor high neither low nor high neither low nor high very high high high neither low nor high neither low nor high neither low nor high
All aspects of imported products were, on average, rated higher. In this case, the evaluation
concerns exclusively processed food, since all fresh fruit and vegetables sold on the market are of
Croatian origin. Table 41 shows that rating given to promotion, distribution and prices of imported
organic products is quite low but still higher than for Croatian organic products.
Generally, the opinion of distributors was that given the equal quality of Croatian and
imported food products, prices and packaging of imported products are much better while
promotion and distribution still have to be significantly improved in both cases. The producers
agree with most of those considerations and believe that the quality of their products as at least the
same as the quality of imported ones.
The interviewees were then asked to indicate what they consider as the strong and weak
points of Croatian organic products. Obviously more weak points were indicated.
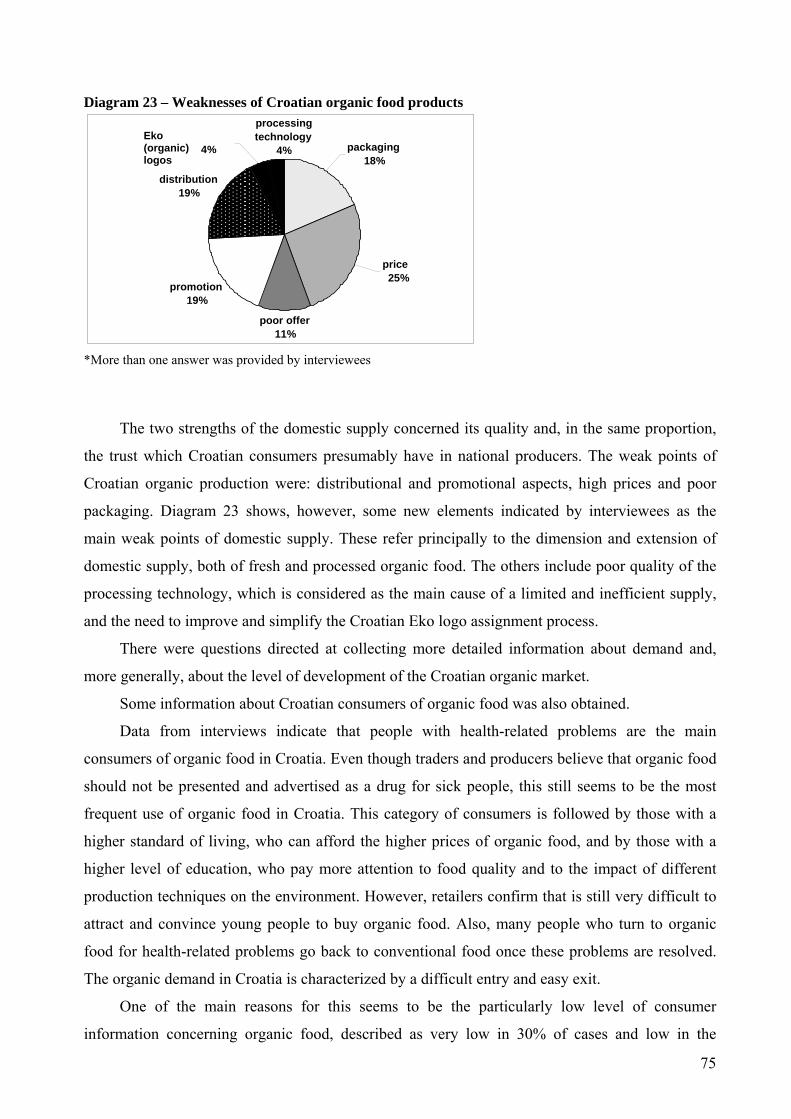
75
Diagram 23 – Weaknesses of Croatian organic food products
*More than one answer was provided by interviewees
The two strengths of the domestic supply concerned its quality and, in the same proportion,
the trust which Croatian consumers presumably have in national producers. The weak points of
Croatian organic production were: distributional and promotional aspects, high prices and poor
packaging. Diagram 23 shows, however, some new elements indicated by interviewees as the
main weak points of domestic supply. These refer principally to the dimension and extension of
domestic supply, both of fresh and processed organic food. The others include poor quality of the
processing technology, which is considered as the main cause of a limited and inefficient supply,
and the need to improve and simplify the Croatian Eko logo assignment process.
There were questions directed at collecting more detailed information about demand and,
more generally, about the level of development of the Croatian organic market.
Some information about Croatian consumers of organic food was also obtained.
Data from interviews indicate that people with health-related problems are the main
consumers of organic food in Croatia. Even though traders and producers believe that organic food
should not be presented and advertised as a drug for sick people, this still seems to be the most
frequent use of organic food in Croatia. This category of consumers is followed by those with a
higher standard of living, who can afford the higher prices of organic food, and by those with a
higher level of education, who pay more attention to food quality and to the impact of different
production techniques on the environment. However, retailers confirm that is still very difficult to
attract and convince young people to buy organic food. Also, many people who turn to organic
food for health-related problems go back to conventional food once these problems are resolved.
The organic demand in Croatia is characterized by a difficult entry and easy exit.
One of the main reasons for this seems to be the particularly low level of consumer
information concerning organic food, described as very low in 30% of cases and low in the
poor offer 11%
promotion 19%
distribution 19%
price25%
packaging18%
processing technology
4% Eko (organic) logos
4%

76
remaining 70%. In fact, all interviewees considered information and education of consumers as the
main step to be taken to support the development of the organic food market in Croatia.
An interesting aspect of Croatian demand is its structure. Interviewees were asked to indicate
which conventional products Croatian consumers would easily substitute with organic food and
which products they would be reluctant to substitute. While no particular reluctance is registered,
some interesting results were found concerning the structure of demand.
Diagram 24 – Demand for organic products in Croatia
Sweets28%
Snacks27%
Pasta18%
Cereals18%
Bread9%
*More than one answer was provided by interviewees
In Diagram 24 we see that the main organic food products bought by Croatian consumers are
sweets and snacks. Those products have the best sales on the Croatian market and are followed by
pasta, cereals and bread, while fresh fruit and vegetables or meat were not indicated by
interviewees. On the contrary, difficulties were mentioned in some cases in the placement of fresh
organic products. This is mainly due to the trust Croatian consumers place in the fresh fruit and
vegetables sold in open-air markets. Regarding fresh fruit, vegetables and meat, preferential
distributional channels are still direct sale at farms, while the other channels are marginal.
The consistent demand for organic snacks and sweets can be explained by the fact that
Croatian consumers often cannot afford a complete organic menu and try to improve their diet at
least with these products. In other cases, people who would like to eat organic food often
encounter reluctance by their families, who do not wish to replace their usual meals with these
products so they buy organic snacks only to eat away from home. Some people state that cooking
organic food takes too long.
Considering this, the interviewees were asked to evaluate the level of development of the
market of organic food in Croatia. Some differences emerged between urban and rural areas. Even
though the organic market in Croatia still has to be improved and developed in both areas, more

77
than 60% of interviewees believe that the organic market is already growing in the cities (less than
40% believe it is still in early stages of development) while, according to more than 90% of
responders, the organic market in rural areas is just beginning to develop. Even though
development of the market and demand for organic food in Croatia is still circumscribed to urban
areas, it was found that there are substantial differences among the different cities. The largest
concentration of specialized shops is in Zagreb, followed by Split, Čakovec and Rijeka, while
stagnation seems to characterize the area of Slavonia, where a large part of the Croatian organic
food production takes place. On the other hand, stalls selling fresh organic food are not present at
all in Dalmatia, but exclusively in cities close to their place of production (Zagreb, Osijek,
Bjelovar, Vinkovci).
Interviewees believe that the quality of food is an important issue to Croatian consumers and
therefore the long-term prospects for organic market development in Croatia are very favourable.
The main current obstacles limiting a more rapid development of the organic market were
also identified. As shown in Diagram 25, producers and distributors believe that the greatest
limitations are high prices and a low level of information to consumers.
Diagram 25 – Main obstacles to the faster development of the organic market in Croatia
*Relative frequencies
Interviewees stated that the current standard of life of most Croatian consumers does not
permit them to purchase organic food products. At the same time, producers and distributors
believe that consumers are badly and insufficiently informed about the characteristics of organic
food. Since is unlikely that in the near future prices will fall significantly, consumer information
and education are considered as the main action for supporting the development of organic food in
Croatia. In this context, promotion should also play an important role.
0 20 40 60 80 100
Price Offer
Quality Promotion
Level information Packaging
very important important neutral
not important

78
A greater and wider offer would certainly stimulate consumers, who would have the
possibility of substituting a higher number of conventional products with organic food articles.
Packaging should also be improved, while quality is felt to be reasonably satisfactory.
Finally, the interviewees were asked to indicate what they consider to be the main elements
of an initiative aimed at stimulating the development of the organic food market in Croatia as well
as the priorities Croatian organic food producers should make to improve the quality of organic
food offer. Regarding the first question, results in the table below show once again how education,
both of farmers (producers) and consumers should represent the first step in the development of
the Croatian organic food market.
Table 42 - Main actions which could help to stimulate the organic market in Croatia
Action Relative
frequencies Education of farmers and consumers 44% Coordinated action concerning marketing of organic food which should involve all actors of the organic food chain; producers, distributors, consumers, ministries, educational centres and other subjects dealing with organic products 19% Price control of organic food products 12.5% Creation of associations and cooperatives of producers 12.5% Increase the quantity and quality of supply 6% Devising and adoption of specific and adequate supports and incentives for all actors (all segments) of the organic chain 6%
Those interviewed also highlighted poor collaboration between producers and the other
figures of the organic chain, while development of the organic food market could only be
guaranteed by a coordinated action. Coordination could be particularly important in improving the
offer, thus guaranteeing a reduction of production and processing costs, a concentration of the
supply and therefore a consequent reduction of prices, higher negotiating power on the market and
improvement of marketing strategies. Some interviewees believe that prices of organic food
should not be more than 20-30% higher than those of conventional food products, so these prices
should decrease in order to meet demand potentials and requirements.
The Government should support all those actions, which are in the hands of producers and
distributors, and should participate in some of the phases, stimulating both demand and supply.
Information and education of consumers could increase the demand, while supply could be
stimulated through the identification and adoption of specific and appropriate incentives and
support meeting the specific needs of all actors of the organic chain.
Improvement of the Croatian organic supply presupposes, as seen in the following table, an
improvement of both the quantity and structure of supply, and its quality. There is a need for more
processed Croatian organic products not only to satisfy consumer demand but also to guarantee

79
better revenues to producers. Considering the high costs and large quantities imposed by the
processing industry, small producers should form associations and cooperatives for a better
production and marketing of organic food products.
Table 43 – Main actions to improve Croatian organic supply Action Relative frequencies (%) Increase the offer 21 Improve the quality of the offer 12.5 Processing 12.5 Creation of producer associations and cooperatives 12.5 Improve the certification process 8 Marketing actions to expand market 12.5 Improve all aspects of marketing mix 12.5 Stabilize the offer 4 Analyses of demand 4
Interviewees believe that all aspects of the marketing mix should be improved and highlight
the necessity of improving and simplifying the certification process and assignment of the Eko
logo. A need for closer collaboration with research institutes was also pointed out. These
stakeholders and their services could play a particularly important role in devising strategies for
organic production, while the potential demand as well as the nature of the actual demand for
organic food products should be examined in detail for a fuller understanding of the issue.
4. PROPOSALS FOR A STRATEGY FOR CROATIAN ORGANIC, PDO, PGI
AND TSG PRODUCTS
4.1. Introduction
Achieving what can be considered as one of the main objectives of Croatian agriculture
policy - the improvement of quality of the agricultural offer and a better placement of high-quality
food products both on national and international markets – requires an efficient marketing
strategy. This can be successful only if the present situation is exhaustively analysed to obtain a
clear picture of both the obstacles and opportunities for a development of this sector, an essential
factor in identifying priority actions within the general marketing strategy. An efficient marketing
process has first of all to identify clients’ needs and only then can it offer of products and/or
services which will satisfy these needs in the present, and anticipate the evolution of future ones
(Peter, Donnelly, 1999).

80
The literature search and fieldwork included in the present study highlight different aspects,
which have to be considered when devising a strategy for developing organic agriculture and other
high-quality productions. The desk studies identified qualitative and quantitative characteristics of
Croatian agriculture with particular attention to the high-quality food supply. An overview of the
legislation governing organic agriculture and protection of the Geographical Indications and
Denominations of Origin has also been made. These results were integrated with the ones from the
fieldwork, thereby shedding light on those aspects which official statistics do not reveal - habits of
consumers concerning the purchase of food products, their level of knowledge and information
concerning organic farming, Croatian PDO, PGI and TSG products and other food labels, trust in
food labels and an estimate of demand for Croatian organic food; all aspects of crucial importance
for devising a marketing strategy for organic and high-quality food productions. Other
characteristics of the competitive, economic, social and political environment were identified by
interviewing the key stakeholders of the organic sector: producers, importers, distributors,
marketers and administrators.
4.2. Proposals for a strategy for Croatian organic and PDO, PGI and TSG products
4.2.1. Organic market Elements necessary to describe the current situation of marketing of organic farming
products in Croatia were mainly gathered by interviewing consumers – Croatians and tourists –
and other relevant stakeholders (producers, distributors, policy makers etc.). The main
characteristics of both domestic and tourist demand are briefly reviewed here. Regarding the
supply of organic food in Croatia, the current situation is presented by describing the strengths and
weaknesses of different aspects of the marketing mix. Possible future actions are outlined by
analysing opportunities and dangers, and some proposals for improving the present situation are
advanced.
4.2.2. Demand for organic food in Croatia In order to expand organic production, both the actual and potential demand on national and
foreign markets first has to be considered. It is in fact necessary to understand the qualitative and
quantitative characteristics of the demand and then devise a strategy to meet consumer
requirements.
It was extremely difficult to accurately analyse the demand for Croatian organic products, as
the offer is either represented by imports such as processed food products, or by Croatian products,
81
like fresh fruit and vegetables, which are poorly distributed on the national market. Croatian
consumers generally show a very high interest in food quality. However, other elements, such as
price, also influence purchase. The fears of Croatian consumers mainly regard the healthiness and
safety of food products and these fears are only marginally allayed when purchasing organic or
other quality-label products.
Our interviewees expressed an extremely strong interest in Croatian quality products. They
seem to believe that these products are better than imported ones mainly because in the past the
Croatian market was filled by low-quality imported products.
Even though a surprisingly large number of Croatian consumers were acquainted with
organic food, they were not well informed about food definitions and were unable to distinguish
between terms such as “healthy”, “green”, “domestic” and “organic”. A low level of acquaintance
with the certification process and mistrust in certificates was also revealed.
The main reasons which limit the demand for organic food products are lack of information
about the characteristics of organic products, about labels and about ways to recognize organic
products. Demand is also limited by the standard of living, which does not permit most Croatian
consumers to purchase organic food products. Many consumers of organic foods only purchase
meals to eat away from home, so that the organic food articles most frequently sold in Croatia are
snacks and sweets.
We found that not many tourists buy organic food in Croatia. Consumption of organic food
during holidays is low, especially when compared to tourists’ consumption of organic food at
home. However, tourist demand and its potential could be better estimated by analysing
consumption in restaurants and hotels.
Information about organic farming is as superficial among tourists as it is among the
Croatian consumers. Furthermore, tourists should be informed about Croatian labels and
compliance with international standards of Croatian organic food. Promotion and distribution
should, in this case, have a particular importance, since tourists are usually eager to taste
autochthonous products and local specialties, and are generally very interested in the quality of
food products which are difficult to find.
Tourists seemed satisfied with the quality of Croatian food products and a significant number
of them also expressed a desire to purchase them at home. Italian tourists and citizens of former
Yugoslav countries are important consumers of Croatian food products as they are usually well
informed about the supply and certification of Croatian food. This information should certainly be
kept well in mind when identifying the main export markets for Croatian organic foods.

82
4.2.3. Supply of organic food in Croatia At present, organic farming production in Croatia accounts for a marginal share of the
general agricultural production. The offer of Croatian organic food is represented by low
quantities and a narrow range of products, and this is particularly true regarding processed food.
Most processed products are imported and very few domestic producers are present on the shelves
of Croatian stores. On the contrary, the supply of fresh fruit and vegetables is exclusively national,
but only distributed in markets close to the production areas. Great differences in quality were
registered between fresh and processed food products; Croatian processed products were
considered worse than imported ones, while fresh fruit and vegetables were considered of
exceptional quality. The prices of Croatian organic food are rather high when compared to
Croatian conventional food products and to imported organic products. Besides price, the other
factors which hamper development of the organic market in Croatia are distribution and
promotion.
Here below we consider the main strengths and weaknesses, as well as opportunities and
threats for the Croatian organic supply and propose some priority and strategic actions.
Strenghts Elements which are external to the supply, but can be considered as strenghts of Croatian
organic production regard, principally, the characteristics of natural resources - extensive
uncultivated and pasture land, large protected areas (10% of land), great biodiversity, and the
existence of numerous autochthonous plant and breeds. It also has to be mentioned that since 2001
a legislative framework exists which, although with some difficulties, governs all aspects of
organic production and agricultural and food products in Croatia. Since 2002, a special logo, the
Eko logo, distinguishes Croatian certified organic products from the remaining agri–food products.
As to the support policy, higher subsidies have been established for organic rather than
conventional productions.
The strenghts of Croatian organic supply concern, in the first place, the high quality of fresh
fruit and vegetables, particularly appreciated by Croatian distributors and consumers. The
composition of the organic supply indicates that some interesting and traditional productions,
which could guarantee competitive advantages on foreign markets, have already been introduced
(organic fish breeding, vineyards, herbal plants etc.).
Another important strong point concerns the intellectual capital involved in organic farming,
which has attracted a high number of young and educated people from urban areas.

83
Organic products have already entered Croatian supermarkets and are no longer offered
exclusively in specialized stores. Eko stands selling fresh fruit and vegetables in open markets are
already operative in five Croatian cities.
Weaknesses The expansion of organic food production is greatly limited by the low level of information
among the public about organic farming. Prejudices still exist about organic food and an important
share of consumers still believe that organic products are only for the rich and sick.
Political and legislative impediments also directly influence the expansion potential of
Croatian organic supply40. Among these, the fact that Croatian legislation is not completely
harmonized with EU legislation prejudices the entrance of Croatian organic products on EU
markets. One particular weakness concerns the control and certification process in Croatia, which
needs to give more authority to control and certification bodies. Credibility of the Croatian Eko
logo must be increased both among national and foreign distributors and consumers.
The competitive environment is characterized by high imports of organic food judged as
better and cheaper and by the entrance of foreign supermarket chains on the national market which
favour their domestic products on the shelves.
One of the important weaknesses of the Croatian organic supply is the need to train
producers in all aspects of marketing and in specific topics concerning organic production.
Organic farming in Croatia lacks almost all the necessary inputs (from seeds to protected
products). There are also very few people specialized in organic primary products both up and
downstream.
The composition of the Croatian organic supply shows that scarce importance has been given
to promoting those cultures that could permit the differentiation of Croatian organic offer from
that of other European countries. The Croatian organic offer concentrates in fact on “standard”
agricultural products (apples, soybean, cereals, chicken etc.) and considering that prices of
Croatian organic products are even higher than those of their foreign competitors, it is possible to
state that they are non competitive both on the domestic and foreign markets.
40 Obstacles to development of organic agriculture in Croatia originate also from policy and administrative weaknesses.Producers complain that no specific and differentiated support schemes and subsidies have been granted for organic agriculture, while this kind of farming should at least be supported with reference to specific initial costs and rewarded for their contribution to environmental quality. More efficiency, and reduction of administrative times are also requested with reference to all aspects; from enrolment in registers of producers in organic production, to certification process and assignation of the Eko logo.
84
The quantity of domestic production is low and this is particularly true regarding the very
few domestic processed products. The quantities produced and transformed are not sufficient to
meet domestic demand and certainly do not reach the necessary critical mass with which to enter
foreign markets. The limited quantity of organic productions is also an obstacle for organic
producers to enter schools, hospitals and restaurants, since these consumers require a consistent,
continuous and uniform supply. The quality of processed products is low and they cannot
qualitatively compete with imported products, while fresh fruit and vegetables are not usually
competitive due to their poor appearance
Promotion of organic food products is characterized by isolated initiatives, mostly
independent from producers, and the organic offer in Croatian supermarkets and specialized stores
still leaves consumers’ bags empty. Fresh fruit and vegetables are only distributed close to the area
of production (the north-east) and are not sold in large parts of the Country (in particular, coastal
areas).
Another important weakness of Croatian organic production is the absence of collaboration
among producers, which would be the easiest and quickest way to increase the quality and
quantity characteristics of the offer, and to integrate more phases of the supply chain within the
farms themselves.
Opportunities Some opportunities exist for the expansion of organic production in Croatia which are
external to the sector. The most important concerns the general and global increase of demand for
organic food, partially due to an increased awareness of environmental pollution and of the
concept of sustainable development. Another is related to the seasonal tourist market. Other
opportunities arise from the characteristics of natural resources, which leave great space for an
increase and qualitative improvement of the domestic organic supply.
Opportunities to be exploited include the possibility of unifying organic production and
numerous typical, autochthonous local productions. The idea is to create high-quality products
guaranteeing freshness, typicality, and adoption of good agricultural practices. This would make it
possible to turn to a higher share of consumers; both those interested in purchasing organic and
safe food, and those interested in purchasing national products. It would also help to place
domestic offer on foreign markets. In fact, the diversification of the Croatian offer is one of the
main prerogatives for entrance on foreign markets.
The freshness of locally produced fresh fruit and vegetables, if opportunely presented and
guaranteed, could ensure higher recompenses for producers. Cooperation and collaboration among

85
producers, processors and distributors is maybe the biggest opportunity for Croatian organic
supply. This cooperation could be facilitated by the current concentration of producers in limited
areas and could enhance their interaction with other figures of the agri-food sector (input
producers, industries, etc). Cooperation would guarantee a concentration of the offer, investments
and improvement of all phases of the organic supply chain and of all aspects of the marketing mix
of Croatian organic food. It is also an opportunity for producers looking for new outlets – foreign
markets, schools, hospitals, restaurants, hotels etc. – as this way the necessary critical mass of
production would probably be reached.
Other important opportunities for Croatian organic food regard development of eco and food
tourism.
Risks and threats The main external risk for Croatian organic farming concerns the negative effects of
globalization which, as for other sectors, increases competition and makes it daily more difficult
for producers to be competitive both on local and foreign markets.
The structure of Croatian offer has to be differentiated and innovated, otherwise this will
seriously prejudice its opportunity of finding an outlet in foreign markets. If domestic producers
do not realize the need to develop typical, local, autochthonous organic productions, their products
will have great difficulty in entering these markets, especially considering the high prices.
The badly regulated distribution process poses a great threat for domestic organic
production, as it still allows the entrance of low-quality (and low-price) foreign products, which
compete with national products on the same shelves. Considering both the importance of price for
Croatian consumers and their low standard of living, competition from foreign products is a
particular threat for national producers.
Another great risk is that subsidies may encourage not only the expansion of productions,
which do not meet consumer requirements but also primary production without considering the
other segments of the supply chain. There is also a risk that producers would look to their own
personal interests and annul the benefits that cooperation could bring. It is difficult to believe, in
fact, that without cooperation and pooling of the offer, the critical mass of the offer necessary to
approach new outlets will be reached, At the same time, cooperation could enhance greater
integration within the supply chain as well as more resources for the various aspects of marketing.

86
4.2.4. Overall marketing strategies An efficient marketing strategy needs to focus on all the aspects mentioned above. Clearly,
selling organic products is a precondition for the survival of organic producers; product strategies
thus deserve special attention.
Market penetration strategies, directed at raising sales among habitual clients, could be
carried out in different ways. Particular importance should be given to more consistent
investments in advertising highlighting the quality characteristics of organic food products while
special offers and other types of promotions regularly used for conventional food articles should
also be introduced for organic food.
It is absolutely necessary to improve the process of infiltration of organic food articles –
fresh fruit and vegetables included - in “regular” supermarkets and in open markets where food is
mainly purchased.
Better and more attractive packaging is an explicit request from consumers.
Diversification of the offer and introduction of innovative products (product development)
incorporating more services – semi-prepared meals, products certified both as typical and organic
or local and organic - should all guarantee that in a relatively short space of time, consumers bags
can be filled by a large amount of organic food. The creation of typical Croatian organic products
and the introduction of traditional and authentic productions is necessary if domestic production is
to beat foreign competition.
Considering the improvement of both promotional and distributional aspects, the creation of
collective “Croatian organic food” brands should be encouraged as it would pool the national offer
and make it more recognizable.
The identification of methods and strategies which will allow price reduction is of primary
importance and, once again, pooling among producers seems to be critical for achieving this result.
Strategies of market development, aimed at providing new outlets for Croatian organic
producers, have to address the needs of different groups of potential clients; tourists (seasonal
tourist market), schools, restaurants, hotels and, finally, foreign markets. Investments in
advertising should be particularly consistent in this case, in order to induce these new categories of
consumers to convert to organic food. Tourists should be better informed about Croatian high-
quality certificates through promotional material, during news programmes in their language and,
regarding tourist consumption, demand should be stimulated by the offer of organic meals in
hotels and restaurants.
The introduction of organic food in schools and hospitals could also be stimulated by public
procurement and by promotional activities such as informative brochures and advertising.
87
It seems evident, once again, that the main action of producers should consist in establishing
an efficient production network. If new outlets are to be achieved, then both the quantity and
quality of the offer have to be increased and only collaboration among producers and their
association can enable them to increase and differentiate the supply, with particular attention to
processed products. A collective approach could also ensure better availability of financial
resources, which are necessary to improve all aspects of the marketing mix especially if new, big
and competitive outlets are to be reached.
Recognizable collective marks are especially important for the tourist industry and foreign
market, while for restaurants, hotels, hospitals and other institutions, distributional aspects (such as
guarantees concerning continuity and reduction of transport expenses) have primary importance.
4.2.5. Special quality (PDO, PGI and TSG) products Devising a strategy for the development of Croatian special quality (PDO, PGI and TSG)
products requires, first of all, a clear and well-defined legal framework.
With the adoption of the Food Act, in 2003, all responsibility for the protection of
indications of origin and geographic indications passed from the State intellectual property office
to the Ministry of Agriculture, Forestry and Water Management, but the absence of ordinances and
rules, which should have followed the Act, makes it still inoperative.
Currently, only seven Croatian food products have a Protected Geographic Indication. The
offer of PDO, PGI and TSG products in Croatia is very low and unstable and the quality of
productions, due to handcraft production techniques, is inconsistent. No visible logos are used to
distinguish these products from uncertified ones, and it is almost impossible to find them in
supermarkets.
The level of knowledge of Croatian consumers about Croatian PDO products is extremely
low and great confusion reigns regarding the meaning of the terms “autochthonous”, “typical” and
“local”. Consumers were particularly confused when the Croatian Chamber of Commerce
introduced the “Croatian quality” and “Croatian creation” marks. In fact, consumers frequently
equate those logos with the PGI, PDO and TSG marks.
The weakness of the Croatian offer of special-quality products is epitomized by low offer,
especially concerning the number and quantities of certified products, which mainly cover the
demand of areas close to the production site. The absence of clearly visible logos on such products
makes it difficult to know about their existence and allows numerous products with similar names
to replace them in supermarkets. Promotion of these products is almost non-existent.

88
Once the whole legislative framework is in place, there is certainly a high potential for the
development of this sector of agricultural production. Particularly regarding the domestic demand,
the analyses carried out have shown that Croatian consumers are greatly concerned about the
domestic origin of raw materials and wish to have guarantees about food origin and quality.
Cooperation among producers will, once again, assume crucial importance in this respect and
the absence of their collaboration is one of the main risks, which could hamper the creation and
supply of a sufficient quantity and quality of these products.

89
REFERENCES
Barbarito L.. (1999). L’analisi di settore. Mateodologia e applicazioni. Franco Angeli. Milano;
BIOPA. Planovi proizvodnje godspodarstava pod nadzorom BIOPA-e za 2003 i 2004 godinu.
Osijek;
Bozac R. (2001). završno izvješće projekta "Istarski pršut u funkciji oživljavanja gospodarstva i
konkurentnosti na tržištu Europske Unije". Rijeka 2003;
Brasini S.. Tassinari F. Tassinari G.. (1999). Marketing e pubblicita’: Metodi di analisi statistica. il
Mulino. Bologna;
Drzavni institut za intelektualno vlasnistvo (2004). Popis proizvoda zasticenog zemoljopisnog
porijekla. Zagreb;
Dukic S.. (11.08.2004). Pioniri ekoloske poljoprivrede u Hrvatskoj in “Slobodna Dalmacija”.
prilog “Vrt”. Split;
Ekoliburnija (2001). Istraživanje opće informiranosti potrošača o ekološki uzgojenoj hrani u
Republici Hrvatskoj. Ekoliburnija. Rijeka;
Hrvatska Gospodarska Komora (2003). Izvjesce o nacionalnoj akciji “Kupujmo Hrvatsko”.
Zagreb;
Hrvatska Gospodarska Komora (2004). Hrvatska poljoprivreda. HGK Sektor za poljoprivredu.
prehrambenu industriju i sumarstvo. Zagreb;
Hrvatska Gospodarska Komora (2004). Industrija hrane. pica i duhana. HGK Sektor za
poljoprivredu. prehrambenu industriju i sumarstvo. Zagreb;
Hrvatsko Agroekonomsko drustvo (2003). Zakljucci s okruglog stola “Ekoloska poljoprivreda i
plasman eko proizvoda”. in zagreb 29.05.2003;
Kisic I.. (2004) Ekoloska poljoprivreda – Stanje i perspektive u Republici Hrvatskoj. XXXIX
Znanstveni skup hrvatskih agronoma. Zagreb;
Krstulovic I.. (08.09.2004). Sigurna hrana I zdrav okolis in “Slobodna dalmacija”. prilog “vrt”.
Split;
Ministarstvo Poljoprivrede i Sumarsta Republike Hrvatske (2000). Proizvodno-potrosne bilance
poljoprivrednih proizvoda u Hrvatskoj. Zagreb;

90
Ministarstvo Poljoprivrede i Sumarsta Republike Hrvatske (2003). Godisnje izvjesce o stanju
poljoprivrede u 2002. godini; zeleno izvjesce. Zagreb;
Ministarstvo Poljoprivrede i Sumarsta Republike Hrvatske (2003). Nacionalni program za poljoprivredu i seoska podrucja. Zagreb; Ministarstvo Poljoprivrede. Sumarsta i Vodnog gospodarstva Republike Hrvatske. (2004). 2004
Vodic kroz reformu. Zagreb;
Ministarstvo Poljoprivrede. Sumarsta i Vodnog gospodarstva Republike Hrvatske. (28th October
2004).Workshop on national strategy on organic agriculture in Croatia. result. draft version.
Zagreb;
Ministartvo Poljoprivrede i Sumarstva Republike Hrvatske. (2002) Hrvatska u 21. stoljecu.
Strategija razvitka republike Hrvatske. Poljoprivreda i ribarstvo. Ministarstvo poljoprivrede i
sumarstva. Zagreb;
Scialabba N.. Hattam C. (ed) (2002). organic agriculture environment and food security. FAO.
Rome;
Scialabba N.. Williamson D. (ed) (2004). The scope of organic agriculture. sustainable forest
management and ecoforestry in protected area management. FAO. Rome;
Zammuner V. L.. (1998). Tecniche dell’intervista e del questionario. il Mulino. Bologna;
Statistics
Hrvatski zavid za statistiku. (2004). Popis poljoprivrede 2003. Zagreb;
Hrvatski Zavod za Statistiku. (2003). Statistički ljetopisi Hrvatske 2003. Zagreb;
Ministarstvo poloprivrede. Sumarstva i vodnog gospodarstva Republike Hrvatske. TISUP Podaci
& analize ekologija izvješca.htm (on line)
Ministarstvo poloprivrede. Sumarstva Republike Hrvatske (2003). Upisnik proizvođača u
ekoloskoj proizvodnji poljoprivrednih i prehrambenih proizvoda. Zagreb;
Ministarstvo poloprivrede. Sumarstva Republike Hrvatske (2003). Upisnik proizvođača u
ekoloskoj proizvodnji poljoprivrednih i prehrambenih proizvoda – nosioci eko znaka.
Zagreb;
Ministarstvo poloprivrede. Sumarstva Republike Hrvatske (2003). Upisnik uvoznika eko-
proizvoda. Zagreb;
91
Ministarstvo turizma Republike Hrvatske (2001). Hrvatski turizam u brojkama. Zagreb;
Articles and information consulted on Web pages:
„Definicije u prehrani”. http://hrana.com/nutrizg/definici.htm
„Eko-hrana:trend ili nužnost?”.
http://www.coolinarka.com/zdravlje/trendovi_u_prehrani/eko_hrana_trend_ili_nužnost;
„Od kulena ću napraviti hrvatsku Coca – Colu”.
http://www.htnet.hr/gospodarstvo/poslovnivodic/page/2004/06/30/0129006.html;
„Šljiva (Prunus domestica)”. http://hem.passegen.se/budrovci/sljiva.htm?k;
„Zdrava hrana”. http://www.zdravibili.com/zdrhrana/uvodzdrhrana.asp?IDO=2
AICEC - http://www.aicec.an.camcom.it/
BIOVega – http://www.biovega.hr
Domazet N.. (20/09/2003). Sir. maslinovo ulje i vina – hrvatski „originali”. in Novi List. Rijeka;
http://www.novilist.hr/default.asp?WCI=Rubrike&WCU
Drniski prsut - http://www.prsut.info/
EURO IFO KOMUNIKACIJSKI CENTAR ZAGREB
http://eicc.biznet.hr/EU_vijesti/EU_vijesti_3/vijest02.htm
HIDRA - http://www.hidra.hr
Http://www.\Medimurske novine (371) - 16_10_2002.htm
http://www.europa.eu.int/scadplus/leg/en/lvb/121090.htm. Labeling. presentation and advertising
of foodstuffs;
http://www.europa.eu.int/scadplus/leg/en/lvb/121096.htm; Certificates of specific character;
http://www.europa.eu.int/scadplus/leg/en/lvb/121097.htm; Protected geographic indications and
designations of origin;
http://www.europa.eu.int/scadplus/leg/it/lvb/12118.htm. Produzione biologica dei prodotti agricoli
e delle deratte alimentari;
HZPSS – http://www.hzpss.hr
ICE CROAZIA. http://www.ice.gov.it/estero2/zagabria/
92
Imenik poljoprivrede - http://www.janus.hr
La evoluzione dei comportamenti di acquisto.
http://www.unipr.it/arpa/dipseq/Corsi/marketing_Prodotti_Agroalimentare.htm;
Paski sir - http://www.sirena.hr/
Petkovič M. (29/03/2002). Zakon o hrani: proizvođači ne smiju varati potrošače. in Vjesnik.
Hrvatski političi dnevnik. Zagreb; http://www.vjesnik.com/html/2002/03/29;
Popis noisioca znaka „Hrvatska kvaliteta”. http://www.hgk.hr/komora/hrv/croq/n_kvali.htm;
Popis nosioca znaka „Izvorno hrvatsko”. http://www.hgk.hr/komora/hrv/croq/n_izvor.htm;
Vjesnik (09/10/2000). Slavonski kulen. šljivovica i paški sir jedini s oznakom zemljopisnog
podrijetla. Zagreb; http://www.vjesnik.com/html/2000/10/09/
ZAGREB FAIRTRADE - http://www.zv.hr/press/display_hr.cfm?pi=2004-03-07x05_hr.html

93
APPENDIX 1
Table A.1 - List of Croatian Organic Producers (last updated: 17/03/2004)
IVKA SEVER Zagreb “BUTIĆ” Zagrebačka Proizvodnja, trgovina i usluge d,o,o, RATKO SUMAN Vukovarsko-srijemska TOMO JEŽOVITA Osječko-baranjska DAVORIN JAKOVINA Požeško-slavonska ŽELJKO TRALIĆ Vukovarsko-srijemska GORAN GUSAK Osječko-baranjska PPK “VALPOVO” d,d, Valpovo Osječko-baranjska Poljoprivreda d,o,o, PC Brođanci MEDVED DRAGICA Međimurska OREHOVEC BERNARDA Međimurska KRAJAČIĆ IVAN Varaždinska VRESK FRANJO Međimurska SABOL JOSIP Međimurska PANIĆ NADA Međimurska POSEL VLADO Međimurska ŠPIRANEC BRANKO Koprivničko-križevačka “EKO IMANJE MAVROVIĆ” d,o,o, Požeško-slavonska za poljoprivrednu djelatnost “IVAN & LUKA”, Brodsko-posavska obrt za poljoprivrednu proizvodnju FRANJO PUKLIN Krapinsko-zagorska MILAN PASTUOVIĆ Bjelovarsko-bilogorska LOVRO KRNIĆ Karlovačka BRANKO KOKIĆ Osječko-baranjska ”ŠMIT” UZGOJ KOZA, vlasnik NIKOLA LONČAR Ličko-senjska STJEPAN GUMBAS Osječko-baranjska FRANJO LEHKI Osječko-baranjska DAMIR ROSIPAL Požeško-slavonska IVAN PELIN Osječko-baranjska IVAN BRBATOVIĆ Osječko-baranjska MONIKA MIJAKOVIĆ Vukovarsko-srijemska POLJOPRIVREDNO-TURISTIČKOG OBRTA “BIOPHARM”, vlasnika Željka Krpan NADA IVANIĆ Varaždinska DRAGUTIN VOLARIĆ Zagrebačka BRANKO ČEGEC Zagrebačka MARICA MARJANOVIĆ Virovitičko-podravska JOZO TOLMAČEVIĆ Osječko-baranjska BOŽIDAR SRŠIĆ Osječko-baranjska MATO ORKIĆ Vukovarsko-srijemska ANTUN TRBUK Vukovarsko-srijemska ŽELJKO PRVČIĆ Koprivničko-križevačka ZLATA NANIĆ Zagreb MARIJAN MESIĆ Zagrebačka ŽELJKO KAMENSKI Bjelovarsko-bilogorska Poljoprivredni institut Osijek Osječko-baranjska ROZALIJA BAŠIĆ Brodsko-posavska KUM–RIS - AGENCIJA ZA RAČUNOVODSTVENE USLUGE DRAGAN KUMRIĆ Osječko-baranjska JADRANKA DESANČIĆ Sisačko-moslavačka

94
MARICA JUG Osječko-baranjska "ADNOVAS" Obrt za proizvodnju, uslugu Osječko-baranjska promidžbu i trgovinu - DANI VARGA STANISLAV TOBIJAS Osječko-baranjska ANTO IVIĆ Vukovarsko-srijemska “FARMER” proizvodnja zdrave Virovitičko-podravska hrane i ljekovitog bilja, Branko Janković VANJA TRGOVAC Bjelovarsko-bilogorska STJEPAN JAMBREŠIĆ Bjelovarsko-bilogorska MARIJA BAČANI Bjelovarsko-bilogorska IVAN ZORJA Bjelovarsko-bilogorska SLAVKO KADIĆ Bjelovarsko-bilogorska STJEPAN MATIJEVIĆ Bjelovarsko-bilogorska ANĐELA BRITVIĆ Bjelovarsko-bilogorska JOSIP PAVLEKOVIĆ Bjelovarsko-bilogorska ANKICA HERL Bjelovarsko-bilogorska MARIJA LABAŠ Zagrebačka JOSIP BREZICKI Zagrebačka Obrt "JAZBEC" vl, JOSIP JAZBEC Osječko-baranjska ANA KOPRIVČIĆ Osječko-baranjska ZVONIMIR VEZMAR Bjelovarsko-bilogorska DUŠANKA TURK Bjelovarsko-bilogorska GORDANA KURUC Virovitičko-podravska GREBENC HELENA Vukovarsko-srijemska "MARXER" - MARSKER ŠIMO Osječko-baranjska REPRO STUDIO d,o,o, Dragutun Repar Grad Zagreb GRDIĆ MILAN Karlovačka KREŠIMIR PETROVIĆ Koprivničko-križevačka "WALPO" vl, DARKO PIROŠKA Osječko-baranjska FRANJO BAČMAGA Virovitičko-podravska HRVOJE NOVOSEL Zagrebačka GREKČEVIĆ IMBRO Zagrebačka GRADIŠČANEC STANKO Osječko-baranjska HRŠAK-MILIČEVIĆ MARIJA Varaždinska KAVAČ STEVAN Istarska PERPETUATRADE d,o,o,, vlasnik ŽELJKO ČIKI Osječko-baranjska POLJOPRIVREDNE ZADRUGE VALPOVO, RJ IVANOVCI Osječko-baranjska OSTOIĆ DUBRAVKA Varaždinska KUTJEVAC TIHOMIR Osječko-baranjska NAKANI TEREZIJA Bjelovarsko-bilogorska RADANEC ZLATA Bjelovarsko-bilogorska KOSANOVIĆ JADRANKA Bjelovarsko-bilogorska MILOVIĆ KATA Bjelovarsko-bilogorska GRBAČIĆ JADRANKA Bjelovarsko-bilogorska OBITELJSKA ZADRUGA “ SIRANA HUMAC” Splitsko-dalmatinska KLARIĆ MATE Zadarska MATIĆ SLAVENKO Šibensko - kninska ŠAPONJA MILENKO Zadarska TROBONJAČA MIRKO Šibensko - kninska GNJIDIĆ MIRKO Šibensko - kninska BOJANIĆ VASILJ Šibensko - kninska KRPINA IVAN Zadarska RAPO NIKOLA Šibensko - kninska IVKOVIĆ JOVO Bjelovarsko-bilogorska KOPČOG SAMUEL Osječko-baranjska MASLAĆ GORDAN Zagrebačka BAŠIĆ TEREZIJA Šibensko - kninska BUDROVČAN IVICA Bjelovarsko-bilogorska BUDROVČAN ANTUN Bjelovarsko-bilogorska

95
BOSAK MIROSLAV Osječko-baranjska ŠAKIĆ ŽELJKO Bjelovarsko-bilogorska DUHAČEK ŽELJKO Sisačko-moslavačka ŽAMPERA NIKICA Zadarska JEVTIĆ ALEKSA Koprivničko-križevačka JURIĆ STANISLAV Vukovarsko-srijemska PORTADA TOMISLAV Zadarska GRUBIĆ DUŠANKA Šibensko - kninska ZDRAVKO MAMIĆ Zadarska PRVA EKOLOŠKA ZADRUGA Bjelovarsko-bilogorska BILEK VITOMIR Bjelovarsko-bilogorska JELOVEČKI STJEPAN Zagrebačka KOS TOMISLAV Bjelovarsko-bilogorska PAUŠIĆ DRAŽEN Bjelovarsko-bilogorska KUFTIĆ NENAD Primorsko goranska ZLATKO ŠARONJA Krapinsko-zagorska SLAVKO VRKIĆ Zadarska POLJOPRIVREDNA ZADRUGA "SVIRČE" Splitsko dalmatinska LAZO DRONJAK Šibensko - kninska REŠKOVIĆ IVAN Brodsko-posavska ŠPIRANEC VLADIMIR Bjelovarsko-bilogorska VIDUKA KREŠIMIR Zagreb IGLUN KOMERC Zadarska PZ CERINE, PZ Topolje Osječko-baranjska AGROPAN d,o,o, Zagreb ARDUINA BUBOLA Istarska BELJE d,d, Darda, Poljoprivreda Mirkovac Osječko-baranjska SAGI DRAZEN Osječko-baranjska IGREC IVICA Osječko-baranjska "SMS" D,O,O, ZA PROIZVODNJU PRIRODNE HRANE Splitsko -Dalmatinska ZAVRSKI MARICA Osječko-baranjska ROKI'S d,o,o Splitsko-dalmatinska AGRO MITROVIC samostalno obiteljski gospodarstvo Osječko-baranjska JAN SPIDER d,o,o, Virovitičko-podravska NEMCIC NIKOLA Virovitičko-podravska BUJAK ILONKA Osječko-baranjska SEKANIC-MUNDIC RAJKA Vukovarsko-srijemska "SILADI" Zagrebacka HLADNIC-uljara, trgovina i gradevinska mehanizacija Koprivničko-križevačka DEMD d,o,o, Terra & herba Osijek Osječko-baranjska GRLADINOVIC ZLATKO Osječko-baranjska PETROVIC PREDRAG Osječko-baranjska KAKAS FRANJO Osječko-baranjska SAGITTA d,o,o, Osječko-baranjska DEBOLIS IVAN Osječko-baranjska SKRINJARIC JASMINKA Osječko-baranjska ANIC TATJANA Zagrebacka MEDVED MARIJA Bjelovarsko-bilogorska MASNEC IVAN Zagrebacka GACESA NIKOLA Karlovačka

96
Laws and regulations
Agriculture in general
Food Act (N.N. (Official Gazette) 96/03)
Agricultural Strategy (N.N. 89/02)
Agricultural Law (N.N. 66/01, 83/02)
Agricultural Land Act (N.N. 66/01, 87/02)
Law on State support in agriculture, fisheries and forestry (N.N. 87/02)
Rules on commercial farm Register enrolment (N.N. 128/02, 11/03, 14/03)
Wine Act (N.N. 96/03)
Organic agriculture in Croatia
Organic Production of Agricultural and Food Products Act was deliberated (O.G.12/01);
Rules on completion of directive concerning recompenses of expenses for inspection services and
process of evaluation of respect of basic norms which regulate the organic production (O.G.
101/03);
Rules on recompenses of expenses for inspection services and process of evaluation of respect of
basic norms which regulate the organic production (O.G. 85/02)
Rules on organic production for plant cultivation and production of plant products (O.G. 91/01)
Rules on system of evaluation of respect of basic principles governing the organic production
(O.G. 91/01)
Rules on procedure and conditions for the achievement of the eco logo (O.G. 13/02)
Rules on processing in organic production (O.G. 13/02)
Rules on organic production of animal products (O.G. 13/02)
Rules on organic product labels (O.G. 13/02)

97
Rules on conditions and ways of enrolment in registers concerning the organic production of
agricultural and food products (O.G. 13/02)
Rules on professional extension services in the organic production (O.G. 13/02)
Rules on organic production for fibril processing (O.G. 81/02)
Distribution regulations in Croatia
Trade Act (N,N, 49/03)
E-commerce Act (NN 173/03)
Consumer Protection Act (NN 96/03)
Competition Protection Act (NN 122/03)
Rules on the Form and Method of Running Merchandise
Inventories in Retail Trade (NN 73/02, 79/02)
Rules on Minimum Technical Requirements for Premises on
which Trade and Trade Intermediation are Carried Out, and
on Requirements for Sale outside Premises (NN 37/98,
73/02, 153/02)
Rules on Admissible Losses due to Spillage, Dispersal,
Damage and Breakage on Products / for legal entities /
(NN 57/98, 81/02, 303/03)
Regulation on Measures for the Prevention of Illicit Sale at
Marketplaces and in Other Open-Air Spaces (NN 69/01)
Regulation on Special Requirements for Retail Trade in
Specific Types of Shops (NN 105/01)
Regulation on Special Requirements for Wholesale Trade
and International Trade in Specific Types of Merchandise
(NN 16/02)
Special Practices for Retail Trade (NN 16/95)

98
Collective Agreement for the Trade
Croatian Chamber of economy (HGK), Rules on marks for visual labeling of Croatian products,
16/12/1999, Zagreb;
State inspectorate, control of products (N,N, 76/99, N,N, 96/03, N,N, 151/03)
The law for protection of consumers (N, N, 96/03)
Food safety Some important sites to be consulted concerning the lows on food safety and quality and
conditions for exportation of food products
http://www,usembassy,it/agrtrade/files/Export2003,pdf EU food low - http://europa,eu,int/comm/food/food/foodlaw/index_en,htm Exports in EU - http://europa,eu,int/comm/food/fs/inspections/special_topics/guide_thirdcountries_en,pdf
Food safety in EU http://www,euractiv,com/Article?tcmuri=tcm:29-117493-16&type=LinksDossier organic farming in EU - http://www,organic-research,com/LawsRegs/regs/eureg,asp FAO/ITC/CTA (2001), World markets for organic fruit and vegetables, Opportunities for developing countries in the production and export of organic horticultural products, FAO, Rome ENGLAND Exports to England, http://www,food,gov,uk/enforcement/imports/ GERMANY Ministry of Agriculture, http://www,bml,de/index-272804D294E247F1BEF4F4F9D9C2BC4C,html Imports of animal food by tourists http://www,germany-info,org/relaunch/info/consular_services/customs/animalproducts,html Germany, agri – food country profile, http://atn-riae,agr,ca/europe/e3039,htm Trade and economic profile for Germany (contains useful addresses), http://www,itds,treas,gov/germany,html BVE, http://www,bve-online,de/ Hyperlinks for doing business in Germany, http://www,localglobal,de/links/links_mj_englisch,html
INTERNATIONAL TRADE-RELATED MEMBER ASSOCIATIONS Federation of the agricultural traders (BVA) Claus Bacmeister, Hamburg Präsident Robert Künzel

99
Geschäftsführer Beueler Bahnhofsplatz 18, 53225 Bonn Postfach 301655, 53196 Bonn Telefon 0228/975850 Telefax 0228/97585-30 /-32 eMail: [email protected] Federation of German Wholesale and Foreign Trade http://www.bga.de/ German Chambers of Commerce Abroad http://www.ahk.de/ Organic farming www.soel.de/english/deutschland_ueber_e.html - 18k - 10 dic 2004 http://www.verbraucherministerium.de/index-27B3D057B83D4089B66FFBAA99BD991A.html http://www.fibl.net/english/fibl/portrait-germany.php ITALY Ministry of Agricultural and Forestry Policies http://www.politicheagricole.it/ Organic production http://www.politicheagricole.it/PRODUZIONE/AGRIBIO/home.asp Laws and regulations concerning the Food European Agency for food safety http://www.parlamento.it/parlam/leggi/04164l.htm Association of Producers: Coldiretti http://www.coldiretti.it/ Association of Producers: Confagricoltura www.confagricoltura.it/ Confederation of producers - CIA www.cia.it/ Association of the Chambers of Commerce www.assocamerestero.com/www.assocamerestero.com/ Association of Organic Producers www.aiab.it/ AUSTRIA Ministry of Agriculture http://www.lebensministerium.at/en/ Quality and Safety http://gpool.lfrz.at/gpool/main.cgi?catid=15570&rq=cat&tfqs=catt&catt=_lebensm&yh_order=titel

100
Norms governing quality http://gpool.lfrz.at/gpool/main.cgi?catid=15687&rq=cat&tfqs=catt&catt=_lebensm&yh_order=titel Austrian Agency of Food Safety http://www.ages.at/servlet/sls/Tornado/spr/ages/Home Agrmarket Austria http://www.ama.at Organic farming http://www.organic-europe.net/country_reports/austria/default.asp http://www.organic-europe.net/country_reports/pdf/2000/austria.pd Austria Al Naturkost Schulgasse 35 2542 Kottingbrunn tel 02252/77218 Natǖrlich Weber A – 3932 Kirchberg/Walde 52 Tel: 02854 20417 Fax: 02854 631016 [email protected] Operating from Germany Bodan verteilerdienst Bruchfelderstr. 6 88662 Ǜberlingen tel: 0049 7553 8240 fax: 0049 7553 6118 [email protected] Dennree Versorgungs BmbH Hoferstr 11 95183 Königshof / Töpen tel: 09295 – 180 fax. 09295 – 1850 German operators in the organic food sector are also found under: http://www.naturkost.de/herst/grosshandel.htm Germany Rapunzel Pure Organics Inc. 2424 SR-203 Valatie. NY 12184 (800) 207-2814 - toll free

101
(518) 392-8620 - phone (518) 392-8630 - fax [email protected] http://www.rapunzel.com Lehmann Natur GmbH Am Churkamp 20 D – 47059 Duisburg Tel: +49 – 203 – 932 550 Fax: +49 – 203 –932 5599 [email protected] www.lehmann-natur.com Biotropic Ernst Weber Naturkost Postfach 75 09 54 D – 81339 Munchen Tel +49 – 89 – 746 3420 Fax: +49 – 89 – 746 34222 [email protected] Naturkost Schramm Ludwig – Winter – Strasse 6 D – 77767 Appenweier Tel: +49 – 7805 – 96680 Fax: +49 – 7805 – 966880 [email protected] www.naturkost-schramm.de Landline Lebensmittel Vertrieb GmbH & Co. KG An der Hasenkaule 24 D – 50345 Hurth Tel: +49 – 2233 – 974510 Fax: +49 – 2233 – 9745199 [email protected] www.landline.de Dennree vergorgungs GmbH Hofer Str. 11 D – 95 183 Topen Tel: +49 – 9295 – 180 Fax: +49 – 9295 – 1850 Netherlands EOSTA International P.O. Box 132 NL – 3980 CC Bunnik

102
Tel: +31 – 30 – 6566000 Fax: +31 – 30 – 6566040 [email protected] Odin International BV Postbus 225 4190 CE Geldermalsen Tel: +31 – 345 – 577133 Fax: +31 – 345 – 576848 Italy Ecor SPA Via Palù 27 San Vendemiano TV Tel: +39 – 0438 – 7704 Fax: +39 – 0438 – 770447 [email protected] Brio SPA Via Manzoni 99 37 050 Campagnola di Zevio (VR) tel: +39 – 045 – 8951744 fax: +39 – 045 – 8731744 [email protected] http://www.briospa.com Baule Volante SRL Via Mattei 48/11 H 40138 Bologna Tel: +39 – 051 – 534104 Fax:+39 – 051 – 538869 [email protected]