marketing research mark 401 - near east universityold.staff.neu.edu.tr/~rserdaroglu/files/mr...
TRANSCRIPT

Slide 14.1
Near East University
MARKETING RESEARCH
MARK 401
Sampling: design and procedures
SESSION 10
Naresh Malhotra and David Birks, Marketing Research, 3rd Edition, © Pearson Education Limited 2007
Near East University
MARKETING RESEARCH
MARK 401
Sampling: design and procedures
SESSION 10Rana SERDAROGLU
Source:Malhotra and Birks, et al. Chp 14Dr. Eric Shiu lecture notes
Slide 14.2
There is no hope of making scientificstatements about a population based on theknowledge obtained from a sample, unlesswe are circumspect in choosing a samplingmethod.
Slide 14.2
Naresh Malhotra and David Birks, Marketing Research, 3rd Edition, © Pearson Education Limited 2007
There is no hope of making scientificstatements about a population based on theknowledge obtained from a sample, unlesswe are circumspect in choosing a samplingmethod.
Naresh Malhotra and David Birks, Marketing Research, 3rd Edition, © Pearson Education Limited 2007

Slide 14.3
Chapter outline
1. Sample or census2. The sampling design process3. A classification of sampling techniques4. Non-probability sampling techniques5. Probability sampling techniques6. Choosing non-probability versus probability
sampling7. Uses of non-probability versus probability
sampling8. Summary of sampling techniques
Naresh Malhotra and David Birks, Marketing Research, 3rd Edition, © Pearson Education Limited 2007
1. Sample or census2. The sampling design process3. A classification of sampling techniques4. Non-probability sampling techniques5. Probability sampling techniques6. Choosing non-probability versus probability
sampling7. Uses of non-probability versus probability
sampling8. Summary of sampling techniques

Slide 14.4
Population – The aggregate of all the elements,sharing some common set of characteristics, thatcomprise the universe for the purpose of themarketing research problem.
Census – A complete enumeration of the elementsof a population or study objects.
Sample – A subgroup of the elements of thepopulation selected for participation in the study.
Sample or census
Naresh Malhotra and David Birks, Marketing Research, 3rd Edition, © Pearson Education Limited 2007
Population – The aggregate of all the elements,sharing some common set of characteristics, thatcomprise the universe for the purpose of themarketing research problem.
Census – A complete enumeration of the elementsof a population or study objects.
Sample – A subgroup of the elements of thepopulation selected for participation in the study.

Slide 14.5
Table 14.1 Sample versus census
Naresh Malhotra and David Birks, Marketing Research, 3rd Edition, © Pearson Education Limited 2007
Slide 14.6
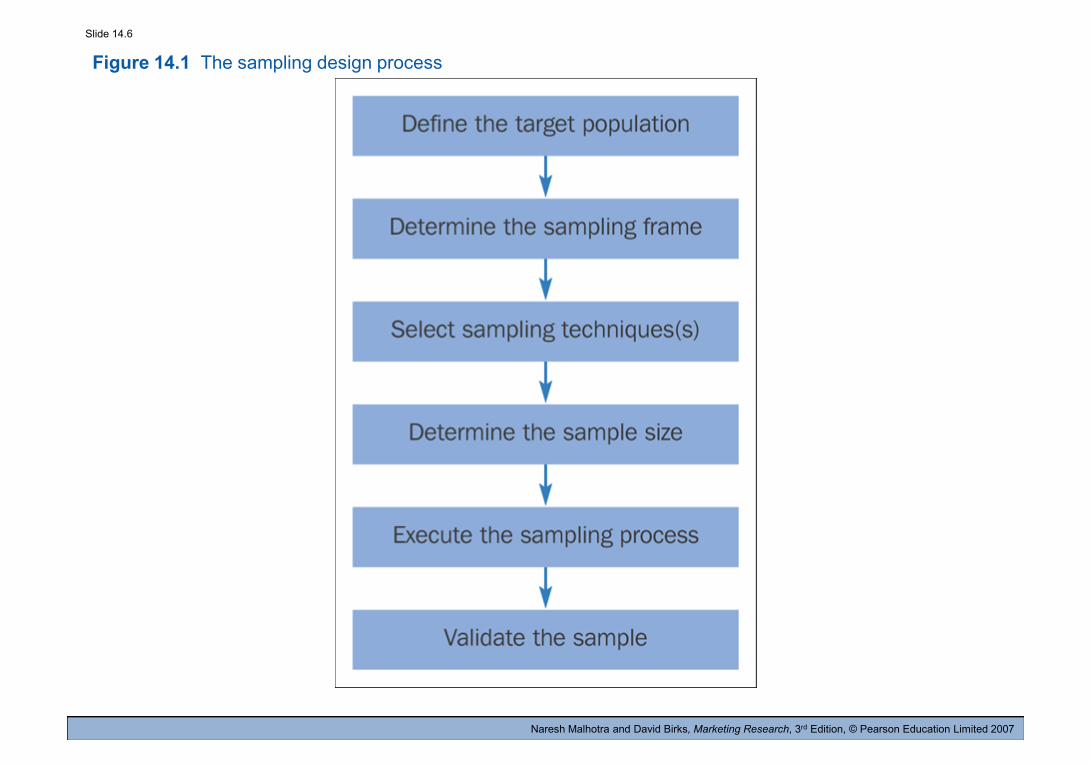
Figure 14.1 The sampling design process
Naresh Malhotra and David Birks, Marketing Research, 3rd Edition, © Pearson Education Limited 2007
Slide 14.7
Define the target population
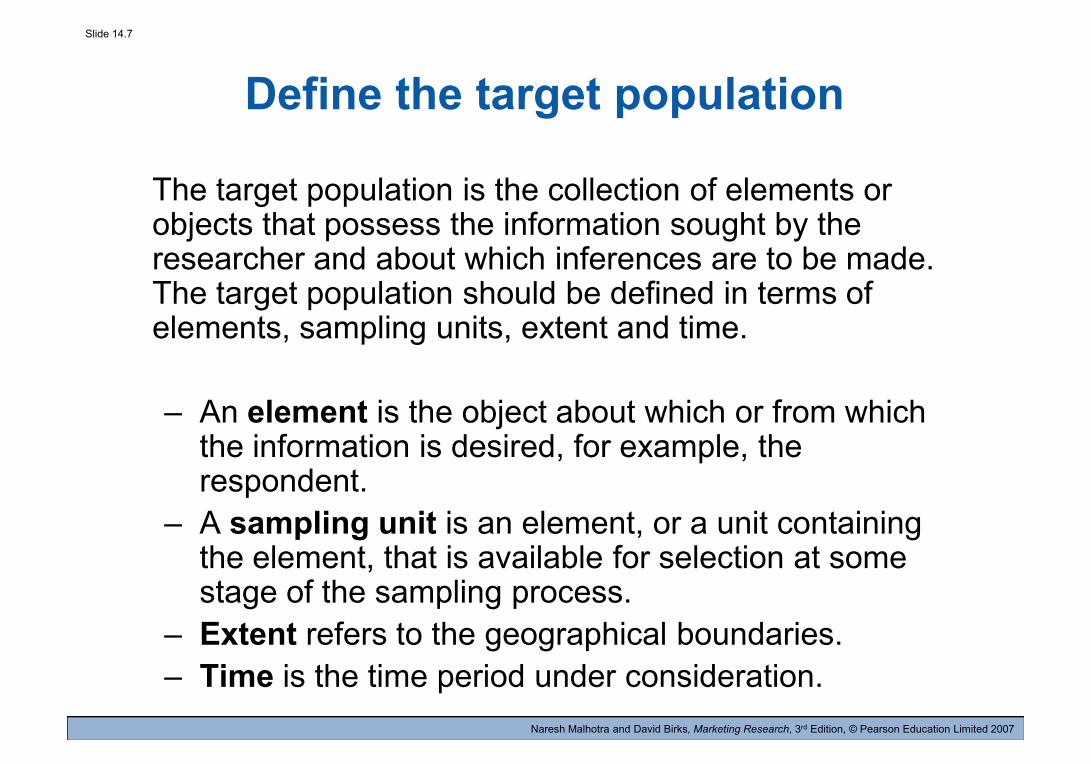
The target population is the collection of elements orobjects that possess the information sought by theresearcher and about which inferences are to be made.The target population should be defined in terms ofelements, sampling units, extent and time.
– An element is the object about which or from whichthe information is desired, for example, therespondent.
– A sampling unit is an element, or a unit containingthe element, that is available for selection at somestage of the sampling process.
– Extent refers to the geographical boundaries.– Time is the time period under consideration.
Naresh Malhotra and David Birks, Marketing Research, 3rd Edition, © Pearson Education Limited 2007
The target population is the collection of elements orobjects that possess the information sought by theresearcher and about which inferences are to be made.The target population should be defined in terms ofelements, sampling units, extent and time.
– An element is the object about which or from whichthe information is desired, for example, therespondent.
– A sampling unit is an element, or a unit containingthe element, that is available for selection at somestage of the sampling process.
– Extent refers to the geographical boundaries.– Time is the time period under consideration.
Slide 14.8
Define the target population(Continued)
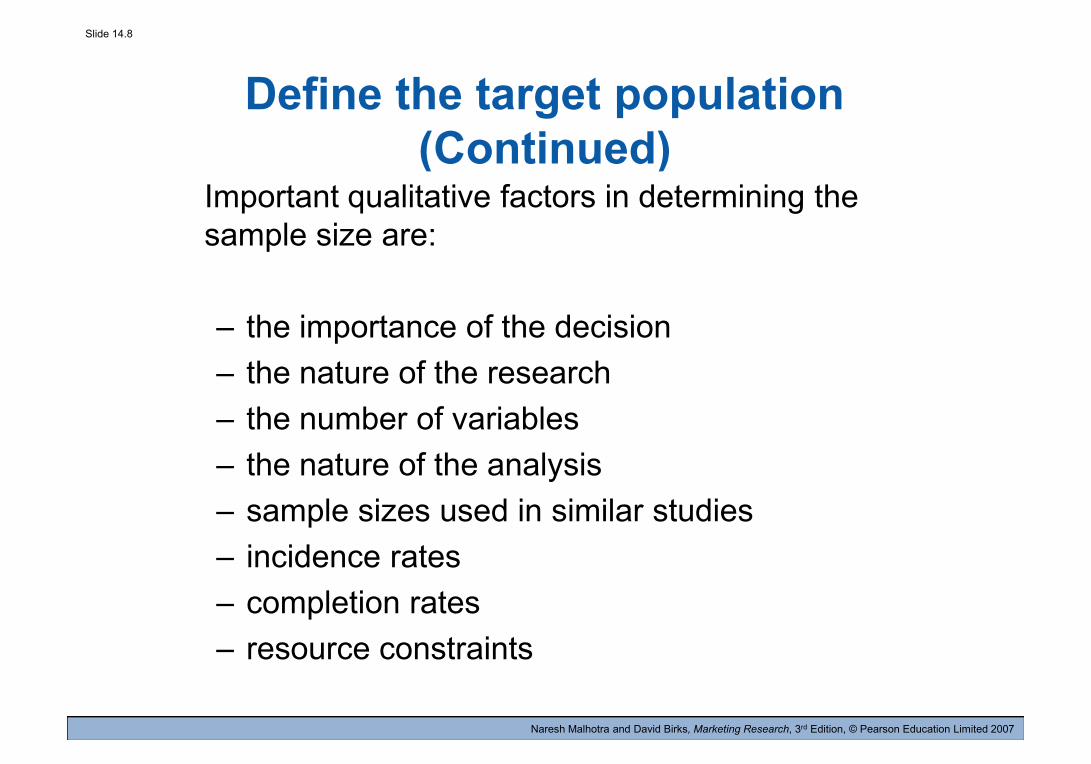
Important qualitative factors in determining thesample size are:
– the importance of the decision– the nature of the research– the number of variables– the nature of the analysis– sample sizes used in similar studies– incidence rates– completion rates– resource constraints
Naresh Malhotra and David Birks, Marketing Research, 3rd Edition, © Pearson Education Limited 2007
Important qualitative factors in determining thesample size are:
– the importance of the decision– the nature of the research– the number of variables– the nature of the analysis– sample sizes used in similar studies– incidence rates– completion rates– resource constraints
Slide 14.9
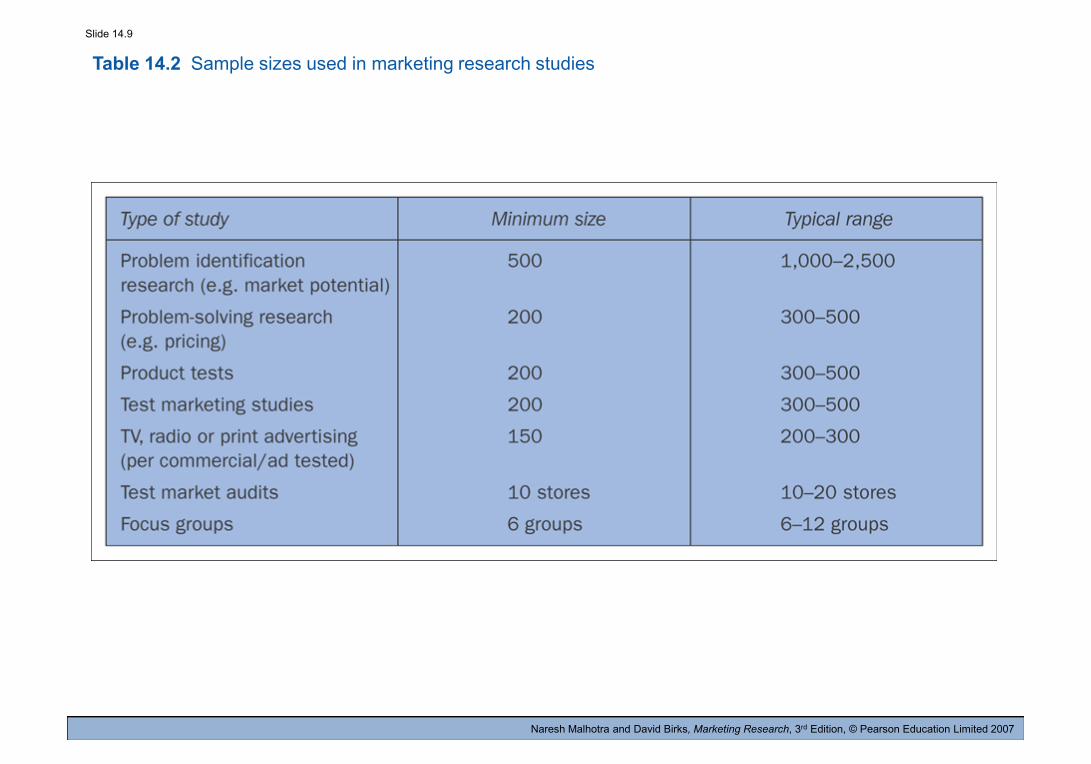
Table 14.2 Sample sizes used in marketing research studies
Naresh Malhotra and David Birks, Marketing Research, 3rd Edition, © Pearson Education Limited 2007
Slide 14.10
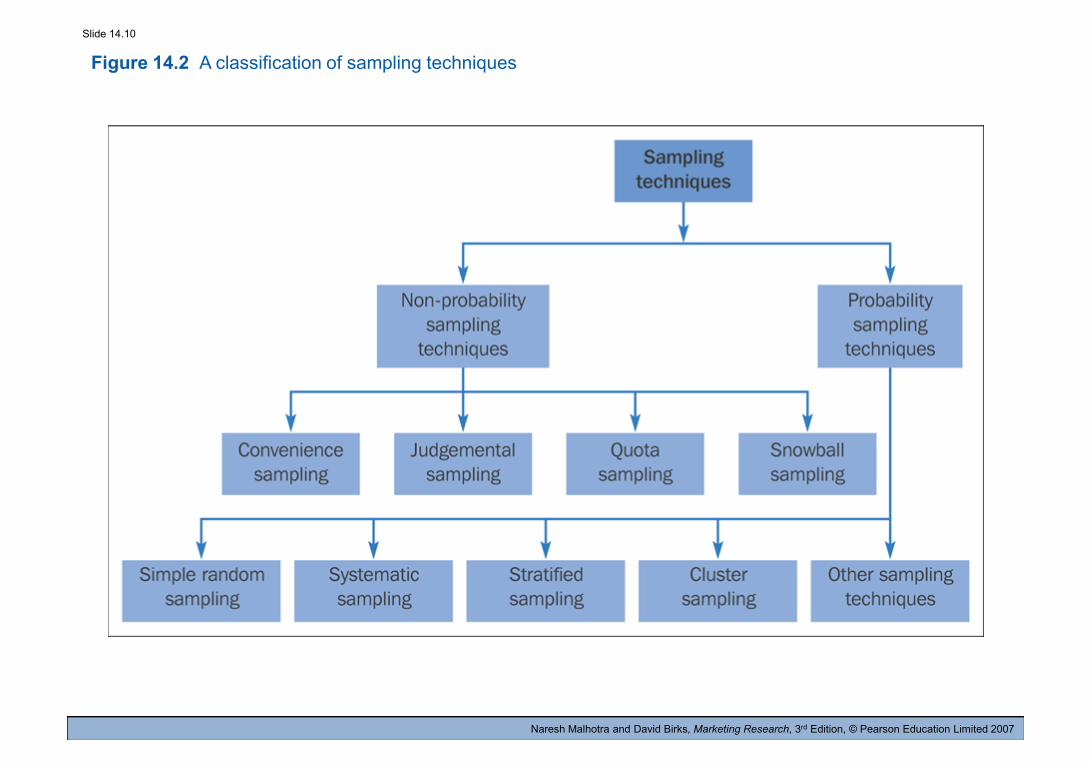
Figure 14.2 A classification of sampling techniques
Naresh Malhotra and David Birks, Marketing Research, 3rd Edition, © Pearson Education Limited 2007
Slide 14.11
Convenience sampling
Convenience sampling attempts to obtain asample of convenient elements. Often,respondents are selected because they happento be in the right place at the right time.
– use of students, and members of socialorganisations
– street interviews without qualifying therespondents
– ‘people on the street’ interviewsNaresh Malhotra and David Birks, Marketing Research, 3rd Edition, © Pearson Education Limited 2007
Convenience sampling attempts to obtain asample of convenient elements. Often,respondents are selected because they happento be in the right place at the right time.
– use of students, and members of socialorganisations
– street interviews without qualifying therespondents
– ‘people on the street’ interviews
Slide 14.12
Judgmental sampling
Judgmental sampling is a form ofconvenience sampling in which the populationelements are selected based on the judgmentof the researcher.
– test markets
– purchase engineers selected in industrialmarketing research
– expert witnesses used in court
Naresh Malhotra and David Birks, Marketing Research, 3rd Edition, © Pearson Education Limited 2007
Judgmental sampling is a form ofconvenience sampling in which the populationelements are selected based on the judgmentof the researcher.
– test markets
– purchase engineers selected in industrialmarketing research
– expert witnesses used in court

Slide 14.13
A Graphical illustration of judgmental sampling
A B C D E
1 6 11 16 21
2 7 12 17 22
The researcher considersgroups B, C and E to betypical and convenient.
Within each of thesegroups one or two
elements are selectedbased on typicality and
convenience. Theresulting sample
consists of elements 8,10, 11, 13, and 24. Note,
no elements are selectedfrom groups A and D.
Naresh Malhotra and David Birks, Marketing Research, 3rd Edition, © Pearson Education Limited 2007
2 7 12 17 22
3 8 13 18 23
4 9 14 19 24
5 10 15 20 25
The researcher considersgroups B, C and E to betypical and convenient.
Within each of thesegroups one or two
elements are selectedbased on typicality and
convenience. Theresulting sample
consists of elements 8,10, 11, 13, and 24. Note,
no elements are selectedfrom groups A and D.
Slide 14.14
Quota sampling
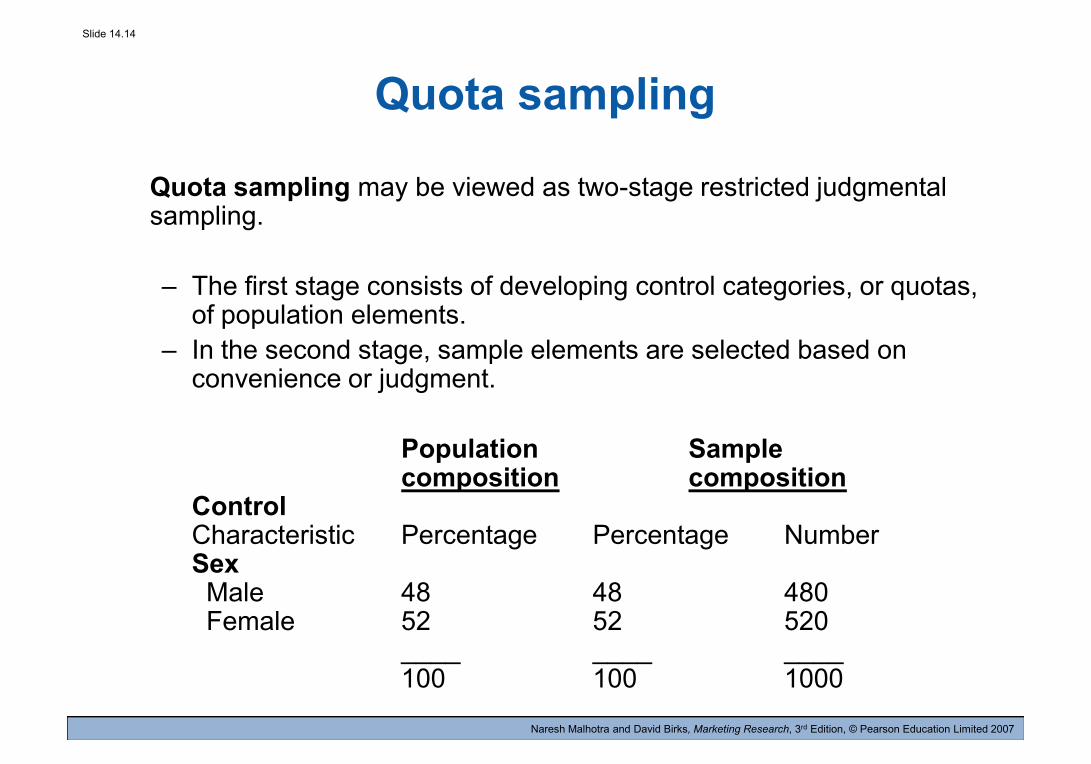
Quota sampling may be viewed as two-stage restricted judgmentalsampling.
– The first stage consists of developing control categories, or quotas,of population elements.
– In the second stage, sample elements are selected based onconvenience or judgment.
Population Samplecomposition composition
ControlCharacteristic Percentage Percentage NumberSexMale 48 48 480Female 52 52 520
____ ____ ____100 100 1000
Naresh Malhotra and David Birks, Marketing Research, 3rd Edition, © Pearson Education Limited 2007
Quota sampling may be viewed as two-stage restricted judgmentalsampling.
– The first stage consists of developing control categories, or quotas,of population elements.
– In the second stage, sample elements are selected based onconvenience or judgment.
Population Samplecomposition composition
ControlCharacteristic Percentage Percentage NumberSexMale 48 48 480Female 52 52 520
____ ____ ____100 100 1000
Slide 14.15
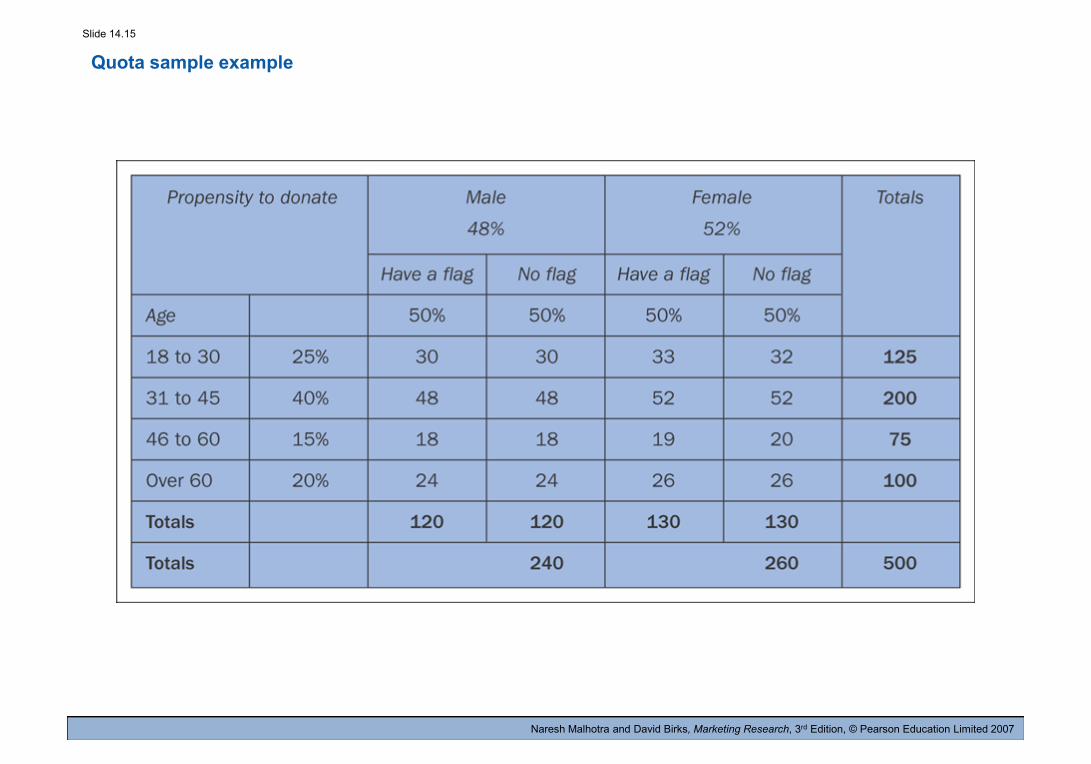
Quota sample example
Naresh Malhotra and David Birks, Marketing Research, 3rd Edition, © Pearson Education Limited 2007

Slide 14.16
A graphical illustration of quotasampling
A B C D E
1 6 11 16 21
A quota of oneelement from each
group, A to E, isimposed. Within eachgroup, one element is
selected based onjudgment or
convenience. Theresulting sample
consists of elements3, 6, 13, 20 and 22.
Note, one element isselected from eachcolumn or group.
Naresh Malhotra and David Birks, Marketing Research, 3rd Edition, © Pearson Education Limited 2007
2 7 12 17 22
3 8 13 18 23
4 9 14 19 24
5 10 15 20 25
A quota of oneelement from each
group, A to E, isimposed. Within eachgroup, one element is
selected based onjudgment or
convenience. Theresulting sample
consists of elements3, 6, 13, 20 and 22.
Note, one element isselected from eachcolumn or group.

Slide 14.17
Snowball sampling
In snowball sampling, an initial group of respondentsis selected, usually at random.
– After being interviewed, these respondents areasked to identify others who belong to the targetpopulation of interest.
– Subsequent respondents are selected based on thereferrals.
Naresh Malhotra and David Birks, Marketing Research, 3rd Edition, © Pearson Education Limited 2007
In snowball sampling, an initial group of respondentsis selected, usually at random.
– After being interviewed, these respondents areasked to identify others who belong to the targetpopulation of interest.
– Subsequent respondents are selected based on thereferrals.

Slide 14.18
A graphical illustration of snowball sampling
A B C D E
1 6 11 16 21
Elements 2 and 9 areselected randomly
from groups A and B.Element 2 refers
elements 12 and 13.Element 9 referselement 18. Theresulting sample
consists of elements2, 9, 12, 13, and 18.Note, there are no
element from group E.
RandomSelection Referrals
Naresh Malhotra and David Birks, Marketing Research, 3rd Edition, © Pearson Education Limited 2007
2 7 12 17 22
3 8 13 18 23
4 9 14 19 24
5 10 15 20 25
Elements 2 and 9 areselected randomly
from groups A and B.Element 2 refers
elements 12 and 13.Element 9 referselement 18. Theresulting sample
consists of elements2, 9, 12, 13, and 18.Note, there are no
element from group E.

Slide 14.19
Simple random sampling
• Each element in the population has a known andequal probability of selection.
• Each possible sample of a given size (n) has a knownand equal probability of being the sample actuallyselected.
• This implies that every element is selectedindependently of every other element.
Naresh Malhotra and David Birks, Marketing Research, 3rd Edition, © Pearson Education Limited 2007
• Each element in the population has a known andequal probability of selection.
• Each possible sample of a given size (n) has a knownand equal probability of being the sample actuallyselected.
• This implies that every element is selectedindependently of every other element.

Slide 14.20
A graphical illustration of simplerandom sampling
A B C D E
1 6 11 16 21
2 7 12 17 22
Select fiverandom numbersfrom 1 to 25. Theresulting sample
consists ofpopulation
elements 3, 7, 9,16 and 24. Note,
there is noelement from
group C.
Naresh Malhotra and David Birks, Marketing Research, 3rd Edition, © Pearson Education Limited 2007
2 7 12 17 22
3 8 13 18 23
4 9 14 19 24
5 10 15 20 25
Select fiverandom numbersfrom 1 to 25. Theresulting sample
consists ofpopulation
elements 3, 7, 9,16 and 24. Note,
there is noelement from
group C.
Slide 14.21
Systematic sampling
• The sample is chosen by selecting a random startingpoint and then picking every ith element in successionfrom the sampling frame.
• The sampling interval, i, is determined by dividing thepopulation size N by the sample size n and rounding tothe nearest integer.
• When the ordering of the elements is related to thecharacteristic of interest, systematic sampling increasesthe representativeness of the sample.
Naresh Malhotra and David Birks, Marketing Research, 3rd Edition, © Pearson Education Limited 2007
• The sample is chosen by selecting a random startingpoint and then picking every ith element in successionfrom the sampling frame.
• The sampling interval, i, is determined by dividing thepopulation size N by the sample size n and rounding tothe nearest integer.
• When the ordering of the elements is related to thecharacteristic of interest, systematic sampling increasesthe representativeness of the sample.
Slide 14.22
Systematic sampling (Continued)
• If the ordering of the elements produces a cyclicalpattern, systematic sampling may decrease therepresentativeness of the sample.
For example, there are 100,000 elements in thepopulation and a sample of 1,000 is desired. In thiscase the sampling interval, i, is 100. A random numberbetween 1 and 100 is selected. If, for example, thisnumber is 23, the sample consists of elements 23,123, 223, 323, 423, 523 and so on.
Naresh Malhotra and David Birks, Marketing Research, 3rd Edition, © Pearson Education Limited 2007
• If the ordering of the elements produces a cyclicalpattern, systematic sampling may decrease therepresentativeness of the sample.
For example, there are 100,000 elements in thepopulation and a sample of 1,000 is desired. In thiscase the sampling interval, i, is 100. A random numberbetween 1 and 100 is selected. If, for example, thisnumber is 23, the sample consists of elements 23,123, 223, 323, 423, 523 and so on.

Slide 14.23
Stratified sampling
• A two-step process in which the population is partitionedinto subpopulations, or strata.
• The strata should be mutually exclusive and collectivelyexhaustive in that every population element should beassigned to one and only one stratum and no populationelements should be omitted.
• Next, elements are selected from each stratum by arandom procedure, usually SRS.
• A major objective of stratified sampling is to increaseprecision without increasing cost.
Naresh Malhotra and David Birks, Marketing Research, 3rd Edition, © Pearson Education Limited 2007
• A two-step process in which the population is partitionedinto subpopulations, or strata.
• The strata should be mutually exclusive and collectivelyexhaustive in that every population element should beassigned to one and only one stratum and no populationelements should be omitted.
• Next, elements are selected from each stratum by arandom procedure, usually SRS.
• A major objective of stratified sampling is to increaseprecision without increasing cost.

Slide 14.24
Stratified sampling (Continued)
• The elements within a stratum should be ashomogeneous as possible, but the elements in differentstrata should be as heterogeneous as possible.
• The stratification variables should also be closelyrelated to the characteristic of interest.
• Finally, the variables should decrease the cost of thestratification process by being easy to measure andapply.
Naresh Malhotra and David Birks, Marketing Research, 3rd Edition, © Pearson Education Limited 2007
• The elements within a stratum should be ashomogeneous as possible, but the elements in differentstrata should be as heterogeneous as possible.
• The stratification variables should also be closelyrelated to the characteristic of interest.
• Finally, the variables should decrease the cost of thestratification process by being easy to measure andapply.
Slide 14.25
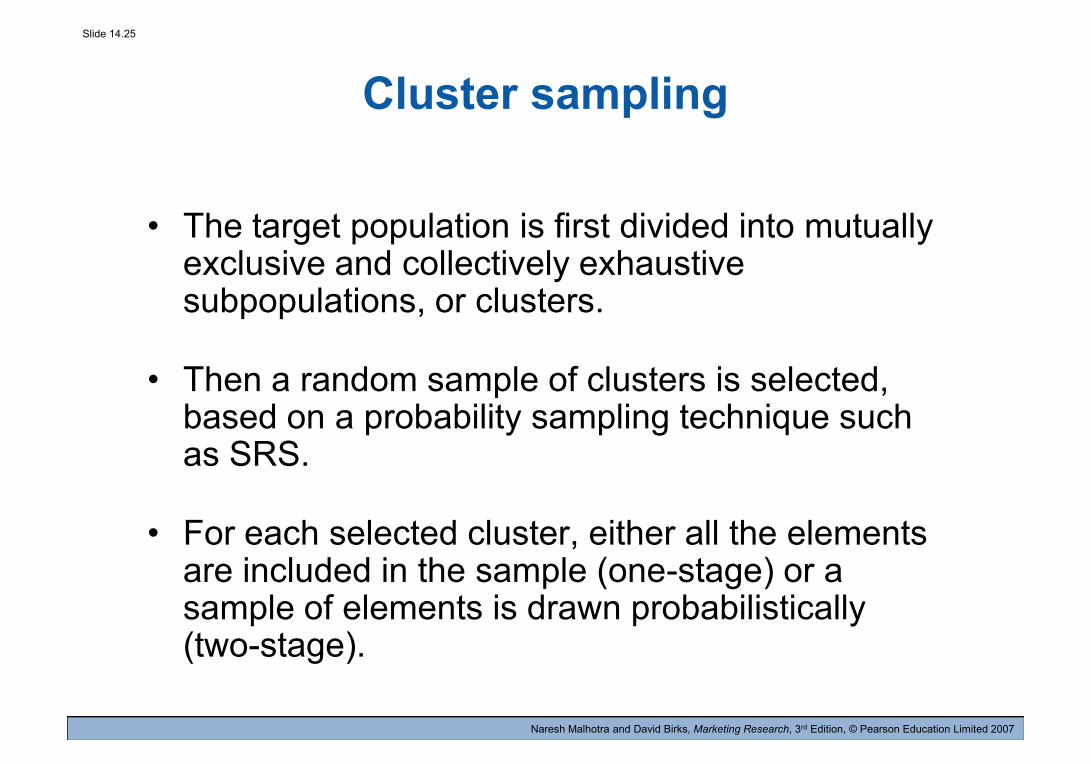
Cluster sampling
• The target population is first divided into mutuallyexclusive and collectively exhaustivesubpopulations, or clusters.
• Then a random sample of clusters is selected,based on a probability sampling technique suchas SRS.
• For each selected cluster, either all the elementsare included in the sample (one-stage) or asample of elements is drawn probabilistically(two-stage).
Naresh Malhotra and David Birks, Marketing Research, 3rd Edition, © Pearson Education Limited 2007
• The target population is first divided into mutuallyexclusive and collectively exhaustivesubpopulations, or clusters.
• Then a random sample of clusters is selected,based on a probability sampling technique suchas SRS.
• For each selected cluster, either all the elementsare included in the sample (one-stage) or asample of elements is drawn probabilistically(two-stage).
Slide 14.26
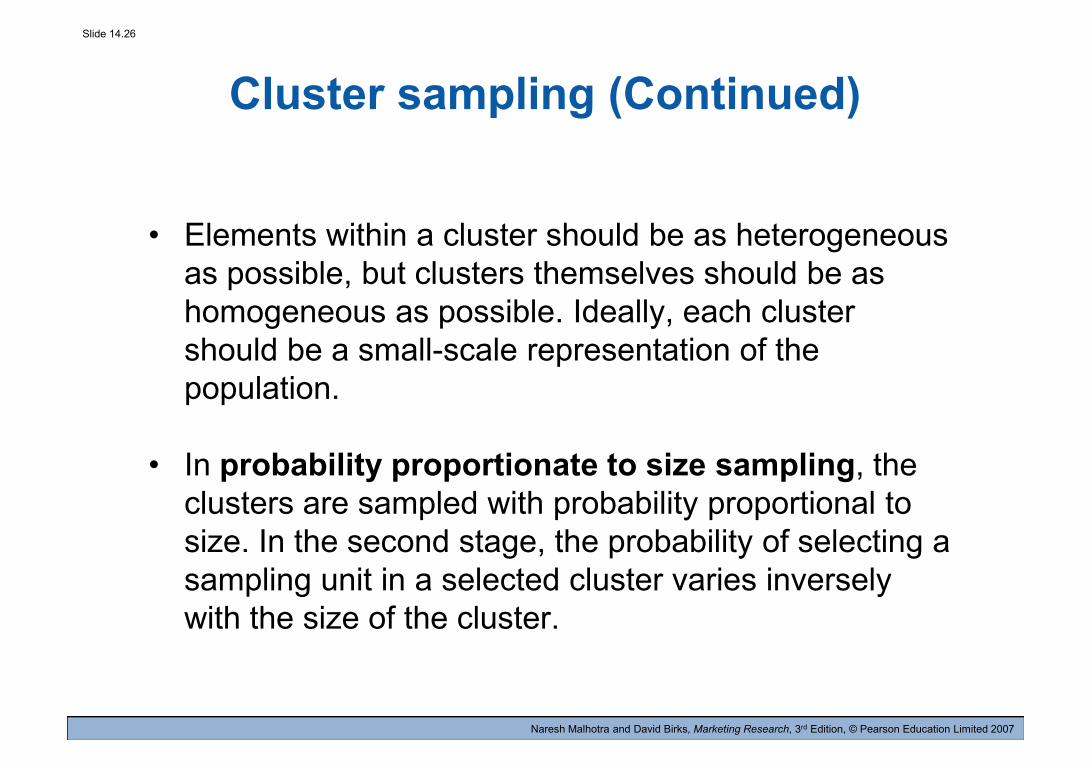
Cluster sampling (Continued)
• Elements within a cluster should be as heterogeneousas possible, but clusters themselves should be ashomogeneous as possible. Ideally, each clustershould be a small-scale representation of thepopulation.
• In probability proportionate to size sampling, theclusters are sampled with probability proportional tosize. In the second stage, the probability of selecting asampling unit in a selected cluster varies inverselywith the size of the cluster.
Naresh Malhotra and David Birks, Marketing Research, 3rd Edition, © Pearson Education Limited 2007
• Elements within a cluster should be as heterogeneousas possible, but clusters themselves should be ashomogeneous as possible. Ideally, each clustershould be a small-scale representation of thepopulation.
• In probability proportionate to size sampling, theclusters are sampled with probability proportional tosize. In the second stage, the probability of selecting asampling unit in a selected cluster varies inverselywith the size of the cluster.
Slide 14.27
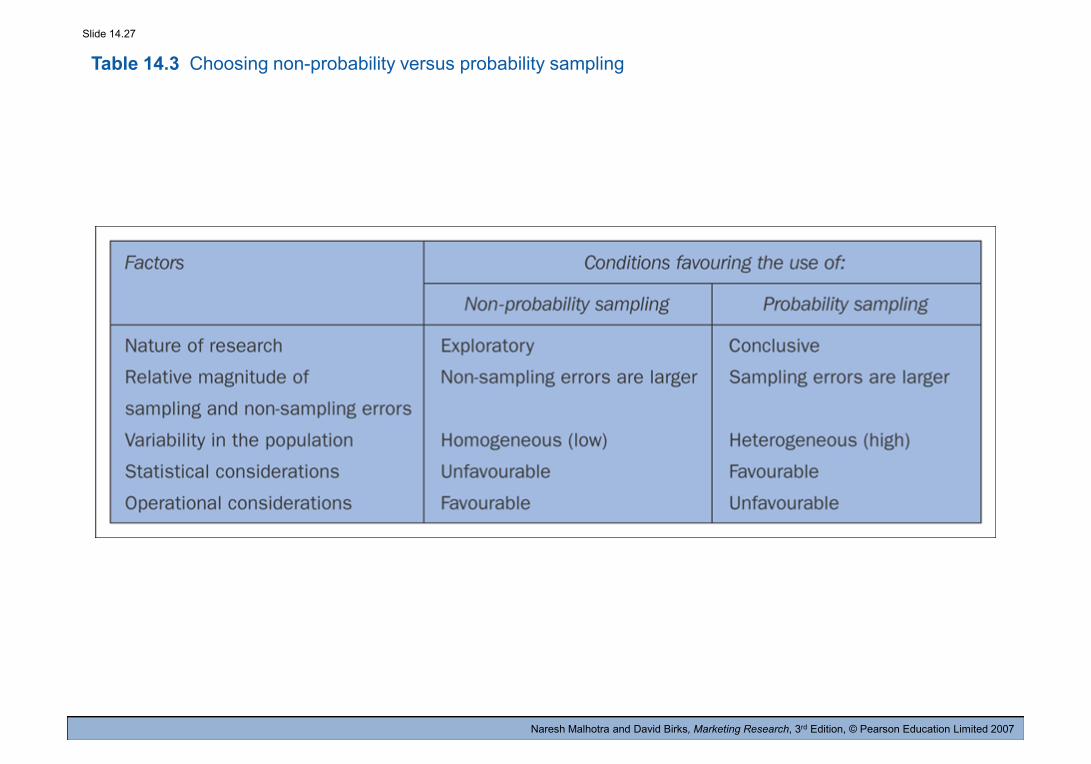
Table 14.3 Choosing non-probability versus probability sampling
Naresh Malhotra and David Birks, Marketing Research, 3rd Edition, © Pearson Education Limited 2007
Slide 14.28
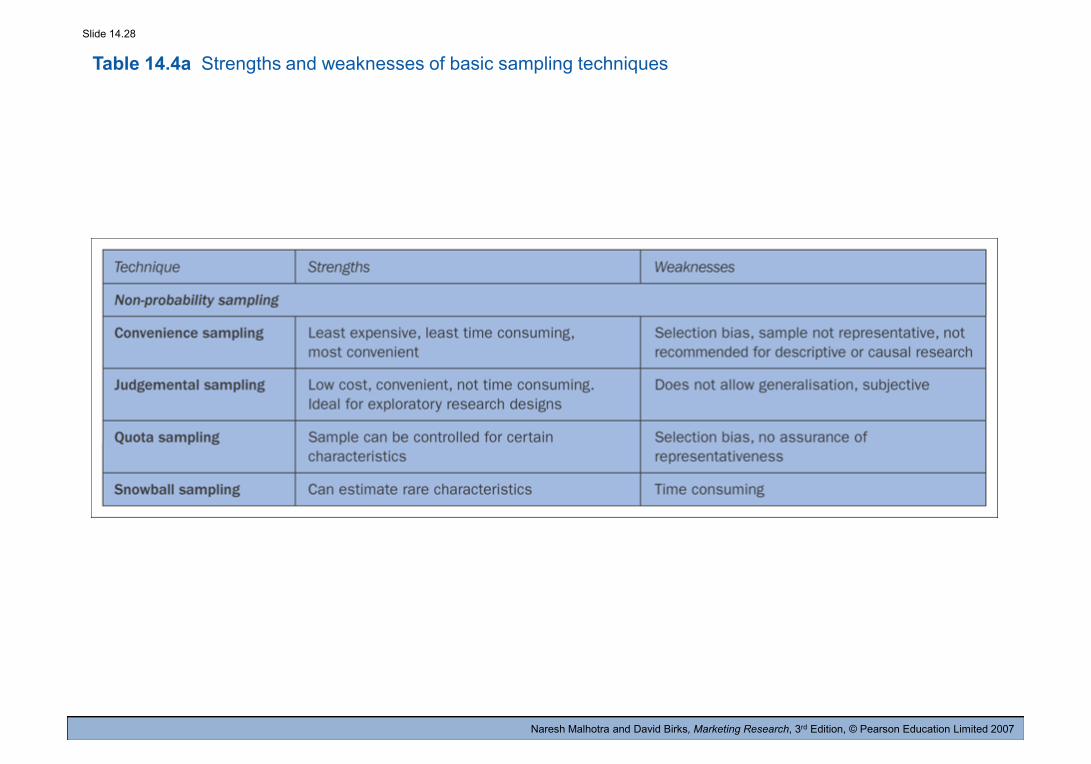
Table 14.4a Strengths and weaknesses of basic sampling techniques
Naresh Malhotra and David Birks, Marketing Research, 3rd Edition, © Pearson Education Limited 2007
Slide 14.29
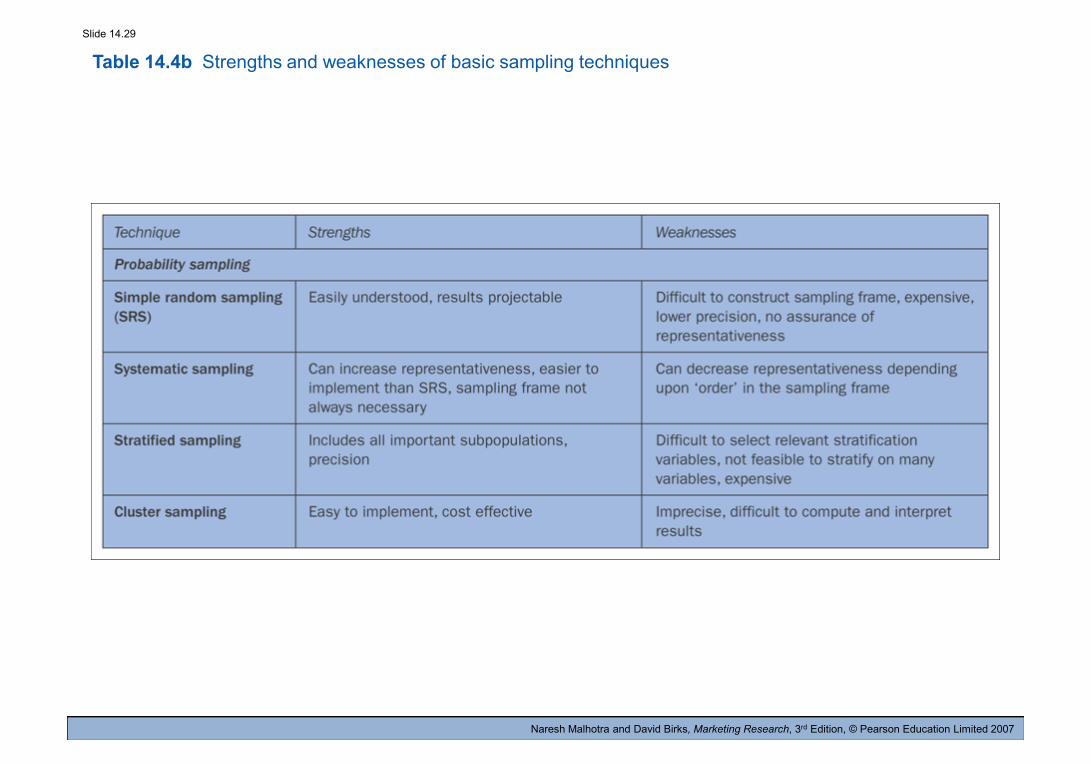
Table 14.4b Strengths and weaknesses of basic sampling techniques
Naresh Malhotra and David Birks, Marketing Research, 3rd Edition, © Pearson Education Limited 2007