marketing plan pro manual version 6
TRANSCRIPT

Marketing Plan Pro® ManualVersion 6.0
Chapter 1: Installation
Chapter 2: Getting Started
Chapter 3: Guided Tour
Chapter 4: Start a Plan
Chapter 5: Your Plan Text
Chapter 6: Your Plan Tables
Chapter 7: Your Plan Charts
Chapter 8: Print and Publish
Chapter 9: Planning for Implementation
Chapter 10: Advanced Tables
Chapter 11: Working with Microsoft Office
Chapter 12: Working with QuickBooks
Appendix A: Range Names
Appendix B: Collaboration
Appendix C: Import and Export Components
Index

© 2002, 2003 Palo Alto Software, Inc. All Rights Reserved.
Palo Alto Software Marketing Plan Pro® Manual, Version 6.0.
This manual, as well as the software described in it, is furnished under license and may be used or copied only in accordance with the terms of such license. The content of this manual is furnished for informational use only, is subject to change without notice, and should not be construed as a commitment by Palo Alto Software, Inc. Palo Alto Software assumes no responsibility or liability for any errors or inaccuracies that may appear in this book.
Except as permitted by such license, no part of this publication may be reproduced, stored in a retrieval system, or transmitted, in any form or by any means, electronic, mechanical, recording or otherwise, without the prior written permission of Palo Alto Software, Inc.
Any references to company names in examples are for demonstration purposes only and are not intended to refer to any actual organization.
Palo Alto Software, the Palo Alto Software logo, Marketing Plan Pro®, Business Plan Pro®, Web Strategy Pro®, Cash Plan Pro®, EasyPlan Wizard®, Sample Plan Browser™, Cash Pilot™, Marketing Plan Pro dart logo, Business Plan Pro push-pin logo, Web Strategy Pro triple color www logo, are trademarks of Palo Alto Software, Inc. in the United States and/or other countries.
Sample marketing, business, and website plans for use with Marketing Plan Pro®, Business Plan Pro®, Web Strategy Pro® software are copyright protected by Palo Alto Software, Inc. You are welcome to use these plans as a starting point to create your own plan, but you do not have permission to reproduce, publish, distribute or even copy these plans as they exist in the software, Sample Plan Browser™ or Palo Alto Software website network.
Adobe and Acrobat Reader are trademarks of Adobe Systems Inc. in the United States and/or other countries. Microsoft, Windows, Microsoft Word, Microsoft Excel, Microsoft PowerPoint, Microsoft Notepad, and Microsoft Office are trademarks of Microsoft Corporation in the United States and/or other countries. Intuit, Quicken and QuickBooks are trademarks of Intuit Corporation in the United States and/or other countries.
All features, services, terms and conditions subject to change without notice.
Palo Alto Software, Incorporated, 144 E. 14th Avenue, Eugene, Oregon 97401, USA

About this ManualThis manual is one of two books included with Marketing Plan Pro®. The other is ‘On Target: the Book on Marketing Plans.’ The On Target book is very much a part of the product. For years we’ve positioned the book not as a software manual, but rather a book on marketing planning. The On Target book and this manual go hand-in-hand together, to give you the book on marketing planning and the manual that offers details about the software. In this manual, some details are obvious: installation, for example. However, it also includes chapters that take you further than ever before:
• The guided tour takes you through the main points and highlights of developing a plan.• Separate chapters offer details on working with text, tables, charts, and printing. The chapter on tables
covers every one of the standard tables in detail—what it does, what inputs it expects, and why.• A complete chapter on advanced spreadsheet work covers functions and blank worksheets that you can add
to your plan.• Separate chapters on working with Microsoft Office®, and QuickBooks®, including how to import and
export, what to expect, when and why to move to or from Marketing Plan Pro.
Other Help ResourcesTips
Special “tips” that describe key points about the current section.
Help IndexReferences on how to search the Help Index (built into the software) for step-by-step instructions on using a menu command.
There is also context-sensitive help, text, table, and chart instructions and examples, and row-by-row table help, also built into the product.
Online Changes and Additions ListOnce the book goes to print, we will find corrections to make (even after multi-level editing). Also, there may be book sections that will be expanded, other references added, etc. There almost always are. So, to help our customers update their printed manual (and maintain the most current electronic PDF version of the manual), we have created “changes and additions” pages on our website. The list of changes will include the date the correction was made. The additions list will include larger section changes or new information not previously included in the manual. These changes and additions can be found online at:
http://www.paloalto.com/su/mp/mc
AcknowledgementsThis manual was coordinated by Teri Epperly, documentation manager, who also co-authored much of the content with Tim Berry, principal author of Marketing Plan Pro®.
The documentation team also included Cale Bruckner, director of product development, and editors Steve Lange and Jacqueline Mansfield. Steve did most of the design layout and implementation of this manual, and Jacqueline developed the Help files.

MARKETING PLAN PRO MANUAL
Marketing Plan Pro® VS. Marketing Plan Pro® PREMIERThis manual was written for both Marketing Plan Pro and Marketing Plan Pro PREMIER. Features specific to PREMIER have “PREMIER version” added to the title. The following chart gives a comparison between the two versions:
Which Marketing Plan Pro® has what you need? Pro PREMIERResearch it
More than 70+ complete sample plans x x“Ask the Experts” resource x xMarketing research tools x x
Build itComplete text editing x x3-dimension automatic charting x xComplete Microsoft Excel®-like fi nancials x xBuild Strategy Pyramids x xImport from QuickBooks® 2002 or newer x xBuild an Organization Chart xCollaborate with a team xExpanded Sales Forecast xExpanded Competitive Analysis and Market Analysis xExpanded Expense and Sales tracking xChannel Analysis x
Distribute and DeliverExport to Microsoft Offi ce x xExport Plan Components xPublish your plan to SecurePlan.com x xPresent your plan using Microsoft PowerPoint® templates x xUse the Report Writer to print specialized plan documents x xPreferred format, respected by banks, lenders, and the SBA x xSave your marketing plan as a template xImport and combine multiple marketing plans into one x
Make it HappenPlan vs. Actual fi nancial management x
ToolsPlan Activities x xForecaster x x
For information on PREMIER upgrades, visit our website at: http://www.paloalto.com/store/mpdupgrade.cfm, or contact the Sales office of Palo Alto Software, Inc. at 1-800-229-7526 Monday through Friday from 8:00 a.m. to 5:00 p.m. U.S. Pacific Time.

Table of ContentsChapter 1: Installation
Installation ................................................................................................................................1.3Personalize Your Software .................................................................................................1.7Registration .............................................................................................................................1.8Monthly Product Update .....................................................................................................1.9Technical Support ................................................................................................................1.11Support Policies and Philosophy ...................................................................................1.11
Chapter 2: Getting StartedStarting Marketing Plan Pro® ...........................................................................................2.3EasyPlan Wizard® ................................................................................................................2.5Working with Text ..................................................................................................................2.6Working in Table Mode ........................................................................................................2.7Charts are Automatic............................................................................................................2.8Printing is Automatic.............................................................................................................2.8Getting Help ............................................................................................................................2.8
Chapter 3: Guided TourTour Overview.........................................................................................................................3.3Practice Working in Text Mode .........................................................................................3.6Practice Working in Table Mode.......................................................................................3.8Sales Forecast .......................................................................................................................3.9Expense Budget ..................................................................................................................3.14The Rest of the Tables ......................................................................................................3.18Charts are Automatic..........................................................................................................3.18Printing is Automatic...........................................................................................................3.19
Chapter 4: Starting a Plan EasyPlan Wizard® ................................................................................................................4.3Sample Plan Browser™ ......................................................................................................4.7Caution on Using Sample Plans ....................................................................................4.10Make it Your Own ................................................................................................................4.10
Chapter 5: Your Plan Text Standard Text Format ..........................................................................................................5.3Working in Text Mode ..........................................................................................................5.7
MARKETING PLAN PRO MANUAL
The Plan Outline ....................................................................................................................5.9Working with HTML Formatting ......................................................................................5.11Import a File .........................................................................................................................5.12Insert a Graphic Image......................................................................................................5.14Insert a Text Table ...............................................................................................................5.15Insert a Character Symbol ...............................................................................................5.16Insert Hyperlink ....................................................................................................................5.17Modify Plan Outline for Different Situations ...............................................................5.18About Marketing Writing....................................................................................................5.19
Chapter 6: Your Plan Tables Spreadsheet Overview ........................................................................................................6.3Developing Your Own Links...............................................................................................6.8Forecaster ................................................................................................................................6.9Tables, One by One............................................................................................................6.10Break-even Analysis ...........................................................................................................6.10Channel Analysis (PREMIER version) .........................................................................6.13Channel Forecast (PREMIER version) ........................................................................6.14Competitive Analysis (PREMIER version) ..................................................................6.15Contribution Margin (PREMIER version).....................................................................6.16Growth and Share Analysis (PREMIER version)......................................................6.18Historical Data (PREMIER version) ..............................................................................6.20Market Analysis ....................................................................................................................6.21Market Demographics........................................................................................................6.25Marketing Expense Budget ............................................................................................6.26Milestones ..............................................................................................................................6.31Sales Forecast .....................................................................................................................6.33Main Help for General How-to-Use Information........................................................6.39
Chapter 7: Your Plan ChartsCharts vs. Tables ...................................................................................................................7.3Help on How to Use the Charts........................................................................................7.6Additional Chart Details.......................................................................................................7.8Make it Your Plan ................................................................................................................7.12
Chapter 8: Print and PublishOverview – Form Follows Function.................................................................................8.3Printing Your Plan..................................................................................................................8.4

Printing Tables ......................................................................................................................8.11Printing Charts......................................................................................................................8.12Export ......................................................................................................................................8.13The PowerPoint® Presentation ......................................................................................8.16Web Options as Output .....................................................................................................8.18
Chapter 9: Planning for ImplementationThe Human Side of Implementation ...............................................................................9.3Plan-vs.-Actual – PREMIER version...............................................................................9.3
Chapter 10: Advanced TablesCustomizing Formulas in Tables ....................................................................................10.3Examples – Custom Formulas........................................................................................10.3Range Names.......................................................................................................................10.9Linking Tables .....................................................................................................................10.10Examples – Linking Tables.............................................................................................10.10Customized Formulas and Tables ...............................................................................10.13Insert New Tables (PREMIER version) ......................................................................10.13Sensitivity Analysis (PREMIER version)....................................................................10.20Dealing with Scenarios (PREMIER version) ............................................................10.21Subscriptions or Churn Rate Forecasts (PREMIER version).............................10.23Additional Resources .......................................................................................................10.26Conclusion: It’s Your World ............................................................................................10.26
Chapter 11: Working with Microsoft Office®Office® vs. Marketing Plan Pro® – Comparisons ....................................................11.3Working with Microsoft Word® .......................................................................................11.5Working with Microsoft Excel® .......................................................................................11.9Working with Microsoft PowerPoint® .........................................................................11.14
Chapter 12: Working with QuickBooks®For QuickBooks® Pro or QuickBooks® Premier ......................................................12.3Matching the Categories ...................................................................................................12.4The QuickBooks Pro Import ............................................................................................12.6After the QuickBooks Import..........................................................................................12.11Developing Your Plan, After the Import......................................................................12.13Developing and Managing Budgets ............................................................................12.14

MARKETING PLAN PRO MANUAL
Appendix A: Range Names .......................................................................A.1
Appendix B: Collaboration........................................................................B.1
Appendix C: Import and Export Components.........................................C.1
Index

1Installation
Installation............................................................................. 1.3
Personalize Your Software.................................................... 1.7
Registration........................................................................... 1.8
Monthly Product Update ...................................................... 1.9
Technical Support ................................................................1.11
Support Policies and Philosophy .........................................1.11
Acrobat® and Acrobat® Reader are registered trademarks of Adobe Systems Inc.
Internet Explorer® and Windows® are registered trademarks of Microsoft Corporation

This chapter describes how to install Marketing Plan Pro®, your registration options, and how to obtain product updates from our website.
Once you’ve completed this chapter, we recommend you continue with Chapter 2: Getting Started, which gives you an overview of the working screens in the program and its resources.
Also, Chapter 3: Guided Tour, walks you through the process of creating a marketing plan. It gives you a chance to try out the features of the program before you start your own plan.
CHAPTER 1: INSTALLATION
1.3
CHAPTER 1: INSTALLATION
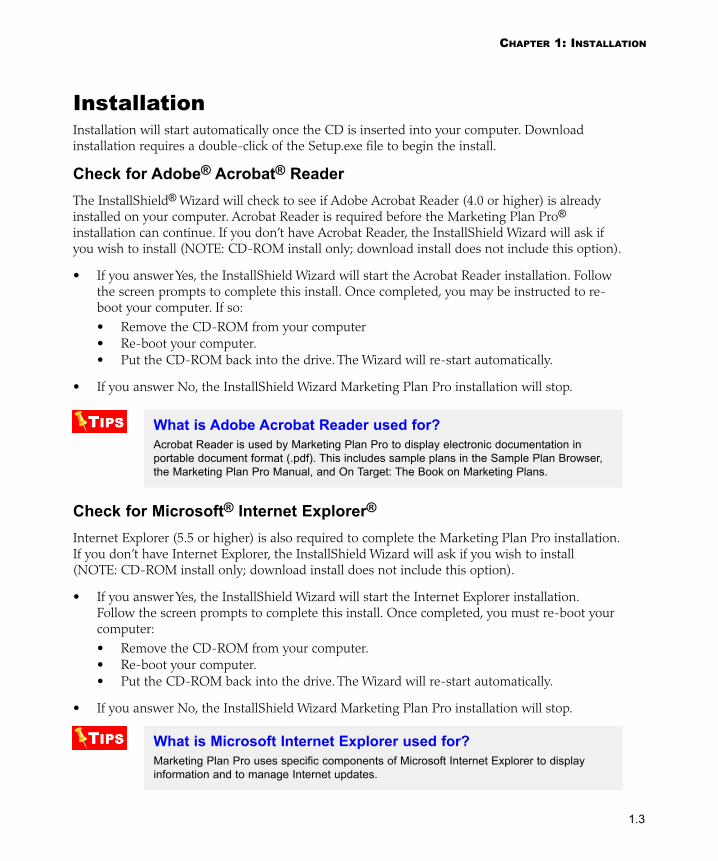
InstallationInstallation will start automatically once the CD is inserted into your computer. Download installation requires a double-click of the Setup.exe file to begin the install.
Check for Adobe® Acrobat® ReaderThe InstallShield® Wizard will check to see if Adobe Acrobat Reader (4.0 or higher) is already installed on your computer. Acrobat Reader is required before the Marketing Plan Pro® installation can continue. If you don’t have Acrobat Reader, the InstallShield Wizard will ask if you wish to install (NOTE: CD-ROM install only; download install does not include this option).
• If you answer Yes, the InstallShield Wizard will start the Acrobat Reader installation. Follow the screen prompts to complete this install. Once completed, you may be instructed to re-boot your computer. If so: • Remove the CD-ROM from your computer• Re-boot your computer. • Put the CD-ROM back into the drive. The Wizard will re-start automatically.
• If you answer No, the InstallShield Wizard Marketing Plan Pro installation will stop.
What is Adobe Acrobat Reader used for?Acrobat Reader is used by Marketing Plan Pro to display electronic documentation in portable document format (.pdf). This includes sample plans in the Sample Plan Browser, the Marketing Plan Pro Manual, and On Target: The Book on Marketing Plans.
Check for Microsoft® Internet Explorer®
Internet Explorer (5.5 or higher) is also required to complete the Marketing Plan Pro installation. If you don’t have Internet Explorer, the InstallShield Wizard will ask if you wish to install (NOTE: CD-ROM install only; download install does not include this option).
• If you answer Yes, the InstallShield Wizard will start the Internet Explorer installation. Follow the screen prompts to complete this install. Once completed, you must re-boot your computer: • Remove the CD-ROM from your computer.• Re-boot your computer. • Put the CD-ROM back into the drive. The Wizard will re-start automatically.
• If you answer No, the InstallShield Wizard Marketing Plan Pro installation will stop.
What is Microsoft Internet Explorer used for?Marketing Plan Pro uses specific components of Microsoft Internet Explorer to display information and to manage Internet updates.

MARKETING PLAN PRO MANUAL
1.4
After Adobe Acrobat and Internet Explorer installations are confirmed:
1. The Setup Welcome screen will display:
• Click the button.
2. The Electronic License Agreement screen will display:
• If you accept, click the button.

1.5
CHAPTER 1: INSTALLATION
3. The Destination Folder screen will display:
• Click the button to continue.
4. The Ready to Install the Program screen will display:
• Click the button to begin.

MARKETING PLAN PRO MANUAL
1.6
5. The program files will be copied:
6. Once the files have been copied, the Installation Complete screen will display:
• Click the button to close the screen. ______________________________________
This completes your program installation.

1.7
CHAPTER 1: INSTALLATION
Personalize Your SoftwareWhen you start Marketing Plan Pro the first time, you will be asked to personalize your software:
• Fill in your Name and a Company Name (if applicable) and email address. • Type in the serial number (The serial number is located on the back of the CD-ROM
case). Use no spaces when typing; type the number 0, not the letter O.
• Click the button to continue.
You will then be given the option to register your product, as described in the next section.
How to Locate Your Serial Number1. If you purchased from our online store, the serial number was sent via email. 2. If you purchased from a retail store, your serial number is located on the back of the CD-ROM case. Once you have completed the Personalization step, your serial number and name will display from within Marketing Plan Pro. You can view this information from the Help menu > About ...

MARKETING PLAN PRO MANUAL
1.8
RegistrationOnce your software has been personalized, you’re given the option to register online (you will need an Internet connection to use this function):
Follow the prompts and fill in the requested information.
Please register your software. You can also register from our website or use the registration card included in the program box. The benefits of registration include notification of software updates, access to special offers, and free technical support.
Registration OptionsYou can access the Register function at any time from the Help > Register command. In addition to online registration, you can also send it as either a fax or standard mail. See the contact information on the Technical Support page at the end of this chapter.

1.9
CHAPTER 1: INSTALLATION
Monthly Product Update Periodically, we create updates to our program’s current version. Updates are free to all registered users. When you install Marketing Plan Pro (and each month thereafter), the Update Product screen will ask if you want to download the update file:
• Click the button to continue.
The installed version number will be compared to the latest update:
• Click the button to continue.
A Progress screen will display showing how much of the download has been completed.

MARKETING PLAN PRO MANUAL
1.10
Once the update file has been downloaded, the following screen will display.
• Click the button.
The update file will open, and execute the update of your program. We recommend you perform an update each month to assure that you have the latest update for your version.
Special Notes about Product Update:• This function can be accessed at any time from the Tools > Update Product command.• Product Updates are different from Upgrades. Updates deal with optimizing the current version. An Upgrade is a new version of the program.

1.11
CHAPTER 1: INSTALLATION
Technical SupportWe make every effort to provide prompt, professional support for our registered users. Telephone support is available from 8:30 a.m. to 4:30 p.m. (U.S. Pacific time) on normal business days. Email messages and faxes are usually answered within a single working day.
Telephone: 1-541-683-6162
Please be at your computer when you call, have your system on and be ready to work with the software. Have your serial number available.
Fax: 1-541-683-6250
Please make sure your fax number is plainly visible on your fax to us. Unless you specify some other fax number, we will send our response to the fax number that sent the original message.
Email:
Internet: [email protected]
America Online: Pasware
Internet Technical Support Answers to our most common technical questions can be found at:
http://www.paloalto.com/support.
Online Technical SupportThe Help > Palo Alto on the Web > Technical Support command provides a direct link to the online Technical Support database, as well as our other website resources.
Support Policies and PhilosophyOur product support offers registered users professional answers, to the best of our ability, to questions regarding the installation, use, and normal operation of our software. Support focuses mainly on operating the software, such as and including installation, opening, saving, and printing. Support does not deal with the contents of a marketing plan.

MARKETING PLAN PRO MANUAL
1.12
This page intentionally blank.

2Getting Started
Starting Marketing Plan Pro®................................................ 2.3
EasyPlan Wizard® .............................................................. 2.5
Working with Text.................................................................. 2.6
Working in Table Mode ......................................................... 2.7
Charts are Automatic ............................................................ 2.8
Printing is Automatic ............................................................. 2.8
Getting Help .......................................................................... 2.8

Chapter 2: Getting Started
This chapter introduces you to the EasyPlan Wizard®, Text, Table and Chart screens that you work in, and other resources available in the program.
Marketing Plan Pro® provides help in many forms throughout the program. These will be described.
CHAPTER 2: GETTING STARTED

2.3
CHAPTER 2: GETTING STARTED
Starting Marketing Plan Pro®In a standard installation, a shortcut icon will be stored on your computer Desktop area, and a menu link will be created from the Start button. Choose either method to start the program:
Shortcut Icon Double-click the Marketing Plan Pro icon from the Desktop.
Start menu1. Click the Start button.2. Highlight Programs > Marketing Plan Pro 2003
You can use the Windows Start button to access the program menu.
Opening Screen
You start with the opening screen, shown in Figure 2-1.

MARKETING PLAN PRO MANUAL
2.4
FIGURE 2-1: START A PLAN SCREEN
From the opening screen, you can create a new plan or open an existing plan.
When you’re first getting started...Choose Create a new Marketing Plan and let the EasyPlan Wizard walk you through each step of the planning process.
Start Options from the Open Screen: 1. Create a new Marketing Plan: Starts a new plan using the EasyPlan Wizard. 2. Open an existing plan: Lets you choose from your previously-created and saved plan files.
A list of files will display in the dialog box. The More Files... option will let you search for files in other directories.

2.5
CHAPTER 2: GETTING STARTED
EasyPlan Wizard® The EasyPlan Wizard is designed to lead you through the entire process of writing your plan. From writing your text to entering numbers into the tables, the EasyPlan Wizard tasks provide a step-by-step process, plus instructions and examples. Figure 2-2 shows the Plan Setup screen.
FIGURE 2-2: EASYPLAN WIZARD PLAN SETUP SCREEN
Use the buttons to move through the tasks.
EasyPlan Wizard - Put it to work for you!From start to finish, the EasyPlan Wizard is with you all the way. Its screens ask questions, give suggestions, provide Instructions and Examples, as well as feedback as you complete a section of your plan. Think of the EasyPlan Wizard as your personal assistant.NOTE: Additional information on the EasyPlan Wizard can also be found in Chapter 4: Starting Your Plan.

MARKETING PLAN PRO MANUAL
2.6
Working with TextMuch of your marketing plan is text. The text is organized into text topics. You work on text topics from the Text Mode screen, shown in Figure 2-3.
FIGURE 2-3: TEXT MODE
This example shows Wizard Tasks, Instructions and the text window for the Mission topic.
Instructions and Examples Instructions for the current topic display automatically. Click the Examples link to show text for the same topic from a completed plan. Example text can also be copied into the current topic.

2.7
CHAPTER 2: GETTING STARTED
Working in Table ModeThe Table Mode screen is a spreadsheet format, with columns, rows and formulas to automatically calculate totals as you enter your numbers. An example is shown in Figure 2-4.
FIGURE 2-4: TABLE MODE
The EasyPlan Wizard Tasks and Instructions display with the table screen for Sales Forecast.
Instructions and Examples Instructions for the current table display automatically. Click the Examples link to show the same table from a completed plan.
MARKETING PLAN PRO MANUAL
2.8
Charts are AutomaticAll of the charts in Marketing Plan Pro are automatically linked to tables. When you fill in your tables, your charts will start to show data.
Printing is AutomaticMarketing Plan Pro will print out a plan with an automatic format.
• It merges the text, tables, and charts into a professional-looking format. This includes automatic indenting of paragraphs and formatting of topic titles. Bullet points and numbered lists can be added to your text topics through the formatting toolbar.
• It prints the monthly tables as Appendices.• It creates a Table of Contents.• It has a standard cover sheet that you can customize with a company logo and standard text
formatting.• An optional legal page can be included. Basic text on confidentiality is provided with the
template. • A Print Preview option lets you see the plan document before you print.
For more details on your Print options, please see Chapter 8, Print and Publish, in this manual.
Getting Help• EasyPlan Wizard These screens have built-in “help” throughout. Follow the sequence of steps and let the
Wizard show you the way.
• Context-Sensitive Help
• Click on a row in a table, then click the button to see row-specific definitions. • When viewing a table in Table Mode, press the F1 key to see help specific to the table.
• How do I? Help
In the top right corner of your screen is the button. Click this button and a list of common questions will display. Select a question and a special pop-up window will display the answer.
• Links to On Target and Hurdle Planning Books Throughout the EasyPlan Wizard screens, there are a number of links to the electronic
versions of On Target: The Book on Marketing Plans and Hurdle: The Book on Business Planning. These portable document format (PDF) files will display these books in a separate window on your screen as additional reference tools for you.

2.9
CHAPTER 2: GETTING STARTED
• Planning Resources Marketing Plan Pro has other integrated planning tools and also provides links to Internet
resources to help you in developing your plan. Use the Tools > Resources menu or click the
button to access these features.
FIGURE 2-5: RESOURCES PAGE
The Resources Page gives you access to many additional tools for building your plan.

MARKETING PLAN PRO MANUAL
2.10
This page intentionally blank.

3Guided Tour
Tour Overview....................................................................... 3.3
Practice Working in Text Mode ............................................. 3.6
Practice Working in Table Mode ........................................... 3.8
Sales Forecast ...................................................................... 3.9
Expense Budget.................................................................. 3.14
The Rest of the Tables........................................................ 3.18
Charts are Automatic .......................................................... 3.18
Printing is Automatic ........................................................... 3.19

Chapter 3: Guided Tour
This Guided Tour will develop a business plan for a hypothetical graphics company. The Tour will give you practice in how to input your text and tables. It will also demonstrate the importance of reviewing your numbers as you develop your plan and making modifications as necessary.
CHAPTER 3: GUIDED TOUR

3.3
CHAPTER 3: GUIDED TOUR
Tour OverviewSo, you’re just starting Marketing Plan Pro® for the first time? This chapter will help to get you started. The first section is a general overview of the working modes (Text, Table, and Chart). Our Guided Tour will walk you through an example of how to create a business plan. We’ll hit the highlights to get you started.
Who should take the Tour?This step-by-step Tour can introduce you to the basics of the program and the process of writing a marketing plan. If you prefer to start immediately on your own plan, please go to Chapter 4, Starting a Plan.
If you take the Tour, you will work with the following features:
1. Starting Marketing Plan Pro2. Starting a Plan
• Introduction to the EasyPlan Wizard®
• Saving your plan to file3. Working with Text Topics
• Navigate between topics• Choose a topic from the Plan Outline• View Instructions and Examples for a topic• Type text for a topic• Overview of text formatting
4. Working with Tables• Show Row and Column Headings• Edit Row Labels• Enter numbers in key tables• Copy cells across columns• View linked tables
As you create a plan for this hypothetical graphics company, you will also see how (and why) it’s important to make adjustments to your table numbers as you develop your plan.
For purposes of this Tour, we will start a new plan using the default EasyPlan Wizard settings.
1. Start Marketing Plan Pro.2. Choose Create a new > Marketing Plan from the Opening dialog screen.3. Click on the Wizard Tasks button to display the EasyPlan Wizard in the left column.
Your screen should look like Figure 3-1.

MARKETING PLAN PRO MANUAL
3.4
FIGURE 3-1: TOUR: SET VIEW SETTINGS
As part of this Tour, we will be working with the EasyPlan Wizard and the Plan Outline screens. The tool buttons at the top of the screen let you switch between the Wizard Tasks or the Plan Outline while you work.
Start a New Plan—Follow the EasyPlan WizardFor the purpose of this Tour, we are jumping from text to tables to demonstrate each Mode. However, when you are starting your plan, we recommend that you follow the sequence of the EasyPlan Wizard Tasks.
Choosing default settings for Plan Setup
Each question in the Plan Setup section of the EasyPlan Wizard has a “default” answer. For the purpose of this Tour, we will accept all but one of these default settings. The Starting Date will become January, 2003.
• Click the Plan Setup check box in the EasyPlan Wizard list. This shortcut will automatically choose the default answer for each question.
• Then, select the Starting Date and choose January, 2003.

3.5
CHAPTER 3: GUIDED TOUR
There should now be check marks for each topic in the Plan Setup, as shown in Figure 3-2.
FIGURE 3-2: ACCEPTING DEFAULT SETTINGS
Check marks show that each question in the Plan Setup section has been answered.
Customized vs. Default EasyPlan Wizard QuestionsWhen starting your own plan, we recommend you read each question and choose the answer that best fits your business type, so the EasyPlan Wizard can create a customized outline and tables. Choose the default if you’re not sure how to answer. You can change it later.

MARKETING PLAN PRO MANUAL
3.6
Practice Working in Text ModeWe will type text for our topic called Mission, create a standard paragraph, and a numbered list.
View Instructions and Examples for this Topic
1. Click on the button to show the EasyPlan Wizard tasks in the left column:2. Click on Mission.
The Instructions/Examples frame should now display, as shown in Figure 3-3.
FIGURE 3-3: INSTRUCTIONS/EXAMPLES FRAME
Instructions and examples are automatically displayed for each topic, table, and chart.
3. Click on the Examples link to see an example from a completed plan.
For more information: Please review Chapter 5: Your Plan Text, to learn more about working in Text Mode.
Type into Topic Screen
We will now type text for our Mission topic. Once completed, it will look like Figure 3-4.

3.7
CHAPTER 3: GUIDED TOUR
FIGURE 3-4: TYPING INTO A TOPIC SCREEN
Let the built-in formatting handle your paragraphs. Use the bullet list and numbered list tools from the toolbar.
Click the mouse into the text window and create the following text with a numbered list:
1. Type: Our mission:
2. Press the <ENTER> key.
3. Click the numbered list tool from the toolbar and type the following:
To give our clients real value: good graphics, good design, excellent results. Press Enter.
To create and enjoy a healthy, stimulating, challenging work environment, based on fairness, teamwork, and creativity. Press Enter.
To make a fair profit and maintain a financially healthy business.
4. Clicking the Previous Task or Next Task buttons will move you along in your plan.

MARKETING PLAN PRO MANUAL
3.8
Practice Working in Table ModeIn the next portion of our Tour, we will be working in Table Mode. Follow along with the examples here for an overview of how the tables work.
Click View > Tables > Sales Forecast to open the Sales Forecast table.
Setting Table Options
The column headings (A, B, C, etc.) and row headings (1, 2, 3, etc.) should be visible (the program default). If they are not we will use the Tools > Options > Table Options command to show row and column headings along the top and left sides of the spreadsheet:
1. Click on Tools from the menu list at the top of the screen.2. Select Options > Tables... 3. The Table Options dialog box will display, as shown in Figure 3-5.
FIGURE 3-5: TABLE OPTIONS DIALOG
Showing column and row headings shows you the cell locations when working in Table Mode.
4. Check the boxes to show table row and table column headings.5. Click the button to save the setting change.
Other Table Options Currency Format: Changes currency to match Windows-based settings. Font Settings: Lets you change the font style and size for cell input in your table.

3.9
CHAPTER 3: GUIDED TOUR
Sales ForecastIn the Sales Forecast table, you will learn to create a row label, type in a cell value, and copy that cell number across the row.
Sales Forecast Wizard (with Forecaster Tool)The Sales Forecast Wizard dialog automatically pops up whenever you select the Sales Forecast table. It includes the unique Forecaster tool, which lets you click the mouse to draw a line for your monthly forecast, instead of just typing numbers into the cells. For the purpose of this tour, we will manually enter numbers.
If you are not already in the Sales Forecast Table, select the Sales Forecast table from the Wizard Tasks, as shown in Figure 3-6.
FIGURE 3-6: TOUR - SALES FORECAST IN TABLE MODE
You can also use the View > Tables menu and select from the table list. Once in Table Mode, the list of tables can be accessed direct from the Table toolbar.

MARKETING PLAN PRO MANUAL
3.10
Typing Row Labels1. Select the first monthly column, January (Jan), of sales. Click the mouse into that cell (C3). 2. Click on the Edit > Row Label command. A dialog box will display. 3. Type Graphic Services as the row label, as shown in Figure 3-7.
FIGURE 3-7: ROW LABEL DIALOG
Use the Row Label command to create row labels.
The row label will display in Column A. Figure 3-8 shows the results.
FIGURE 3-8: SALES ROW LABEL
Cell A3 shows the new row label, Graphic Services.

3.11
CHAPTER 3: GUIDED TOUR
Type in a Cell Value
For the purpose of this Tour, we will enter sales and costs of sales numbers for our newly-titled row, Graphic Services. The company is estimating a 20% increase in sales each month. Their cost of sales is set at 5% of their sales for each month.
To create this Sales Forecast, we will enter the first month’s sales number, then use the Edit > Fill > Series command to automatically increase sales by a factor of 1.2 across the row. For our estimated cost of sales, we will use a formula to calculate 5% of the monthly sales. We will then use the Edit menu > Fill > Right command to repeat this formula across the row.
Fill RightThe Edit > Fill > Right command gives you an easy way to fill in a whole row of numbers with a simple growth rate. Try it!
Inputting Sales Numbers1. Set your first month’s (January) sales value to 1000.2. Using your mouse, highlight the monthly cells in that same row (cells C3 through N3).3. From the Edit menu, choose Fill > Series command.
Figure 3-9 shows the dialog box asking for Fill Right with growth figure.
Figure 3-9: Fill Right with Growth Factor of 1.2
This growth factor will create a formula that automatically increases monthly sales by 20%.
4. Set that growth figure as 1.2 5. Click the button.
Your Graphic Services sales row should show that sales for each month increased by 20% from the previous month. February is $1,200, March is $1,440, etc., across the row.
Figure 3-10 will show the final input to the row.

MARKETING PLAN PRO MANUAL
3.12
FIGURE 3-10: SALES INPUT WITH GROWTH FACTOR
A simple sales forecast has one row each for Sales and Direct Cost of Sales.
Now that we have our sales numbers entered, we’ll create our cost of sales.
Inputting Cost of SalesFor Cost of Sales, we will use a spreadsheet formula that calculates the cost to be 5% of the sales for that month. The formula is: =.05*C3
This formula multiplies the January sales number in cell C3 ($1,000) by .05. The cost of sales for January calculates to be $50 (cell C8).
To create this formula and repeat it across the row:
Under the section, Direct Cost of Sales:1. Use the Edit menu > Edit Row Label and type Graphic Services for Row 8.2. Type =.05*C3 into cell C8. The cost of sales for January should now show as $50.3. Highlight cells C8 through N8.4. Use the Edit > Fill > Right command to repeat this cost of sales formula for each month.
Now, check your Cost of Sales numbers for Graphic Services. January should be $50, February is $60, March is $72, etc., as shown in Figure 3-11.

3.13
CHAPTER 3: GUIDED TOUR
FIGURE 3-11: COST OF SALES INPUT
The row label in cell A8 shows in the edit bar portion of the screen.
You have now successfully created a sales forecast for your Graphic Services row.
Do You Know Spreadsheets?The financials in Marketing Plan Pro are built on the foundation of a powerful computer spreadsheet, rather than a simple template, built into the application. If you know how to use spreadsheets, you will be happy to discover how much Marketing Plan Pro has in common with Microsoft Excel®. Use the Tools > Options > Tables settings to set row and column headings so they show, and you will discover compatibility with more than 100 Excel functions.

MARKETING PLAN PRO MANUAL
3.14
Expense BudgetNow we will enter numbers into the Expense Budge table. To move from the Sales Forecast to Expense Budget table, we will use the pull-down menu located on the left side of the toolbar, as shown in Figure 3-12.
FIGURE 3-12: PULL-DOWN LIST FOR TABLES
When working in Table mode, the pull-down list on the toolbar is a quick way to move from one table to another.
• Use your pull-down list from the toolbar and select Marketing Expense Budget.• The Instructions and Examples in the EasyPlan Wizard window have switched to Expense
Budget as shown in Figure 3-13.

3.15
CHAPTER 3: GUIDED TOUR
FIGURE 3-13: EXPENSE BUDGET TABLE
The Expense Budget table is where you list the expenses you have planned for implementing your marketing programs.
The Expense Budget table contains a section for expenses. We will rename a row, insert a new row, and then delete a row.
Rename a Row For this Tour, we will use the Edit > Row Label command to rename a row.
• Find the first empty expense row titled Name me and rename it Advertising.

MARKETING PLAN PRO MANUAL
3.16
Insert a Row
To demonstrate how to add additional rows to this, or any table, we will use the Insert > Rows command to insert a row for Promotion expenses:
1. Position the cursor on the next row titled Name me. 2. Use the Insert > Rows command. An “Inserted Row” will now display above the unnamed
row and the Edit Row Label dialog is opened.3. Type Promotion as the row label and click the OK button.
Your new expense row is now in place.
Delete an Expense Row
To demonstrate how to remove rows from a table we will delete the row titled Name me:
1. Click anywhere in the row labeled Name me. 2. Select the Edit > Delete > Rows command. 3. The software will ask you to confirm that you want to delete the row (deleting a row can’t be
undone).4. Click the button to delete that row.
When to Delete an Expense RowIf you’re not sure if you need a preset expense row, we recommend you keep it in the table. It will show a $0 value and will have no affect on your other table numbers. It’s easy to go back later and delete unused rows.
Input Expenses
Now that our expense rows are in place, let’s enter numbers:
1. Go to cell C12, the Advertising expense for January. Type in 500. Press Enter.2. Highlight the cells C12 through N12. 3. Use the Edit > Fill > Right command to copy the number in C12 to the selected cells. 4. Repeat these steps and enter the following expenses:
Promotion = 100Other = 50
Your Expense Budget table should look like Figure 3-14.

3.17
CHAPTER 3: GUIDED TOUR
FIGURE 3-14: INPUTTING EXPENSES IN THE EXPENSE BUDGET TABLE
This view shows the expenses entered for the Expense Budget.
Hide Row(s) and Column(s) in a tableIt can be helpful to temporarily “hide” a row or column in order to see multiple areas in a table. This is not the same as deleting a row or column. A hidden column still exists. To hide a row or column highlight a cell from the row or column to hide. Choose Format > Hide Row or Hide Column. To reverse this function, use Format > Show Row or Show Column.

MARKETING PLAN PRO MANUAL
3.18
The Rest of the TablesWith your main table input completed, you can take a moment to visit the other tables.
1. Break-even Analysis shows what sales a company needs to equal its expenses and “break even” in a given month.
2. Market Analysis is where a company estimates its potential customer base and what percentage of growth they hope to achieve for their plan.
Both of the above tables are still empty, but you can fill those in later. You have instructions for those in Chapter 6, Your Plan Tables.
3. Milestones is where you list the key tasks to accomplish in order to achieve your goals. Including a date of completion and estimated budget for each task will help you measure the success of your goals. The Milestones table is critical to business planning, but not hard to understand.
4. You can use your Plan Outline tool to see the other tables included in the plan. The other tables you see depnd on the plan options you chose in the EasyPlan Wizard Setup phase, and whether you have the Pro or the PREMIER version.
Chapter 6 Covers All the TablesFor the complete details on all the tables included with Marketing Plan Pro, turn to Chapter 6, Your Plan Tables. For Advanced help on the spreadsheet programming facilities included, turn to Chapter 10, Advanced Tables.
Charts are AutomaticAll of the charts in Marketing Plan Pro are automatically linked to tables. As you fill in your tables, your charts will start to show data.
Chapter 7 Covers All the ChartsFor the complete details on key charts included with Marketing Plan Pro, turn to Chapter 7, Your Plan Charts.

3.19
CHAPTER 3: GUIDED TOUR
Printing is AutomaticMarketing Plan Pro will print out a plan with an automatic format.
• It merges the text, tables, and charts into a professional-looking format. This includes automatic indenting of paragraphs and formatting of topic titles. Bullet points and numbered lists can be added into your text topics through the formatting toolbar.
• It prints the monthly tables as Appendices.• It creates a Table of Contents.• It has a standard cover sheet that you can customize with a company logo and standard text
formatting.• An optional legal page can be included. Basic text on confidentiality is provided with the
template. • A Print Preview option lets you see the plan document before you print.
For complete details on your Print options, please see Chapter 8, Print and Publish, in this manual.
Chapter 8 Covers Printing Your PlanFor the complete details on all of the print options included with Marketing Plan Pro, turn to Chapter 8, Print and Publish.
Congratulations! You have completed the Guided Tour. We hope you found the Tour helpful in understanding the process of creating a marketing plan.
The other chapters in this manual are written to give detailed background on working in Marketing Plan Pro and getting the most from its features.

MARKETING PLAN PRO MANUAL
3.20
This page intentionally blank.

4Starting a Plan
EasyPlan Wizard® ................................................................ 4.3
Sample Plan Browser™ ........................................................ 4.7
Caution on Using Sample Plans......................................... 4.10
Make it Your Own................................................................ 4.10

Chapter 4: Starting a Plan
This chapter will describe the different options available for getting started on your marketing plan. These options include:
1. EasyPlan Wizard®
2. Sample Plan Browser™
CHAPTER 4: STARTING A PLAN

4.3
CHAPTER 4: STARTING A PLAN
EasyPlan Wizard®
Marketing Plan Pro® was designed to develop any marketing plan from scratch, customizing the outline and structure for the type of business, and guiding you through the process. That’s why we designed the EasyPlan Wizard. Let the EasyPlan Wizard guide you through the questions, set up your plan, and take you through the plan from beginning to end.
EasyPlan Wizard Introduction
When you start a new plan, the EasyPlan Wizard Plan Setup screen displays, as shown in Figure 4-1.
FIGURE 4-1: EASYPLAN WIZARD INTRODUCTION
The Plan Setup section introduces you to the EasyPlan Wizard and how to get started.
• Click the buttons to move through the Wizard screens.

MARKETING PLAN PRO MANUAL
4.4
As you continue with the EasyPlan Wizard, the Plan Setup section asks you a series of questions. Each question on the form includes details about how to answer it.
FIGURE 4-2: EASYPLAN WIZARD PLAN SETUP QUESTIONS
The EasyPlan Wizard Plan Setup section asks questions about your business to help set up your plan.
Based on your answers to the Plan Setup questions, the EasyPlan Wizard will match your type of business. The final question asks for a plan title. This can be your company name, the name of the project, etc. Figure 4-3 shows an example.
If you’re not sure how to answer an EasyPlan Wizard question...Each question provides a “default” answer. In many cases, the EasyPlan Wizard will describe the default answer in its description.If you’re not sure how to answer a question, simply accept the default for now. You can always come back later and change it.

4.5
CHAPTER 4: STARTING A PLAN
FIGURE 4-3: EASYPLAN WIZARD MARKETING PLAN TITLE
The plan title will automatically print at the top of every page of your marketing plan.
Once all questions are answered, the Congratulations screen will display, as shown in Figure 4-4.
FIGURE 4-4: EASYPLAN WIZARD CONGRATULATIONS SCREEN
When you click the Save button, a dialog box displays. The “default” filename is the plan title you entered earlier. This is the final step in the Plan Setup section of the EasyPlan Wizard.

MARKETING PLAN PRO MANUAL
4.6
Once the Plan Setup section questions have been completed and the file has been saved, the next EasyPlan Wizard task is Your Company, shown in Figure 4-5.
FIGURE 4-5: EASYPLAN WIZARD - YOUR COMPANY
Now that the key assumptions have been set from the initial questions, you’re ready to start working on your plan.
Starting a New Plan from a Sample Plan
Marketing Plan Pro includes a wide variety of sample marketing plans, and more are added regularly. They are provided primarily to give you ideas, show you what a finished plan looks like, and explain the process by example. We have created a tool to simplify accessing these plans for review and/or use. It’s called the Sample Plan Browser.

4.7
CHAPTER 4: STARTING A PLAN
Sample Plan Browser™The Sample Plan Browser can be accessed by pressing the button in the toolbar at the top of your screen. The Browser will open in a separate window from the program. The primary benefit of the Sample Plan Browser is to make it easy to search our extensive sample plan library for plans that match your business’ marketing needs.
The Sample Plan Browser lets you:
1. Read plan summaries for a quick overview of a plan. 2. Sort plans by category.3. Print a plan to discuss and review with others. 4. Copy and paste text from the Browser screen into a new plan document. 5. Open a working copy of a sample plan to edit and adapt as a starting point for your
plan.
Figure 4-6 shows the Sample Plan Browser screen.
FIGURE 4-6: SAMPLE PLAN BROWSER
The Browser screen is divided into the Sample Plan List and the PDF viewing screen.

MARKETING PLAN PRO MANUAL
4.8
Refresh the Sample Plan ListWe are continually adding and updating our sample plans. If you have an Internet connection, you can download the most current list from our website:
• From within the Browser use the Tools > Refresh List command.• Figure 4-7 shows this menu option.
FIGURE 4-7: REFRESH SAMPLE PLAN LIST
With an Internet connection, you can download the latest sample plan list.
Opening a Sample Plan in Marketing Plan ProIf, after reviewing a plan in the Sample Plan Browser, you want to open a working copy of it in Marketing Plan Pro:
• Use the File > Open plan... command from the Sample Plan Browser.• Figure 4-8 shows this menu option.
FIGURE 4-8: OPEN SAMPLE PLAN
Use this menu command to open a working copy of a sample plan in Marketing Plan Pro.
Import Plan...Components of files from other selected programs (topic text and selected tables) can be imported into a marketing plan. See the section on Import a File in Chapter 5: Your Plan Text, for more information.

4.9
CHAPTER 4: STARTING A PLAN
Use Save-As to Create a New Plan
If you decide to open a sample plan as a starting point for your own plan, you will need to save it under a new filename. The File > Save As dialog box lets you specify a new filename and choose a directory in which to save it.
FIGURE 4-9: SAVE AS DIALOG BOX
Make sure your filename is easy to remember. Avoid spaces and periods as part of the name. Marketing Plan Pro will automatically attach an extension to the filename (.mpd). This extension designates it as a “marketing plan database” file.
Non-Profit Sample Plan
? To Learn more about... Search the Help Index for... Non-profit (nonprofit) sample plans
non-profit, nonprofit, sample plans
Update Plan Setup in the EasyPlan Wizard
If you start with a sample plan, you will need to go through the Plan Setup section in the EasyPlan Wizard to customize the plan for your particular business (start-up vs. ongoing, pay on credit, etc.), and in particular, to change the Plan Title (described earlier) which will print at the top of every page of your plan.

MARKETING PLAN PRO MANUAL
4.10
Caution on Using Sample PlansWith this version of Marketing Plan Pro, we offer over 75 different sample marketing plans as part of the product. We try to offer a good mix of common types of businesses. However, there are potential benefits and cautions about sample plans:
Benefits: • If a sample plan serves as an example, that’s good. You don’t need an exact match to see
how a sample plan covered a market analysis or product/service list.• If you use a sample plan as a starting point or head start, that can be good too, but
develop your own plan, not somebody else’s plan. • Samples are also good for generating ideas. Look how somebody else segmented their
market, and it may help you segment your own.
Cautions:• Marketing Plan Pro is designed to create your marketing plan, not just copy an existing
plan. You don’t need a sample plan to start with. • If you don’t find a sample plan exactly like your business, don’t worry. Just follow the
EasyPlan Wizard, answer the questions, and you’ll have a marketing plan. That’s what Marketing Plan Pro was designed for.
• Every business is unique. No sample plan really works for another businees if it is copied without modification. Don’t expect that to happen.
• Your plan should represent YOU, YOUR idea, YOUR company, in YOUR community.
Make it Your OwnIf you do decide to start with a sample plan, make sure you go over every word, and every number. Make it truly your own plan. That will make it a good compromise between the value of starting points and examples, and the importance of ending up with your own plan.

5Your Plan Text
Standard Text Format ........................................................... 5.3
Working in Text Mode ........................................................... 5.7
The Plan Outline ................................................................... 5.9
Working with HTML Formatting ...........................................5.11
Import a File ....................................................................... 5.12
Insert a Graphic Image ....................................................... 5.14
Insert a Text Table............................................................... 5.15
Insert a Character Symbol .................................................. 5.16
Insert Hyperlink ................................................................... 5.17
Modify Plan Outline for Different Situations........................ 5.18
About Marketing Writing ..................................................... 5.19

Chapter 5: Your Plan Text
Your marketing plan isn’t a doctoral thesis or a piece of expository writing. It’s a plan. Ultimately its purpose is guiding decisions.
CHAPTER 5: YOUR PLAN TEXT

5.3
CHAPTER 5: YOUR PLAN TEXT
Standard Text FormatWhen people talk about a “professional” or “appropriate” format for a marketing plan, they mean a format that makes the content easy to read and follow. There is no true standard format for a marketing plan. You can use any text size, font, page size, and page layout that works.
Automatic Merge of Tables and Charts with Topics
Unlike Microsoft Word®, Marketing Plan Pro® automatically merges tables and charts with the topic outline and creates an excellent layout that is easy to read and thoroughly professional. It also prints cover pages, legal pages, tables of contents, and table appendices.
Automatic Text Formatting
Marketing Plan Pro is designed to do the text formatting for you. However, in order to do all the page formatting automatically, Marketing Plan Pro is not as fully flexible and programmable as the more powerful word processing packages. If you work with it, not against it, you’ll get better results.
• Avoid tabs for indenting (the program automatically indents paragraphs .5 inches from their topic title).
• Avoid carriage returns at the end of each line. This will cause uneven flow of text when printing.
• Use the built-in text formatting toolbar when:
• Creating bullet point lists and numbered lists wherever the content fits.
• Increasing or decreasing the indent of text when you want to add emphasis.
Automatic Text FormattingMarketing Plan Pro is designed to do the formatting for you. Concentrate on content, don’t try to arrange formatting beyond what’s readily available in the program. Use the HTML formatting built in for bullet points, lists and tables. Work with it, not against it, and you’ll get better results.

MARKETING PLAN PRO MANUAL
5.4
Sample Text Formatting Page
Figure 5-1 shows an example of a simple text page format (no table or chart) prepared using the automatic formatting built into Marketing Plan Pro.
FIGURE 5-1: MARKETING PLAN PRO STANDARD TEXT FORMAT
The standard text page has topics set apart and points in bullet and/or numbered lists. Writing is simple and clear, and the format makes it easy to access.

5.5
CHAPTER 5: YOUR PLAN TEXT
Sample Format – Including Tables and Charts with Text Topics
Marketing Plan Pro will automatically put tables and charts together on the page, merged with the text topics that refer to them. Figure 5-2 shows an example.
FIGURE 5-2: MARKETING PLAN PRO PAGE WITH TABLE & CHART
The ideal format merges table highlights and business charts on the same page with the text that refers to them.
MARKETING PLAN PRO MANUAL
5.6
Numbers and Charts are Essential
The numbers in a marketing plan are essential. Any normal plan shows sales forecast, marketing expense budget, and contribution margin. Most plans include the full range of financial tables covering all facets of marketing, from break-even to market analysis to milestones.
Your format should make these numbers easy to access and read, because they are an essential part of the plan. Generally a plan puts the main numbers into the text where the reader can find them easily as reference points. Putting the details into an appendix is acceptable.
Business graphics are an excellent way to display numbers. Most marketing plans include charts of the main financial projections, because charts are easier to read and interpret at a glance than long columns of numbers. Numbers are often attached in detail in appendices, while main concepts are included as charts.
Insert Tables and Charts
The Insert icon from the Plan Outline toolbar lets you insert text topics, and attach tables and charts to topics as part of your final printed plan. See the Plan Outline section later in this chapter for more information on the Plan Outline toolbar.
Charts vs. Tables linked to Text
Consider including only the charts in the text, and leaving all the numbers for the appendices. This isn’t the Marketing Plan Pro standard, but it can be a pleasant presentation. Use the Plan Outline to unlink tables from text topics, leaving only charts.
But before text formatting can begin, you must enter your text. And that’s done from the Text Mode screen.

5.7
CHAPTER 5: YOUR PLAN TEXT
Working in Text ModeThe Text Mode screen is where you write text for each topic in the outline. Figure 5-3 shows an example of the Text Mode screen.
FIGURE 5-3: TEXT MODE SCREEN
Text Mode provides a formatting toolbar for common text attributes, such as bold, underline, and italic, etc.
Formatting Toolbar
The formatting toolbar displays near the top of the Text Mode screen. It provides icons for commonly-used text formatting, text alignment and numbered and bullet list generation.
Use the tools in the formatting toolbar to change the appearance of your text paragraphs.
MARKETING PLAN PRO MANUAL
5.8
Instructions and Examples
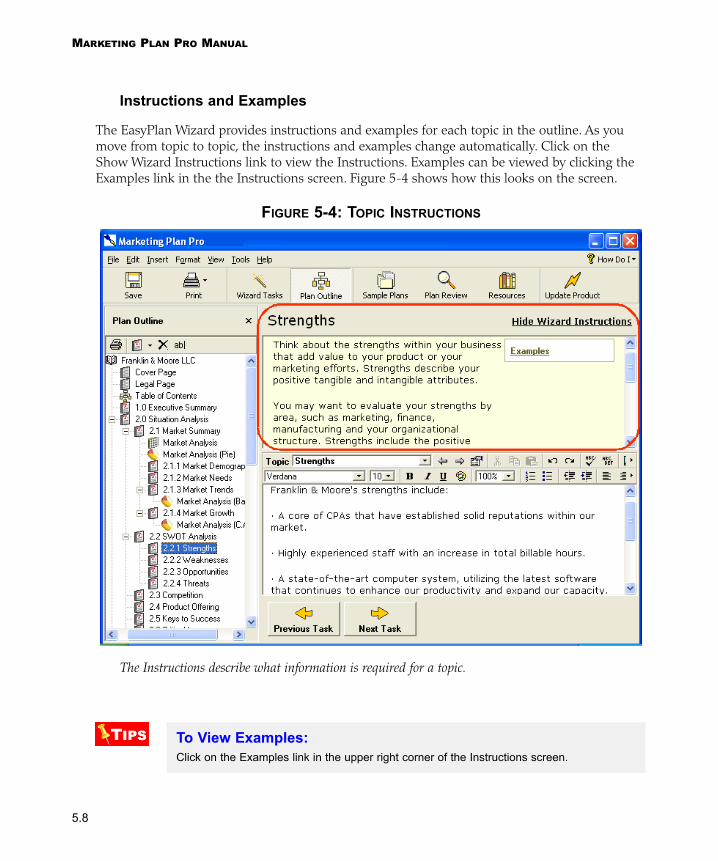
The EasyPlan Wizard provides instructions and examples for each topic in the outline. As you move from topic to topic, the instructions and examples change automatically. Click on the Show Wizard Instructions link to view the Instructions. Examples can be viewed by clicking the Examples link in the the Instructions screen. Figure 5-4 shows how this looks on the screen.
FIGURE 5-4: TOPIC INSTRUCTIONS
The Instructions describe what information is required for a topic.
To View Examples:Click on the Examples link in the upper right corner of the Instructions screen.

5.9
CHAPTER 5: YOUR PLAN TEXT
The Plan Outline The standard Marketing Plan Pro outline includes up to five chapters and approximately 30 separate topics, depending on your EasyPlan Wizard options. The EasyPlan Wizard creates this topic outline for you. In addition you can add new topics of your own to cover pertinent information unique to your marketing plan. Figure 5-5 shows the main chapters in the Plan Outline.
FIGURE 5-5: PLAN OUTLINE CHAPTERS
The Plan Outline includes toolbar buttons for adding new topics or deleting existing topics.

MARKETING PLAN PRO MANUAL
5.10
Changing the Plan Outline
You can change the outline. Use the Plan Outline toolbar, located at the top of the outline screen, to make the following changes.
The Plan Outline toolbar lets you print, insert topics, tables/charts, delete items which will not be included in the printed plan, and rename topic titles:
= Print a Topic
Click the Print tool to print the highlighted topic and any Notes associated with it.
= Insert a Topic
Highlight a topic; click the Insert Topic tool. Type in the name of the new topic.
= Delete
Highlight the topic to delete and click the Delete tool.
= Rename a Topic
Highlight a topic; click the Rename tool; type the new name.
Caution on Deleting a Topic from the Outline!Be careful. All sub-topics below a deleted topic will be deleted as well. Once the topic is deleted, the outline will automatically renumber the remaining topics.

5.11
CHAPTER 5: YOUR PLAN TEXT
Working with HTML Formatting Marketing Plan Pro uses a simplified version of Hypertext Markup Language (HTML), the text formatting code used on the Internet. Marketing Plan Pro uses HTML tags for font name, font size, ordered lists, bullet lists, and basic table tags as well.
The HTML Editor screen can be displayed by clicking the H icon on the far right of the text toolbar. Figure 5-6 shows an example of the HTML Editor screen for a numbered list.
FIGURE 5-6: NUMBERED LIST IN HTML EDITOR
This is basic HTML code, the same as what is used to program Internet Web pages.
Figure 5-7 shows how the text above displays in the normal text screen.
FIGURE 5-7: NUMBERED LIST IN STANDARD TEXT MODE
This is the screen you normally see when working on the topics in Marketing Plan Pro.
Learn HTML ElsewhereWe don’t believe extensive discussion of HTML is appropriate here, because Marketing Plan Pro assumes you will stay in the standard text mode while the background tools manage your numbered lists, bullet lists, and paragraph formats. If you would like to learn more about HTML coding, there are HTML tutorials readily available from the Internet.

MARKETING PLAN PRO MANUAL
5.12
Import a File If you are currently using other Palo Alto Software products, you can import selected text topics and tables into your marketing plan file. If these programs are installed in your computer, the File > Import menu will display the Import Wizard, shown in Figure 5-8.
FIGURE 5-8: IMPORT WIZARD
The program name list will vary depending on which programs you have installed.
Once you select a program, you can then select the file to import. A list of tables and topics lets you choose some or all to import. Figure 5-9 shows an example of importing from another Marketing Plan Pro file.

5.13
CHAPTER 5: YOUR PLAN TEXT
FIGURE 5-9: IMPORT DIALOG BOX
Use the Browse button to locate and select the file to import.
Once the file is selected, you can select the tables and/or topics from the file to be imported. Figure 5-10 shows an example.
FIGURE 5-10: SELECTING TABLES/TOPICS TO IMPORT
Use the list to select the table and topics to import.

MARKETING PLAN PRO MANUAL
5.14
Insert a Graphic ImageGraphics created outside of Marketing Plan Pro can be linked to a text topic and included with your plan. The graphic formats supported are .jpg, .gif, .bmp, and .wmf.
Figure 5-11 shows an example of selecting a logo graphic to be inserted into the Cover Page.
FIGURE 5-11: INSERT GRAPHIC IMAGE INTO TEXT TOPIC
Use the Insert Image feature to further enhance your text outline with graphics.
To access this feature:
Use the Insert > Image command, or click the button from the toolbar.

5.15
CHAPTER 5: YOUR PLAN TEXT
Insert a Text Table This feature is recommended to create a text column table format within a topic. It is a good alternative to using the Tab key to create a multiple-column text list because tabbed columns don’t always align properly when printed. Typing your text into the table cells will assure that columns will be aligned when printed. Figure 5-12 shows the dialog and Figure 5-13 shows an example of a 2-column, 6-row table.
FIGURE 5-12: INSERT TEXT TABLE DIALOG
Text can be typed into each cell of the table and the text will “wrap” within the column’s margins. The Alignment option places text as left, right, or centered within the cell.
FIGURE 5-13: INSERT TEXT TABLE - EXAMPLE
This example shows a 2-column, 6-row text table with left alignment within the cells.

MARKETING PLAN PRO MANUAL
5.16
Insert a Character SymbolMarketing Plan Pro makes it easy to insert symbols into your text topic. Common symbols such as copyright, register, and trademark are just a few examples of available symbols. Figure 5-14 shows an example using the copyright symbol.
FIGURE 5-14: INSERT A SYMBOL IN TEXT
The Show Character Map icon on the toolbar makes it easy to insert a symbol into your text.
To see the Character Map screen:
• Click from the toolbar, or choose Insert > Symbol command.
To Superscript a symbol:
• Highlight symbol; use the button from the toolbar.

5.17
CHAPTER 5: YOUR PLAN TEXT
Insert HyperlinkWith Internet access available, this function lets the reader click on the caption and the link will connect and display the website address.
This feature was created especially for use with the HTML features of Marketing Plan Pro. Figure 5-15 shows an example of a website link within a text topic. The Insert Hyperlink dialog box lets you type a website address. The caption is placed in the text topic at the cursor position. It displays in an underlined and colored highlight.
FIGURE 5-15: INSERT A LINK EXAMPLE
This dialog also lets you create links for email addresses, file transfer protocol (ftp:) and many other HTML codes.
To access the Insert Hyperlink feature:
• Choose the Insert > Hyperlink command, or click the button from the toolbar.
Adjust Your Own PlanYou can see from these examples that you want to adjust your plan to your exact context. Use the text formatting features to enhance the readability of your text, but don’t skimp on solid content and well researched information.

MARKETING PLAN PRO MANUAL
5.18
Modify Plan Outline for Different SituationsAre you writing your marketing plan for investors? Are you looking to expand? Are you looking to sell your business? To buy a business? There are many reasons for writing a marketing plan and the topic outline and corresponding text, tables, and charts should target specifics to match the purpose. Here are examples of outline revisions to consider for different kinds of planning situations.
A Plan for Investors
Investors have a legitimate concern about the success of your business. They are risking their money, and expect a reasonable return. The marketing plan should show an accurate understanding of the target market and present a well thought out strategy for communicating to that market and motivating purchase of the company’s products or services. The marketing budget should be well developed.
A Plan to Buy or Sell a Business
Whether you are buying or selling a business, you should have every expectation that the business will succeed. That means attracting customers, and that means marketing. If you are selling a business your maketing plan should convince the potential buyer that the business has and will continue to have customers. If you are buying a business you should develop your marketing plan with diligence and realistic expectations. You want to be sure you have a target market and way of reaching that market that can support your business.
An Operations Plan
The operations plan is an example of a specific marketing plan context that frequently involves deleting some topics included in the standard outline. Many operations plans will not include the extensive summaries for instance, because the plan is internal and there is no need for taking the extra time to describe what everyone already knows.
Many operations plans will either skip the discussion of organizational structure, or include it only if the operations plan involves making changes to the team. This type of marketing plan is focused tightly on strategy, tactics and implementation.
An Expansion Plan
The expansion plan is another example of a specific marketing plan context where deleting some topics included in the standard outline may produce a better plan.
In an expansion plan you want to emphasize the new market, or new product or service. You’ll need extensive research into the new markets, trends, needs and how the new products or services meet these needs. For the marketing team, focus on the expansion implementation and what resources will be necessary to accomplish that.
5.19
CHAPTER 5: YOUR PLAN TEXT
About Marketing WritingMarketing writing should be clear, concise, and easy to read. Short sentences are better than long. A one-page memo is usually better than a 10-page memo. Here are some suggestions when writing your plan:
1. Proofread and edit your work. Better still, have somebody else, who didn’t write it, read it. Even if you don’t care about spelling, others do. Check your spelling. The built-in spell checker in Marketing Plan Pro won’t catch errors such as “there” instead of “their.”
2. Be concise. Make your point and go on. 3. Do not use phrases such as “I feel,” “I think,” “I believe,” and “in my opinion.” They weaken
your effectiveness.4. Avoid using unnecessary words, such as “really” and “very,” that don’t add value.5. Avoid unexplained lists. Numbered lists are good when used with explanations. 6. Use bullet points, but within text, not in headlines or captions.
Keep it Simple
A marketing plan is about results, and it should be practical. Keep it simple. When in doubt, simplify. Use formatting that enhances its readability.

MARKETING PLAN PRO MANUAL
5.20
This page intentionally blank.

6Your Plan Tables
Microsoft Excel® is a registered trademark of Microsoft Corporation. QuickBooks® is a registered trademark of Intuit Corporation.
Spreadsheet Overview.......................................................... 6.3
Developing Your Own Links.................................................. 6.8
Forecaster............................................................................. 6.9
Tables, One by One............................................................ 6.10
Break-even Analysis..................................................... 6.10
Channel Analysis (PREMIER version) ......................... 6.12
Channel Forecast (PREMIER version) ........................ 6.13
Competitive Analysis (PREMIER version).................... 6.14
Contribution Margin (PREMIER version) ..................... 6.15
Growth and Share Analysis (PREMIER version) ......... 6.17
Historical Data (PREMIER version) ............................. 6.19
Market Analysis ............................................................ 6.20
Market Demographics .................................................. 6.24
Marketing Expense Budget ......................................... 6.25
Milestones .................................................................... 6.30
Sales Forecast ............................................................. 6.32
Main Help for General How-to-Use Information ................. 6.38

Chapter 6: Your Plan Tables
CHAPTER 6: YOUR PLAN TABLES
This is the business age of numbers. You can’t really develop a marketing plan without including believable numbers.
Marketing Plan Pro® is intended to help you meet the numbers demands without getting bogged down in the mechanics.

6.3
CHAPTER 6: YOUR PLAN TABLES
Spreadsheet OverviewThe linked budget and forecasting tables in Marketing Plan Pro® provide you with a very powerful tool for projecting your sales, expenses, and related market demographics. Chapter 6 takes you through all of the standard tables included. These tables are all part of a built-in spreadsheet that can make all the financial calculations you need for your marketing plan. In the Marketing Plan Pro PREMIER version you can even add worksheets and use them as you would any other spreadsheet (Microsoft Excel, Lotus 1-2-3, or Works) to customize your plan.
Referring to Cells and Ranges
Spreadsheets are based on a matrix, the mathematical name for a layout that has rows and columns. Rows are always horizontal, columns vertical.
As we work with spreadsheet formulas in Marketing Plan Pro, we’ll refer to cells the way most spreadsheet software does, with their row and column notation. The cell in the fourth column of the fifth row, for example, is cell D5. We refer to blocks of cells by showing the upper left first and the bottom right last, separated by a colon. So the range that goes from B5 to N10 will be written as B5:N10.
The Spreadsheet View: Row and Column HeadingsSpreadsheet row numbers and column letters don’t automatically show in your tables because Marketing Plan Pro doesn’t need them for standard default handling. However, you can go to the Tools > Options > Tables menu to set them to show.
Data Cells vs. Locked Cells
Data Cells
With a few exceptions, green cells are unlocked. You can input data, formulas, or text.
Locked Cells
Marketing Plan Pro prevents accidental errors by locking important formula cells. All black cells are locked. They contain formulas, so you can’t type into them. When you try, an error message tells you that these cells can’t be changed.
This locking is done on purpose, and for your benefit. It preserves the links between tables, such as the Sales Forecast table to the Expense Budget table. The same is true for certain row labels. For example, in the Expense Budget table, the row named “Gross Margin” is defined as Sales less Cost of Sales. Since the formula can’t be changed, the label shouldn’t be changed either. Nobody would want Gross Margin to be accidentally renamed to Net Margin or Profit Margin or Contribution Margin or anything else.

MARKETING PLAN PRO MANUAL
6.4
For More Help on How to Use the Tables
This manual chapter is your main resource for understanding the financial and forecasting tables included in Marketing Plan Pro. It begins with important background information related to marketing planning and forecasting, and then goes through each of the tables one by one with more detail, explanations, tips, and examples. However, this manual is not the main resource for the program’s general help and details which are available elsewhere in the program. The last pages of this chapter have more information on how to access this help.
Wizard Instructions and Examples
Table-specific instructions and examples are included in the EasyPlan Wizard® instructions.
FIGURE 6-1: WIZARD INSTRUCTIONS
The EasyPlan Wizard includes instructions (highlighted in the illustration) and examples for every table. These are your main source for information about using the tables.

6.5
CHAPTER 6: YOUR PLAN TABLES
? To Learn More About... Search the Help Index for...Viewing Table Instructions and Examples Wizard Instructions
Detailed Row-by-Row Help
Row-by-row help includes detailed explanations for each row in the table. You can right-click the mouse in any row and select row-by-row help from the menu to open a detailed explanation.
FIGURE 6-2: ROW-BY-ROW HELP
In Marketing Plan Pro Row-by-row help gives you details for the row you’ve selected, throughout the tables. You can access row-by-row help by right-clicking on a cell.
? To Learn More About... Search the Help Index for...Table row explanations and usage Row-by-row help
Formula Backstep
The Formula Backstep feature helps you find the source information for table formulas. You can choose to switch tables to find the source information for a formula. For example, when you see

MARKETING PLAN PRO MANUAL
6.6
a formula referring to the name “Sales,” Formula Backstep lets you jump from any table to the table that contains the source range named “Sales.” In Figure 6-3, the reference is to “average_per_unit_revenue” in the selected cell below. Right-click the mouse to show the Formula Backstep option.
FIGURE 6-3: FORMULA BACKSTEP
The Marketing Plan Pro Formula Backstep feature gives you the option of jumping to other ranges used in cell formulas. You can access this feature by right-clicking on a cell.
? To Learn More About... Search the Help Index for...Find source of table formula components Formula Backstep
Add or delete topics, tables, charts Plan Outline
Within this manual we’ll be looking at these points and showing you how to adjust and perfect your specific plan, using the knowledge of the programmability of Marketing Plan Pro.

6.7
CHAPTER 6: YOUR PLAN TABLES
Planning with Computers
Computers don’t think, they just do the numbers. Computers are very dumb contraptions that can be downright dangerous when you expect them to think for you. They are absurdly literal, and, worse still, literal in their own very narrowly defined language. If you want to program a computer to tell you that 2+2=5, do so and it will swear that 2+2=5.
Use your marketing projections but don’t believe them—especially when dealing with computers and software. Because there is something magical about neatly ordered rows and columns of numbers shining at you through a computer screen or marching from the printer, you may forget how meaningless they really are.
So use the dumb thing for what it does well. You do the thinking, let the computer do the numbers, and the division of labor will work wonders. Remember the origins of the spreadsheet, back with the pencils and green lined paper, and think in those terms; you’re still in that realm, but now you’ve got a tireless worker to change your numbers instantly. Now that’s power.
The best analyst uses human judgement to guide the number crunching. If you accept the great split between rational, analytic thinking and intuitive, creative thinking, then you probably realize the best work requires a little of both. Use your head to guide the analysis.
How do you get the right combination? Change factors repeatedly. Each new iteration of the plan is another go at understanding a problem, each is another possibility to be considered. The world is far too complex for simple answers. Solving problems is akin to recording stereo albums: the artist sings multiple tracks into a single tape and magnifies and multiplies the voice and voice effects. The more angles considered, the better the understanding of the final product and its alternatives. Look at your marketing plan at many different volumes, at many different prices, at many different kinds and levels of expense, and the set of numbers you finally accept will be a better representation of the full range of possibility.
There is an irony here. The best market forecasters use a lot of computer models, but they don’t believe them. Output from different models stimulates thinking about alternatives, causes and effects, and different outcomes, but output is not to be believed, just considered.
Words and NumbersA complete marketing plan needs both words and numbers. You can’t tell the whole story with words alone, and you can’t tell it with just numbers either. Make sure the numbers match the words.

MARKETING PLAN PRO MANUAL
6.8
Developing Your Own LinksBecause Marketing Plan Pro is built on its own Microsoft Excel® compatible spreadsheet it includes the facility to use more than 100 spreadsheet functions compatible with Microsoft Excel. For example, you can easily link a row in the Expense Budget to a specific row in the Sales Forecast, for calculating commission payments to employees or outside representatives.
Users of the PREMIER version can also link from the user-defined tables into the tables for sales, expenses, or any other table. You can create specific worksheets for a second year in months, for example, or three years in quarters, or for a 10-year plan. You can create worksheets to itemize capital expenses, or detail depreciation, or to break payroll burden into components.
Since the background is a complete spreadsheet, as programmable as the major spreadsheets, there’s very little you can’t do. If you use an Excel function exactly as it would work in Excel®, it will probably work the same in Marketing Plan Pro.
The details are explained in Chapter 10, Advanced Tables, of this manual. There you’ll find detailed instructions, background information, and examples with illustrations. A complete list of range names is included in Appendix A.
Make it YoursRemember, nothing about Marketing Plan Pro is written in stone…you change formulas, revise formulas, ignore the built-in tables, or even (with the PREMIER version) add your own Excel-compatible tables…it’s your plan. You can also unlink tables so they don’t show. Use the Plan Outline view to add and delete topics, unlink tables, and—if you have the PREMIER version—add tables.
Navigation Tip:You can also use the Views menu to select any of the tables included in your plan. Once you have a table displayed, you can use the table dropdown in the tool bar to switch to any other table. Also, to display any topic, table, or chart, click on its name from the Plan Outline screen.
Tables Aren’t Strictly SequentialDon’t expect to finish one table before starting another. Normally you’ll go back and forth among the tables, revising as you go. It doesn’t really go one table at a time.
? To Learn More About... Search the Help Index for...Spreadsheet/table features Add tables (PREMIER version)
Linking tablesSpreadsheet formulasSpreadsheet overview

6.9
CHAPTER 6: YOUR PLAN TABLES
ForecasterSometimes it’s easier to develop a forecast using graphics tools. When you’re in a table working on developing a forecast, you can go to the Edit > Forecaster command to pop up this unique Marketing Plan Pro graphic forecasting tool. Figure 6-4 shows an example.
FIGURE 6-4: THE FORECASTER™
The Forecaster™ tool lets you develop your forecast by clicking the mouse and changing the line. It’s quick and powerful, and built into the tables. Access it on the Edit menu or by right-clicking in a cell.
You can set growth rates by typing values in the Forecaster month cells, or click the mouse in the graph to draw in a forecast.

MARKETING PLAN PRO MANUAL
6.10
Tables, One by One
Break-even AnalysisThis table lets you determine what you need to sell, monthly or annually, to cover your costs of doing business—your break-even point. Figure 6-5 shows the break-even analysis included with Marketing Plan Pro.
Do the Break-even Table TwiceDo the break-even table twice: first, with educated guesses for assumptions, as part of the initial assessment, and later on, using your detailed Sales Forecast and Expense Budget numbers. Both are valid uses.
FIGURE 6-5: BREAK-EVEN ANALYSIS
The Break-even table gets data from Sales Forecast and Expense Budget; you can override formulas and type your own assumptions.
Some Built-in Problems
The break-even analysis is not our favorite analysis because:
• It is frequently mistaken for the payback period, the time it takes to recover an investment. There are variations on break-even that make some people think we have it wrong. The one we do use is the most common, the most universally accepted, but not the only one possible.
• It depends on the concept of fixed costs, a hard idea to swallow. Technically, a break-even analysis defines fixed costs as those costs that would continue even if you went broke. Instead, you may want to use your regular running fixed costs, including payroll and normal expenses. This will give you a better insight on financial realities. We call that “burn rate” these post-Internet days.

6.11
CHAPTER 6: YOUR PLAN TABLES
• It depends on averaging your per-unit variable cost and per-unit revenue over the whole business.
However, whether we like it or not, this table is a mainstay of financial analysis. You may choose to leave it out of your own marketing plan, but Marketing Plan Pro would not be complete without it. And, although there are some other ways to do a Break-even Analysis, this is the most standard.
Developing Break-even Assumptions
T he Break-even Analysis depends on three key assumptions:
• Average per-unit sales price (per-unit revenue): This is the price that you receive per unit of sales. Marketing Plan Pro gets this value from your Sales Forecast, but leaves the cell unlocked so you can change it, and type in your own assumption if you choose. Unless the forecast is based on units (PREMIER version only), Marketing Plan Pro makes the per-unit revenue $1 and puts your costs as a percent of a dollar. The most common question about this input relates to averaging. “How can I produce a single estimate for this when I have so many different products?” The answer to this question is that the analysis requires a single number, and if you can just fill in your Sales Forecast first, then Marketing Plan Pro will calculate it for you automatically. And, if it makes you feel better, remember that you are not alone in this, the vast majority of businesses sell more than one item, and have to average for their Break-even Analysis.
• Average per-unit variable cost: This is the incremental cost, or variable cost, of each unit of sales. If you manufacture goods, this is the cost of materials and production per unit. If you buy goods for resale, this is what you paid, on average, for the goods you sell. If you sell a service, this is what it costs you, per dollar of revenue or unit of service delivered, to deliver that service. Marketing Plan Pro gets this assumption from your Sales Forecast, but leaves the cell unlocked so you can override if you want. As with the previous assumption, this one also generates questions related to having to average across the whole business. Fill in your Sales Forecast and Marketing Plan Pro will do this for you automatically.
• Estimated Monthly Fixed Cost: Technically, a Break-even Analysis defines fixed costs as costs that would continue even if you went broke. Instead, we recommend that you use your regular running fixed costs, including payroll and normal expenses (total monthly Operating Expenses). This will give you a better insight on financial realities. For this input, if averaging and estimating is difficult, just fill in your Expense Budget table and Marketing Plan Pro will calculate a working fixed cost estimate automatically—it will be a rough estimate, not necessarily to the exact detail level some financial analysts would want, but it will provide a useful input for a conservative Break-even Analysis.
Formula UnlockedThis formula feature is unlocked in Marketing Plan Pro, so you can change it. If you want to do a simple break-even analysis as part of an initial assessment, for example, you can just type in your numbers.

MARKETING PLAN PRO MANUAL
6.12
Break-even and Units-Based Forecasts (PREMIER version)
If you have a units-based forecast, the automatic formula in break-even will pick up the unit assumptions from your sales forecast. Instead of setting the sales unit as 1 and picking up the percent of variable cost, it will calculate the average per-unit price by dividing total sales by total units, from your sales forecast. It also calculates the average per-unit variable cost from the sales forecast, dividing total cost of sales by total units. Figure 6-6 shows an example.
FIGURE 6-6: UNITS-BASED BREAK-EVEN CALCULATIONS
The example here shows units-based break-even that Marketing Plan Pro PREMIER calculates automatically, from the units-based sales forecast.

6.13
CHAPTER 6: YOUR PLAN TABLES
Channel Analysis (PREMIER version)This is the first of several charts that only appear when you have Premier version and you use the plan setup to establish the need. One plan setup question asks whether you market in channels, or not. If you do, you see the table shown in Figure 6-7.
FIGURE 6-7: CHANNEL ANALYSIS TABLE (PREMIER ONLY)
The channel analysis is simple data input, setting basic attributes of the channels. It appears only if your PREMIER version plan is set for companies that deal with channels.

MARKETING PLAN PRO MANUAL
6.14
Channel Forecast (PREMIER version)The channel forecast is set for projecting total sales, in units, through the various channels of distribution. Figure 6-8 shows an example.
FIGURE 6-8: CHANNEL FORECAST TABLE
The channel forecast includes pre-programmed growth rates, which you can override with typed data entry.
Growth Rates
You can change the channel forecast if you want, because formulas are not protected, but normally it works by setting a starting number for the present year (the first year of the plan) in the third column, and a growth rate in the second column. The growth rate automatically applies to the second through the fifth year, using automatic formulas, unless you type over those formulas and replace them with either your own estimates, or a different formula. Type the starting market number as a number, and the growth rate as a percent value.
Compound Average Growth Rate (CAGR)
The CAGR is a standard formula which counts only the first and final values, without regard to the intervening values. The Market Analysis table uses the compound average growth rate (CAGR) formulas to determine the average growth rate. The formula is:
CAGR = (last/first)^(1/years)-1
In the example in Figure 6-8, there are four years of growth. In this forecast the growth years are 2003, 2004, 2005, and 2006. So if you clicked in cell H4 for example, you would see that the CAGR portion of the formula in that cell is =(G4/C4)^(1/4)-1

6.15
CHAPTER 6: YOUR PLAN TABLES
Competitive Analysis (PREMIER version)The competitive analysis is a simple table that you can use to show a quick competitive overview in a relatively small space. Figure 6-9 shows an example. You can adjust row names with the Edit Row Label command, and insert additional rows, or delete existing rows. The underlying strategy of this comparison is to convert concepts to numbers, so you assign numeric grades to each competitor for each of the competitive factors listed. This way you stick to simple data elements, because they will work much better within the table format. So we assign variables and then set values to the variables.
FIGURE 6-9: COMPETITIVE ANALYSIS
The competitive analysis lists some common bases for comparison, to be used as numeric variables to compare different companies.
As you look at the table in the illustration, you can see that the logic assumes that you type the competitors’ names into the name area in row 3, and these are duplicated in the different subsections.

MARKETING PLAN PRO MANUAL
6.16
Contribution Margin (PREMIER version)Contribution margin is a measure of marketing expenses compared to sales and gross margin. Figure 6-10 shows a simple contribution margin table. It collects sales and direct costs of sales from the sales forecast, adds additional costs of sales, then calculates gross margin. Then it lists sales and marketing expenses, and subtracts those from gross margin to calculate contribution margin. The formula for contribution margin, as used in Marketing Plan Pro, is:
contribution margin = (gross margin - sales and marketing expenses)/sales
FIGURE 6-10: CONTRIBUTION MARGIN (PREMIER ONLY)
The Contribution Margin is a reading of marketing expenses in relation to sales and gross margin.
Evaluating Your Contribution Margin.Contribution margin, although very useful, is not a standard number produced by available industry financial statistics. Look mainly for changes over time. In some industries you’ll be able to get data for comparison, and in some you won’t.
The Marketing Expense budget shown in this table is the same budget you see in the Expense Budget table. The Contribution Margin table is actually looking at the same table you see in the expense budget, but has a larger view. As you work with this table, you can adjust sales and marketing expenses directly, changing both the expense budget and the contribution margin at the same time.

6.17
CHAPTER 6: YOUR PLAN TABLES
Unfortunately, contribution margin is not the most standard concept in business finance, and may mean different things to different people. In Marketing Plan Pro, we use contribution margin as gross margin less sales and marketing expenses. You may encounter different definitions in different business situations.
As you work with this table, remember that the budgeting function is the same as in the main marketing expenses table. You are dealing with the same numbers, and the same place, just a different view.

MARKETING PLAN PRO MANUAL
6.18
Growth and Share Analysis (PREMIER version)The Growth and Share Analysis offers a visual view of the competition for three important factors: price, market share, and growth rate. Figure 6-11 shows an example from the Computer Reseller (AMT) sample plan, with growth and share numbers for several competitors.
FIGURE 6-11: GROWTH AND SHARE ANALYSIS (PREMIER ONLY)
The Growth and Share Analysis tracks average price, average growth rates, and market share for a group of competitors.
This table also serves as the source data for several important charts giving your plan a visual comparison of these same important factors. Figure 6-12 shows the Growth and Share chart that displays growth rate on the vertical axis, average price on the horizontal, and the market share as the size of the circle.
The Growth and Share table is also the source for charts comparing each of the three factors in bar charts: growth, pricing, and share.

6.19
CHAPTER 6: YOUR PLAN TABLES
FIGURE 6-12: GROWTH AND SHARE CHART
The Growth and Share chart marks competitive position of various competitors. Growth rate is on the vertical axis, average price on the horizontal, and market share is indicated by the size of the circle.

MARKETING PLAN PRO MANUAL
6.20
Historical Data (PREMIER version)The historical data table provides a useful overview of past results. Figure 6-13 shows an example. Most of the information on that table is simple data entry, a few of the items are calculated from other items.
FIGURE 6-13: HISTORICAL DATA (PREMIER ONLY)
The historical data table is mostly data entry.
For the cells that are calculated by formulas, you can of course click on any cell and see the formula used. As with all tables, there is also row-by-row help for every row.

6.21
CHAPTER 6: YOUR PLAN TABLES
Market AnalysisPotential Customers, not Actual Customers
In Marketing Plan Pro Market Analysis looks at the total potential market, usually divided into segments. Normally this is total potential market, not total actual customers. This is a market forecast and not a sales forecast, so it should focus not on customers you already sell to, and not on the portion of the total market you expect to sell to, but rather on the whole market.
For example, in the sample market analysis shown in Figure 6-14, the total market is 67,000 possible customers in 2003. The sample comes from a pizza restaurant, and the total potential market in this case is the total population of a local community. As you can see in the illustration, that includes several thousand college students, single individuals, and families. Normally the accompanying text in the plan has to explain the segmentation scheme, why and how the potential market groups are divided.
FIGURE 6-14: MARKET ANALYSIS
The Market Analysis table estimates potential customers, not actual customers.
No Fewer Than Two RowsIn the Market Analysis table, you can’t have fewer than two rows. The logic involves SUM formulas that need to have a top row and a bottom row. If you need to delete a row, delete the middle row of the three starting rows.
Growth Rates
You can change the market analysis if you want, because formulas are not protected, but normally it works by setting a starting population for the present year (the first year of the plan) in the third column, and a growth rate in the second column. The growth rate automatically applies to the second through the fifth year, using automatic formulas, unless you type over those formulas and replace them with either your own estimates, or a different formula. Type the starting market number as a number, and the growth rate as a percent value.

MARKETING PLAN PRO MANUAL
6.22
Compound Average Growth Rate (CAGR)
The CAGR is a standard formula which counts only the first and final values, without regard to the intervening values. The Market Analysis table uses the compound average growth rate (CAGR) formulas to determine the average growth rate. The formula is:
CAGR = (last/first)^(1/years)-1
In the example in Figure 6-14, there are four years of growth. In this forecast the growth years are 2004, 2005, 2006, and 2007. So in cell H4 for example, the CAGR portion of the formula in that cell is =(G4/C4)^(1/4)-1 .
Market Research and Market Forecasting in On Target: The Book on Marketing PlansMake sure you read the Gathering Information and Forecasting sections of your On Target book, which explain this in greater detail. Use the Tools > Resources > Books > On Target link to read the book in PDF format.
Inserting and Deleting Rows
Additional rows can be inserted within the middle section of the Market Analysis table by selecting the Edit > Insert Row command. You can’t delete the top or the bottom rows of this table because of the underlying SUM formulas. You can, however, transfer data from any middle row to the top or bottom, then delete that middle row.
? To Learn More About... Search the Help Index for...Adding rows to a table Insert rows
Removing rows from a table Delete rows
Unprotected Formulas
Figure 6-15 shows the formula for column D. It calculates this second-year value using simple math from the first-year value and the growth rate assumption in column B. In this table, the unprotected formula calculates an estimation for the second through the fifth year if you type in values for the first year and the growth rate.
This is an excellent example of an unprotected formula. It is there for your convenience, but not required. If you type data in and assumptions on your own, you can overwrite the formulas to create a different growth pattern.

6.23
CHAPTER 6: YOUR PLAN TABLES
Watch for Unprotected FormulasThe Market Analysis table is full of formulas that aren’t protected, which means that you can use them if you want, but you don’t have to use them. Instead of accepting a steady growth rate, you can just type year-by-year assumptions.
In Figure 6-15, the row labeled “Straight” is built using the pre-programmed growth formulas. Each column represents 78 percent growth from the previous year. In the row labeled “Natural,” in contrast, although the growth to 2007 is the same, none of the intervening columns follows the “Straight” row. All of the values were typed into the cells as estimates, changing the formula.
FIGURE 6-15: FORMULA VS. ESTIMATED MARKET GROWTH
Both examples have the same growth rate, but the numbers are very different.
In this case, it is important to treat the growth rate in column B, cell B4, as we did for the example. By making its growth rate equal to the growth in the last column, we avoid a logical contradiction. The overall growth rate is what’s shown in column H, the CAGR column.
In Figure 6-16 you can see how different the two forecasts are. The “Straight” (formula) forecast line curves up with a steady increase. The “Natural” (estimated) forecast line is growing faster at first and then slower later on. Notice that both forecasts get to the same endpoint, and they both have the same growth rate for the full period.

MARKETING PLAN PRO MANUAL
6.24
FIGURE 6-16: THE MARKET CONTRAST
Both lines have the same 5-year growth rate, but very different numbers.

6.25
CHAPTER 6: YOUR PLAN TABLES
Market DemographicsThe Market Demographics table holds simple text—and this should be very short text, not paragraphs—for describing important attributes of various target market groups. Figure 6-17, from the AMT sample plan, offers an example.
This table doesn’t manage long texts. Make sure to work with short, limited texts in each cell. The table doesn’t work well if you try to insert paragraphs instead of short texts; save that for the accompanying text topic.
Please also remember that the fact that a table is included in the default plan doesn’t mean that you have to include it in your plan, in every case. Sometimes this table is not appropriate, or provides no really useful information to your readers or marketing team. In that case, leave it out, and unlink it from the plan.
FIGURE 6-17: MARKET DEMOGRAPHICS TABLE
The Market Demographics table is designed for short texts to highlight main points. Don’t use it for text paragraphs.

MARKETING PLAN PRO MANUAL
6.26
Marketing Expense Budget The Expense Budget in Marketing Plan Pro is a simple list of planned expenses. You can add and delete rows as much as you need to customize your list of expenses, and, if your company works with QuickBooks, you can also import expense categories from QuickBooks. Figure 6-18 shows an example.
FIGURE 6-18: MARKETING EXPENSE BUDGET
The Marketing Expense Budget table is a useful list of projected sales and marketing expenses.
Marketing Expense Category Breakdowns (PREMIER version)
The additional category details are an option available in the PREMIER version. They depend on choices you make in the plan setup. Figure 6-19 shows the Plan Setup step offering a choice to break expenses into more detailed categories.

6.27
CHAPTER 6: YOUR PLAN TABLES
FIGURE 6-19: SELECTING EXPENSE CATEGORIES
In the Premier version, you can choose to divide expenses into three categories.
If you do choose to divide expenses into categories, the EasyPlan Wizard gives you text boxes to set up to three categories, as shown in Figure 6-20. Type your category names into the indicated areas. Remember, as you do, that longer category names will display poorly in graphics and printed versions.

MARKETING PLAN PRO MANUAL
6.28
FIGURE 6-20: SETTING EXPENSE CATEGORIES
As you set your text labels for expense categories, keep it simple. Long category names cause problems with graphs and printed tables.
In the example shown here, from the AMT Computer Reseller sample plan, expense categories are set by manager, tactic, and category. These settings are yours to choose. You could also have expenses by channel, by product, by group, by region, or any others.
Afterwards, you get additional tables to break your total expenses into each of the categories you set. Figure 6-21 shows how this works with the AMT sample plan, expenses by tactic.

6.29
CHAPTER 6: YOUR PLAN TABLES
FIGURE 6-21: EXPENSE CATEGORY DETAILS
This expense breakdown divides total expenses into selected tactics, as shown. Note the formula for “Other,” which is used to make sure the total expenses match total expenses in the whole budget.
In the illustration you can see the handling of the “Other” row, which keeps your expenses breakdown synchronized with total expenses. The “Other” category will automatically adjust to numbers in the table to make the total match. To see how that works, change the numbers in your table, and watch how the “Other” number changes automatically, leaving the total always equal to total expenses in the entire expense budget.
This is one of three additional tables, one each for the three categories. In the case of the AMT Computer Reseller sample there are tables for expenses by manager, by tactic, and by category. Those are the options set by the user in the plan setup step, as shown in Figure 6-20.
The expense division also creates automatic charts showing the expense breakdowns. Figure 6-22 shows the related chart that displays expenses by tactic. This is just one of a set of additional charts, including charts for each expense breakdown by month, and by year. Marketing Plan Pro will generate these charts automatically, if the options are set and you input the necessary data in the related tables.

MARKETING PLAN PRO MANUAL
6.30
FIGURE 6-22: EXPENSE CATEGORY CHART

6.31
CHAPTER 6: YOUR PLAN TABLES
MilestonesThe Milestones table is one of the most important in your marketing plan. It sets the plan into practical, concrete terms, with real budgets, deadlines, and management responsibilities. Please be sure to read the Keep It Alive chapter on implentation in the On Target book. That chapter focuses on the Milestones table and plan-vs.-actual management as keys to making a marketing plan real.
The table provides you with a list of activities. Each activity is assigned a starting date, ending date, manager responsible, department responsible, and a budget. As you build your marketing program and implement the plan, you can use the Milestones list to guide your management of the program and your marketing team’s efforts. Figure 6-23 shows the opening screen of the Milestones table, before entry.
FIGURE 6-23: MILESTONES TABLE
Use the Edit > Row Label command to give each milestone a unique name. Including starting and ending dates lets you track whether your goals were met during the set time frame.
Sorting on the Milestones
The Milestones table is the only table that sorts items. You can go to the Edit menu while in the Milestones table, and the Sort command is enabled. You can sort the Milestones on Start Date, End Date, Budget, Manager, or Department. This sorting facility is intended to facilitate real management.
For example, before a meeting with all managers, sort the Milestones table by date to get all the relevant milestones for that time period. Are you on budget? On time? Do you need to make any corrections?

MARKETING PLAN PRO MANUAL
6.32
Sort the Milestones on Manager to highlight the activities of each manager. Figure 6-24 shows the sorting facility.
FIGURE 6-24: SORTING THE MILESTONES TABLE
The Milestones table can be sorted by any column, allowing you to analyze current performance. This illustration was sorted by Manager.
Additional Information – Milestones (PREMIER version)
Plan-vs.-Actual
The Milestones table is probably the most important of several tables in the PREMIER version that encourage plan-vs.-actual management. One of the most important elements of managing a plan is following up on results, keeping track of your schedule and budget and to see where adjustments, if any, need to be made to stay within your plan.
Before a meeting with a manager, sort the Milestones table by manager to get all the relevant milestones together. Click on Actual and Variance tabs to see how that manager’s milestones tasks are being met. Figure 6-25 shows an example.
FIGURE 6-25: MILESTONES PLAN VS. ACTUAL VARIANCE (PREMIER ONLY)
In Variance view, the Milestones table tracks implementation, displaying the difference between what was planned and what was actually accomplished.

6.33
CHAPTER 6: YOUR PLAN TABLES
Sales ForecastForecasting is more art than science. Think of it as educated guessing. Like the weather forecast, it is a combination of knowing as much as you can about conditions and guessing what they mean for the future. You can do it. It may be hard to forecast, but it’s even harder to run a business without forecasting.
The Sales Forecast in standard Marketing Plan Pro is simple to understand. It has a group of rows for Sales, and a group of rows for Cost of Sales. Both of these sum to totals that reappear in your Expense Budget table.
More on Sales Forecast: On Target: The Book on Marketing Plans
Make sure you read the Forecast Your Sales section of your On Target book, which explains this in greater detail. Use the Resources button on the tool bar and then click the Books > On Target link to read the book in PDF format.
Figure 6-26 shows a sample sales forecast for a pizza restaurant. It has one block of rows for lines of sales, and another block for direct costs. If you have a business that has inventory, the direct costs will be equivalent to inventory in cost of sales, or cost of goods sold.
FIGURE 6-26: SALES FORECAST
The standard forecast is a simple list of sales and cost of sales.
The row names in the cost of sales area are the same as the lines of sales above, in this example. You set or change them using the Edit > Row Label command, so you can customize as much as you want. You can add and delete rows, to tailor your sales forecast to your business.

MARKETING PLAN PRO MANUAL
6.34
You may notice, in the sample forecast in Figure 6-26, that there are no sales projected for the first two months. This is not unusual in a start-up plan. The new pizza business in the sample expects to start up two months before it actually starts making sales.
Additional Information – Sales Forecast
Cost of Sales – Defined
The Sales Forecast includes Cost of Sales, as well as Sales. Cost of Sales is an important accounting concept. Sales less Cost of Sales results in Gross Margin. Analysts use it to compare different companies and different industries.
Cost of Sales for Type of Business
Cost of Sales is also called Direct Cost, and Cost of Goods Sold, depending on the type of business. Here are some concrete examples:
1. Retail. Goods that a retail business purchases and then resells to customers are the classic instance of Cost of Goods Sold. They belong in the Sales Forecast as Cost of Sales.
2. Manufacturing. Materials that a manufacturing company buys as raw materials for the manufacturing process are Costs of Goods Sold, or Cost of Sales, or Direct Unit Costs. In this case these terms are virtually interchangeable.
3. Service. Service businesses do have Costs of Sales. Accountants and attorneys have photocopying and research. Transportation businesses have fuel, maintenance, and drivers. News publications have the cost of newsprint and editors.
Ask an AccountantThe distinction between cost of sales and operating expenses is important, but sometimes subtle. In many cases the accountants make a determination based on judgement and experience. Your accountant may have an opinion in your case.
The Units-Based Forecast (PREMIER version)
In the PREMIER version of Marketing Plan Pro, the Sales Forecast can actually be one of two possible forecasts. You select one or the other using the EasyPlan Wizard, either when you start a new plan, or after that, by selecting Plan Setup from the File menu. The first of the two, and the simplest, is called the Value-based Sales Forecast. It has a group of rows for Sales, and a group of rows for Cost of Sales. (This is the only sales forecast included in standard Marketing Plan Pro.) The second, called the Units-based Sales Forecast, projects Units, Price Per-unit, Sales, Cost Per-unit, and Costs. Figure 6-27 shows an example of a units-based sales forecast (with the same final sales and costs numbers as in Figure 6-26, the standard forecast).

6.35
CHAPTER 6: YOUR PLAN TABLES
FIGURE 6-27: UNITS SALES FORECAST
The illustration shows a units-based sales forecast for the same numbers as in the previous, standard sales forecast. Notice how it multiplies units times price, and units times per-unit cost, to calculate sales and costs of sales.
Switching Between Two Sales Forecasts (PREMIER version)In the PREMIER version, when you have numbers in the Sales Forecast table (Value-based), and then switch to the other Sales option (Units-based), it will seem like you’ve lost data. You haven’t.There are two separate forecasts embedded within the plan file. When you go from one to the other, you make one active and the other inactive. You can use this facility to create two Sales Forecasts, then switch between the two, and compare. This can help you develop a sense for how either of the two would affect other areas of the plan.

MARKETING PLAN PRO MANUAL
6.36
Average Price Calculation
Marketing Plan Pro calculates average Price by dividing Sales by Units. Figure 6-28 shows what happens when a Units-based Sales Forecast contains Prices but no Sales. The average Price of zero in the first-year column looks wrong, because the Price assumption is $25 per unit. However, look again: the average Price is zero, because if there are no sales—as is the case here—then the average price is zero.
FIGURE 6-28: NO SALES, NO PRICE
Without any Unit Sales, the price calculation ends up as zero.
Figure 6-29 shows why Marketing Plan Pro calculates the average Price from Sales and Units. In this example, volume changes price.
To calculate the average, you have to divide Total Sales for the year by Total Units for the year. The average Price isn’t the mathematical average of 12 price assumptions in 12 columns; it is Sales divided by Units. As the example in Figure 6-29 shows, if you made $45,500 in sales on a volume of 2,100 units, the average price is $21.67 per unit.

6.37
CHAPTER 6: YOUR PLAN TABLES
FIGURE 6-29: AVERAGE PRICE, SECOND CASE
The price calculation depends on having Unit Sales.
Revenues by Categories (PREMIER version)
As an option available in the PREMIER version, you can choose to divide sales into three categories. You make that choice in the plan setup, just as you make the choice to break expenses into categories (shown in Figures 6-19 through 6-21). Figure 6-30 shows how that looks with sales categories, using the AMT Computer Reseller sample plan.
FIGURE 6-30: SALES DETAILS BY CATEGORY
The revenues by categories option lets you set categories for further breakdown of planned revenues. In this example, revenues are divided by manager, by tactic, and by category.

MARKETING PLAN PRO MANUAL
6.38
As with the expense categories in Figures 6-169through 6-21, the revenue categories option gives you additional tables and charts. Figure 6-31 shows a revenue detail table for tactics.
FIGURE 6-31: REVENUE DETAIL EXAMPLE
Notice the cell formula in the edit bar, in the example, which uses the “Other” category to make sure the total revenue is always in agreement with the sales forecast.
Figure 6-32 shows the related chart for this example. Monthly and yearly charts for each revenue breakdown are automatic.
FIGURE 6-32: REVENUE DETAIL CHART (PREMIER VERSION)
The revenue detail for your different categories is displayed in this chart.

6.39
CHAPTER 6: YOUR PLAN TABLES
Advanced Formulas
Your main help includes an example of a simple formula that copies whatever price is in the first column all the way through the whole 12 months and three or five years. Use that and then you can change a price assumption by just changing the first month.
? To Learn More About... Search the Help Index for...Copying a formula across months and years Spreadsheet formulas
Spreadsheet Programming More detailed instructions on programming the Marketing Plan Pro spreadsheets can be found in Chapter 10, Advanced Tables, including details and examples on how to program spreadsheet formulas, programming to link tables, and many other expert features.
Main Help for General How-to-Use InformationUse the Main Help for more information on how to use the software. That’s the Help facility on your main menu tool bar, as shown here.
FIGURE 6-33: HELP MENU
The Marketing Plan Pro Help Menu gives you access to several sources of user information.
This includes information on menus, dialogs, forms, features and functionality. Main Help starts with the Help Menu within Marketing Plan Pro. Look in the Table of Contents for “Table Mode” to start with Help on tables. Or, as an alternative, just press the F1 key at any time while using Marketing Plan Pro. You can also search in the Help Index for “Tables,” “Table Mode,” “Table Options,” “Table functions,” “Add Tables,” “Table Formatting,” and of course any menu command in the Table Mode Edit menu, or in the Table Mode Format menu. The table on the next page has some additional details on specific topics in Help.

MARKETING PLAN PRO MANUAL
6.40
? To Learn More About... Search the Help Index for...Adding tables (PREMIER version) Add table
Changing row labels, row names Row labels, row names
Dealing with locked first column, options for locking and unlocking
Table options, lock column headings
Dealing with row headers at the top of the columns
Starting date, table options, lock row headings
Deleting rows Delete row
Deleting tables ... taking them out of your outline so they won’t print
Delete table, unlink table, link table
Exporting to Excel Table export, Excel export
Finding detailed row-by-row help Row-by-row help
General table mode instructions, including how to use the menus, toolbars, etc.
Table mode, table menu, table toolbar
How to break links with topics, so certain tables won’t print
Unlink table, Link table
How to hide rows so they won’t show in printed documents
Hide row, Show row
Inserting new rows Insert row
Inserting tables into your outline Link table, add table
Inserting tables from Excel, paste from Excel, import from Excel
Add table, Excel paste, Excel worksheets, paste from Excel
Linking data and assumptions from one table to another
Link tables
Linking tables to topics in the outline, or unlinking them
Link tables, unlink tables
Printing tables Printing tables, table options, table formatting, print table
Programming spreadsheet formulas Spreadsheet overview
Setting column headings Starting date
Setting fonts and formats for tables, including all cells or just data entry cells, automatically
Table options, table formatting, default table font, default data entry font
Using the Formula Backstep feature Formula Backstep
Wizard instructions and examples Wizard instructions

7Your Plan Charts
Charts vs. Tables .................................................................. 7.3
Help on How to Use Charts .................................................. 7.6
Additional Chart Details ........................................................ 7.8
Make it Your Plan................................................................ 7.12

In business and marketing plans, the more numbers you include, the more charts you need. Charts can illustrate numbers in ways that make immediate visual impact. Given today’s technology, you should have the courtesy to illustrate your more important numbers with business charts. This makes it easier for your reader.
Marketing Plan Pro® includes built-in charts that automatically illustrate the most important numbers in your plan.
CHAPTER 7: YOUR PLAN CHARTS

7.3
CHAPTER 7: YOUR PLAN CHARTS
Charts vs. TablesCharts are graphics. Tables are financial numbers displayed in rows and columns. We mention this because in Marketing Plan Pro® tables and charts are distinct and separate objects. Figure 7-1 shows a few of the main charts that automatically link to topics in a standard plan.
FIGURE 7-1: MAIN MARKETING PLAN PRO® CHARTS Table Description ExampleBreak-even Lets you determine what
you need to sell, monthly or annually, to cover your costs of doing business—your break-even point.
Sales Monthly Columns show sales for each of the first 12 months.
Milestones Track each milestone by start and end dates, budget, and manager.
Market Analysis Pie shows potential customers in different market segments.
Market Expense Used to plan your sales and marketing expenses.
Strategy Pyramid Link your strategy, tactics and programs to assure strategic alignment for your marketing strategy.
Marketing Plan Pro uses these and other pre-programmed charts that illustrate your tables.

MARKETING PLAN PRO MANUAL
7.4
Charts Always Link to Predefined Tables
Marketing Plan Pro is designed to build business charts automatically, link them to specific numbers, and place them where they belong in your plan document. Because these charts link directly to certain key numbers in the tables, the information shown in the charts is a correct interpretation of the source numbers in your plan.
Figure 7-2 shows an example. The break-even point (circled on the chart) is taken directly from the “Monthly Units Break-even” row shown in the Break-even Analysis table.
FIGURE 7-2: CHARTS LINKED TO TABLE NUMBERS
As you type in your table numbers, you automatically create your charts.

7.5
CHAPTER 7: YOUR PLAN CHARTS
Use the Tables to Change Numbers in your ChartsThe only way you can change any number shown in any chart is by changing the number in the source table. You cannot change the way charts link to specific numbers in your tables.
Modify Chart Appearance
You can change a chart’s appearance, placement, or even whether or not it shows up. As you build your marketing plan, you can change the colors, design, fonts, titles, and even types of charts, but you can’t design new and different charts in Marketing Plan Pro. Its built-in chart modification features are for the pre-programmed charts only.
Link Charts, Unlink Charts
Certain charts are automatically linked to their corresponding topics. You can link other charts to topics as you want and need, including charts created outside of Marketing Plan Pro. Also, you can unlink a chart from its topic. Unlinking a chart does not delete it from your file; it just won’t be printed in the plan.
Import Charts
You can import graphics from other software and link them to a topic in your plan, but you can’t design new and different charts in Marketing Plan Pro.
Other Charts in Plan Outline (PREMIER version)
Marketing Plan Pro PREMIER provides additional charts for actual tables and variance tables. These charts are listed at the bottom of the Plan Outline screen. Chapter 9: Planning for Implementation, gives more information on the plan vs. actual comparison and variance.
? To Learn More About... Search the Help Index for...Chart styles, formatting and how to change appearance
Chart Wizard, Chart Designer, Chart Mode
Import a chart from another program Import Chart
Add a graphic to a topic Add Graphic, Import
Unlink charts Unlink, Plan OutlinePlan vs. actual Actual, Variance, Other tables and charts

MARKETING PLAN PRO MANUAL
7.6
Help on How to Use the ChartsThis chapter gives an overview of the charts included in Marketing Plan Pro. Instructions, examples and online Help are provided within the software to explain the mechanics of working with your charts. The following describes the access to these Marketing Plan Pro help resources.
Main Help for General How-to-Use Information
Use the main Help for more information on how to use the software. That’s the Help facility on your main menu, as shown here.
FIGURE 7-3: HELP MENU
The main Help menu provides several information sources on using Marketing Plan Pro.
You can also access Help on charts as follows:
• Look in the Help file Table of Contents for “Chart Mode.” • Press F1 key while looking at a chart to open chart-specific help.• Search the Help Index for “charts,” “chart mode,” “chart options,” and “customizing charts.”

7.7
CHAPTER 7: YOUR PLAN CHARTS
Wizard Instructions and Examples
Chart-by-chart instructions are included in the EasyPlan Wizard® instructions window. Figure 7-4 shows an example of the instructions window for the Annual Expense Budget chart.
FIGURE 7-4: WIZARD INSTRUCTIONS FOR A CHART
The Marketing Plan Pro EasyPlan Wizard includes instructions (highlighted in the illustration) for every chart. This is your main source for information about each chart.

MARKETING PLAN PRO MANUAL
7.8
Additional Chart Details Break-even Chart
The Break-even chart, shown in Figure 7-5, is a business plan and marketing plan staple, but can also present problems in some cases. By default, Marketing Plan Pro gets break-even numbers from the Sales Forecast and Marketing Expense Budget tables, but the numbers in break-even are not used by any other charts and tables, so you can also input your own assumptions to see the resulting chart. Unfortunately the break-even depends on averaging inputs over your whole business, which makes it less useful for some businesses that have very diverse product lines.
FIGURE 7-5: BREAK-EVEN CHART
The break-even chart shows how sales affect profits, given some general assumptions for a hypothetical average month. It doesn’t necessarily fit with all plans, so if it doesn’t work for your plan, don’t include it.
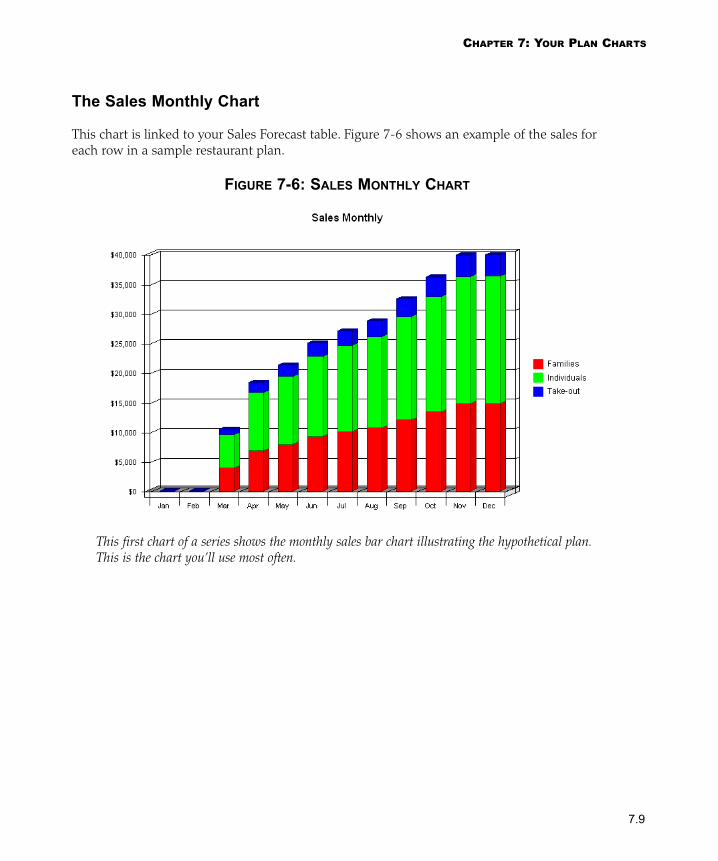
7.9
CHAPTER 7: YOUR PLAN CHARTS
The Sales Monthly Chart
This chart is linked to your Sales Forecast table. Figure 7-6 shows an example of the sales for each row in a sample restaurant plan.
FIGURE 7-6: SALES MONTHLY CHART
This first chart of a series shows the monthly sales bar chart illustrating the hypothetical plan. This is the chart you’ll use most often.

MARKETING PLAN PRO MANUAL
7.10
Charts for Actual and Variance Numbers (PREMIER version)
Marketing Plan Pro PREMIER version includes additional sets of charts to illustrate Actual and Variance (Plan vs. Actual) numbers. These charts are similar to the standard, but show different numbers. In PREMIER version watch your chart instructions carefully for details on how the Actual and Variance charts differ from the main charts. The illustrations in Figures 7-6, 7-7, and 7-8 show how plan, actual, and variance can relate to each other, for the Sales Monthly Chart.
FIGURE 7-7: SALES MONTHLY ACTUAL CHART (PREMIER VERSION)
This second chart in the series shows hypothetical actual sales for the same 12 months as the previous chart. The previous shows planned sales, this one shows actual sales.

7.11
CHAPTER 7: YOUR PLAN CHARTS
FIGURE 7-8: SALES MONTHLY VARIANCE CHART (PREMIER VERSION)
The Variance chart, in this example, shows not planned or actual sales, but the difference between what you planned and what actually happened.

MARKETING PLAN PRO MANUAL
7.12
The Strategy Pyramid™ Chart
The Strategy Pyramid™ chart normally links to the topic named “Strategy Pyramid.” If you don’t want to use it you can ignore it, and unlink the chart from the topic, so it won’t print.
Figure 7-9: Strategy Pyramid™ Chart
Use this chart feature to include a strategy pyramid chart as part of your chapter on strategies.
For more detailed help on working with this built-in chart, search the Help Index for “Strategy Pyramid chart.”
Make it Your PlanRemember, nothing about Marketing Plan Pro is written in stone…you can modify charts’ appearance, ignore the built-in charts, or make your own charts with other software and import them into your plan…it’s your plan.

8Print and Publish
Overview – Form Follows Function ...................................... 8.3
Printing Your Plan ................................................................. 8.4
Printing Tables ....................................................................8.11
Printing Charts .................................................................... 8.12
Export.................................................................................. 8.13
The PowerPoint® Presentation........................................... 8.16
Web Options as Output ...................................................... 8.18
PowerPoint®, Office® and Word® are registered trademarks of Microsoft Corporation. Acrobat® is a registered trademark of Adobe Systems Inc.

Distributing your plan to the appropriate people and in the appropriate format can be critical to the success of your business plan or, more importantly, your business. Marketing Plan Pro® provides you with numerous options for printing your plan, or parts of your plan, and the tools to distribute it.
Marketing Plan Pro is also capable of printing individual topics or tables, the Appendices, or the Summary Memo document.
And if you’re looking to publish electronically as well, there’s www.secureplan.com.
CHAPTER 8: PRINT AND PUBLISH

8.3
CHAPTER 8: PRINT AND PUBLISH
Overview – Form Follows FunctionMarketing Plan Pro® is designed to print a good-looking plan including cover page, legal page, table of contents, and appendices. The printing is automatic and so is the formatting. You can manage options with the Print Options form. If you’re printing to a color printer, the plan will include color graphics.
The standard format is professional. You could do more with a lot more effort—page layout, extensive graphics, etc.—but you certainly don’t have to. We’ve seen the standard format do fine with investors, bankers, and even at graduate-level business plan contests. No serious marketing plan evaluation process is going to reject a plan developed and printed in Marketing Plan Pro for formatting or print related problems.
You do have other options. You can also post your finished plan to a website, either your own site or the password-protected secure site at www.secureplan.com. And you can save your plan as an Adobe Acrobat electronic document, or a Microsoft Word document, or RTF, or plain text for emailing. This chapter looks at output options, including the process of printing, and also a review of related marketing plan documents and tools, such as the the summary memo.
The form and output of your marketing plan should match its business purpose. Every document deserves the basic respect of grammar, spelling, and basic editing. A marketing plan submitted to a Venture Capital firm, however, should have a better presentation than what you’d normally expect for an internal plan developed for in-house use only. Plans used for venture contests generally require more formality, and perhaps more flair, than plans used internally. Banks care less about flair and more about collateral.
Some companies put a great deal of attention into the presentation and formatting of even internal plans. For example, we were involved in a three-year business plan for Apple Japan in the early 1990s that ended with a professionally-designed annual plan logo and hundreds of copies of the plan printed with a full-color cover. On the other hand, we’ve also seen some entrepreneurial marketing plans that were so full of fancy graphics and color illustrations that they made investors nervous. In this context too, form should follow function. The plan is a business document.
The presentation of the plan document, including such variables as covers, coil binding, and quality of paper, depend mainly on your own good judgment. There is also a growing trend for plans online at www.secureplan.com, a secure and password-protected site. Joe Tanous, a venture capitalist , told us his firm “doesn’t accept plans on paper anymore.” He said that stance was not unusual, and becoming more common.

MARKETING PLAN PRO MANUAL
8.4
Printing Your PlanMarketing Plan Pro is designed to format and print a marketing plan as easily as possible, using the Print commands from your File menu, as shown in Figure 8-1.
FIGURE 8-1: FILE > PRINT MENU
The Print Menu sub-menu options, which will be discussed in more detail in the following section of this chapter.

8.5
CHAPTER 8: PRINT AND PUBLISH
Print Dialog
The print dialog box shown in Figure 8-2 displays when you choose the File > Print command.
FIGURE 8-2: PRINT DIALOG
The Print Dialog box lets you specify what you wish to print. The default setting will print the entire plan with all linked tables and charts.
If you are printing your entire plan, you can accept the default settings.
• If you wish to print only specific pages, adjust the settings in the Print Range portion.• If you wish to print only certain topics, choose the Print What > Selection button. It will
display an outline list in which you use the check boxes to select the sections to print (described in the following section of this chapter).
• If you wish to print supporting pages with your plan (Cover Page, Table of Contents, table appendices, etc.), click on the Options button (described later in this chapter).
Select Topics Before You PrintThere are lots of reasons to print just selected topics: you might want just a company summary, or the sales and marketing topics and tables, or maybe just the topics that have monthly financials printed in the appendices. Use Print > Print What option to select topics rather than printing the whole plan.

MARKETING PLAN PRO MANUAL
8.6
Print Options Dialog
From within the main Print dialog, the Options button lets you be even more specific as to the portions of your plan you wish to print. Figure 8-3 shows the Print Options form.
FIGURE 8-3: PRINT OPTIONS FORM
Use the Print Options form to select portions of your plan to print. The default setting to is print all selections.
This form also contains tabbed sections that let you:
• Customize header and footer information to print at the top and bottom of each page of your printed plan.
• Adjust the font style/font size settings for your printed document. • Adjust the margin settings to print. • Choose to print charts in black and white (Other).
Printing Selected Topics Only
If you wish to print only selected topics, the Selection setting in the Print dialog will display the full topic outline and all linked tables and charts. Mark the topic(s) to print. Figure 8-4 shows the Selection dialog.

8.7
CHAPTER 8: PRINT AND PUBLISH
FIGURE 8-4: SELECT TOPICS TO PRINT
Scroll through the topic outline and mark the topic(s) you wish to print.
How to Select Topics to Print• Select All = All topics and linked tables/charts.• Unselect All = No items selected to print.• Expand All = Displays all levels of the outline.• Collapse All = Shows only the highest level topics in outline.
Print Preview
Before you print your plan, it’s a good idea to look at it first on the screen and confirm that it contains all the sections you want and that the page formatting is correct. The Print Preview option lets you do this. Figure 8-5 shows an example of the Print Preview screen.

MARKETING PLAN PRO MANUAL
8.8
FIGURE 8-5: PRINT PREVIEW SCREEN
The print preview shows you what the printed plan will look like.

8.9
CHAPTER 8: PRINT AND PUBLISH
Print Menu
One of the greatest strengths of Marketing Plan Pro is its ability to print a beautiful marketing plan complete with table of contents, legal page, cover page, tables, charts, and appendices.
Select File > Print command to print your marketing plan. From there you can also access a complete range of print options.
Print Document – Options
Different types of planning documents can be printed. They are pre-formatted to include specific plan information for different needs. The following describes them in detail. Figure 8-6 shows the Print sub-menu Reports options.
FIGURE 8:6 PRINT MENU CHOICES
Choose the Print Option that best fits your current needs.
Plan This menu will open a dialog box to print some or all of your marketing plan. You can specify
topics, linked tables and charts, cover pages, etc. The default setting is to print the entire plan file, including cover page, table of contents, legal page, and monthly table appendices.

MARKETING PLAN PRO MANUAL
8.10
Reports Marketing Plan Pro is programmed to print a specialized plan document report. The
contents of a report may differ slightly in the PREMIER version, as it has more topics, tables and charts. A report also includes a Cover Page, Legal Page and Table of Contents.
Summary Memo The Summary Memo presents an overview of your marketing plan for investors, friends,
colleagues, business partners, or family. It includes the majority of your summary topics and the Profit and Loss (Income Statement) table. • Executive Summary• Annual Sales Forecast (chart)• Situation Analysis• Marketing Strategy• Market Analysis (pie chart)• Financials• Controls• Milestones (table)
FIGURE 8-7: PRINT SPECIAL DOCUMENTS
The Summary Memo is one specialial report printed by Marketing Plan Pro.

8.11
CHAPTER 8: PRINT AND PUBLISH
Printing Tables The File > Print > Reports command lets you print tables. Figure 8-8 shows the Planned Tables list in the Print Reports dialog.
FIGURE 8-8: PRINT TABLES FROM REPORTS
You can print all plan tables using the Print > Reports form. This option gives you more control over table output.
The Print > Reports command also gives PREMIER version users the option to print the Actual and Variance tables.
Print Tables SeparatelyTo print the current table only, choose File > Print > Table Name. The table names will automatically display. Highlight the table name to print.

MARKETING PLAN PRO MANUAL
8.12
Printing ChartsThe File > Print > Reports command includes the option to print charts. Figure 8-9 shows the charts list from the Print Reports dialog.
FIGURE 8-9: PRINT CHARTS FROM REPORT WRITER
You can also print a single chart directly from chart mode, as a single graphic. This option gives you more control over chart output.
Print Charts SeparatelyPrint the current chart by choosing File > Print > Chart Name. The chart name will automatically display from the menu. Highlight the chart name to print.

8.13
CHAPTER 8: PRINT AND PUBLISH
ExportThe Export command is part of the File menu, as shown in Figure 8-10.
FIGURE 8-10: FILE > EXPORT MENU
The Export command lets you save your plan file to several different formats for use with word processing or spreadsheet programs. The Plan Component command shown is a PREMIER version feature.
The Export command saves a marketing plan in one of the following different formats:
1. Rich Text Format (.rtf) file. 2. Microsoft Word® (.doc) formatted file. 3. Hypertext Markup Language (.htm) pages for use on the World Wide Web. 4. Adobe Acrobat® Portable Document Format (.pdf).
The exported file can contain the entire text outline or the spreadsheet. Marketing Plan Pro
PREMIER version has an additional command, Plan Component, which allows the user to export all or part of the plan to another Marketing Plan Pro user.

MARKETING PLAN PRO MANUAL
8.14
? To Learn more about... Search the Help Index for...Export Plan Component-PREMIER version
Export, Import, Collaborate
Figure 8-11 shows the Export dialog.
FIGURE 8-11: EXPORT CHOICE DIALOG
The Export dialog gives you four choices of file format.
• Use File > Export > and choose what you want to export. • Choose which format to export from the Save as type pull-down menu.
Once you’ve selected a format, click the Save button on the dialog box. Figure 8-12 shows the dialog for saving to a Microsoft Word (.doc) format. This format retains all text attributes (font style, font size, indenting, and tabbed columns for tables).

8.15
CHAPTER 8: PRINT AND PUBLISH
FIGURE 8-12: SAVE AS FOR .DOC FORMAT
Type in the name for the file before you save. Be sure to check the directory it is storing to.
• If you export as .doc, you can open the file in Word and retain all of its text formatting, including tabs and indents.
• If you export as .rtf, the file can be opened in any word processing program, and retains most of the original formatting, including font style, font size, bold, underline, and italic.
• If you export as .txt, the file can be opened in any word processing program but no formatting will be saved.
• If you export as .htm, html-coded pages will be created for each page of your plan. • If you export as .pdf, your plan can be read onscreen using the Acrobat Reader or your
Internet Browser. Pages will display the same as if they were printed. This is a read-only file.
Directory for Exported Files...Your exported file will be saved in the same directory as your Marketing Plan Pro files. Can you Import back into Marketing Plan Pro?These are different formats from the original plan file (.mpd) and cannot be imported back into Marketing Plan Pro. However, you can use the Windows clipboard to copy and paste text back into your marketing plan.No Technical Support for Exported filesOur technical support facilities do not include help working with exported files or with modifying them using other software.
MARKETING PLAN PRO MANUAL
8.16
The PowerPoint® PresentationWhen a marketing plan is part of new financing, either debt financing or new investment, the process frequently involves a streamlined presentation. Investors expect it. Mainstream Venture Capitalists, Angel investors, and investment clubs normally consider new investments using a process that includes a presentation event. The entrepreneurs, key members of the management team, have some limited time to show the investors their business opportunity. Normally they do that using a slide presentation. These days, that most often means a PowerPoint presentation using a projector connected to a computer.
The PresentationThe marketing plan presentation is valuable for presenting a plan to investors. Although it is based on the plan, and describes the plan, it is a different medium and should be different from the plan.
Marketing Plan Pro includes several PowerPoint templates for a standard business/marketing plan presentation. We partnered with PresentationPro, Inc. to deliver professional, graphically sharp presentation templates for your business/marketing plan. Click the Resources button > Make it Happen > Present > Presentation Templates for more information and access to these templates.
• Agree Template• Big Cash Template• Premiere Template • Screens Template• Target Template
While the details and specifics depend on you, your plan, and your audience, a standard business or marketing plan presentation will include about 7-20 slides covering some or all of the following (details on how to move information from the marketing plan to PowerPoint are in Chapter 11, Working with Microsoft Office®):
• Title slide. You can do “My Company Marketing Plan” or some other title. • The Market. The Market (pie) chart from Marketing Plan Pro, displayed as large as possible,
words to be added by the presenter, in person. • The Market Need. Use bullet points from either the Mission or the Market Analysis text
topics. • SWOT Analysis. Use bullet points from this section in your plan’s chapter. • Sales Forecast. Show the chart from Marketing Plan Pro. Talk about the details. • Marketing Team. Names and positions of the top people. Fill in the rest verbally. • Expense Budget. Highlights only, in bullet points. • Break-even. The Marketing Plan Pro chart, first year, important for discussion.

8.17
CHAPTER 8: PRINT AND PUBLISH
• Contribution Margin. Just the chart, from Marketing Plan Pro (PREMIER version). • Strategy Pyramid. The pyramid chart from Marketing Plan Pro strategy chapter of the plan. • Milestones. If possible show the Milestones chart only. • Keys to Success. Bullet points, from this topic in the first chapter. • Next Steps. Always a good idea, end the discussion with next steps, assuming a positive
outcome.
Like a marketing plan, a marketing plan presentation is a specialized tool. Most of these presentations need to summarize an entire marketing plan in a streamlined 7-20 slides for a talk that lasts about 30 minutes.
• It uses graphics to illustrate main points. The slide displays the chart only, so the presenter fills in the details.
• It uses bullet points and key phrases only. They are reminders and placeholders, not complete thoughts.
• It is all summary. The text is large and there isn’t much of it. Charts tell most of the story.
A good presentation is about results. It’s short and exciting. It makes its key points quickly and well. It needs to be optimized for the business purpose, avoid details, and stick to highlights.
Always, even when details are important, keep the text large and the graphics simple. People don’t read details from a presentation.
This kind of optimized tool isn’t done automatically by computer software, and particularly not by marketing plan software. The format is different, the purpose is different, so the tool itself must also be different. There’s no way a marketing plan document can automatically create a PowerPoint presentation without ending up with a poor presentation, too much text, too many numbers, and not enough summary.
Chapter 11, Working with Microsoft Office explains how to create this kind of presentation in PowerPoint using your plan developed with Marketing Plan Pro to provide the content.

MARKETING PLAN PRO MANUAL
8.18
Web Options as OutputThe Internet and the World Wide Web offer attractive alternatives to distributing a document as a printed physical copy. The advantages include immediate availability, always having the latest copy online, and multiple access 24 hours a day, 7 days a week.
www.secureplan.com
Marketing Plan Pro includes the facility to publish a marketing plan directly to a secure, password-protected website provided by Palo Alto Software. The commands for uploading onto a secure website are built into the software. Click the File > Send To > SecurePlan.com command.
Select SecurePlan.com and a welcome screen will display, similar to that shown in Figure 8-13.
FIGURE 8-13: SECUREPLAN.COM WELCOME SCREEN
These screens walk you through the process of uploading your marketing plan to a secure website.
• Click the button to continue.
You will then be asked to establish your SecurePlan.com account, as shown in Figure 8-14.

8.19
CHAPTER 8: PRINT AND PUBLISH
FIGURE 8-14: ESTABLISH A SECUREPLAN.COM ACCOUNT
Your SecurePlan.com account is password protected.
Once your account is established, additional screens will take you through the steps to upload your marketing plan to your secured website page.
? To Learn more about... Search the Help Index for...Password protected website for sharing your marketing plan
SecurePlan.com

MARKETING PLAN PRO MANUAL
8.20
This page intentionally blank.

9Planning for Implementation
The Human Side of Implementation ..................................... 9.3
Plan-vs.-Actual – PREMIER version..................................... 9.3

CHAPTER 9: PLANNING FOR IMPLEMENTATION
A marketing plan is a living document. Once your plan numbers are in place, you will want to track the actual numbers, then compare them to your plan. Were your estimates accurate? Did you make more sales then expected? Were your expenses higher than you planned? How are these differences going to affect your business? What adjustments should be made to adapt to these changing needs?
That’s the power of tracking results. Marketing Plan Pro® PREMIER version provides the ability to create a plan-vs.-actual comparison automatically.
Variances do go in different directions. For sales and contribution, actual results that are higher than planned show as a positive variance, and less than planned results are shown as a negative variance.
For negative items, including costs and expenses, actual results that are less than planned will show as a positive value, and items that are more than planned will show as a negative.

9.3
CHAPTER 9: PLANNING FOR IMPLEMENTATION
The Human Side of I mplementationMarketing plan implementation depends on tracking and following up. Every member of the team responsible for implementing a plan should know for sure that actual results will be compared to what was planned. Their responsibilities should be clearly defined.
Marketing Plan Pro® version includes a Milestones table that allows the listing of clearly defined key actions and responsibilities. Without a clear definition, implementation is unlikely.
Variance analysis—jargon for plan-vs.-actual analysis—is tricky. For example, a positive variance in advertising expenses may be from smart media buying that reduced expenses without hurting advertising effectiveness, or it might be a failure to follow through in ordering, and so, a lack of advertising altogether.
See Also...On Target: The Book on Marketing Plans, Chapter 26, Keep it Alive contains additional examples of plan-vs.-actual analysis and the importance of following through with your original plan and making it real. Click the Resources button > Books > On Target to read the book on screen in Adobe Acrobat® Reader’s PDF format.
Plan-vs.-Actual – PREMIER versionImplementation depends on tracking and following up, and that’s where plan-vs.-actual analysis is critical. You can’t track results and follow up with management or your marketing team unless you know what’s going on with the plan-vs.-actual.
These key Marketing Plan Pro PREMIER version tables are built as management tools, with plan-vs.-actual facilities included:
• Sales Forecast• Expense Budget• Contribution Margin• Milestones
You can use this feature by changing your Table mode from Plan to Actual. To switch from your plan tables to actual mode, click on the tabs at the bottom of each table. After actual results are typed into the Actual areas, then you can check Variance, also built into Marketing Plan Pro PREMIER version, which is the difference between what you planned and your actual results.
Figure 9-1 shows the Milestones Table in its Variance mode, which compares actual results to the original plan. In the example, the plan is only a few weeks old, so there is only variance for the first few weeks. You can see how some projects started late, finished late, or finished early.

MARKETING PLAN PRO MANUAL
9.4
FIGURE 9-1: MILESTONES TABLE - VARIANCE MODE
This example shows the plan-vs.-actual variance view of the Milestones table.
Variance Depends On...Notice that variance differs by context. A positive variance from plan is good when it is more sales than planned, but bad when it is higher costs than anticipated. You always have to look at the causes—for example, spending less than planned on cost of sales is a positive variance, but it isn’t necessarily a good thing...maybe sales were lower than expected, causing cost of sales to be lower as well.
Plan-vs.-Actual Logic
The Plan-vs.-Actual analysis in Marketing Plan Pro PREMIER is built on the logic of the information available to you as you develop your actual results.
• Actual Sales. The plan estimates future sales by multiplying projected units times projected price; the actual results calculate actual Price by dividing actual Sales by actual Units.
• Expense Budget. Type your actual Marketing Expenses into the Expense Budget table. • Contribution Margin. If you already typed your actual operating expenses into the expense
budget, and the actual sales into the sales forecast, the Contribution Margin will reflect
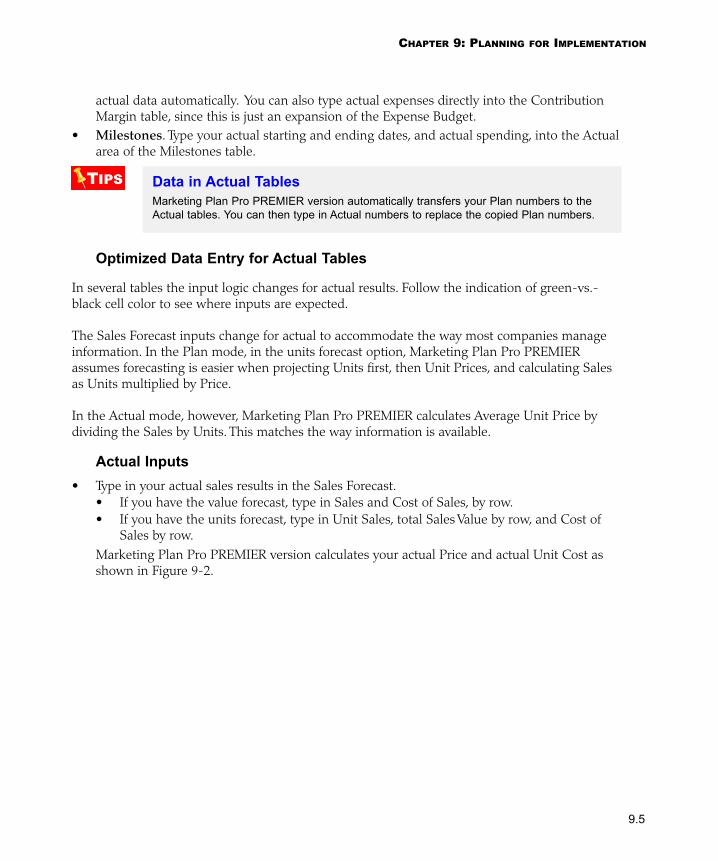
9.5
CHAPTER 9: PLANNING FOR IMPLEMENTATION
actual data automatically. You can also type actual expenses directly into the Contribution Margin table, since this is just an expansion of the Expense Budget.
• Milestones. Type your actual starting and ending dates, and actual spending, into the Actual area of the Milestones table.
Data in Actual TablesMarketing Plan Pro PREMIER version automatically transfers your Plan numbers to the Actual tables. You can then type in Actual numbers to replace the copied Plan numbers.
Optimized Data Entry for Actual Tables
In several tables the input logic changes for actual results. Follow the indication of green-vs.-black cell color to see where inputs are expected.
The Sales Forecast inputs change for actual to accommodate the way most companies manage information. In the Plan mode, in the units forecast option, Marketing Plan Pro PREMIER assumes forecasting is easier when projecting Units first, then Unit Prices, and calculating Sales as Units multiplied by Price.
In the Actual mode, however, Marketing Plan Pro PREMIER calculates Average Unit Price by dividing the Sales by Units. This matches the way information is available.
Actual Inputs• Type in your actual sales results in the Sales Forecast.
• If you have the value forecast, type in Sales and Cost of Sales, by row. • If you have the units forecast, type in Unit Sales, total Sales Value by row, and Cost of
Sales by row. Marketing Plan Pro PREMIER version calculates your actual Price and actual Unit Cost as
shown in Figure 9-2.
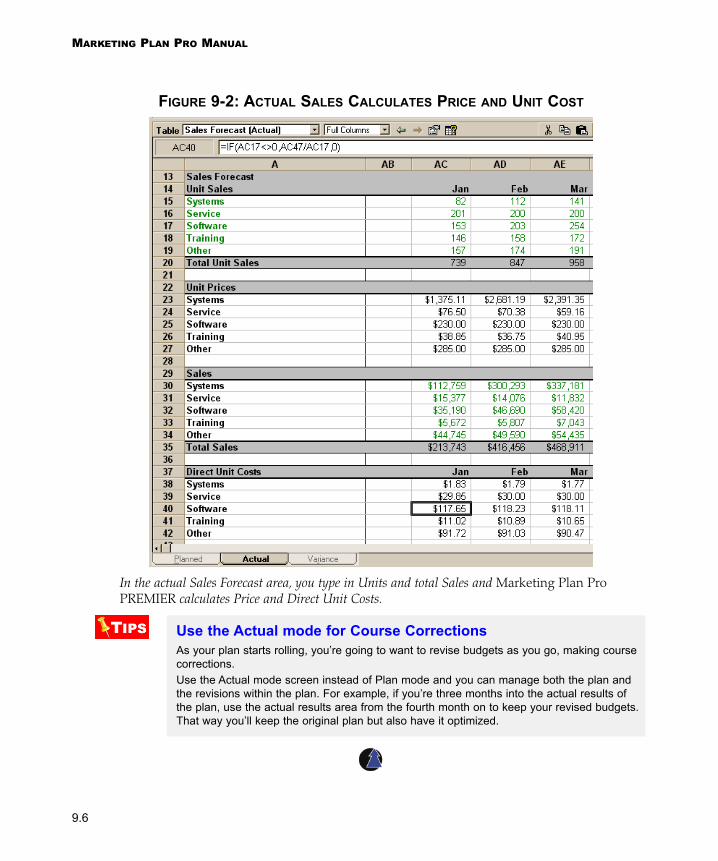
MARKETING PLAN PRO MANUAL
9.6
FIGURE 9-2: ACTUAL SALES CALCULATES PRICE AND UNIT COST
In the actual Sales Forecast area, you type in Units and total Sales and Marketing Plan Pro PREMIER calculates Price and Direct Unit Costs.
Use the Actual mode for Course CorrectionsAs your plan starts rolling, you’re going to want to revise budgets as you go, making course corrections. Use the Actual mode screen instead of Plan mode and you can manage both the plan and the revisions within the plan. For example, if you’re three months into the actual results of the plan, use the actual results area from the fourth month on to keep your revised budgets. That way you’ll keep the original plan but also have it optimized.

10Advanced Tables
Excel® is a registered trademark of Microsoft Corporation.
Customizing Formulas in Tables......................................... 10.3
Examples – Custom Formulas............................................ 10.3
Range Names..................................................................... 10.9
Linking Tables ................................................................... 10.10
Examples – Linking Tables ............................................... 10.10
Customized Formulas and Tables ................................... 10.13
Insert New Tables (PREMIER version)............................. 10.13
Sensitivity Analysis (PREMIER version) ........................... 10.20
Dealing with Scenarios (PREMIER version)..................... 10.21
Subscriptions/Churn Rate Forecasts (PREMIER version) 10.23
Additional Resources........................................................ 10.26
Conclusion: It’s Your World............................................... 10.26

Chapter 6, Your Plan Tables, covers the standard tables. This chapter covers additional programming and customization.
The best way to learn this is by doing it. This chapter will take you through a series of examples. It starts with simple examples that offer practical tips. It also includes details of more complex formulas, as well as explanations of formulas you might want to add or change.
This level of customization is provided for those users who may want it. It is not necessary in order to create a solid marketing plan.
CHAPTER 10: ADVANCED TABLES

10.3
CHAPTER 10: ADVANCED TABLES
Customizing Formulas in TablesMarketing Plan Pro® gives you extensive spreadsheet-like programmability for your financial tables. Although your tables don’t need to be programmed, they are built into a very powerful spreadsheet tool that includes a complete Microsoft Excel®-compatible spreadsheet which supports sophisticated financial functions that calculate your loan payments, depreciation, and investment analysis. All of this power is available even while working within the financial analysis.
Furthermore, you can build your own customized spreadsheets within Marketing Plan Pro directly (PREMIER version), linking them to the thoroughly tested and documented tables already there.
Examples – Custom FormulasLet’s go through some examples of Marketing Plan Pro spreadsheet formulas. To follow along with the examples:
• Open Marketing Plan Pro. • Use the Sample Plan Browser to open a marketing sample plan file (the AMT Computers
sample plan is a good one, although not all the following examples show exactly that plan). • From the Tools menu, choose Options > Tables.
• Set your tables to show row and column headings.
Example: Absolute Reference in a Formula
Relative Value
The default reference for spreadsheet formulas is “relative” to its current location. If you copy a formula to another column, the reference in the formula changes accordingly.
Absolute Value
Sometimes you don’t want some or all of a formula to change its reference. In those cases, we use the $ symbol in the formula, which makes it “absolute,” regardless of which cell the formula is copied to.
In Figure 10-1, the formula highlighted in column C is: =$B38*C23 The $ makes the reference to B38 an absolute reference to column B.

MARKETING PLAN PRO MANUAL
10.4
FIGURE 10-1: SAMPLE FORMULA WITH ABSOLUTE VALUE
In this example, Cell C38 shows a formula with an absolute value for column B.
If you were to copy that formula to cell D38, the formula could become: =$B38*D23 . The reference to C23 moved one column to the right, but the reference to column B in $B38 didn’t change. In our example, the only portion of the formulas that is “absolute” is the reference to column B. If we copied the formula down a row, the row reference would change “relative” to its new location. The new formula in cell C39 would become =$B39*C24 . In that case, the B column remains absolute because of the $, but the row number adjusts to the change in location.
To create an absolute reference for both column and row, we would use the $ symbol for both. In that situation, if our formula had been created as: =$B$38*C23 and we then copied it to C39, both column and row number would have remained absolute, making the formula =$B$38*C24

10.5
CHAPTER 10: ADVANCED TABLES
Example: Automatic Price Formula for Sales Forecast
In this example, we will create a price formula so that every cell in the row looks to the first cell for the correct number. In Figure 10-2 you see a portion of the Sales Forecast table of the AMT Computers sample plan.
FIGURE 10-2: SALES FORECAST FORMULA
This simple formula makes the price in column D equal to whatever price is already in column C.
Cell D23 is selected. The formula for cell D23 is: =C23
If you copy that formula into the rest of the 12 monthly columns (Edit > Fill > Right command), then whenever you change the assumption in the first month, that change automatically ripples through the whole system.
Locked Cell Error As you copy the formula in D23 and paste it in the following cells to its right along the row, you can’t paste into cell O23. That would produce a “locked cell” error. O23 is locked because it calculates average price for the year by dividing total revenue by total units sold.

MARKETING PLAN PRO MANUAL
10.6
This example shows basic spreadsheet programming. The formula in D23 makes that cell equal to whatever is in C23.
• Select D23. • Hold down the shift key while D23 is selected and then press the right arrow key a few
times. That automatically selects a range of cells to the right along the row. • Use the Edit > Fill > Right command to copy D23 across the row. If your selection includes
O23, which is locked, you’ll get the locked cell error message (described in a previous tip).
Example: Variable to use as Percent of Sales
Marketing Plan Pro uses named ranges as variable names as much as possible, to simplify reading and working with formulas. There are several dozen built-in range names that work from any table in Marketing Plan Pro. These are named to make them easier to include within a formula. For example, the Sales Forecast table uses a range name “Sales” as a variable, which is the sum of sales for that column.
However, you don’t have to be in the Sales Forecast to use the “Sales” range name. Figure 10-3 shows how you can use this built-in English-language range as a variable to create a formula to make all the cells in a given row of the Contribution Margin table calculate as a percent of sales.
FIGURE 10-3: PERCENT OF SALES IN CONTRIBUTION MARGIN
Notice the use of the named range “Sales” as a variable in the formula shown, also the $B6 which will always refer to the B column when used in any other column.
The example shows a Contribution Margin table with cell C6 selected. The formula for C6 calculates that cell by multiplying the variable with the range name “Sales” by the value in B6. As with a previous example, the reference to B6 uses the $B6 to make sure that the reference to column B is absolute, and the reference to row 6 is relative. That formula was written into C6 first, then copied to cells D6:N6 and P6:S6.

10.7
CHAPTER 10: ADVANCED TABLES
Example: Programming a Sales Forecast Growth Rate in Column B
Figure 10-4 shows a sample sales forecast in which a growth rate assumption, in column B, automatically calculates sales projections for annual sales in the second and third year.
FIGURE 10-4: GROWTH RATE VARIABLE IN SALES
This formula sets a growth rate, in column B, that impacts the annual numbers in columns P and Q.
The formula in P16 (in the figure above) calculates service unit sales in 2002 by applying the growth rate in column B. The phrase $B16 in that formula will always refer to the absolute value in the B column.
Round to Nearest Whole Number
The formula described in Figure 10-4 also uses the ROUND function to round the result to the nearest whole number. For example, the formula “=ROUND(3/5,0)” would calculate to the whole number 1, while the formula “=ROUND(2/5,0)” would calculate to the value 0.
Example: Make a Cell a Percent of any Other Cell
You can create formulas to calculate a cell using the value of another cell. Figure 10-5 shows an example of a formula that calculates a cell to be 50% of the value of another cell. In cell C15, the formula is =.5*C14 . The value in C14 is 5,000, so the value in C15 is 2,500, exactly 50% of 5,000.

MARKETING PLAN PRO MANUAL
10.8
FIGURE 10-5: ONE ROW A PERCENT OF ANOTHER
The formula makes the catalog expense 50% of advertising expense.
Example: Sales Commission Formula
Figure 10-6 shows a commission structure that can be built into the Expense Budget. The formula for cell C18 shows in the edit bar in that figure. It applies a commission rate to the Gross Margin for that same month.
FIGURE 10-6: SETTING COMMISSIONS IN EXPENSES
The formula in the edit bar shows how spreadsheet programming projects the commissions on sales as a marketing expense.

10.9
CHAPTER 10: ADVANCED TABLES
Range NamesJust as the formula in Figure 10-3 uses “Sales” as a named range, you can use dozens of other named ranges as variables. These include Sales, Earnings, Inventory, Gross_margin, etc.
Ranges Names are Relative
Range names automatically adjust for different columns. The formula =Sales in column G will show the value of sales in column G. That same formula in column D will show the value of sales in column D.
Errors using Range Names
#VALUE
Range names will produce errors when used improperly. For example, the range named “Sales” starts in column C and spreads across multiple columns. The formula =Sales in column B produces a #VALUE error because there is no valid value for that column.
However, a range name that occupies a single cell can be used as a variable anywhere in the financials. For example, since the range “Starting_year” occupies a single cell, you can use the formula =Starting_year anywhere in the financials without getting a #VALUE error.
Pasting Range Names
When you copy a formula using a range name and paste it into a new table, Marketing Plan Pro automatically changes it by adding an underscore character and a number. It has to make this change to keep track of new range names.
For example, paste the formula “=sales” into a new worksheet and Marketing Plan Pro will paste “=sales_2” instead.
You can go back and change this, but the default will happen that way. This handling is necessary because the named ranges are in different worksheets.
List of Range NamesA complete list of the built-in range names for Marketing Plan Pro can be found in Appendix A of this manual.
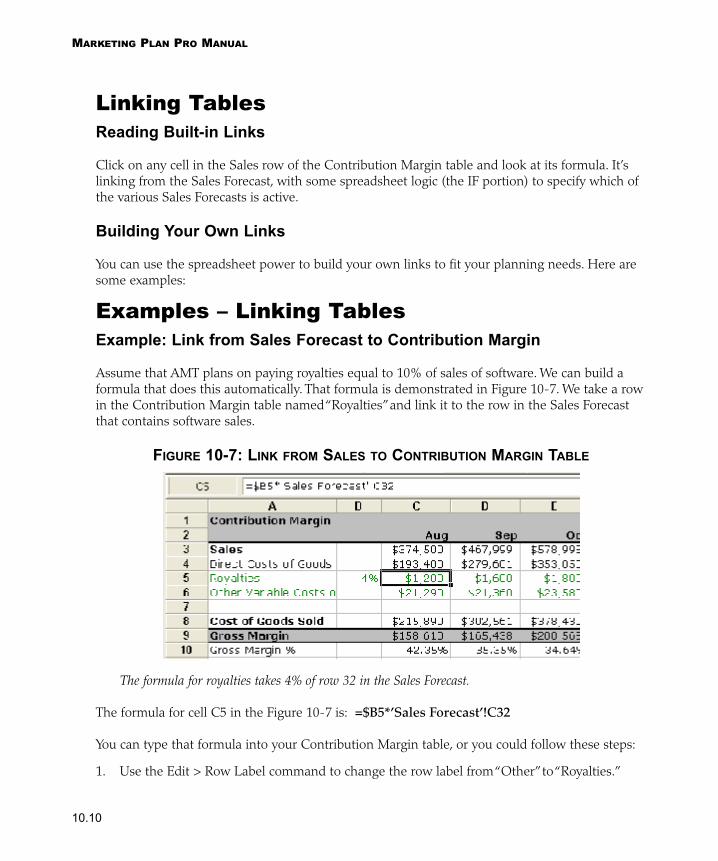
MARKETING PLAN PRO MANUAL
10.10
Linking TablesReading Built-in Links
Click on any cell in the Sales row of the Contribution Margin table and look at its formula. It’s linking from the Sales Forecast, with some spreadsheet logic (the IF portion) to specify which of the various Sales Forecasts is active.
Building Your Own Links
You can use the spreadsheet power to build your own links to fit your planning needs. Here are some examples:
Examples – Linking TablesExample: Link from Sales Forecast to Contribution Margin
Assume that AMT plans on paying royalties equal to 10% of sales of software. We can build a formula that does this automatically. That formula is demonstrated in Figure 10-7. We take a row in the Contribution Margin table named “Royalties” and link it to the row in the Sales Forecast that contains software sales.
FIGURE 10-7: LINK FROM SALES TO CONTRIBUTION MARGIN TABLE
The formula for royalties takes 4% of row 32 in the Sales Forecast.
The formula for cell C5 in the Figure 10-7 is: =$B5*’Sales Forecast’!C32
You can type that formula into your Contribution Margin table, or you could follow these steps:
1. Use the Edit > Row Label command to change the row label from “Other” to “Royalties.”

10.11
CHAPTER 10: ADVANCED TABLES
2. Select the first month cell for the Royalties row (our example shows cell C5). This is the target cell for the link formula.
3. Type the equals sign, = (without quotation marks or parentheses) into the cell. 4. Go to the Table pull-down list and choose the Sales Forecast table. 5. Find the cell for January sales of software (in the example, cell C32) and select it. This will be
the source cell. Your formula edit bar should at this point show the formula =’Sales Forecast’!C25
6. To make royalties equal to only 10% of sales of software, we click the correct insertion point in the edit bar, behind the =, and type in the formula $B5*
7. Press the ENTER key.
You are probably looking at Contribution Margin at this point (cell C5 in our example). Your formula should now be correct: =$B5*’Sales Forecast’!C32
To put this same link across the entire row:
• Select the first month royalties formula (cell C5) through the last month (C5:N5) and use the Fill Right command, in the Edit menu, to copy that formula to the rest of the year in months.
Cell References in Linked-tables Formula ExamplesWe refer to specific cells as they appear in our example. Your settings may show differently. Use the cell address as a general reference and adjust to match your table view.

MARKETING PLAN PRO MANUAL
10.12
Example: An IF Function in Expense Budget linked to a Sales Row
Figure 10-8 shows an expense row from the Expense Budget linked to a sales row, using a simple IF function. The formula checks whether Training sales (cell C33 of the Sales Forecast) are greater than $10,000. If they are, then the Training expense is $5,000. If not, then the Training expense is $2,000.
FIGURE 10-8: THE IF FUNCTION IN A LINKING FORMULA
The IF function in this example sets Training expense to vary according to Sales Forecast numbers.
Follow these steps to create the formula link in your own plan:
1. Select the target cell (cell C23 in the Marketing Expense Budget). 2. Type: =IF( 3. Choose the Sales Forecast table from the pull-down menu.4. Find the source cell in the Sales Forecast table (cell C33) and click to select it. The edit bar
shows the formula as: =IF(‘Sales Forecast’!C335. Type the rest of the formula into the edit bar, as shown in the example: >10000,5000,2000)6. Press <ENTER>. 7. Use the Edit > Fill > Right command to copy the formula to the rest of the unprotected cells
in the row.

10.13
CHAPTER 10: ADVANCED TABLES
Customized Formulas and Tables Insert New Tables (PREMIER version)With the PREMIER version of Marketing Plan Pro, you can insert a brand new empty table into your marketing plan, linking it to a topic. This lets you develop your own tables and add them to your marketing plan. Once you’ve inserted a new table, you can also link any cell in a new table into the entry areas of any of the main tables. The next example shows the use of a blank table.
? To Learn More About... Search the Help Index for...Inserting a blank table-PREMIER version
Insert table, link table, add table
Example: Linking Inserted Table to Sales Forecast
Figure 10-9 shows one example, linking from a new table into the Sales Forecast table.
FIGURE 10-9: LINK FROM USER-DEFINED TABLE INTO SALES
The example here shows how the User-defined table links back into the Sales Forecast table. You can add tables if you have the PREMIER version.
Here’s how to do it in detail:
• Select the target cell in the Sales Forecast. In the example, cell P15 is selected. That cell contains the projection for unit sales of systems in 2002.
• Type the equals sign, = into the cell (without quotation marks, parentheses, etc.).• Use the Table pull-down list to go to the user-defined table that contains the source cell (in
this example, it’s User 1). • Click on the source cell. In the example, that’s cell C40. The formula becomes =’User 1’!C40 • Press <ENTER>.

MARKETING PLAN PRO MANUAL
10.14
Example: Pasting from an Excel® Worksheet to a Blank TableYou can copy a range from an Excel worksheet and paste it into a user-defined table. Figure 10-10 shows an example of the Excel worksheet and the Marketing Plan Pro user-defined table. If you want to preserve the formulas within the worksheet, it is an easy multi-step process.
FIGURE 10-10: PASTING TO USER-DEFINED TABLES FROM EXCEL
The Excel worksheet on the top was pasted into the Marketing Plan Pro user-defined table on the bottom.
1. In Microsoft Excel (the example was developed with Excel 2000), make sure that the spreadsheet area you want to paste contains only unprotected cells.
2. If you have any doubts, select the area you want to copy and paste, then use the Format menu, Cells command, and Protection tab to make sure those cells are not protected.
3. Within Excel, select and copy the source area you want to use in Marketing Plan Pro. 4. Select Marketing Plan Pro. Use the Plan Outline Insert tool from the toolbar to insert a new
table attached to a topic. Select the cell you want to have as the upper left cell in the target range. Remember, those cells should be unprotected in Excel.
5. Use Edit > Paste Special > Paste All command. Your Excel spreadsheet will now be pasted into your Marketing Plan Pro user-defined table.

10.15
CHAPTER 10: ADVANCED TABLES
Tips on Pasting from Excel to Marketing Plan Pro
If you do work with this paste process, please remember these important tips and traps for pasting from Excel to Marketing Plan Pro:
• A Copy and Paste from Excel to Marketing Plan Pro copies values only, not formats or formulas. To copy and paste spreadsheet information completely, use the Paste Special command in Marketing Plan Pro and chose Paste All to paste both formulas and formats.
• If you paste a formula from one worksheet containing an erroneous reference, you’ll get a #REF error in the target worksheet. That’s true in Excel alone, and it’s also true when you paste from Excel into Marketing Plan Pro. For example:
• If you copy the formula =C9 from cell C10 in Excel into cell C1 in Marketing Plan Pro (or Excel), you get a #REF error. Marketing Plan Pro wants to reinterpret the formula to refer to the relative row number, 9 is 1 less than 10, but when you paste into row 1 you don’t have the possibility of a lower row number.
• Copy a formula =XYZ (referring to a range name not already in Marketing Plan Pro) from Excel and paste it into Marketing Plan Pro. Marketing Plan Pro will behave like Excel in this instance. It creates a new range named XYZ located in a position relative to the target cell.
• Copy the formula =Sales from Excel and paste it into Marketing Plan Pro. Marketing Plan Pro will create a new range named =Sales_2 and give the target cell the formula =Sales_2 . To make the cell refer to the range named Sales, you have to edit the formula manually.
No Links to External FilesThe Marketing Plan Pro spreadsheet is so compatible with Microsoft Excel that almost any function or formula that works in Excel will work in Marketing Plan Pro. However, Marketing Plan Pro cannot link formulas to external files outside of the plan. Excel can do this, but Marketing Plan Pro can’t.
Protected Cells Remain Protected after CopyingIf you copy protected cells from Excel to Marketing Plan Pro, they remain protected. You cannot access them to change them after they are copied.

MARKETING PLAN PRO MANUAL
10.16
Example: Linking Sales Forecast from the Market Forecast Table
For this example, the AMT computer store wants to develop a more detailed Sales Forecast for computer systems drawing from information, including its projected market size and its projected market share.
Figure 10-11 shows a customized AMT sample plan user-defined table.
FIGURE 10-11: USER-DEFINED TABLE, PART 1
The formula shown in the edit bar picks up information from the Market Analysis table.
• Although the system continues to refer to this table as User 1 for linking purposes, we can rename it in the plan topics. For example, we could call it “Detailed sales assumptions” instead of “User 1.”
• The top row contains years. Cell B1 has the formula =PS_StartingYear which refers to a named range within Marketing Plan Pro. C1 contains the formula =B1+1 .
• The cells in this section of the table link to the Market Analysis table, which contains projected total market numbers for different market segments. The cells in Figure 10-11, from A2 through F6, refer to the Market Analysis table. That means that if you decide to change the Market Analysis table for any reason, you don’t have to retype.
For more detail on ForecastingPlease refer to Forecasting in On Target: the Book on Marketing Plans. The book offers detailed tips on how to develop forecast numbers using a combination of research, analysis, common sense, and educated guessing. Click the Resources button > Books > On Target to read the book in PDF format.

10.17
CHAPTER 10: ADVANCED TABLES
Example: Total Sales Based on Percent of Total Market
In the second block of rows in the table shown in Figure 10-12, we project the percent of total market expected to purchase systems within each given year. As with the total potential market projections, these are a combination of research, analysis, common sense, and educated guessing.
These cells don’t use formulas; they are assumptions typed manually into the cells.
Calculated Unit Sales
The third block of cells calculated the estimated unit sales for the geographic market. For each market segment, it multiplies percent of total by total market to calculate projected total sales for the segment.
The illustration shows the formula for cell B18. It multiplies the unit number in B2 times the percentage in B10, and uses the Marketing Plan Pro ROUND function to round that calculation to even numbers.
FIGURE 10-12: USER-DEFINED TABLE, PART 2
In the example, the estimated unit sales are produced by multiplying market by percent penetration.

MARKETING PLAN PRO MANUAL
10.18
The ROUND Function
The formula shown in Figure 10-12 rounds the calculation to the nearest whole number:
=ROUND(B10*B2,0)Here are more examples of how this function works:
• =ROUND(B10*B2,1) rounds to a single decimal.
• =ROUND(B10*B2,-2) rounds to the nearest hundred.
• =ROUND(B10*B2,-3) rounds to the nearest thousand.
The SUM function
The formula for cell B23 in Figure 10-12 isn’t shown, but it is an excellent example of the classic SUM function in a formula. The actual formula is: =SUM(B18:B22)
The formula calculates exactly as it seems: the sum of the cells included in the summation range. These SUM formulas are common in spreadsheets, and throughout Marketing Plan Pro as well. The SUM formula is used to sum unit sales, total sales, and total cost of sales. It’s used to sum rows in the Sales Forecast, in the Expense Budget, the Market Analysis, and Contribution Margin. It is quite common throughout Marketing Plan Pro.
There is an illustration of the SUM function in Figure 10-13, showing the formula for cell B40 of the same worksheet, which sums the range (B35:B39).
Market Share and Sales
The detailed market model then continues into its fourth section, which contains percentage assumptions of AMT’s share of the local market. Figure 10-13 demonstrates this.
The fifth, and final, section of the model multiplies the total market projected sales by the assumed AMT percentage market share, in order to project AMT sales of systems. The final numbers in row 40 of that model are then linked back into the Sales Forecast.

10.19
CHAPTER 10: ADVANCED TABLES
FIGURE 10-13: USER-DEFINED TABLE, PART 3
In this third view of the sample, this company’s unit sales are estimated by taking total market units and estimated market share.
Monthly Headings in a New Table
Linking information via formulas is convenient, and you can do that with dates and the date function automatically built into Marketing Plan Pro. Figure 10-11 in the previous section shows an example. Here are some additional details.
• The range name “PS_StartingYear” variable is a four-digit number for the starting year of the plan.
• The range name “PS_StartingMonth” variable is a number between one and 12, the starting month of the plan.
• The date function =date(year,month,day) will work with both these variables to give you dates according to the starting dates of your plan.
• The Date and Number format options are available in the Format > Cells menu.

MARKETING PLAN PRO MANUAL
10.20
Sensitivity Analysis (PREMIER version)Change your assumptions, and record the changes that result. How sensitive is your marketing plan to lower levels of sales? Higher costs? More time waiting to collect the money? That’s sensitivity analysis. Spreadsheets like the one now built into Marketing Plan Pro PREMIER are a very powerful tool for sensitivity analysis. Make the changes and record the impact.
Example: Sensitivity Analysis
Figure 10-14 shows a useful sensitivity analysis done with a single new table inserted into the plan as a place to record changing results (PREMIER version). To do this with your plan, first insert a new table and then change assumptions and record the impact.
In the case shown here, the assumptions are linked from the Marketing Expense Budget table. Change the main assumptions in that table and record the change in spending resulting from the change in marketing programs implemented.
FIGURE 10-14: SENSITIVITY ANALYSIS SAMPLE
This user table records results of a marketing programs choices sensitivity analysis.
Develop Your Own Sensitivity Analysis
You can see from the example in Figure 10-14 that the possibilities of sensitivity analysis are virtually unlimited. You can use different program choices, different target market segments different plans and plan names, or other options to change assumptions and record the results.
Sensitivity Analysis is “What-If”
There isn’t a big difference between sensitivity analysis and “what-if” analysis. When experts talk about sensitivity, they generally mean a more rigorous and organized analysis of how some variables change when other variables change. When business people talk about sensitivity, they often mean the same thing as “what if” analysis; that is, what happens to cash flow if sales drop?

10.21
CHAPTER 10: ADVANCED TABLES
Dealing with Scenarios (PREMIER version)Many marketing plan situations involve different scenarios. The simplest and in many aspects the most powerful way to manage scenarios is with different plans. Each plan is a complete file on its own, and each plan contains a scenario. The normal way to develop scenarios as separate plans is to finish the main plan as the most likely scenario, then use the File > Save As command to save it again with a different name, and make the new one a different scenario. For example, when the main plan is done, save it first as “pessimistic” and then lastly as “optimistic,” and manage each of those offshoots as separate scenarios.
Two Built-in Sales Scenarios (PREMIER version)
Chapter 6 explains how the EasyPlan Wizard® in PREMIER version gives you the choice of sales forecasts, either value-based or units-based, for every plan. It doesn’t explain that you can also use these two forecasts to manage optional scenarios. That wasn’t the original intention, but it works. Try it. Figure 10-15 shows you how the EasyPlan Wizard switches between the two forecasts.
FIGURE 10-15: SWITCHING BETWEEN SALES FORECASTS
In PREMIER version the EasyPlan Wizard lets you switch between two sales forecasts, one structured more simply than the other. Use this facility to build two scenarios into your plan.

MARKETING PLAN PRO MANUAL
10.22
You’ll see, when you try it, that each of the forecasts is separate, and whichever is selected links automatically into the Contribution Margin table. Normally you make a choice of structure at the time that you set up your plan. As a special case, however, you can manage two forecasts by making both of the two options significant.
Using Plan and Actual as Two Scenarios (PREMIER version)
The Marketing Plan Pro PREMIER version includes a plan-vs.-actual analysis feature, another tool for developing scenarios within a given plan. Use your main plan as the standard scenario, and the “Actual” area as a second scenario. You can switch between the two easily from within your plan, and you can use the “Variance” area to show the difference between them.

10.23
CHAPTER 10: ADVANCED TABLES
Subscriptions or Churn Rate Forecasts (PREMIER version)
Who Needs a Subscription Sales Model?Whenever a business sells subscriptions, memberships, or similar services that involve continuing monthly payments, that’s a subscription model. It takes some special analysis to separate the running months’ revenue from new customers. Subscriptions may be sold annually, but the related sales are essentially monthly.
Figure 10-16 shows the first portion of a subscription sales model, also called Churn Rate model. It calculates subscriber sales for a $19.95 monthly membership business. The EasyPlan Wizard sets the Sales Forecast for a units-based forecast, not value-based. In the units area, one row shows new subscribers, one row shows cancellations (attrition), and one shows total subscribers. In the unit prices, a subscriber pays $19.95 monthly and a cancellation causes a single-month credit. You can see the resulting Sales Forecast.
FIGURE 10-16: SUBSCRIPTION SALES (CHURN RATE)
This example shows a Sales Forecast for a subscription model. Customers subscribe for a year but the Sales enter the business as subscriber months.
You can see in this figure how the cancellation formula uses a percentage assumption (3%, in Column B) so you can vary the assumption to see the impact of different cancellation rates. The formula showing in the illustration uses the ROUND function to set the cancellations to single user numbers.

MARKETING PLAN PRO MANUAL
10.24
This is another good example of an input variable programmed into column B of the Sales Forecast. That makes changing assumptions easier. You can change the rate of cancellation in this sales forecast by changing that single cell.
Subscriber months are fairly easy for monthly projections, but the system gets more complex when you need to translate subscriber months into annual forecasts. Figure 10-17 shows a detailed treatment of the subscription or churn Sales Forecast for the years, instead of months. Some of the formulas require detailed explanation.
FIGURE 10-17: SUBSCRIPTION (CHURN) MODEL YEARS FORMULAS
For the annual subscriptions, each subscriber is 12 subscriber months. Notice that rows 22, 24, 28, and 30 are hidden.
• The new subscriptions estimate in 2004 (cell P15) is an input estimate. Be careful, if you are doing this kind of a forecast, to build in the growth. In this forecast the 10,000 new subscribers model may look ambitious, but at the end of the first year the business was picking up 700 new subscribers per month. At that rate the next year would bring in 8,400 subscribers (700*12). Therefore the 10,000 estimate is not as ambitious as it might seem at first glance.
• Cancellations in cells P16 and Q16 are also estimates, based on a percentage of cancellations from the subscriber base. How many people will cancel in a given year? If your business has history you might be able to turn to that history to estimate. If not, you might be able to research cancellations from other, similar business (publicly traded, perhaps, that have to

10.25
CHAPTER 10: ADVANCED TABLES
release such information). In either case, you need to make these assumptions clear and row 16 is how you do that.
• Cell P17 presents total subscribers at the end of the year, as a result of the formula: =N17+P15-P16 . The cell N17 in that formula contains the total subscribers at the end of the last month of the previous year. Cell P15 contains new subscribers for the year, and P16 contains dropouts. This isn’t the number used to calculate revenue, but it is still an important number for marketing, and benchmarking. A subscription business needs to know how many subscribers it adds and loses. Many similar businesses, subscription-based or not, need to estimate their monthly “churn,” as this is sometimes called.
• The formula in P17 needs to be adjusted for Q17, because of the impact of the annual numbers in column O. The correct formula for Q17 is =P17+Q15-Q16 .
• The formula for cell P18 needs to account for subscription months. These are paying months, and they are critical to calculating revenue. If you have 1,000 subscribers for a full year, they contribute 12,000 subscriber months. The formula in P18 is =((N17+P17)/2)*12 . This formula takes the average between the total subscribers at the beginning of the year, and total subscribers at the end of the year, and multiplies that average subscribers by 12 to calculate subscriber months.
This is not a perfect calculation. It creates a reasonable estimate. You could make that exact by developing another complete year of months. This approximation is good enough for planning purposes, however. In the end, no matter how detailed you make your future estimates, they are still estimates. We prefer to leave that fact obvious by not trying to bury estimated guesses in overwhelming detail.
As with row 17, there is a difference between column P and column Q in these formulas because of the impact of the annual column O intervening. The correct formula for cell Q18 is =((O17+Q17)/2)*12 .
The effect of taking averages for these columns is appropriate to the level of certainty in predicting subscriptions two and three years into the future.
Hiding Unused Rows with Zero ValuesFigure 10-17 shows a good example of hiding rows you don’t need. Although this Sales Forecast needs to keep track of new subscribers and total subscribers, there are no price or sales implications. We used the Format > Hide Row command to hide those rows that we didn’t need.

MARKETING PLAN PRO MANUAL
10.26
Additional Resources
? To Learn More About... Search the Help Index for...Adding tables, inserting tables, user-defined tables
Add table
Spreadsheet overview: formulas, links, programming the tables.
Spreadsheet overview
Spreadsheet functions Spreadsheet functions
Formulas to link from one table to another by referring to data
Linking tables
Range names, variables in range names, referring to range names in formulas
Range names
Locked cells, data entry cells, cell formats Locked cells
Accessing locked row and column headers for direct editing and modifcations
Table options
Depreciation and financial functions Financial Functions
Import/Export a table Import, Export
Conclusion: It’s Your WorldThere’s no reason using a marketing plan software package should limit your ability to customize your marketing plan. You can stick with the default or make it as sophisticated as you need. In the end, it is your plan. The software is a tool, but you are the craftsperson who uses that tool.

11Working with Microsoft Office®
Microsoft Office®, Word®, Excel®, PowerPoint®, Windows® and Notepad® are all registered trademarks of Microsoft Corporation.
Office® vs. Marketing Plan Pro® – Comparisons ................11.3
Working with Microsoft Word®.............................................11.5
Working with Microsoft Excel®.............................................11.9
Working with Microsoft PowerPoint® .................................11.14

We know Microsoft Office well. Our business-planning software, Business Plan Pro® began in the late 1980s as Business Plan Toolkit®, a collection of templates for Microsoft Excel and Microsoft Word.
The template product won many awards, including a “best of breed” recommendation by PC World and Newsweek in 1994. The template is still available, in updated versions, for Macintosh users.
We quickly realized that there was a need for a marketing plan tool, so we developed Marketing Plan Pro®, which utilizes the same award winning Excel and Word compatible software as Business Plan Pro.
CHAPTER 11: WORKING WITH MICROSOFT OFFICE®
11.3
CHAPTER 11: WORKING WITH MICROSOFT OFFICE
Office® vs. Marketing Plan Pro® – ComparisonsMicrosoft Office® (Office) includes Microsoft Word® (Word), a powerful word processor, Microsoft Excel® (Excel), a spreadsheet, Microsoft PowerPoint® (PowerPoint), a presentation maker, and other applications. They can share data and have a similar interface. The Office platform starts with its powerful tools and also serves as a de facto standard for exchanging documents.
The main Office tools are application programming languages, more than applications. Excel, for example, is a blank spreadsheet; it does nothing unless you program it with formulas. Marketing Plan Pro, in contrast, focuses on doing one thing very well: developing a marketing plan. Its advantages for this one task include content, ease of use, and the value of business time. Where Excel is a blank applications language to be programmed, Marketing Plan Pro is already programmed with marketing plan financials. Where Word is a blank document, Marketing Plan Pro starts with a suggested marketing plan outline. It has instructions and examples on every topic.
The time and ease of use elements are based on two main points: the spreadsheet work and the document formatting work. Furthermore, its content is unique.
Marketing Plan Pro as a Head StartIf you’re an expert user of Microsoft Office, then you can do a lot of what Marketing Plan Pro does for you in terms of programming the tables and developing the text. What you have in Marketing Plan Pro is an information-rich, helpful, guided development tool that serves as an excellent head start. You can work through the main points of your plan, and the main financial analysis, and then move it to Microsoft Office for fine tuning.
Spreadsheet – Comparison
Marketing Plan Pro gives even the Excel expert a huge head start. Anybody who has business and spreadsheet knowledge can develop a business or marketing plan using Microsoft Office. However, the spreadsheet component alone would take several good days of work. Developing a complete set of linked, financially and mathematically correct tables is a long and painstaking job. Marketing Plan Pro, on the other hand, gives that same expert a starting point of completely developed, tested, and documented tables. This can save 40, 60, maybe 100 hours of spreadsheet work. Furthermore, in the Marketing Plan Pro PREMIER version, the tables are built into a flexible interface with spreadsheet-programming capability for adding additional tables as needed, and linking those added tables to the standard ones. It’s essentially the best of both worlds, a developed spreadsheet that can be modified and linked.

MARKETING PLAN PRO MANUAL
11.4
Document – ComparisonWhile Microsoft Office is a powerful tool for developing the document, in most cases even the expert will need to manually merge text, tables, and charts together. The Word document is the source, the Excel tables and charts the illustrations. When numbers change, charts and tables need to be merged into the document again.
The main differentiator is the marketing plan content. Marketing Plan Pro includes built-in content representing years of expertise; it provides a wealth of know-how in its content-driven expert software. Help and instructions are available throughout, and the EasyPlan Wizard® walks you through the planning process from start to finish.
Perhaps the best news, as a conclusion to this comparison, is that a Microsoft Office user doesn’t have to choose. Marketing Plan Pro is built to work with the Office tools, so you can take full advantage of the marketing plan head start, then move your plan over to Office for that additional finish and polish if necessary—you don’t have to, of course, but there is that option. Furthermore, you can pull your work from Word and Excel into Marketing Plan Pro.
No Technical Support for Working in Microsoft Office ProgramsPalo Alto Software cannot provide technical support for programming in Word, Excel, or PowerPoint. Each is a very powerful application programming language, which gives you many opportunities to make mistakes and create errors. Make backups often.

11.5
CHAPTER 11: WORKING WITH MICROSOFT OFFICE
Working with Microsoft Word®Word is one of the most popular and powerful word processing tools available. It is a generally-accepted standard for transferring editable documents between different users. Marketing Plan Pro can work with Word a couple of ways:
• You can import text from Word into the text portions of Marketing Plan Pro. • You can export a completed plan from Marketing Plan Pro to a Word document, in an
already-formatted page layout with text, tables, and charts merged.
Importing from Word to Marketing Plan ProA clean text document developed in Word can be copied and pasted into Marketing Plan Pro. However, many Word documents include features not compatible with your marketing plan text.
• Marketing Plan Pro handles bullet and numbered lists like the Internet does, different from Word.
• Marketing Plan Pro has its own business formats that can’t deal with the multiple columns, text boxes, or frames created in Word.
There are two ways to paste imported text with non-compatible formatting removed:
Edit > Paste SpecialThe best way to import text from a Word document is to use the Edit > Paste Special command in Marketing Plan Pro. This command removes the text formatting styles and pastes as “text only.” Once the text has been pasted into the topic screen, you can use the text formatting features in Marketing Plan Pro.
Notepad Another approach (used with earlier versions of Marketing Plan Pro) is to open the Word document in Notepad® (a Microsoft document application included with Microsoft Windows®). Notepad will open Word documents in a similar way to the Edit > Paste Special command that cleans the text of the additional features not compatible with Marketing Plan Pro.
? To Learn more about... Search the Help Index for...Edit > Paste Special Paste Special, Edit menu, Importing from
Word
Notepad Notepad, Importing from Word

MARKETING PLAN PRO MANUAL
11.6
Exporting from Marketing Plan Pro to Word
Marketing Plan Pro will export a completed marketing plan into several different formats, including a Microsoft Word “.doc” file. The exported file will include the topic outline, complete with formatting, and all linked tables and charts.
When to Export to WordDon’t make the mistake of exporting a plan from Marketing Plan Pro to a Word document without a good business reason. You might consider exporting to Word if you needed:• More sophisticated graphics directly integrated into the plan document. • More sophisticated formatting options.• Integration with other external documents or worksheets.
For example, Marketing Plan Pro is frequently used as an instructional tool for business school classes. Marketing Plan Pro is capable of supporting a graduate-level print job for classes or competitions. However, when specific types and styles of formatting are required as a condition of the class or competition exporting to Word gives a plan the extensive formatting options available in this word processing program. The Word document is also appropriate in some larger businesses where Word compatibility is needed with other business or marketing plans and related documents.
When Not to Export to Word
If you have doubts, don’t export. Exporting to Word means you lose the live tables and other features within Marketing Plan Pro. The Marketing Plan Pro automatic format is approved and endorsed by real business readers including bankers, Small Business Development Centers (SBDCs), and investors. Your marketing plan is not going to be more successful just because of formatting options in Word. If this is the purpose, focus on the content, not the format, and let Marketing Plan Pro handle the output for you.
You Cannot Export, Modify, then Import Back
The exported Word document becomes data in Microsoft Word. What happens to it depends on you. You can use whatever Word features you want to modify and manipulate the file. You can email a Word file to a colleague. You can edit and customize.
However, you cannot export a plan to Word, change it, and then import it back into Marketing Plan Pro. The Marketing Plan Pro file format is based on a database of topics, tables, and charts, and of course the Word format is much more free form. If you make changes in the Word document the only way you can take them back into the original or source marketing plan is by copying them from Word and pasting them carefully into the proper topic, as explained in the previous section.

11.7
CHAPTER 11: WORKING WITH MICROSOFT OFFICE
Tables exported into a Word document are no longer live and will not recalculate. If you export to Word and then need to change assumptions in tables, your exported document will not reflect those changes. You would have to export again from Marketing Plan Pro to Word.
To keep the Word version of your plan and still change the financial data, you could export tables to Excel and then merge the resulting Excel documents into the modified Word document. That would have to take place in Microsoft Office, not in Marketing Plan Pro.
Export a Completed PlanYou can choose export formats. The options include:
• PDF (Adobe Acrobat Reader)• RTF (Rich Text Format)• HTML (Hypertext Markup Language)• DOC (Word-formatted document)
PDF is Adobe’s Portable Document Format. DOC files are standard Word files. RTF is compatible with many word processors, including Word. HTML creates files you can post on a website. This HTML file export is not to be confused with the automatic Web file posting at www.secureplan.com.
Figure 11-1 shows the File > Export command dialog. You can export the entire plan or the current topic you have open.
FIGURE 11-1: EXPORT A PLAN TO WORD
The “.doc” export creates a Word document containing text, tables, and charts.

MARKETING PLAN PRO MANUAL
11.8
Using Word Outline Facility After ExportAfter you export a finished plan to Microsoft Word, you can set Word to outline view and set the topic headings into Word heading styles, using the Word outline facility. The heading styles will help you manage the document by logical hierarchy, in the outline view.
The exported Word document is a complete plan, formatted with the topic headings, fonts and font styles you have in your plan. Tables and charts are imbedded into the Word file where they belong. The tables export as Word tables, and the charts are included in the Word file as graphics.
The monthly tables (appendices in the marketing plan file) are included in the export of the whole plan. Marketing Plan Pro automatically prints appendices tables in landscape mode to better display the monthly columns. We suggest you use the Section Break feature in Word, maintain the standard Portrait orientation for the main section of the marketing plan, and change your page orientation to landscape for printing the appendices section.
Exporting to Acrobat FilesYou don’t need to export a plan to Word to send a copy to somebody else. You can also export the plan to Adobe Acrobat’s portable document format (.pdf). The .pdf format displays a complete document as if it were printed. Most computers can read .pdf files, but not edit them—they are read only.

11.9
CHAPTER 11: WORKING WITH MICROSOFT OFFICE
Working with Microsoft Excel®Marketing Plan Pro has built-in linked tables (covered in Chapter 6, Your Plan Tables, and Chapter 10, Advanced Tables), which are quite compatible with Microsoft Excel. They are programmed using the same spreadsheet programming you use in Excel. Unlike the standard Excel spreadsheet, these tables are already programmed, full of help, and carefully documented. Important formulas are locked to prevent inadvertent errors. Furthermore, you can complete a full marketing plan without doing any Excel programming; just type in your numbers. However, if and when you need them, the underlying spreadsheet capabilities are there.
Exporting from Marketing Plan Pro to Excel
Marketing Plan Pro exports its tables to a complete Excel workbook, with all range names, formulas and calculations accessible.
1. Use View > Table menu to view any table. Choose File > Export. 2. The Export command gives you two options: Plan or Spreadsheet. Choose Spreadsheet.3. The Export file navigation dialog opens up, asking for file name and folder. Be careful to note
the file name (it should end with .xls) and the directory for the file you are creating.
FIGURE 11-2: EXPORT TO EXCEL
You can export the entire Marketing Plan Pro spreadsheet to Excel.

MARKETING PLAN PRO MANUAL
11.10
Recommended Steps after Export to Excel
Open the exported file in Excel and use the Save As command to save it immediately in the latest Excel format, with a different file name.
• If you work with Excel 2000, for example, save it as a standard Excel .xls formatted file. • This avoids many file format problems, makes your files more robust, and gives you a
backup of your file as it was before you started working with it.• Giving it a different file name means you’ll always have the original exported file as a
reference.
Caution after Export to ExcelWhile your tables are inside Marketing Plan Pro, they are protected several ways—beginning with worksheet and formula locks—to avoid accidental errors. After export to Excel, those protections are gone, so be careful. The export to Excel can be the marketing-planning equivalent to getting “enough rope to hang yourself.”
Since Excel is an application programming language, after you export your Marketing Plan Pro tables to an Excel workbook, you can do anything Excel allows. That includes changing formulas, deleting necessary range names or worksheets, which are changes that will destroy the workbook you started with.
For this reason, Palo Alto Software does not offer free technical support once Marketing Plan Pro tables are exported to Excel.
Working with the Exported Tables in Excel• Always keep the original exported file unchanged, so you can refer back to it. If you want
to start again from the original export, open the original file and use the Excel Save As command to create a copy of it with a new file name.
• Make sure you see the sheet tabs. They are named to match your tables. For example, the Marketing Expense Budget table is in a sheet named “Expense Budget,” the Sales Forecast is in a sheet named “Sales Forecast,” and so forth.
• Confirm that the sheet tabs are unlocked. In Excel, use the Tools > Protection > Unprotect Sheet command (no password will be required).
• Don’t delete or modify the Logistics worksheet. Deleting the Logistics worksheet will effectively destroy your workbook. The Logistics worksheet is full of vital programming variables that are used throughout the workbook. If you delete it you’ll have hundreds of #REF and #VALUE errors.
• Don’t delete range names. Range names are vital to formulas throughout the workbook. You can add new ones, but don’t delete existing ones. The result will be #REF and #VALUE errors.
• You can use the Go To command in the Edit menu to view the range name references.

11.11
CHAPTER 11: WORKING WITH MICROSOFT OFFICE
• Make sure you show row and column headings and watch for hidden rows and columns. • If your plan settings didn’t show Market Demographics, for example, then your exported
worksheet won’t show Market Demographics. • The hidden rows will be in the worksheets, but hidden. Watch the row numbers to catch the
hidden rows. Use the Excel format commands to unhide rows. The Format menu includes a Row command, and the Row command includes an Unhide command.
• Generally, each worksheet is one marketing plan table, but watch for multiple options within a single worksheet. Specifically the PREMIER version Sales Forecast includes two sales forecasts, the value-based and the units-based. One of the two will have your numbers and the other will be blank.
• Don’t delete the unused tables, select the rows you don’t use and run the Hide command under Rows in the Format menu. Deleting the extra tables will cause #REF errors.
• Always keep the original exported file safe so you can refer back to it. If you want to go back and start again, use the Save As command again.
Import from Excel to Marketing Plan Pro®
Importing from Excel into Marketing Plan Pro is generally a matter of copying from Excel and pasting into Marketing Plan Pro. There are two key issues you should be aware of from the beginning:
1. The main Marketing Plan Pro tables are already developed, tested, and documented. You can’t paste Excel over them without regard for the existing format and structure. • You can’t paste Excel over black (locked) cells. • The key tables have unprotected data entry cells for the first year in columns C through
N. Column O, which calculates first-year totals, is locked. Columns P through S, for years two to five, are unlocked. To paste from Excel, you’d have to copy blocks with the same structure, no more than 12 columns at a time for the monthly data.
2. Excel leaves each cell locked by default, so what you copy from Excel and paste into Marketing Plan Pro will end up locked.• Use Excel commands to unprotect cells before you copy and paste. Or use Marketing
Plan Pro commands after you copy and paste.• You can find those commands by selecting cells and using Format > Cells > Protection
and chosing Unlock.
Copy Locked CellsIf you copy locked cells from Excel to Marketing Plan Pro, they will remain protected. You must unlock them in Marketing Plan Pro in order to change them after copying.

MARKETING PLAN PRO MANUAL
11.12
(PREMIER version) Paste Excel Worksheet to User-Defined Table
You can copy a range from an Excel worksheet and paste it into a user-defined table in Marketing Plan Pro PREMIER, as shown in Figure 11-3.
FIGURE 11-3: (PREMIER VERSION) PASTING TO USER-DEFINED TABLES
The Excel worksheet on the top was pasted into a user-defined table on the bottom.
• In Microsoft Excel (the example was developed with Excel 2000), make sure that the spreadsheet area you want to paste contains only unlocked cells. If you have any doubts, select the area you want to copy and paste, then use the Format > Cells > Protection tab to make sure those cells are not protected. From within Excel, select and copy the source area you want to use within Marketing Plan Pro.
• Use the Insert tool from the Plan Outline toolbar to insert a new table attached to a topic. Select the cell you want to have as the upper left cell in the target range. Remember, those cells should be unprotected in Excel.
• Use Edit > Paste Special > Paste All command. Your Excel spreadsheet will now be pasted into your user-defined table.

11.13
CHAPTER 11: WORKING WITH MICROSOFT OFFICE
If you do work with this paste process, please remember some of the important tips and traps for pasting from Excel to Marketing Plan Pro:
• A simple copy and paste from Excel to Marketing Plan Pro copies values only, not formats or formulas. To copy and paste spreadsheet information completely, you need to use the Paste Special command in Marketing Plan Pro and chose Paste All to paste both formulas and formats.
• If you paste a formula from one worksheet containing an erroneous reference, you’ll get a #REF error in the target worksheet. That’s true in Excel alone, and it’s also true when you paste from Excel into Marketing Plan Pro. For example: If you copy the formula =C9 from cell C10 in Excel into cell C1 in Marketing Plan Pro
(or Excel), you get a #REF error. Marketing Plan Pro wants to reinterpret the formula to refer to the relative row number; 9 is 1 less than 10, but when you paste into row 1 you don’t have the possibility of a lower row number.
• Copy a formula =XYZ (referring to a range name not already in Marketing Plan Pro) from Excel and paste it into Marketing Plan Pro. Marketing Plan Pro will behave like Excel in this instance. It creates a new range named XYZ located in a position relative to the target cell.
• Copy the formula =sales from an Excel worksheet and paste it into Marketing Plan Pro. Marketing Plan Pro will create a new range named =sales_2 and will give the target cell the formula =sales_2. To make the cell refer to the Marketing Plan Pro range named sales, you have to edit the formula manually.
External References not Compatible
An Excel formula that refers to an external file will produce an error message in Marketing Plan Pro. Excel can refer to values in other Excel files, but Marketing Plan Pro cannot. If you need the information in that external file to be included in your marketing plan, then create a new worksheet within Marketing Plan Pro and copy and paste the information you need into it.

MARKETING PLAN PRO MANUAL
11.14
Working with Microsoft PowerPoint®
PowerPoint is a Different MediumA presentation is a different medium. It is about a business/marketing plan, but isn’t the same as a business/marketing plan. Don’t try to directly include portions of your plan—stick to graphics, and bullet point summaries. Even a mission statement should be modified for use in PowerPoint. Refer to key points only, not the full text.
For working with PowerPoint, please make sure to read through Chapter 8: Print and Publish, discussion on developing presentations to go along with your marketing plan. Marketing Plan Pro includes specialized templates for PowerPoint, and Chapter 8 includes details on the style and content of the PowerPoint presentation.
As that chapter states, a marketing plan presentation is a specialized communication. Most of these presentations need to summarize an entire marketing plan in a streamlined set of 7-20 slides for a talk that lasts about 30 minutes.
• It uses graphics to illustrate main points. The slide displays the chart only, so the presenter fills in the details.
• It uses bullet points and key phrases only. They are reminders and placeholders, not complete thoughts.
• It is all summary. The text is large and there isn’t much of it. Charts tell most of the story.
A good presentation is about results. It is short and exciting. It is concise, making its key points quickly, with precision.
It needs to be optimized for the business purpose. Normal marketing plan presentations have to say what they can in 30 minutes. They avoid details and stick to highlights. Some special occasion presentations, in contrast, need to go into great detail on specific points. Always, even when details are important, keep the text large and the graphics simple. People don’t read details from a presentation.
This kind of optimized presentation tool isn’t created automatically by computer software, and particularly not by marketing plan software. The format is different, the purpose is different, so the tool itself must also be different. There’s no way a marketing plan document can automatically create a PowerPoint presentation without ending up with a poor presentation, too much text, too many numbers, and not enough summary.
You can, however, use your Marketing Plan Pro marketing plan as the important content for the presentation.

11.15
CHAPTER 11: WORKING WITH MICROSOFT OFFICE
Importing to PowerPoint from Marketing Plan Pro
Export First to Word
In the following example, we first exported our marketing plan to Microsoft Word, then used Word and PowerPoint together to create the marketing presentation. The advantage is that the export to Word gives us a manageable document with graphics and tables easily available for copy and paste. If we stay in Marketing Plan Pro, we have to export each graphic as a separate file, then import those files into the PowerPoint presentation. Export to Word is quicker. The Word export is explained earlier in this chapter. Figure 11-4 shows an example of developing a slide presentation from an exported business plan:
FIGURE 11-4: DEVELOPING POWERPOINT SLIDES
The background is a Microsoft Word file produced from a Marketing Plan Pro plan exported to Word. The foreground is a PowerPoint presentation.
Use PowerPoint Presentation Templates
Marketing Plan Pro includes five PowerPoint business/marketing plan templates that can help you deliver your marketing plan in a clear, concise, professional, graphically sharp presentation. Click the Resources button and choose Make it Happen > Present > Presentation Templates. Choose any of the bullet list links. The template will open in PowerPoint and you can then copy/paste text, tables and charts from your exported Word document (as described earlier).

MARKETING PLAN PRO MANUAL
11.16
FIGURE 11-5: POWERPOINT PRESENTATION TEMPLATES
Marketing Plan Pro has five PowerPoint presentation templates included in Resources.
Remember: the Medium has Changed
Remember the purpose of a PowerPoint presentation. You want summaries in the presentation, not detail. Contents should change to reflect the different medium of communication.
• Summarize, don’t quote. For example, don’t include the whole mission statement, include key bullets.
• Use graphics as talking points.• Less text is better. Don’t copy your marketing plan texts into your PowerPoint presentation,
make bullets that summarize in a few words. • Generally, PowerPoint text should not go below 18 points. If you need smaller than that to fit
the text, you probably have too much.
Import PowerPoint Graphics into Marketing Plan Pro
Marketing Plan Pro doesn’t offer a direct import from PowerPoint. You can, however, import a graphic image created from PowerPoint into Marketing Plan Pro. An example is an organization chart, which PowerPoint does well.
A
Actual tables 9.5Sales Forecast 9.5
Adobe® Acrobat Reader 1.3
B

11.17
CHAPTER 11: WORKING WITH MICROSOFT OFFICE
Here’s how to do an organization chart for your business plan using PowerPoint, and include it as an illustration in the plan:
1. Use PowerPoint to create the organization chart. Figure 11-6 shows the PowerPoint facility (in OfficeXP) for an automatic Organization Chart.
FIGURE 11-6: POWERPOINT ORGANIZATION CHART
The PowerPoint Organization Chart template is a useful tool for developing an organization chart to include in your plan.
2. Use the rulers in PowerPoint to resize the graphic to fit well into the Marketing Plan Pro page. A width of 5” is usually a good size.
3. Save the Organization Chart as a graphic file using the PowerPoint Save As command. PowerPoint will give you the option of saving just the single slide, not the whole presentation. Use the dialog options in PowerPoint to save the graphic as either *.jpg, *.gif, *.bmp, or *.wmf file.
4. Within Marketing Plan Pro, find the target topic for the organization chart from the Plan Outline screen and highlight it to open it in Text Mode.
5. Position your cursor in the topic screen where the image will display. 6. Right-click with your mouse to open the pop-up menu. Select Insert > Image from the
menu options. 7. Locate the graphic file created in PowerPoint and select from the dialog box, as shown in
Figure 11-7.

MARKETING PLAN PRO MANUAL
11.18
FIGURE 11-7: INSERT GRAPHIC IMAGE IN A TEXT TOPIC
Locate the .gif, .bmp, .wmf, or .jpg graphic image to insert into your text topic.
Insert Image You can also use the Insert Image icon from the toolbar to access the dialog box.
Notes on Graphics:Graphics need to fit onto a standard 8 1/2 x 11” paper for printing. Also, some printers may not have enough memory to print a large graphic along with text and other images on a single page. Consult your print manual for more information.
(PREMIER version) Build an Organizational ChartUse the Insert > Organizational Chart command to build the graphic into a text topic. Instructions on how to build an organizational chart within Marketing Plan Pro can be found in the Help index.

12Working with QuickBooks®
QuickBooks® is a registered trademark of Intuit Corporation.
For QuickBooks® Pro or QuickBooks® Premier ................ 12.3
Matching the Categories..................................................... 12.4
The QuickBooks Pro Import................................................ 12.6
After the QuickBooks Import..............................................12.11
Developing Your Plan, After the Import ............................ 12.13
Developing and Managing Budgets.................................. 12.14

QuickBooks® is the small business standard for bookkeeping and accounting. Far more small businesses keep books with this application than with all others combined.
If you use QuickBooks Pro or QuickBooks Premier for your bookkeeping, you can also work easily with a marketing plan in Marketing Plan Pro® that matches the bookkeeping information in QuickBooks. You can import your sales, cost of goods, and expense categories automatically, so you don’t have to retype. You can also use past data from QuickBooks as a starting point for estimating future results.
Remember, however, that planning is different from accounting. Marketing Plan Pro gives you a starting point for future estimates, not a substitute for detailed accounting statements of past results.
CHAPTER 12: WORKING WITH QUICKBOOKS®

12.3
CHAPTER 12: WORKING WITH QUICKBOOKS
For QuickBooks® Pro or QuickBooks® PremierMarketing Plan Pro® has a QuickBooks® Pro import function which gives you an optimized import that pulls the major categories and useful information from your QuickBooks files (although this applies only to the QuickBooks Pro or QuickBooks Premier versions of QuickBooks). It doesn’t attempt to duplicate your bookkeeping or accounting functions.
Import from QuickBooks Pro for forecasting, and categories, not exact past amounts. The QuickBooks import will not give you exact duplicates of your QuickBooks statements. There are timing issues that change amounts slightly from month to month. It will give you categories, and close approximations you can use to forecast the future.
Here’s what the QuickBooks Pro import function will get from your QuickBooks Pro data:
• It will import your QuickBooks categories for sales, costs of goods, and expenses. • The import will match major categories only, not subcategories. Accounting information for
subcategories will be summarized in the major categories. • As an option, which you control, it gives you quick estimations of future amounts by taking
approximate past amounts and applying growth rates. The approximate amounts are only slightly different from accounting totals.
Bring Planning and Accounting TogetherQuickBooks and Marketing Plan Pro have different but related purposes. The key to bringing them together is being able to show the same categories in your Marketing Plan Pro projections as in your QuickBooks bookkeeping. This gives you a very powerful tool for planning and management.
Limitations When Using QuickBooks BASIC
The Marketing Plan Pro QuickBooks import depends on internal capabilities of QuickBooks Pro and Premier versions, not available in QuickBooks Basic version. If you use QuickBooks Basic and want the additional compatibility for your Marketing Plan Pro, contact Intuit to upgrade your QuickBooks. Contact information is available at www.QuickBooks.com. Without the upgrade, however, you can still work easily with your QuickBooks data, by using the flexibility of Marketing Plan Pro to match your QuickBooks categories. You can follow the matching chart of account details and create your own QuickBooks capabilities just by adjusting row names to categories.

MARKETING PLAN PRO MANUAL
12.4
Matching the CategoriesWorking these two applications together starts with automatically matching the categories so your future plan will match your past results. The import from QuickBooks will set your categories in both applications so they match well enough for analysis and management tracking. Figure 12-1 shows the Profit and Loss in QuickBooks. Figure 12-2 shows how this can look almost identical in Marketing Plan Pro.
FIGURE 12-1: QUICKBOOKS® PROFIT AND LOSS
The QuickBooks Profit and Loss is one of its standard reports. This is the condensed Profit and Loss for a fiscal quarter. Note that in this version the categories are collapsed, not expanded.
Figure 12-2 shows the corresponding Marketing Expense Budget table in Marketing Plan Pro. It was produced by importing the data from QuickBooks as explained in the rest of this chapter.

12.5
CHAPTER 12: WORKING WITH QUICKBOOKS
The numbers shown are taken from previous results, but multiplied by an assigned growth rate. This is not a statement of past results, but a plan for the future.
FIGURE 12-2: MATCH MARKETING PLAN PRO WITH QUICKBOOKS
The Marketing Plan Pro marketing plan for Rock Castle Construction has the same categories as the QuickBooks bookkeeping chart of accounts. This match makes it easier to work with both programs to manage the company.
Marketing Expenses Only?As you can see in the examples here, QuickBooks doesn’t normally distinguish between marketing expenses and the rest of your business expenses. If you want your marketing plan to focus on marketing expenses only, import all expenses and then delete the ones that don’t apply.
Recommended SequenceGenerally you’ll find it easier to develop your categories in QuickBooks first and then match them in Marketing Plan Pro. The QuickBooks categories will relate more directly to your bookkeeping needs. Marketing Plan Pro will import them as part of the import process.
As you can see in the illustration, the match includes all the major categories on both sides. Even the fiscal year structure matches the QuickBooks example. The example took data included in the QuickBooks distribution disk and accommodated the categories list in Marketing Plan Pro to make it match. Most of this import process is automatic, but of course the import includes all expenses, not just marketing expenses. If you choose to focus your plan on marketing expenses alone, then you’ll have to delete non-marketing expenses from total expenses manually.

MARKETING PLAN PRO MANUAL
12.6
The QuickBooks Pro ImportThe QuickBooks Pro import process starts with an option in the Plan Setup, as shown in Figure 12-3. You tell the EasyPlan Wizard® you’re working with QuickBooks so it can set up a plan to match.
FIGURE 12-3: WIZARD STEP FOR QUICKBOOKS
Tell the EasyPlan Wizard you want your plan to work with QuickBooks.
QuickBooks Import Matches, but Doesn’t DeleteMarketing Plan Pro will not delete rows to make your expenses list match the expenses in QuickBooks Pro. It matches expenses with the same names, and if names don’t match, it leaves them as they are in Marketing Plan Pro. It never deletes. To make an exact match, you must delete extra expense rows yourself, first, before the import.
The Import ProcessFor the import procedure, go to the File menu to find the Import command, which brings up the form shown in Figure 12-4.

12.7
CHAPTER 12: WORKING WITH QUICKBOOKS
FIGURE 12-4: SELECTING QUICKBOOKS IMPORT
Select the QuickBooks import option from the input form.
For the next step in import, Marketing Plan Pro needs to know how much information you want to import. You have the options shown in the form in Figure 12-5. You can import information for income, which is your sales information; and for expenses. This is the first set of choices you can make.
FIGURE 12-5: QUICKBOOKS IMPORT OPTIONS
You have options with QuickBooks import. You can choose which information you want to import.
The QuickBooks import allows you to select the expense categories you want to include. Figure 12-6 shows the form that selects the categories by clicking on them. Since you are doing a marketing plan, you might want to include only the expenses associated with marketing. In the example, only some of the expense categories will be transferred to the marketing plan.

MARKETING PLAN PRO MANUAL
12.8
FIGURE 12-6: SETTING CATEGORIES TO IMPORT
The import process includes this step, which lets you select marekting expense categories from among the expense categories.
Figure 12-7 shows the next step, which lets you decide whether you want to bring in values from QuickBooks, for forecasting purposes, or just account names (categories).
FIGURE 12-7: SETTING IMPORT OPTIONS
Use this form to set import for either forecasting values or simply account categories.
This is your option. Some people like to use past values for forecasting, others prefer to start with no values and set their own values. Marketing Plan Pro includes powerful forecasting tools, such as the Forecaster and Row > Fill features, to make for easier forecasting. However, some people prefer to project past data forward into the future.

12.9
CHAPTER 12: WORKING WITH QUICKBOOKS
The QuickBooks import isn’t a substitute for good forecasting. It doesn’t do data analysis, or technical forecasting. It will, however, take a close approximation of past results and apply any percentage growth you want to create future estimates for sales, costs of goods, and expenses.
In the next step, if you choose to use past data for forecasting, you set the time frame for the forecasting step. Most people choose to forecast based on previous full fiscal years, because of seasonality. However, this is your choice. Figure 12-8 shows the dialog for setting time frame.
FIGURE 12-8: SETTING IMPORT DATES
As the import process continues, you use this form to define the past months for which you want to import your data for forecasting purposes.
The import will draw from any 12-month period you specify with the form. Most people choose to import a previous complete fiscal year. That way the months of the calendar match, catching trends related to seasonality.
Making your Projections
In the next step, if you chose to use past data for forecasting, you set the percentage growth rates to assign to sales, costs of goods, and expenses. Each of these three percentage growth rates will be assigned to the entire category of past data, to create future projections.

MARKETING PLAN PRO MANUAL
12.10
FIGURE 12-9: SETTING PERCENTAGE GROWTH ESTIMATES
You use this form to set growth rates, as percentages, to convert your past year’s QuickBooks data into estimates for your next planning year.
The import process will automatically assign growth rates to all of the relevant categories. It will automatically multiply each month’s past result, in each item in each category, by 1 plus the growth rate for each month in the data.
QuickBooks Pro Data Import is Not ExactMarketing Plan Pro imports QuickBooks Pro data based on what is available in a specific transfer file. Not all monthly details are available. The imported information is useful for forecasting, but is not exact. Payroll, for example, gets only an annual total, so it divides by 12 to estimate monthly amounts.

12.11
CHAPTER 12: WORKING WITH QUICKBOOKS
After the QuickBooks ImportThe QuickBooks import affects three tables: the Sales Forecast, the Expense Budget, and the Contribution Margin (PREMIER version) tables.
Sales Forecast
Figure 12-10 shows the Marketing Plan Pro sales forecast produced by the data and assumptions we use for this example, from Rock Castle Construction. There is only one line for sales (“Construction”) and only one for costs of goods in this example because the source file in QuickBooks Pro had only the single categories. You can also see in the example how Marketing Plan Pro handled the projected 10% growth rate for sales and 5% growth for costs of goods.
Marketing Plan Pro’s handling is intended to make forecasting easier. You can see the growth rate you assigned during input, so it is easy to change. You can also see, by clicking on any cell, the formula that preserves the previous data and assigns a growth rate. In the example, you see the growth rate in the B column. Cell C4 is selected, so the edit bar shows the formula: =18171.82*(1+$B4). The 18171.82 will be either your previous sales or a close approximation, and the “(1+$B4)” will be the application of the growth rate.
FIGURE 12-10: SALES FORECAST AFTER IMPORT
The sales forecast after import from QuickBooks puts your growth rates in the second column and applies them to approximate past results from the QuickBooks Pro data.
To make the illustration shown, we used the Format > Row > Hide command to hide leftover rows in the Sales Forecast. The QuickBooks import doesn’t do that automatically.
Expense Budget
The Expense Budget already shows in Figure 12-11. The Import settings customize the Expense Budget table to match your QuickBooks. QuickBooks Pro puts lines of sales, which it calls income categories, onto its Profit and Loss statement.
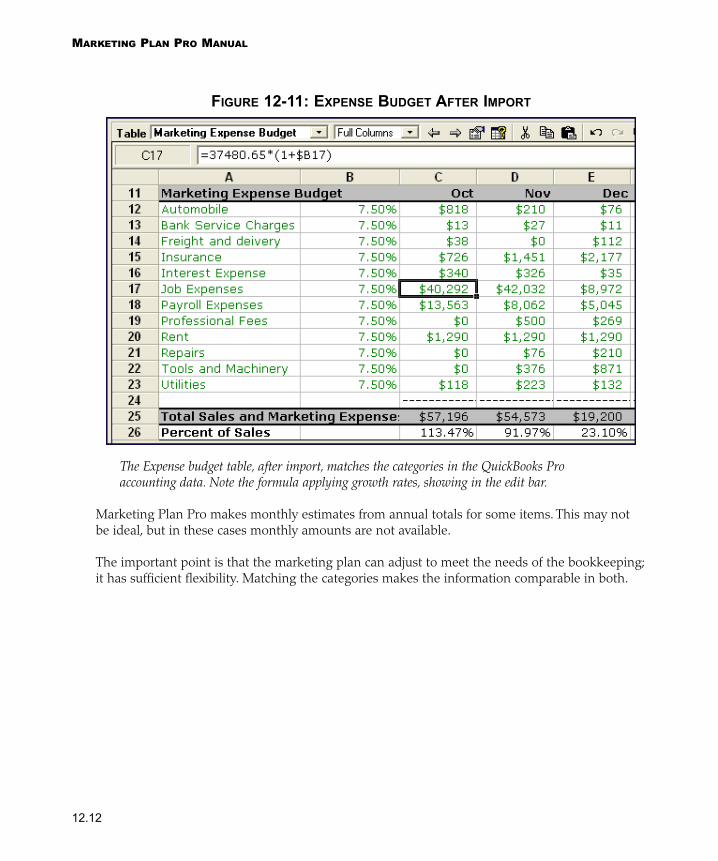
MARKETING PLAN PRO MANUAL
12.12
FIGURE 12-11: EXPENSE BUDGET AFTER IMPORT
The Expense budget table, after import, matches the categories in the QuickBooks Pro accounting data. Note the formula applying growth rates, showing in the edit bar.
Marketing Plan Pro makes monthly estimates from annual totals for some items. This may not be ideal, but in these cases monthly amounts are not available.
The important point is that the marketing plan can adjust to meet the needs of the bookkeeping; it has sufficient flexibility. Matching the categories makes the information comparable in both.

12.13
CHAPTER 12: WORKING WITH QUICKBOOKS
Developing Your Plan, After the ImportAfter the import from QuickBooks, your marketing plan is ready to go. Continue to develop your projections. Your plan is ready to go, as well as any other plan developed in Marketing Plan Pro, without the import. Figure 12-12 shows an example of using the Forecaster tool, as explained in Chapter 6, to polish the estimates from the original import.
FIGURE 12-12: USING FORECASTER TO DEVELOP PROJECTIONS, AFTER IMPORT
After import from QuickBooks, continue developing your plan. Make your projections as accurate as you can.

MARKETING PLAN PRO MANUAL
12.14
Developing and Managing BudgetsWhen the plan and the accounting match, you have choices regarding budgeting, tracking, and management follow-up.
QuickBooks Budget
You can use your marketing plan to develop budgets that you can transfer back, manually, into your QuickBooks budget. Figure 12-13 shows an example.
FIGURE 12-13: QUICKBOOKS BUDGET
You can use your marketing plan to help determine the numbers in your QuickBooks budget. This example takes automobile expenses from the plan and puts them into the budget.
Marketing Plan Pro Plan vs, Actual (PREMIER version)
The other alternative is to keep the budget within Marketing Plan Pro PREMIER version, and refer to it for plan-vs.-actual analysis. You can use the marketing plan to record plan, actual, and variance. Transfer actual numbers from QuickBooks to the Marketing Plan Pro PREMIER Actual table view for Profit and Loss. Figure 12-14 shows this example.

12.15
CHAPTER 12: WORKING WITH QUICKBOOKS
Figure 12-14 shows how easily you can move your actual results from QuickBooks to your marketing plan when the categories match. The view shows the Actual view of Expense Budget within Marketing Plan Pro PREMIER version, showing the December results from a QuickBooks report from the Larry’s Landscape QuickBooks sample.
FIGURE 12-14: ACTUALS RESULTS TO MARKETING PLAN PRO®
Use the Marketing Plan Pro PREMIER version Actual mode to record actual results from QuickBooks and track management implications of running numbers.
Using the QuickBooks Export to ExcelIf you match your QuickBooks Export to Excel so it matches the structure of Actual worksheets in Marketing Plan Pro PREMIER, you can export to Excel and then copy and paste to Marketing Plan Pro. QuickBooks Export has a lot of power and flexibility, so you do have to tailor it to match the 12-months-in-a-row structure of your marketing plan. Use the QuickBooks Profit and Loss Standard report, make sure it is fully collapsed, set the columns to Months, and export to Excel with the advanced settings set to not show spaces between columns. The result will be easy to paste as values to the Actual table in Marketing Plan Pro (PREMIER version).

MARKETING PLAN PRO MANUAL
12.16
Showing Variance in Marketing Plan Pro (PREMIER version)
When actual results are added in, Marketing Plan Pro PREMIER can calculate variance (plan-vs.-actual) automatically. Figure 12-15 shows the variance for this example.
FIGURE 12-15: SHOWING THE VARIANCE
After actual results are available–from the QuickBooks bookkeeping–then Marketing Plan Pro can track the Variance.

Appendix A: Range Names

Marketing Plan Pro uses named ranges in the tables to simplify reading and working with formulas.
It is not necessary to know the built-in formulas or the range names; we provide this information for those who would like to know.
Named ranges can be used to create other specialized formulas, as described in more detail in Chapter 10, Advanced Tables.
APPENDIX A: RANGE NAMES

A.3
APPENDIX A: RANGE NAMES
average_per_unit_revenue =’Break-even’!$O$6
average_per_unit_variable_cost =’Break-even’!$O$7
contribution_margin (Premier Version only) =’Contribution Margin’!$A$18:$BS$18
direct_cost_of_sales =’Contribution Margin’!$A$4:$BS$4
estimated_monthly_fi xed_cost =’Break-even’!$O$8
gross_margin =’Contribution Margin’!$C$8:$BS$8
monthly_sales_breakeven =’Break-even’!$O$3
monthly_units_breakeven =’Break-even’!$O$2
sales =’Contribution Margin’!$C$3:$BS$3
salesunits =’Sales Forecast’!$A$32:$BS$32
salesvalues =’Sales Forecast’!$A$5:$BS$5
subtotal_direct_cost_of_sales_units =’Sales Forecast’!$A$45:$BS$45
subtotal_direct_cost_of_sales_values =’Sales Forecast’!$A$10:$BS$10
total_cost_of_sales =’Contribution Margin’!$A$7:$BS$7
total_sales_and_marketing_expense =’Contribution Margin’!$C$16:$BS$16
total_unit_sales =’Sales Forecast’!$A$19:$BS$19
variable_cost_per_unit_calculated =’Break-even’!$O$15
Range Name Table and Range

MARKETING PLAN PRO MANUAL
A.4
This page intentionally blank.

Appendix B: Collaboration

APPENDIX B: COLLABORATION
Marketing Plan Pro® PREMIER version includes a unique email-based collaboration tool. You can use it with plan development teams to share the process. Collaboration allows you to send and receive portions or components of a plan, with tracking of who modified, and when. You can choose when to accept a received portion of a plan, and whether to accept it and override what’s there, on a component-by-component basis.
Details on how to use collaboration are included in the context-sensitive help in the application. This appendix is a basic review of when and why to use it.

B.3
APPENDIX B: COLLABORATION
Collaborative Planning (PREMIER version)As soon as a marketing plan involves more than a single person, it should become a collaborative effort. Teams implement plans, so teams should develop plans.
Normally a team includes different people with different skill sets and different responsibilities. The classic entrepreneurial team includes a leader, a numbers or finance oriented person, a sales and/or marketing oriented person, and a production person. The ideal marketing plan for a team like this is a plan developed jointly by team members.
Figure C-1 shows the main form for Marketing Plan Pro collaborative planning.
FIGURE B-1: COLLABORATION MAIN FORM
The collaboration form lets you manage team members, send and receive email collaboration, and save topics or other components to specific files. Note how on this form one team member will receive topics, a table, and the charts in the Market Summary chapter of this plan.

MARKETING PLAN PRO MANUAL
B.4
Email Collaboration (PREMIER version)
The unique collaboration feature of Marketing Plan Pro uses the favorite tool for business communication known for file sharing and real-world teamwork—email. Email doesn’t require posting to anybody’s Web or Internet site, or additional security measures. Email is as private as your email server and email management.
Manage Team Members
As explained in detail in Help, use the main collaboration form to manage team members’ names and emails. You can add as many team members as you like.
Select Plan Components to Share
Select plan components (topics, tables, and charts), select team members to receive them, and send them the files. They will receive a file in their email.
Collaboration Uses the Plan OutlineThe collaboration list uses the Plan Outline. To collaborate on tables or topics not currently in the outline (e.g., Actual Sales or Actual Expense Budget), use the Insert menu or Insert icon to add them to the Plan Outline.
Receive and Accept Each Component
As a team member receives a collaboration file, there is an opportunity to track each component for date modified, and by whom. The person who receives the email collaboration chooses to accept or reject each component individually. Of course he or she can also accept all, or reject all.
Collaboration vs. Import/Export ComponentYou can also export a component, send it to somebody else, then they import it. The difference between collaboration and export-import is tracking modifications and replacing. Importing adds the component to your plan, duplicating what’s there if necessary. Collaboration replaces what’s there, if you accept the collaborative component.
? To Learn More About... Search the Help Index for...Collaboration
Collaborate, Plan Components

Appendix C: Import and Export Components

APPENDIX C: IMPORT AND EXPORT COMPONENTS
Marketing Plan Pro® PREMIER version includes the ability to build and share components of a plan, such as add-on tables with marketing-specific details. This is called export.
Both PREMIER and PRO versions can import exported components. Some examples of these components are:
• Company-specific sales and expense forecasts.
• Industry-specific add-on worksheets, or sales or expense listings.
• Past or previous data, for use as a basis for forecast.
• Extra years in months, or quarters for more complex plans.

C.3
APPENDIX C: IMPORT AND EXPORT COMPONENTS
Export Component (PREMIER version)Marketing Plan Pro® PREMIER version can export a component of a plan—text topic, table, or chart—so that it can be imported into another plan. The command is in the File menu. The discussion here is about common or suggested uses of this facility:
• Companies spreading marketing planning and forecasting responsibilities can create a standard form for Sales Forecast or Expense Budget, for example, then have dozens or hundreds of people import that form for their own plans.
• Franchisors can create blank master forms for Sales Forecast and Expense Budget, etc. The tables are left with the numbers blank, so prospective franchisees can make their own projections (less legal liability).
• Business plans requiring additional years in months or quarters can export important statements (e.g., Sales Forecast, Expense Budget, Contribution Margin) and then import them back for duplicates to use for the additional time frames.
• Content experts can create components containing their special expertise: marketing planning forms for nightclub businesses, or bed and breakfast inns.
• Consultants can export their preferred formats for tables, for example, and share them with consulting clients.
• As one planning year ends, with actual results recorded properly in the Actual tables of the plan, export the Actuals for that year and absorb them into the next year’s plan. That gives you the previous year’s actual results as your starting point as you develop the next year.
Import ComponentAn exported component from Marketing Plan Pro PREMIER version can be imported into either PRO or PREMIER. This facilitates work between consultants and clients, plan experts and planning satellite sites, franchisee and franchisor, etc. The Import Plan Component command is in the File menu. Details of how to use this feature are in the online help.
Collaboration vs Import/Export ComponentYou can also collaborate with team members, sharing your work on the same file. The difference between collaboration and export-import is tracking modifications, and replacing. Importing adds the component to your plan, duplicating what’s there if necessary. Collaboration replaces what’s there, if you accept the collaborative component.
? To Learn More About... Search the Help Index for...Import/Export Components Import, Export, File menu
Collaboration Collaborate, Plan Components, File menu

MARKETING PLAN PRO MANUAL
C.4
This page intentionally blank.

Index

MARKETING PLAN PRO MANUAL
i.2
A
Actual tables 9.5Sales Forecast 9.5
Adobe® Acrobat Reader 1.3Advanced Formulas
Excel Worksheet to a Blank Table 10.14Tips on Pasting 10.15
Inserted Table to Sales Forecast 10.13Sales Commission 10.8Sales to Contribution Margin 10.10
B
Break-even AnalysisRow Defi nitions-Break-even 6.11
Average Per-unit Sales Price 6.11Average Per-unit Variable Cost 6.11Estimated Monthly Fixed Cost 6.11
BudgetMarketing Plan Pro 12.14QuickBooks 12.14
C
CellsColumn Headings 6.3Data vs. Locked 6.3Row Headings 6.3
Cell Value 3.11Character Symbol, Insert 5.16Charts, Examples 7.3
Break-even Analysis 7.4, 7.8Market 7.3Milestones 7.3Sales Monthly 7.3Strategy Pyramid 7.3, 7.12
Charts, Help on 7.6Charts, Instructions and Examples 7.7Charts, Linked to Table Numbers 7.4Charts, Printing 8.12Charts vs. Tables 7.3Chart of Accounts
Marketing Plan Pro 12.5Matching Categories 12.4QuickBooks-Profi t and Loss 12.4
Churn Rate 10.23Contribution Margin-Advanced Formulas 10.6Create a new Plan 2.4
D
Delete an Expense Row 3.16
E
EasyPlan WizardOverview 4.3Plan Setup 2.5
Edit Row Label 3.10Examples
Table 6.4Excel, Microsoft 11.9Expenses
Expense Budget 3.16Export
.doc 8.15
.htm 8.15
.pdf 8.15
.rtf 8.15
.txt 8.15Directory of Files 8.15MS-Excel 11.9MS-Word 11.6
F
Fill Right 3.11With Growth Factor 3.11
ForecastMarket 6.21
Forecaster 6.9Import from QuickBooks® 12.13
FormattingText 5.3
HTML 5.11Sample 5.4

i.3
INDEX
Toolbar 5.7Formula Backstep
Table 6.6
G
Getting Help 2.8Graphic, Insert 5.14
H
Help, Charts 7.6Help, Tables 6.39Context-Sensitive Help 2.8Help 2.8How do I? Help 2.8Planning Resources 2.9Hide Row(s) and Column(s) 3.17Hide Rows 10.25HTML Formatting 5.11Hurdle: The Book on Business Planning 2.8Hyperlink
Insert 5.17HyperLink, Insert 5.17
I
ImplementationVariance 9.4
Implement Your Plan 9.3Plan-vs.-Actual 9.3
Import, Excel 11.11MS-PowerPoint 11.15MS-Word 11.5QuickBooks Pro 12.6Tables
QuickBooks-Profi t and Loss 12.4Sales Forecast 12.11
Import a File 5.12Import Dialog Box 5.13Selecting Tables/Topics 5.13
Import Charts 7.5Import Wizard
QuickBooks
Import Dates 12.9Options 12.7Percentage Growth Estimates 12.10
Input Expenses, Expense Budget 3.16Insert
Character Symbol 5.16Graphic 5.14Text Table 5.15
Example 5.15Insert an Expense Row 3.16Insert Hyperlink
Hyperlink 5.17Insert Tables 10.13InstallWizard 1.3Instructions and Examples
Charts 7.7Table 6.4
Instructions and Examples, Table 2.7Instructions and Examples, Text 2.6
L
Linked TablesDevelop your own 6.8
Linking Tables-Advanced 10.13Date Headings in New Table 10.19New Table to Market Forecast 10.16
Link Charts, Unlink Charts 7.5
M
Market Analysis table 6.21Market Forecast 6.21Market Segmentation 6.21Microsoft Internet Explorer 1.3Microsoft Offi ce
Document--Comparison 11.4Microsoft Excel 11.9
Exporting from Marketing Plan Pro 11.9Import from Excel 11.11Recommended Steps after Export 11.10
Microsoft Word 11.5Exporting from Marketing Plan Pro 11.6Importing from Word 11.5
Offi ce vs. Marketing Plan Pro 11.3

MARKETING PLAN PRO MANUAL
i.4
PowerPoint 11.14Importing to Powerpoint 11.15Import PowerPoint Graphics into Business
Plan Pro 11.16Spreadsheet Comparison 11.3
MilestonesPlan-vs.-Actual 6.32Sorting 6.31
Milestones TableVariance 9.4
Monthly Product Update 1.9My Marketing Plan-Default Settings 3.4
N
Non-Profi tSample Plan 4.9
O
On Target: The Book on Marketing Plans 2.8Opening Screen 2.3Open an existing plan 2.4
P
Percentage Growth Estimates. See Import Wiz-ard, QuickBooks
Personalize Your Software 1.7Plan-vs.-Actual
Implementation 9.3Logic 9.4
Planning Resources 2.9Plan Outline 5.9
Delete 5.10Insert a Topic 5.10Modify Plan Outline for Different Situations
Buy or Sell a Business 5.18Expansion Plan 5.18Investors 5.18Operations Plan 5.18
Print a Topic 5.10Rename a Topic 5.10Toolbar 5.10
Plan Setup 3.4
Sales Forecast 6.34Plan Title 4.4Plan vs. Actual
Quickbooks® to Marketing Plan Pro 12.15PowerPoint
Templates 8.16PowerPoint Presentation 8.16Printing Your Plan 8.4
Charts 8.12Document - Options 8.9
Plan 8.9Summary Memo 8.10
Overview 8.3Print Dialog 8.5Print Menu 8.9Print Options Dialog 8.6Print Preview 8.7Selected Topics 8.6Tables 8.11Web Options as Output 8.18
www.secureplan.com 8.18Product Update 1.9Profi t and Loss, QuickBooks 12.4
Q
QuickBooksDeveloping and Managing Budgets 12.14
Marketing Plan Pro Budget 12.14QuickBooks Budget 12.14Showing Variance in Marketing Plan Pro
12.16QuickBooks Pro
Import 12.6
R
Range Names - Errors 10.9Registration 1.8Rename a Row 3.15Planning Resources 2.9ROUND Function 10.18Row-by-Row Help
Table 6.5Row Labels 3.10

i.5
INDEX
S
Sales - Subscriptions 10.23Sales Forecast-Advanced Formulas 10.5
Growth Rate 10.7Percent of Sales 10.6
Sales Forecast table 6.33Advanced Formulas 6.39Average Price Calculation 6.36Cost of Sales 6.34Revenues by Categories 6.37Switching Between Forecasts 6.35Units-Based Forecast 6.34
Sales Forecast Wizard 3.9Sample Plan Browser
Open Sample Plan 4.8Overview 4.7Refresh Sample Plan List 4.8Sample Plans-Caution 4.10Save-As to Create a New Plan 4.9Update Plan Setup 4.9
SecurePlan.com 8.18Sensitivity Analysis
Dealing with Scenarios 10.21Sales Scenarios 10.21
Serial Number, Locate 1.7Starting Marketing Plan Pro 2.3
Shortcut Icon 2.3Start menu 2.3
Strategy Pyramid 7.12SUM function 10.18Support, Technical 1.11
T
TablesActual 9.5Import
Sales Forecast 12.11Tables, Printing 8.11Row Labels 3.10Table Mode 2.7
Hide Row(s) and Column(s) 3.17Table Mode - Practice 3.8
Table Options 3.8Currency Format 3.8Font Settings 3.8
Technical Support 1.11Text Format - HTML 5.11Text Format - Standard 5.3Text Mode 2.6, 5.7
Instructions and Examples 5.8Text Table
Insert 5.15Toolbar
Formatting, Text 5.7Plan Outline 5.10
Tour Overview 3.3Sales Forecast 3.9
Sales Forecast Wizard 3.9Table Mode - Practice 3.8
Cell Value 3.11Delete an Expense Row 3.16Fill Right 3.11Hide Row(s) and Column(s) 3.17Insert a Row 3.16Rename a Row 3.15Row Labels 3.10
Text Mode - Practice 3.6Type into Topic 3.6
V
VarianceImplementation 9.4QuickBooks to Marketing Plan Pro 12.16
Version, Product Update 1.9
W
WebUpdate 1.9Web Options
SecurePlan.com 8.18Wizard Instructions
Table 6.4Working in Table Mode 2.7Working with Text 2.6

MARKETING PLAN PRO MANUAL
i.6
This page intentionally blank.