marketing management of iffco -...
TRANSCRIPT
111
CHAPTER 4
MARKETING MANAGEMENT OF IFFCO
4.1 Marketing Management 4.2 Sustainable and Efficient Fertilizer Marketing Strategy 4.2.1 Target and Achievement 4.2.2 Market Awareness 4.2.3 Stock Arrangement 4.2.4 Proper and Timely Placement 4.2.5 Harvesting Market Situation 4.2.6 Accessories 4.3 Fertilizer Transportation and Distribution Channel 4.4 Pricing Policies 4.5 Social, Ecological Aspects of Marketing 4.6 Fertilizer Industry Challenges and Opportunities in Changing Scenario 4.7 Discussion and Conclusion.
112
MARKETING MANAGEMENT OF IFFCO
Fertilizer Market is very complex phenomenon and its proper understanding
by each and every marketing employee is crucial to attain successes and efficiency
in marketing operation. In Fertilizer marketing sector where farmer is the ultimate
customer and user of the product, Fertilizer Marketing is some one different from
other marketing. IFFCO which deals only in cooperatives and Fertilizer are
distributed to the farmer by the cooperative societies either in cash or in credit basis.
Therefore, study of cooperatives societies, farmers purchasing behaviour and their
purchasing power is very important to manage efficient Fertilizer marketing while
IFFCO is concern.
4.1 Marketing Management:
The first principle of marketing management is that the compare must have an
active attitude toward the market. It can’t expect customers to buy a product simply
because it is produced. The management must actively study the market, persuade
customers, promote the product and organize distribution.
Marketing Management is an important operative function (as distinct from
managerial function) of management. It performs all managerial functions in the field
of marketing. It is responsible for planning, organizing, directing and controlling the
marketing activities. It is required to build up appropriate marketing-mix to achieve
the objectives of the business. The basis goals of marketing are satisfaction of
needs of customers and generation of revenue for the business. The marketing
manager looks after various aspects of marketing to achieve the objectives of
113
marketing viz., creation of customers and satisfaction of their wants and earning of
profits
As the Fertilizer scenario has been changing very fast since last 10 years and
nowadays the market has become highly competitive IFFCO has already reworked
its marketing strategy oriented to meet contemporary challenges and yet retaining
the philosophy of IFFCO, service to the farmers and strengthening the cooperatives.
Therefore, sustainable and efficient Fertilizer marketing strategy with reference to
IFFCO is given hereunder.
4.2 Sustainable Fertilizer Marketing Strategy:
Marketing of any product is complex phenomenon but Fertilizer marketing is
somewhat different from any other marketing. More than 70% population of India is
under Farming community of different level of living standards. Their needs are
different and purchasing powers vary from place to place. The crop cultivation is
quite different in same state of same crop. The Fertilizer consumption is directly
related to irrigation potentiality of the area and the crops which are being cultivated
there. Crops under cereals like rice, wheat, sorghum require more nutrients than
pulse crops. Likewise tuber crop like potato is heavy feeder crop. Plantation crop
like sugarcane, cash crop like cotton and tobacco which are grown in some pockets
need more fertilization than cereals and pulses.
In Chhattisgarh, 80% cultivated area under rice and rest 20% area include the
crops like lakhadi, chickpea, maize, urd, moong and wheat crops. Out of total
cultivated area only 26% area under assured irrigation and rest comes under rain fed
114
conditions where annual precipitation is near 750 mm but their distribution is very
uneven. Therefore, farmers are always fearful in so far as rainfall is concerned.
Therefore, in state like Chhattisgarh the scope of Fertilizer consumption is not
so encouraging. During the year 2003-04, the Fertilizer consumption was recorded
38.80 Kg./hectare which is very low, while national Fertilizer consumption is 100
Kg./hectare. As mentioned earlier, the Fertilizer consumption pattern varies from
district to district and also block-wise among the districts. For example, Janjagir
district where irrigation facilities are better than other districts, having Fertilizer
consumption 93.60 Kg/hectare followed by Dhamtari and Raipur.
4.2.1 Target
In Marketing field target fixation is very important. It is directly associated with
our aggressiveness to achieve the success. Target of Fertilizer distribution for the
area/district/state has to finalized on the following criteria—
1. Potentiality of the area.
2. Last Best Sales.
3. Marketing Cost.
4. Competitors.
5. Government Fertilizer policy.
Potentiality of the Area:
It includes the irrigation facilities, which type of crops are being raised by the
farmers, credit facilities and socioeconomic status of the area. For example, in
Janjagir district, irrigated area is about 80% and during kharif season, rice is main
115
crop while wheat crop is grown in large area in rabi season. Both the crops—rice
and wheat cereal crops require more fertilization. While in Durg cultivated area is
more than Janjagir district but irrigation is limiting factor, therefore, Fertilizer
consumption is lesser in Durg than Janjagir district. Therefore, it is must to first
workout the potentiality of the area while fixing the Fertilizer sales targets.
Last Best Sales Data:
Present Fertilizer sales planning is associated with the last year sales data of
the particular area. For justified planning one has to workout the last three years
sales and best sales of the last years.
Marketing Cost:
Government of India has been withdrawing the subsidy on Fertilizer since the
year 1992. Before the year 1992 all the Fertilizers were being distributed as per the
Government dispatches instructions under Essential Commodity Act. The difference
between the cost of production and distribution rates to the farmers is much more in
India and that heavy amount is borne by government of India that is called subsidy
which was directly given to the Fertilizer producers. But after August 1992,
government has changed their policy and huge amount of subsidy has been
withdrawing every year. Now Fertilizer producers and suppliers are free to sale their
produce every where in India. Therefore, Fertilizer manufacturers now have to
decide the areas of Fertilizer marketing which comes under economic zones. This
adhoc subsidy is given by government of India only on phosphatic and potassic
fertilizers. Urea still comes under ECA.
116
Therefore, cost effectiveness is the very important factor while determining
the sales target. The area which is very potential but marketing cost of that area is
comparatively high it requires more attention before fixing the sales targets.
Presently, phosphatic and potassic Fertilizers are decontrolled. Urea
Fertilizer is partially controlled by the Central Government and as such its distribution
is decided by them. Therefore, ECA allocation is fixed by the government of
controlled urea which is subsidized by the government.
Uncontrolled share of production needs marketing on those areas which are
economically suitable for manufacturers. For example, NPK and DAP Fertilizer plant
of IFFCO is situated in Kandla in Gujrat. Therefore, West Zone of India comprises of
Gujrat, Maharastra, Madhya Pradesh and Chhattisgarh states come under economic
zone for selling phosphatic Fertilizer as per IFFCO’s marketing is concerned. Two
urea producing plants are situated in Aonla near Bareilly and Phulpur near Allahabad
in Uttar Pradesh. Therefore, uncontrolled share of urea of both the plants are
economically viable in north and some part of central India like Uttar Pradesh, Bihar,
Panjab, Hariyana, Rajasthan, Delhi states. In Chhattisgarh most part of the
controlled IFFCO urea comes from Phulpur plant and their ECA allocation vary in
between 30 and 40 thousand metric tones. IFFCO may be interested to sale some
quantity of free urea in those districts which are near to Phulpur plant. Therefore,
marketing cost play a very key role for fixing the target for particular area.
Competitors:
Very sharp eyes on competitors’ activities and their planning are very much
essential. One should have very vigilant in market to get the information. Brand
117
Loyalty of the particular product among the farmers of a particular area plays
important role which set the sales target. For example, IFFCO NPK (12-32-16)
complex Fertilizer is very popular among the farmers of West Zone. In Chhattisgarh
district like Ambikapur, Jashpur, Bilaspur, Durg, Mungeli have very much demand of
IFFCO NPK (12-32-16) and IFFCO urea. Therefore, IFFCO is very cautious to plan
their distribution of above Fertilizers in these districts.
Government Fertilizer Policy:
IFFCO is a cooperative institution and its produce is only sold to the farmers
through cooperatives. IFFCO don’t sale its Fertilizers in Private Sector, that is,
private traders/dealers. Cooperative Sector is governed by the state government
and its Fertilizer distribution policy play very important role to harvest the sales
volume of Fertilizer of particular state. In State like Chhattisgarh where
cooperatives are not so economically sound and are depend on funds on state Apex
Banks and Nabard Banks. Therefore, district-wise cooperative banks viability is
limited factor while selling of Fertilizer through cooperatives. For example, district
like Raigarh, Ambikapur, Jashpur, where cooperative banks and their primary
agriculture cooperative societies are functionless due to poor economic conditions,
whereas IFFCO Fertilizers especially IFFCO NPK (12-32-16) Fertilizer is very-very
popular among the farmers of these districts. Therefore, to meet out the farmers
demand IFFCO has to sale their products through Indian Agro Marketing
Cooperative Limited (IAMCO). IAMCO is a cooperative organization that has been
permitted to open their cash sale centers in whole districts of Chhattisgarh for
Fertilizer cash sales.
118
4.2.1 Sales Target Achievement:
Marketing means achievement of sales targets at reasonable marketing cost.
Success of marketing achievement depends on the following factors—
1. Market Awareness
2. Stock Arrangement
3. Proper and Timely Placement
4. Harvesting Marketing Situation.
4.2.2 Market Awareness:
Market awareness is first tool to lineup the marketing system. For market
awareness one should has updated regarding marketing channels running in the
area, what are the potential pockets of Fertilizer consumptions. Demand of farmers
and their expectations should be kept in mind regularly. Knowledge of competitors’
activities and their planning is also required attention for achieving the targets. In
spite of that regular promotional work should be carried out for development of
existing market and for creating new market.
4.2.3 Stock Arrangement:
Proper and timely stocking prior to season is very essential for best output of
sales. As per need of the area one should has to decide that what product is to be
stocked in advance and which Fertilizer may be arranged at the time of sale season.
Stock quantity and their time have to work out on the lifting pattern. Place of stock
either in rake point buffer godowns or in feeder warehouse is also point of similar
importance.
119
4.2.4 Proper and Timely Placement:
Proper and timely placement of the stock to the sale points assures the sales
success which is largely depend on the transporting facilities and the destinations of
feeding. Therefore, transportation is very vital and essential factor to achieve the
sale goals. IFFCO is operating 6 rake points in the state. Although Durg is having
rake point facility but IFFCO is not operating this rake point due to the reason of
marketing cost. In Durg, Fertilizer is fed from Rajnandgaon, Raipur and Bilaspur
Rake points. Therefore districts like Durg where own rake point is not working and
feeding is depend on other districts, advance stocking of particular quantity at right
time is a must to survive in market and getting success in sales in peak sale season.
4.2.5 Harvesting Market Situation:
At the time of starting the sale season and during the sales days, continuous
close contact to the customers/farmers and related executives of cooperatives and
state government is very important to harvest the prevailing marketing situation.
Continuous monitoring of marketing pockets, cropping pattern, rainfall pattern where
area comes under rain-fed condition also require close watch. Assessment of day-
to-day need of market is also important to lineup the marketing.
4.2.6 Accessories:
Market of any product depends upon the team work and support of work
done. Marketing refers to the group of people in an enterprise who are carrying out
management functions. It is a directive activity aiming at the effectiveness of
collective human efforts. Marketing is a goal-oriented activity.

120
4.3 Fertilizer Transportation and Distribution Channel:
Transportation of Fertilizers from the various production centers to the
consuming centers spread over throughout the country plays a very important role in
making the Fertilizers available to the farmers at right time, right place and in right
quantities. Physical distribution and logistics management of a product is one of the
very important aspects of marketing. It relates to the activities like demand,
forecasting, warehouse location and capacity, planning, transportation, handling of
the material and inventory planning and control etc. Fertilizer as a product has some
typical features. It is a bulk commodity, its production is uniformly distributed
throughout the year whereas its consumption is highly skewed and is confined to few
months only. In view of these and other typical features, its logistics management
assumes even greater significance. Its in-time availability in the form and quantity
demanded by the farmers at the doorsteps is very essential for its consumption to
take place.
IFFCO is producing urea, NAK/DPA from its four Fertilizer Plants located at
Kandla, Kelol, Aonla and Phulpur. The movement of Fertilizer iof every
manufacturing agency is decided on the basis of allocations made by government of
India for various states. Generally transportation by rail is satisfactory by and large
on a macro-level. Problems do arise for moving Fertilizers from particular plants for
particular destinations. This creates scarcity conditions causing hardship to the
farmers. Timely movement of Fertilizers is very essential to enable the farmers to
use the same during or just before the onset of monsoon. Any delay will only lead to
stock pilling of Fertilizers in the warehouses without contributing to increased
agricultural production. 70% of the state agriculture even today is depend upon
121
rainfall and the consumption of Fertilizer is seasonal in nature, depending upon
whether we have a good or a bad monsoon. But continuous production throughout
the year and necessary transport infrastructure to store the Fertilizers in the
warehouse is needed, so that farmers utilize the input when needed.
Chhattisgarh is a much diversified state in terms of geographical conditions. It
needs different Fertilizers in different regions at different times. Hence warehousing
planning is essential to distribute the Fertilizers to the farmers in right time and place.
The two most important aspects in this regard are—
(a) Where would the warehouse be located?
(b) How much space should be hired?
This strategy would go a long way in sizably cutting down market costs. But
due top change in cropping pattern, introduction of new varieties change in area
under irrigation weather conditions etc. would also be required to modify the logistics
arrangements from time to time. Important aspects of logistics management are
discussed hereunder:
4.3.1 Demand Forecast:
This is the basic ingredient for warehousing planning. For determining
optimum size and location of field warehouses an assessment of how much space is
needed and where it should be located.
4.3.2 Sales Force Composite Method:
Demand for Fertilizer needed in the particular area, in the season is estimated
from past records. Basically it is a subjective method and has no scientific basis.
122
4.3.3 Agronomic Requirement Method:
Fertilizer demand is estimated by multiplying the area under different crops by
the prevalent dosages of N, P2O5 and K2O and then aggregating them. An intimate
knowledge of the prevalent dosages is an important factor in this method.
4.3.4 Trend Projection:
This method basically projects the past trends. Here past Fertilizer sales
pertaining to different time periods are arranged chronologically yielding a time
series. A trend line is fitted to this time series by least square method. The trend
time is then projected into the future for purpose of extra potation.
4.3.5 Warehouse Planning:
Farmers are not properly equipped to purchase material before the season
and store it in advance to use it when required. Warehousing management affects
the availability of Fertilizers to the farmers and in the other it affects marketing cost of
the manufacturer to a great extent.
A large number of warehouse locations definitely ensures easily availability of
the product to the dealer and also proves to be an incentive for him as his cost of
transportation is low in this case. But administration of large number of warehouses
is difficult. This also involves the increase the marketing cost. Hence optimum
numbers of warehouses are required to ensure the availability of Fertilizer in
reasonable cost.
123
4.3.6 Buffer Godown:
This issue is of particular states in which the market size is quite large.
Establishment of buffer godown assumes special significance in surplus market
situation when manufacturers do have to stock their entire of season production.
This helps in uninterrupted production at the plants. IFFCO faced this situation and
has established few buffer godowns in this market in U.P. But buffer godown must
be located in high Fertilizer consuming areas.
4.3.7 Transportation:
Having located the warehousing points and also determined as to how much
of Fertilizer is to be moved to different warehouse locations, the next step is to
organize the movement of the materials.
In India two modes are available for transporting Fertilizers—rails and road.
Rail movement is best suited for Fertilizer movements over longer distances and
bulk commodities. Road transport also plays an important role in Fertilizer
movement in the vicinity of Fertilizer plants or from the rake points to the sales
points. Generally up to 200-250 kilometers have been found economically as well as
operationally convenient by road.
4.3.8 Storage.
Once the transportation is planned, the right place of storage and duration of
storage of Fertilizer had to be considered from various angles, such as—
1. Minimum inventory carrying cost.
2. Storage proximity to production centers.
3. Minimum transit time to consumption centers.
4. Storage proximity to nodal points.
5. Storage proximity to consumption centers.
124
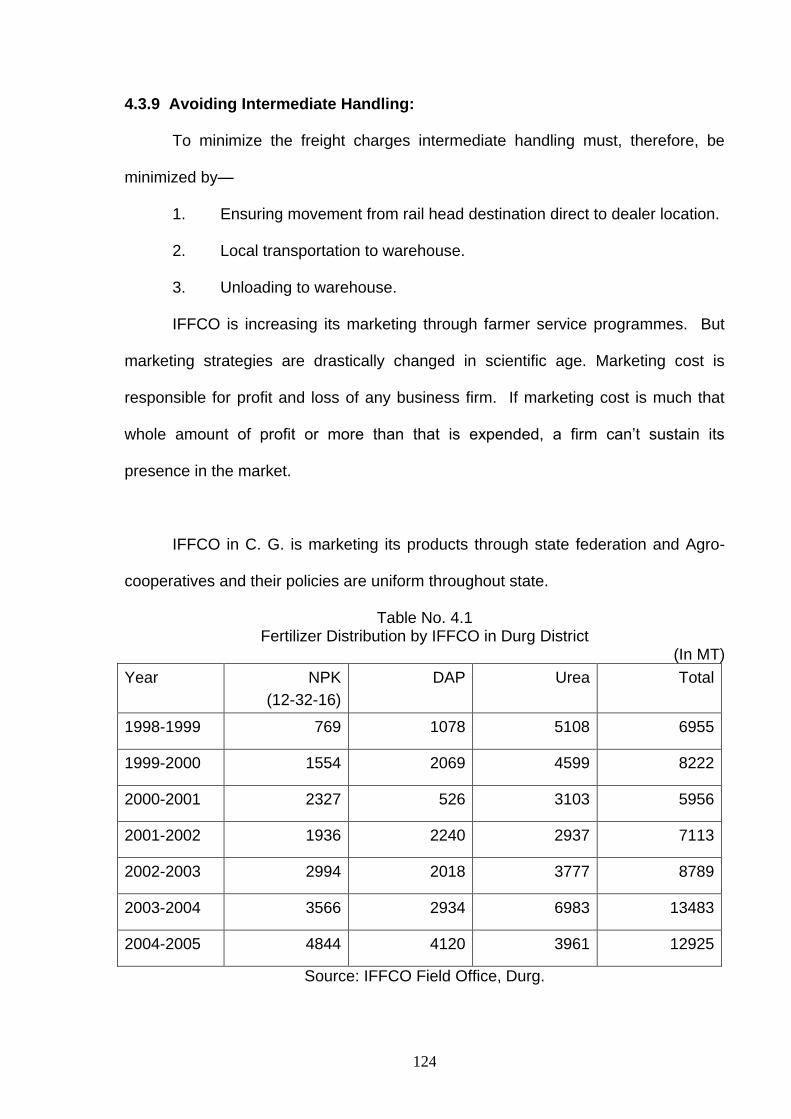
4.3.9 Avoiding Intermediate Handling:
To minimize the freight charges intermediate handling must, therefore, be
minimized by—
1. Ensuring movement from rail head destination direct to dealer location.
2. Local transportation to warehouse.
3. Unloading to warehouse.
IFFCO is increasing its marketing through farmer service programmes. But
marketing strategies are drastically changed in scientific age. Marketing cost is
responsible for profit and loss of any business firm. If marketing cost is much that
whole amount of profit or more than that is expended, a firm can’t sustain its
presence in the market.
IFFCO in C. G. is marketing its products through state federation and Agro-
cooperatives and their policies are uniform throughout state.
Table No. 4.1 Fertilizer Distribution by IFFCO in Durg District
(In MT)
Year NPK
(12-32-16)
DAP Urea Total
1998-1999 769 1078 5108 6955
1999-2000 1554 2069 4599 8222
2000-2001 2327 526 3103 5956
2001-2002 1936 2240 2937 7113
2002-2003 2994 2018 3777 8789
2003-2004 3566 2934 6983 13483
2004-2005 4844 4120 3961 12925
Source: IFFCO Field Office, Durg.
125
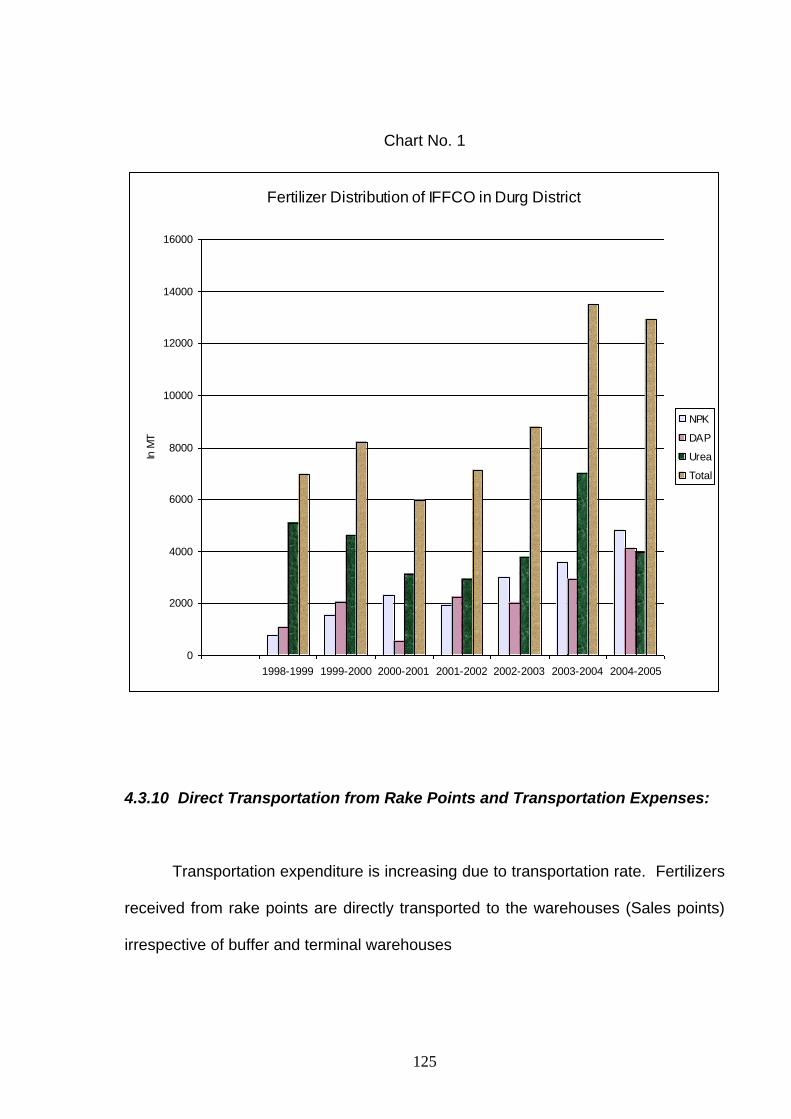
Chart No. 1
Fertilizer Distribution of IFFCO in Durg District
0
2000
4000
6000
8000
10000
12000
14000
16000
1998-1999 1999-2000 2000-2001 2001-2002 2002-2003 2003-2004 2004-2005
In M
T
NPK
DAP
Urea
Total
4.3.10 Direct Transportation from Rake Points and Transportation Expenses:
Transportation expenditure is increasing due to transportation rate. Fertilizers
received from rake points are directly transported to the warehouses (Sales points)
irrespective of buffer and terminal warehouses

126
Sale Point
Rail Line
Terminal Ware House Buffer Warehouse Transit warehouse
Fig. 1 Transportation and Distribution Pattern of IFFCO Fertilizers throughout PACS
Due to direct transportation from rack point to sale point maximum amount
were saved from Fertilizer handling and transportation. IFFCO marketing
management will try to concentrate the Fertilizer sales points nearer to the reach of
the farmers of warehouses of the primary cooperative societies of the district.
4.3.11 Government of Chhattisgarh Recognized Marketing Agencies:
At present in Chhattisgarh Fertilizer marketing is done through CG State
Marketing Federation (CGSMF) and CG Agro State Cooperation. These federations
127
are marketing Fertilizers through cooperative societies. The Fertilizers are
transported to their sales points. In 1992 IFFCO stopped to transport Fertilizers to
the warehouses of Federations. Then Marketing of IFFCO was adversely affected.
Nowadays IFFCO has again come back to its previous policy.
Following are the some of additional facilities provided by the agencies:
1. Manufacture/Import agencies provide advance reservation for Fertilizer
storage.
2. Advanced availability of Fertilizer from storage.
3. Supply Fertilizers to the sales points of these federations.
4. CG Agro State Corporation Supply Fertilizers directly to village level
cooperative societies.
5. Bonus on Fertilizer sale to the societies by state federation.
6. Manufacturers/Agencies provide Fertilizer as needed by customers.
4.3.12 Warehousing Reservation:
IFFCO management is active to sell maximum quantity of Fertilizers in
minimum reservation time in warehouses to increase the time over to maximum
profit and provide the Fertilizer to the farmers in minimum price.
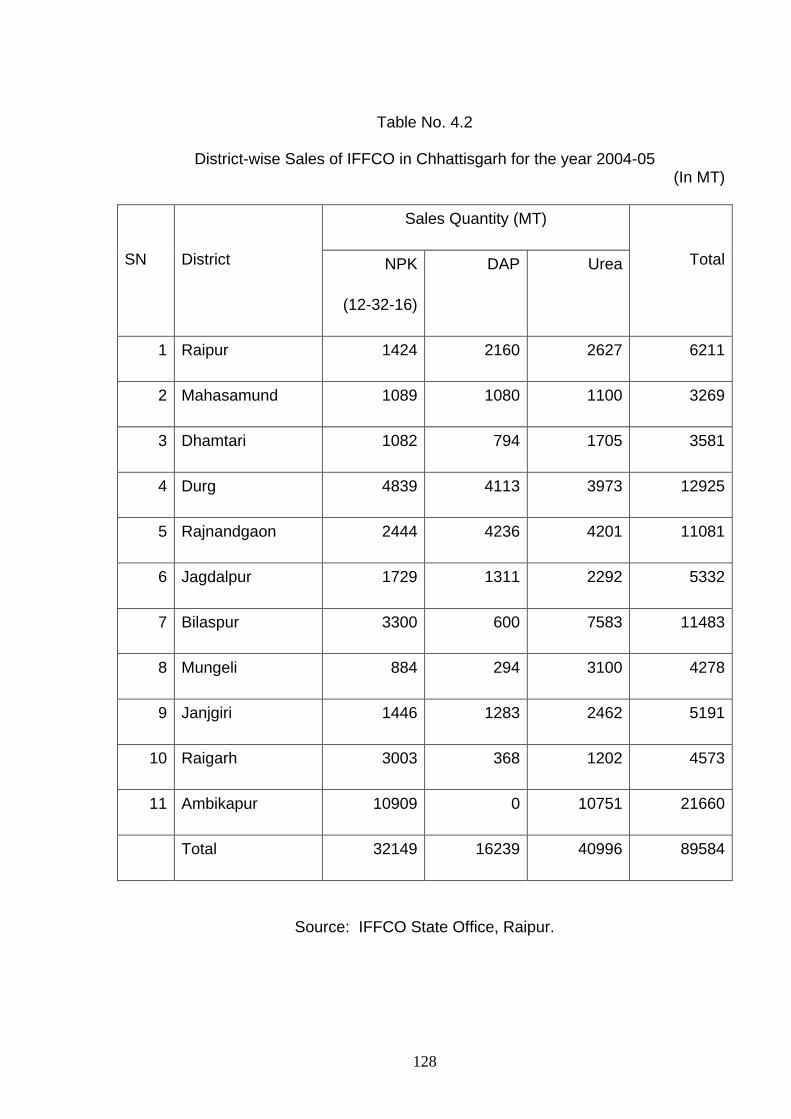
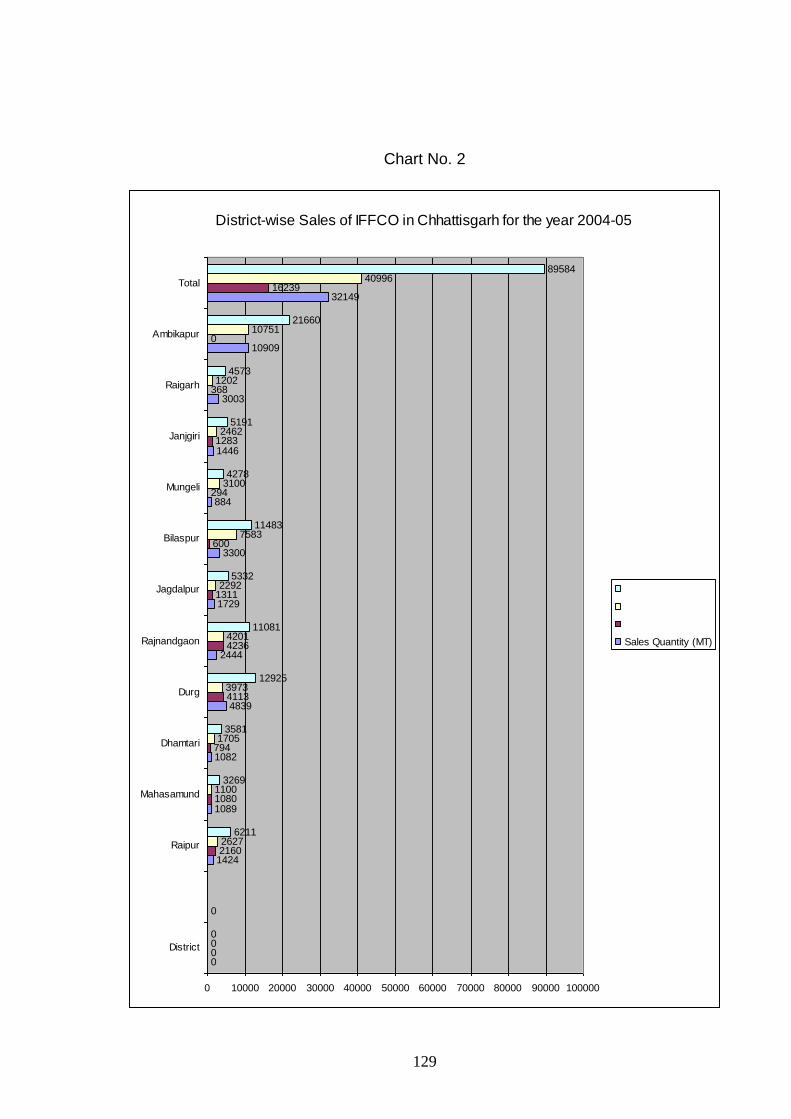
The total district-wise sales of IFFCO in Chhattisgarh for the year 2004-05 are
89584 MT. The maximum sale of IFFCO in Chhattisgarh was in Ambikapur district
and the lowest sale of IFFCO was in Mungeli. The data of District-wise sale of
IFFCO in Chhattisgarh are tabulated below.
128
Table No. 4.2
District-wise Sales of IFFCO in Chhattisgarh for the year 2004-05
(In MT)
SN
District
Sales Quantity (MT)
Total NPK
(12-32-16)
DAP Urea
1 Raipur 1424 2160 2627 6211
2 Mahasamund 1089 1080 1100 3269
3 Dhamtari 1082 794 1705 3581
4 Durg 4839 4113 3973 12925
5 Rajnandgaon 2444 4236 4201 11081
6 Jagdalpur 1729 1311 2292 5332
7 Bilaspur 3300 600 7583 11483
8 Mungeli 884 294 3100 4278
9 Janjgiri 1446 1283 2462 5191
10 Raigarh 3003 368 1202 4573
11 Ambikapur 10909 0 10751 21660
Total 32149 16239 40996 89584
Source: IFFCO State Office, Raipur.
129
Chart No. 2
District-wise Sales of IFFCO in Chhattisgarh for the year 2004-05
0
0
1424
1089
1082
4839
2444
1729
3300
884
1446
3003
10909
32149
0
2160
1080
794
4113
4236
1311
600
294
1283
368
0
16239
0
2627
1100
1705
3973
4201
2292
7583
3100
2462
1202
10751
40996
0
6211
3269
3581
12925
11081
5332
11483
4278
5191
4573
21660
89584
0 10000 20000 30000 40000 50000 60000 70000 80000 90000 100000
District
Raipur
Mahasamund
Dhamtari
Durg
Rajnandgaon
Jagdalpur
Bilaspur
Mungeli
Janjgiri
Raigarh
Ambikapur
Total
Sales Quantity (MT)
130
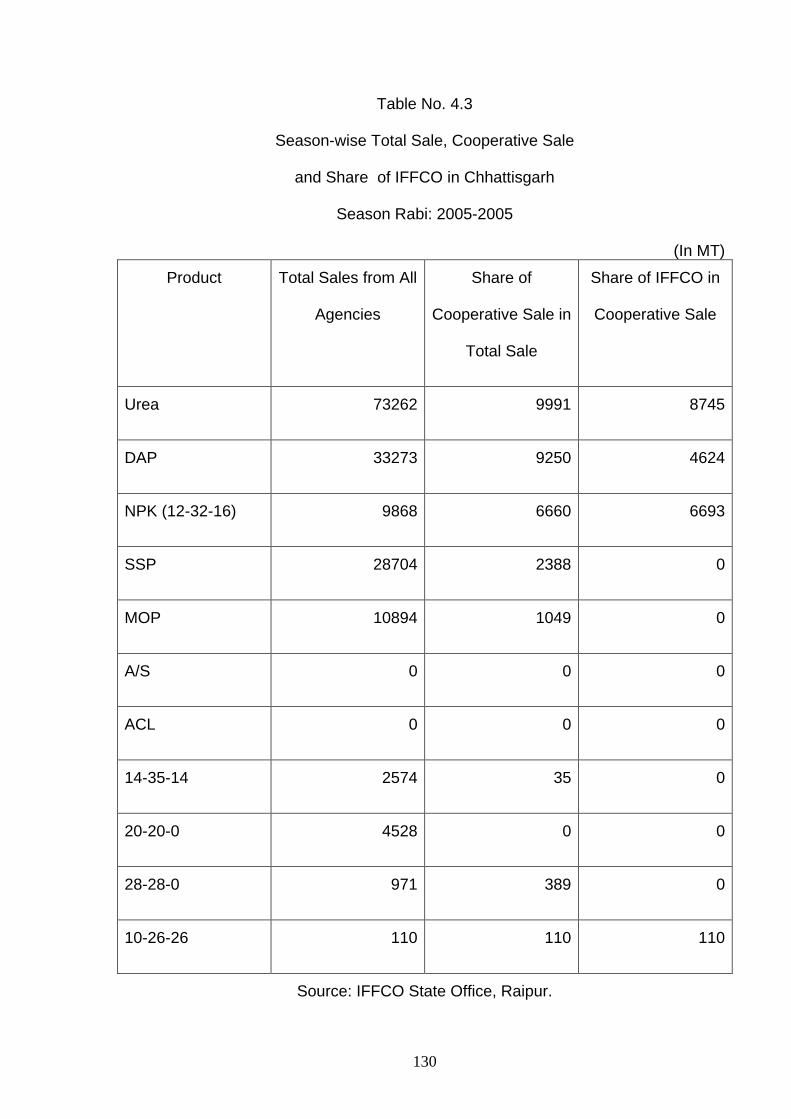
Table No. 4.3
Season-wise Total Sale, Cooperative Sale
and Share of IFFCO in Chhattisgarh
Season Rabi: 2005-2005
(In MT)
Product Total Sales from All
Agencies
Share of
Cooperative Sale in
Total Sale
Share of IFFCO in
Cooperative Sale
Urea 73262 9991 8745
DAP 33273 9250 4624
NPK (12-32-16) 9868 6660 6693
SSP 28704 2388 0
MOP 10894 1049 0
A/S 0 0 0
ACL 0 0 0
14-35-14 2574 35 0
20-20-0 4528 0 0
28-28-0 971 389 0
10-26-26 110 110 110
Source: IFFCO State Office, Raipur.
131
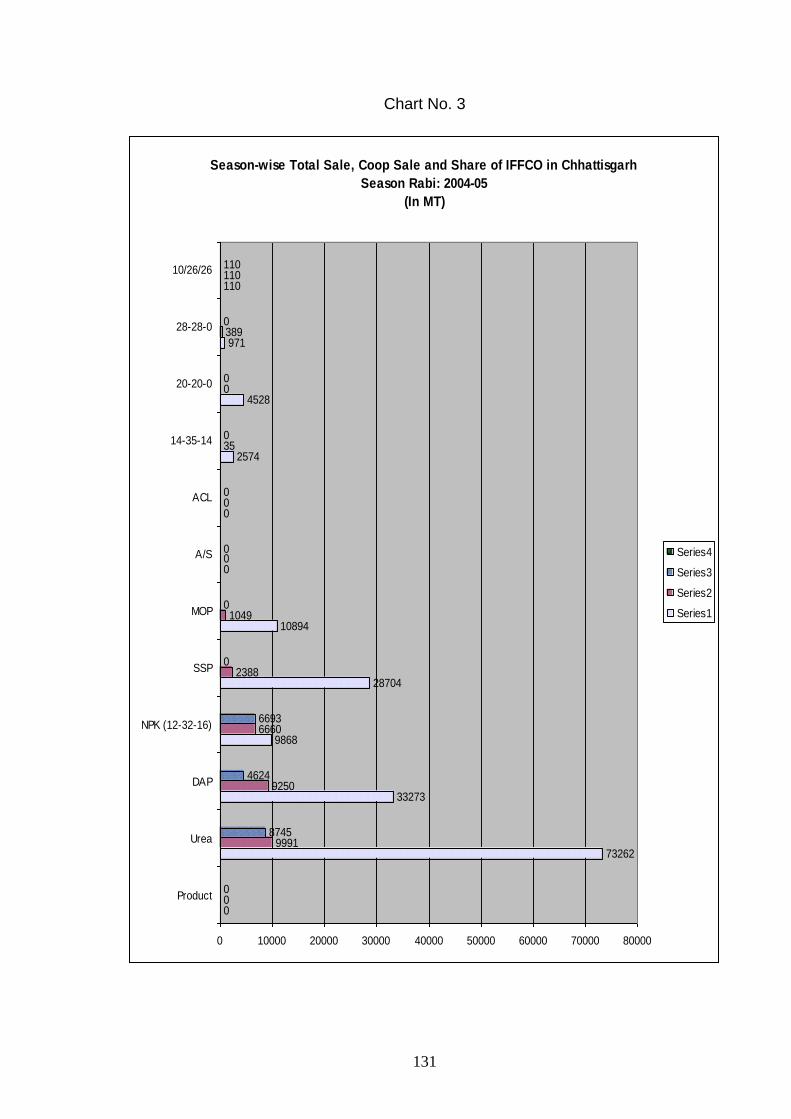
Chart No. 3
Season-wise Total Sale, Coop Sale and Share of IFFCO in Chhattisgarh
Season Rabi: 2004-05
(In MT)
0
73262
33273
9868
28704
10894
0
0
2574
4528
971
110
0
9991
9250
6660
2388
1049
0
0
35
0
389
110
0
8745
4624
6693
0
0
0
0
0
0
0
110
0 10000 20000 30000 40000 50000 60000 70000 80000
Product
Urea
DAP
NPK (12-32-16)
SSP
MOP
A/S
ACL
14-35-14
20-20-0
28-28-0
10/26/26
Series4
Series3
Series2
Series1
132
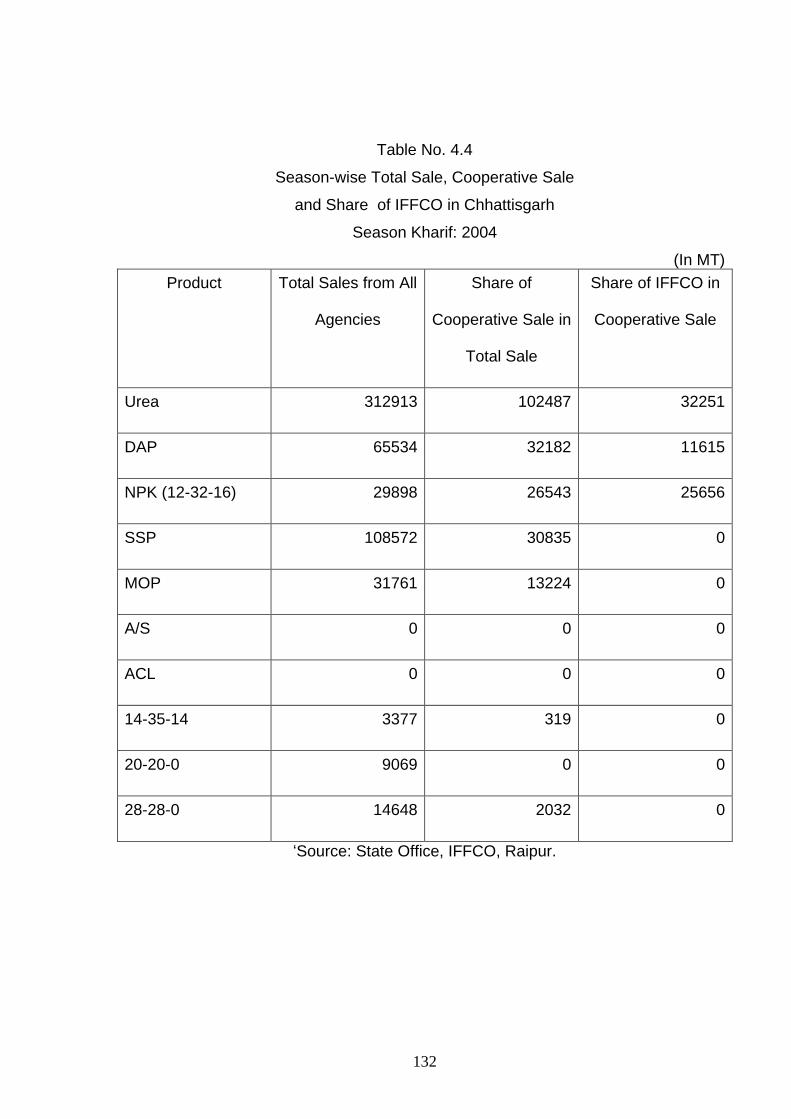
Table No. 4.4
Season-wise Total Sale, Cooperative Sale
and Share of IFFCO in Chhattisgarh
Season Kharif: 2004
(In MT)
Product Total Sales from All
Agencies
Share of
Cooperative Sale in
Total Sale
Share of IFFCO in
Cooperative Sale
Urea 312913 102487 32251
DAP 65534 32182 11615
NPK (12-32-16) 29898 26543 25656
SSP 108572 30835 0
MOP 31761 13224 0
A/S 0 0 0
ACL 0 0 0
14-35-14 3377 319 0
20-20-0 9069 0 0
28-28-0 14648 2032 0
‘Source: State Office, IFFCO, Raipur.

133
Chart No. 4
Season-w ise Total Sale, Coop. Sale and Share of IFFCO in Chhattisgarh Season Kharif: 2004 (In MT)
312913
65534
29898
108572
31761
0
0
3377
9069
14648
102487
32182
26543
30835
13224
0
0
319
0
2032
32251
11615
25656
0
0
0
0
0
0
0
0 50000 100000 150000 200000 250000 300000 350000
Urea
DAP
NPK (12-32-16)
SSP
MOP
A/S
ACL
14-35-14
20-20-0
28-28-0
Share of IFFCO in Coop sale
Share of Cooperative
Total Sales

134
Table No. 4.5
Total Sale of all Fertilizers in Chhattisgarh State and share
Cooperative and Share of IFFCO in Cooperative Sale
for the Year 2004-05
(In MT)
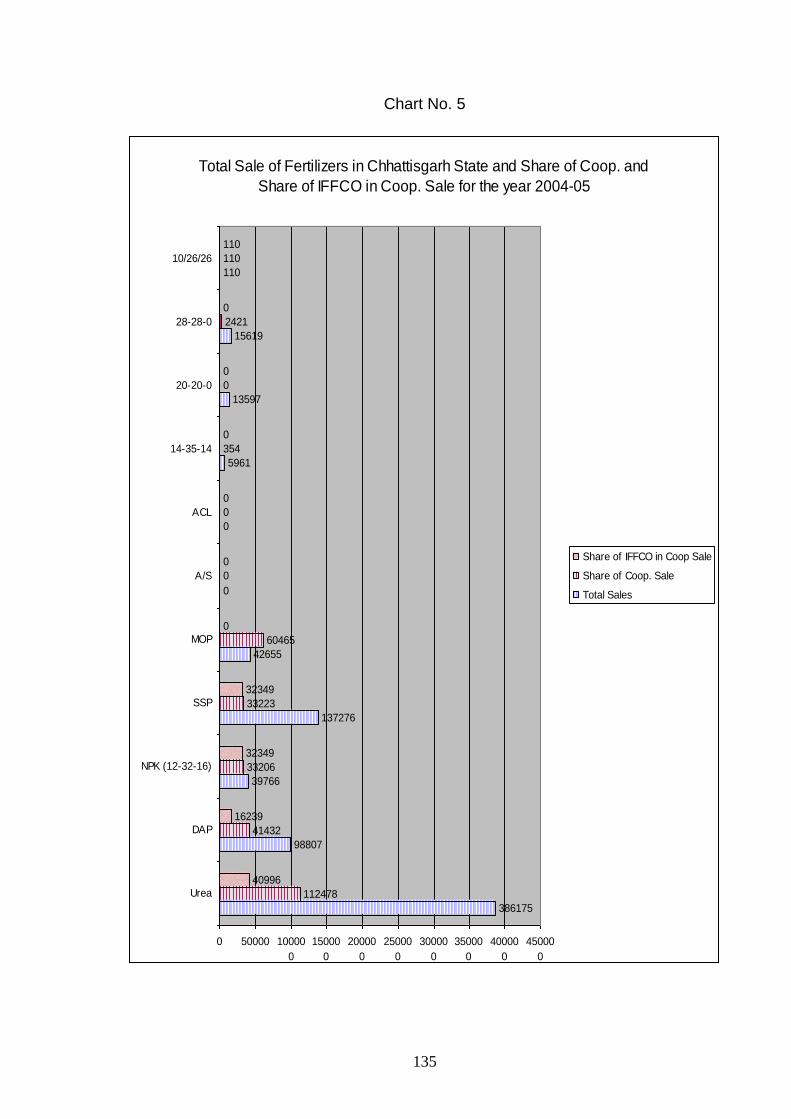
Product Total Sales from All Agencies
Share of Cooperative Sale in
Total Sale
Share of IFFCO in Cooperative Sale
Urea 386175 112478 40996
DAP 98807 41432 16239
NPK (12-32-16) 39766 33206 32349
SSP 137276 33223 32349
MOP 42655 60465 0
A/S 0 0 0
ACL 0 0 0
14-35-14 5961 354 0
20-20-0 13597 0 0
28-28-0 15619 2421 0
10-26-26 110 110 110
Source: State Office, IFFCO, Raipur.
135
Chart No. 5
Total Sale of Fertilizers in Chhattisgarh State and Share of Coop. and
Share of IFFCO in Coop. Sale for the year 2004-05
386175
98807
39766
137276
42655
0
0
5961
13597
15619
110
112478
41432
33206
33223
60465
0
0
354
0
2421
110
40996
16239
32349
32349
0
0
0
0
0
0
110
0 50000 10000
0
15000
0
20000
0
25000
0
30000
0
35000
0
40000
0
45000
0
Urea
DAP
NPK (12-32-16)
SSP
MOP
A/S
ACL
14-35-14
20-20-0
28-28-0
10/26/26
Share of IFFCO in Coop Sale
Share of Coop. Sale
Total Sales

136
4.3.13 Other Measures for Increasing Profit:
1. Branches/Societies were allotted monthly and half monthly target for Fertilizer
selling and matter was briefed before Bank Marketing Federations and
agriculture officer to meet the target finalized. Due to this selling of Fertilizer
was increased.
2. Weekly Report related to total Fertilizer selling society-wise/Branch-wise was
demanded and comparative study was made for IFFCO-NPK. More receipt
orders (RO) were drawn for IFFCO NPK in comparison to other Fertilizers.
3. In the area of societies where NPK (12-32-16) was used less, farmers
meetings were held. As a result demand of NPK (12-32-16) was increased.
4. District officials of agriculture department, marketing federation and senior
officials of cooperative Banks were in societies in result NPK (12-32-16)
selling was favourable.
4.3.14 Fertilizer Distribution through CG Agro State Corporation:
CG Agro State Corporation is growing fast in the area of Fertilizer distribution.
Marketing of IFFCO Fertilizer through CG Agro has been started.
4.3.15 Time Availability of Fertilizers:
Fertilizer is the necessary input for increasing the farm output. Generally it is
seen that the Fertilizers are not made available to the farmers when they are
needed. Fertilizer is made available to the farmers in time to win the confidence for
137
IFFCO products. Loss in distribution of Fertilizer in one season can’t be
compensated in other season and many difficulties arise to sell the target limit to the
Fertilizers.
If management of IFFCO concentrates on above points and a concrete
strategy is formulated, the profit can be maximized by increasing business.
4.3.16 Suggestions to Improve Working Conditions:
Area Officers/Representatives engaged in marketing business of IFFCO
Fertilizers are facing many difficulties to furnish their duties efficiently. To overcome,
the following are some suggestions:
1. Rack handling work has to be done by government storage agency and not
by IFFCO transporters.
2. Marketing process should make simplified so that receipt can be received
early.
3. Customers/Farmers should be provided more knowledge about use of
balance Fertilizers.
In order to ensure efficient working atmosphere we have to change the
marketing policy from time to time after market researches and through efficient
utilization of Management Information System (MIS).

138
4.4 Pricing Policies
Pricing policies and decisions constitute the general framework within which
pricing decision should be made in order to achieve the pricing objectives. They
provide guidelines within which pricing strategy is formulated and implemented.
As a matter of fact calibration of relative prices level of different NPK products
under price control from 1978 to 2003-04 has counting to narrow down the gap
between the uses of levels of NPK.
The recent step depreciation of the rupee has produced a serious adverse
effect in the cost of imported products including raw materials, intermediates, capital
goods and components leading to higher production cost on the one hand and even
problems in arranging necessary import to support manufacturing operations in the
other.
Every segment of the fertilizer industry has been effected the impact is
particularly severe and disturbing in the phosphatic segment. This is because of
meeting the requirements of these fertilizers India is almost entirely dependent on
import either as basic raw materials, i.e. rock-phosphate and sulphur or
intermediates, i.e. phosphoric acid and ammonia for production at home or import as
finished product, i.e. DAP. In the potash segment we do not have natural resources
within the country and the entire requirements are met through import as finished
product, predominantly as muriate of potash (MOP). With reason the prices of
fertilizers are escalating from time to time. In the following table the statutory
139
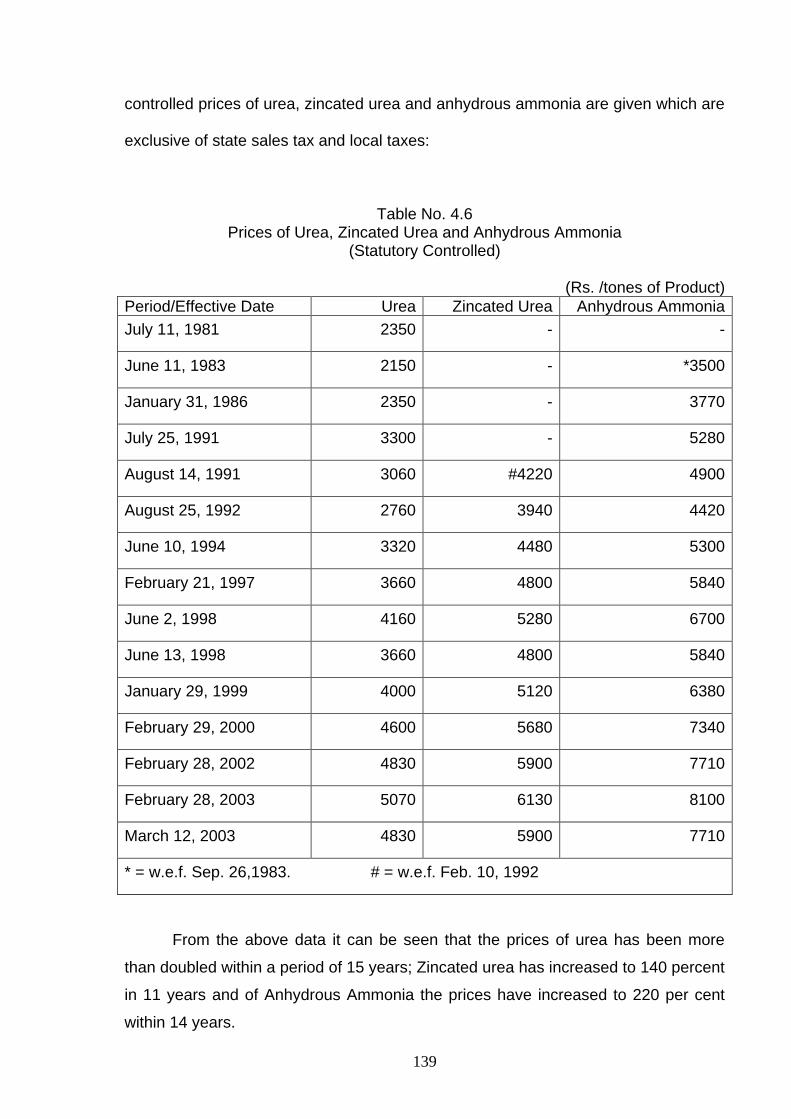
controlled prices of urea, zincated urea and anhydrous ammonia are given which are
exclusive of state sales tax and local taxes:
Table No. 4.6 Prices of Urea, Zincated Urea and Anhydrous Ammonia
(Statutory Controlled)
(Rs. /tones of Product)
Period/Effective Date Urea Zincated Urea Anhydrous Ammonia
July 11, 1981 2350 - -
June 11, 1983 2150 - *3500
January 31, 1986 2350 - 3770
July 25, 1991 3300 - 5280
August 14, 1991 3060 #4220 4900
August 25, 1992 2760 3940 4420
June 10, 1994 3320 4480 5300
February 21, 1997 3660 4800 5840
June 2, 1998 4160 5280 6700
June 13, 1998 3660 4800 5840
January 29, 1999 4000 5120 6380
February 29, 2000 4600 5680 7340
February 28, 2002 4830 5900 7710
February 28, 2003 5070 6130 8100
March 12, 2003 4830 5900 7710
* = w.e.f. Sep. 26,1983. # = w.e.f. Feb. 10, 1992
From the above data it can be seen that the prices of urea has been more
than doubled within a period of 15 years; Zincated urea has increased to 140 percent
in 11 years and of Anhydrous Ammonia the prices have increased to 220 per cent
within 14 years.
140
4.5 Social, Ecological Aspects of Marketing:
IFFCO as a cooperative institution society demands quality of life
management. Integrated business plans and controls are expected to act as
instruments of social change and these plans have to be implemented in order to
promote maximum public good and welfare. In addition to economic performance
IFFCO demonstrates social awareness and social performance. Dependence of
business on its environment is so complete that the very existence and survival as
well as growth of any organization depend upon its acceptance by the society.
Social responsibility mean an intelligent and objective concern for the welfare
of society that prevents IFFCO management from destructive activities, e.g.
monopoly power, unfair trade practices, ruthless exploitation of ecology and natural
resources and pollution of environment. Such destructive activities may be
immediately profitable to the business but they can’t be tolerated by society. Social
responsibility indicates personal obligation of people, as they act in their own
interest, to ensure that the rights and legitimate interests of others are not sacrificed
by the behaviour of IFFCO management as a whole.
4.5.1 Social Function of Marketing:
Marketing Management of IFFCO is concerned with the following four social
functions—
1. Survival.
2. Profitability
3. Service.
4. Social responsibility.

141
From the study, it is observed that the IFFCO at all level in an organization
are involved in resolving the conflict and reconciling the following responsibilities—
1. to the society as a whole.
2. to the customers (Farming community as a whole).
3. to the employees (Under HRD).
4. to the share holders.
5. to the Government.
Modern business is faced by many other social obligations, such as—
1. Environment free from pollution
2. Fair prices, fair quality and fair service.
Management of IFFCO believes that the modern business operates in a
socio-economic environment. It has to demonstrate not only its economic efficiency
but also consumer sensitivity and social awareness. This is also the concept of
IFFCO management that the business must assess not only the profitability of its
actions but also the overall effect those actions have an society and on the ecology
or environment.
4.5.2 Ecological Aspects of Marketing:
As a part of social responsibility of IFFCO management, care towards the
clean and healthy environment has been taken too. IFFCO has taken all steps to
prevent all types of pollution.
142
4.5.3 Fertilizer and Environmental Pollution:
IFFCO is one of the leading Fertilizer production and marketing cooperative in
India. Today Fertilizer has become an indispensable input of intensive agriculture
and its consumption is expected to increase sharply. Hence we can say that we
have to fight the environment pollution by two ways:
1. Pollution emitted by manufacturing unit of IFFCO.
2. Affect on soil, water and air by non judicious use of Fertilizers by the
farmers.
The first part of pollution control of IFFCO manufacturing units depend on the
technology. IFFCO is modernizing all its existing plants, introducing new
technologies which are satisfying the Indian standard for pollution control. Recently
Kaloi, Aonla and Phulpur Fertilizer plants have induced technologies to meet out
pollution force atmosphere in and around the plants. These technologies are of
Indian standard certified by Bureau of Indian Standards (BIS).
In the second part, excessive use of Fertilizers is increasing awareness of the
environmental degradation due to various anthropogenic activities has developed
suspicion towards the use of Fertilizers and concern has been expressed that over
reliance on mineral Fertilizer may cause unsustainable environmental penalties. It is
observed that the Fertilizer use efficiency by crops seldom exceeds 50 percent. The
remainder is lost from soil system by teaching, run off, de-nitrification and
volatilization. Therefore, it becomes pertinent to understand and evaluate the
environmental implications of Fertilizers use keeping in view the agricultural
productivity and nutritional security of India.

143
4.5.4 Pollution Problems with Fertilizers:
Three vital natural resources namely, soil, water and air are liable to be
affected by non-judicious use of Fertilizers.
1. Water Pollution:
The main problem associated with excess use of Fertilizers is the
entrophication of surface water. Available soil leak considerable amount of nutrients
which enrich the water body resulting in more growth of algae and other organisms
and thus impair the quality of water and limit its use. Application of nitrogenous
Fertilizers also results in increasing the concentration of nitrate in ground water
causes blue baby disease of young babies and cancer.
2. Air Pollution:
Nitrogenous Fertilizers contribute substantially towards emission of nitrogen
oxide such as nitric oxides and nitrogen dioxide which apart from causing global
warning, cause many disorders to animals and human beings. It also emits
ammonia ore of the agents causing acid rains.
4.5.6 Damage to the Crops and Soils:
Evidence showed that excessive use of Fertilizers particularly nitrogen, cause
lodging of crop, low sugar content in sugar crops, acidifying action and increased
incidence of weed and pest attacks. But this is due to imbalanced use of Fertilizers
which disturb the nutrient equilibriums in soil and plants particularly where only one
nutrient is used continuously. Thus it appears that unbalanced nutrient application is
bad but then the problem is with the farmers who are not aware of sound agricultural
practices. Many Fertilizers contain varying amount of trace elements lead to their
144
accumulation in soil and ground water aquifers. But this takes place if contaminated
Fertilizers are marketed. Government of India has laid down permissible limit for
impurities in Fertilizer materials and has formulated Fertilizer control under the law
specifying the quality of Fertilizers.
4.5.7 Pollution Abatement Strategies Taken by IFFCO:
Though no serious environmental problem has so far been observed in any
part of this country, but we have to take lesson from USA and Europe where soil
degradation due to excess use of Fertilizers is the major problem faced by
agronomists. Hence in India care should be taken to control the long term pollution
problems which may arise in future due to excess use of uncontrolled Fertilizers.
IFFCO has adopted two major approaches to minimize possible environmental
pollution due to Fertilizers application—Firstly, to improve the ability of plants to
compete with process which lead to losses of nutrients from soil plant system to
environment and secondly, reduction of losses.
While first one can be achieved by genetically and bio-technological means,
the second one calls for improved Fertilizer use efficiency by improving soil and crop
management practices. IFFCO has taken serious concern and many projects are
launched all over India related to bio-Fertilizers use and farm forestry under Farmer
Education Programmes.
In the context of emerging biotechnologies, IFFCO has initiated to develop
new plant types to use nutrients more efficiently so that there would e no loss of
applied nutrients. New strains of Rhizobium and blue-green algae with higher N
fixation capacity are in different laboratories of IFFCO chairs so that our dependency
145
on Fertilizers will reduce, thereby reducing threat to Fertilizer pollution. IFFCO
through its research and development and extension services is supplying integrated
plant nutrition system, the basic principle of which is the maintenance of soil fertility,
sustainable agricultural productivity and improving farmer’s profitability through
judicious and efficient use of mineral Fertilizer, organic matter, green manure,
biological nitrogen fixation and other inoculates have to be practiced. At the same
time IFFCO has taken measures to control soil erosion and other losses of Fertilizer
nutrients from soil systems to reduce pollution.
4.6 Fertilizer Industry: Challenges and Opportunities in Changing Scenario Indian agriculture continues to contribute more than 20 per cent of overall
Gross Domestic Production. Increased food production not only improves rural
economy but also reduces the pressure on amenities in urban areas on account of
lower rate of migration from rural area.
Fertilizers are crucial inputs for Indian agriculture. About 40-50 per cent
increase in food grain production is attributed to increased fertilizer use. The growth
in fertilizer consumption is directly linked to agricultural development. The role of
fertilizer has gained greater importance now, as the increased agricultural production
has to come from shrinking quantitative and qualitative resources, notably and and
water; in the coming years. During the past few years the goodgrain production is
stagnant around 212 MT and fertilizer consumption is also stagnant at 17 MT of
nutrients (NPK) and this need to be broken for attaining food security of the country
having over one billion population which is growing at much faster speed than the
counterparts in developed countries.
146
The economic reform programmes, initiated in 1991, brought about in the
wake of liberalization touching almost every segment in the country. The winds of
change swept over the fertilizer industry as well. In the midst of this, the fertilizer
sector was subjected to short-term and ad hoc measures, with the sole objective of
reducing fertilizer subsidy. In the last thirteen years since then, the industry that
changed th face of Indian agriculture and freed the country from the bondage of
importing food grains of inferior quality to feed the millions of hungry people, is now
reeling under tough policy environment. Thus the health of fertilizer industry has to
be stronger for sustainable agriculture to attain food security which in turn protects
the sovereignty of our country.
4.6.1 Present Fertilizer Scenario:
The gap between fertilizer consumption and indigenous production was
bridged by importing Urea, DAP and entire MOP besides phosphoric acid to
manufacture NP/NPK fertilizer within the country.
4.6.1.1 Fertilizer Production:
The indigenous production of N during the year 2003-04 through 55 plants
(out of which 32 are urea plants) was 10.56 MT by using 86.4 per capacity. Similarly
production of P was 3.62 MT during 2003-04 from 64 SSP plants and 20 NP/NPK
plants. Thus the total production of N and P was 14.18 MT during the year 2003-04.
The urea accounts for 83 per cent of total N production while DAP, NPK respectively
account of 8.0 and 7.3 per cent of total N production. In case of P production DAP,
NPK and SSP respectively account for 59.9, 29.2 and 10.9 per cent of total P
production.

147
4.6.1.2 Fertilizer Consumption
The total nutrient consumption was 16.90 MT during 2003-04 out of which
7.56 MT was in Kharif and 9.34 MT was in rabi season. In this year consumption of
N, P and K was respectably 11.15, 4.15 and 1.60 MT. Out of total nutrient
consumption UP has largest share (19.9), followed by AP (11.0), Punjab (9.1),
Maharashtra (8.5) and WB (6.6). These 5 states account for 55.1 per cent of total
fertilizer consumption in the country. Next in order were Haryana (6.0), Gujarat (6.0),
M.P. (5.8), Karnatraka (5.4), Rajasthan (4.6), Tamil Nadu (4.2) and Bihar (4.0).
These 12 states accounted for 91.1 per cent share in total fertilizer consumption in
the country. Balance 8.9 per cent consumed by remaining states.
Table No. 4.7 Season-wise consumption of N, P2O5 and K2O and Total by State
and Percentage variation (2002-03 and 2003-04)
West Zone:
State Nutrient Consumption (‘000 tonnes)
2002-03 2003-04 (P)
Chhattisgarh N 140.06 17.80 157.86 139.93 23.42 163.35
P2O5 61.94 8.88 70.82 51.40 11.74 63.14
K2O 18.64 3.01 21.65 16.53 4.45 20.98
Total 220.64 29.69 250.33 207.86 39.61 247.47
Source: Fertilizer Statistics, 2003-04, The FAI, p.I-86.
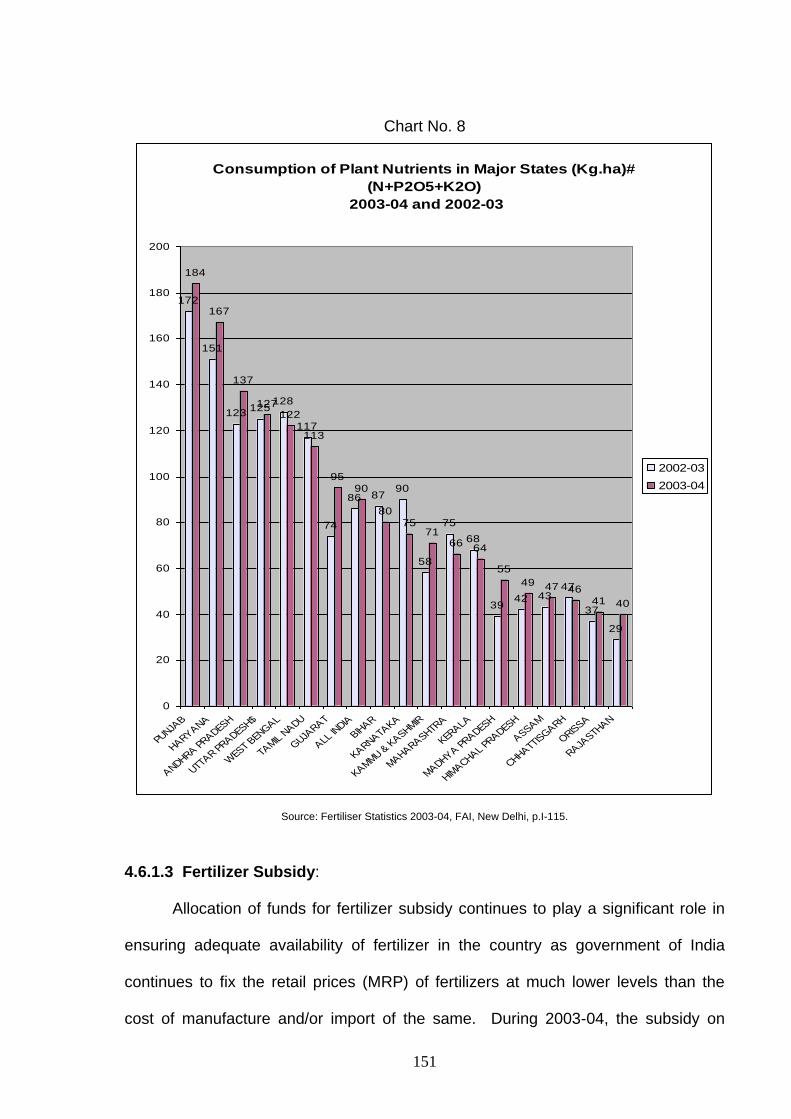
All India per hectare consumption of total nutrients was 90.4 Kg during 2003-
04. The major states which had per hectare consumption higher than all India
average included Punjab (184 Kg), Haryana (167 Kg), A.P. (136.8 Kg), UP and
148
Uttaranchal together (129.1 Kg), WB (126.7 Kg), Tamil Nadu (112.2 Kg) and Gujarat
(95.1 Kg). In other states per hectare consumption was lower than all India average.
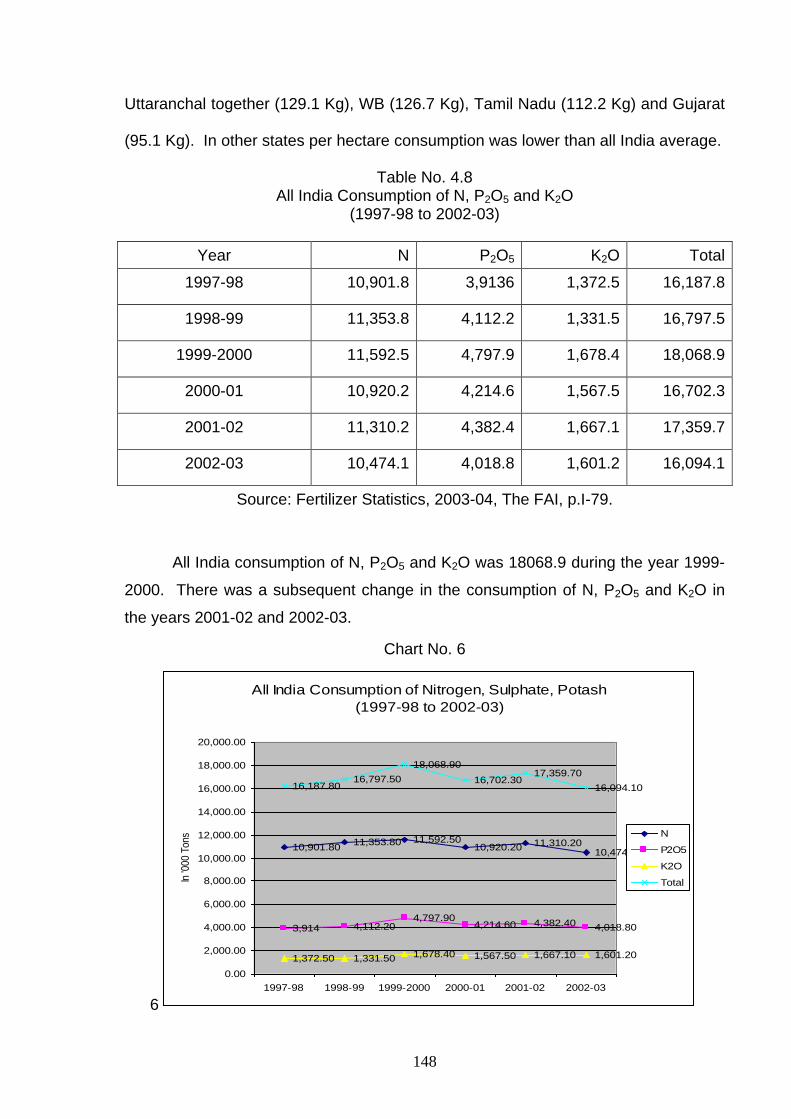
Table No. 4.8 All India Consumption of N, P2O5 and K2O
(1997-98 to 2002-03)
Year N P2O5 K2O Total
1997-98 10,901.8 3,9136 1,372.5 16,187.8
1998-99 11,353.8 4,112.2 1,331.5 16,797.5
1999-2000 11,592.5 4,797.9 1,678.4 18,068.9
2000-01 10,920.2 4,214.6 1,567.5 16,702.3
2001-02 11,310.2 4,382.4 1,667.1 17,359.7
2002-03 10,474.1 4,018.8 1,601.2 16,094.1
Source: Fertilizer Statistics, 2003-04, The FAI, p.I-79.
All India consumption of N, P2O5 and K2O was 18068.9 during the year 1999-
2000. There was a subsequent change in the consumption of N, P2O5 and K2O in
the years 2001-02 and 2002-03.
Chart No. 6
6
All India Consumption of Nitrogen, Sulphate, Potash
(1997-98 to 2002-03)
10,901.8011,353.80 11,592.50
10,920.20 11,310.2010,474.10
3,914 4,112.204,797.90
4,214.60 4,382.40 4,018.80
1,372.50 1,331.50 1,678.40 1,567.50 1,667.10 1,601.20
16,187.8016,797.50
18,068.90
16,702.3017,359.70
16,094.10
0.00
2,000.00
4,000.00
6,000.00
8,000.00
10,000.00
12,000.00
14,000.00
16,000.00
18,000.00
20,000.00
1997-98 1998-99 1999-2000 2000-01 2001-02 2002-03
In '0
00 T
ons N
P2O5
K2O
Total

149
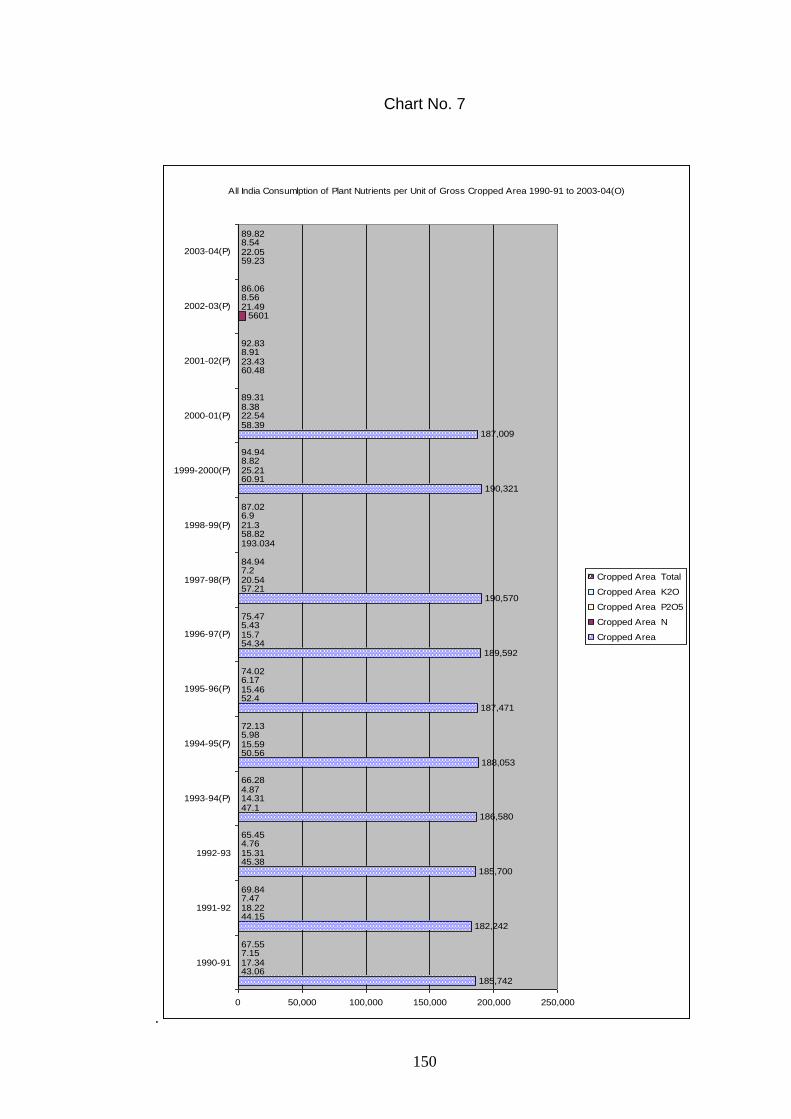
Table No. 4.9
All India Consumption of Plant Nutrients per Unit of
Gross Cropped Area 1990-91 to 2003-04 (P)
Year Gross Cropped Area
(‘000 ha)
Consumption per Hectare/Kg
N P2O5 K2O Total
1990-91 185,742 43.06 17.34 7.15 67.55
1991-92 182,242 44.15 18.22 7.47 69.84
1992-93 185,700 45.38 15.31 4.76 65.45
1993-94(P) 186,580 47.10 14.31 4.87 66.28
1994-95(P) 188,053 50.56 15.59 5.98 72.13
1995-96(P) 187,471 52.40 15.46 6.17 74.02
1996-97(P) 189,592 54.34 15.70 5.43 75.47
1997-98(P) 190,570 57.21 20.54 7.20 84.94
1998-99(P) 193.034 58.82 21.30 6.90 87.02
1999-2000(P) 190,321 60.91 25.21 8.82 94.94
2000-01(P) 187,009 58.39 22.54 8.38 89.31
2001-02(P) 60.48 23.43 8.91 92.83
2002-03(P) 5601 21.49 8.56 86.06
2003-04(P) 59.23 22.05 8.54 89.82
P=Provisional
Source: Fertiliser Statistics 2003-04, FAI, New Delhi, p. I-113.
150
Chart No. 7
.
All India Consumlption of Plant Nutrients per Unit of Gross Cropped Area 1990-91 to 2003-04(O)
185,742
182,242
185,700
186,580
188,053
187,471
189,592
190,570
193.034
190,321
187,009
43.06
44.15
45.38
47.1
50.56
52.4
54.34
57.21
58.82
60.91
58.39
60.48
5601
59.23
17.34
18.22
15.31
14.31
15.59
15.46
15.7
20.54
21.3
25.21
22.54
23.43
21.49
22.05
7.15
7.47
4.76
4.87
5.98
6.17
5.43
7.2
6.9
8.82
8.38
8.91
8.56
8.54
67.55
69.84
65.45
66.28
72.13
74.02
75.47
84.94
87.02
94.94
89.31
92.83
86.06
89.82
0 50,000 100,000 150,000 200,000 250,000
1990-91
1991-92
1992-93
1993-94(P)
1994-95(P)
1995-96(P)
1996-97(P)
1997-98(P)
1998-99(P)
1999-2000(P)
2000-01(P)
2001-02(P)
2002-03(P)
2003-04(P)
Cropped Area Total
Cropped Area K2O
Cropped Area P2O5
Cropped Area N
Cropped Area
151
Chart No. 8
Consumption of Plant Nutrients in Major States (Kg.ha)#
(N+P2O5+K2O)
2003-04 and 2002-03
172
151
123125
128
117
74
86 8790
58
75
68
3942 43
47
37
29
184
167
137
127122
113
9590
8075
7166
64
55
49 47 4641 40
0
20
40
60
80
100
120
140
160
180
200
PUNJA
B
HARYANA
ANDHRA PRADES
H
UTTAR P
RADESH$
WES
T BEN
GAL
TAMIL
NADU
GUJARAT
ALL IN
DIA
BIHAR
KARNATAKA
KAMMU & K
ASHMIR
MAHARASHTRA
KERALA
MADHYA PRADES
H
HIMACHAL
PRADES
H
ASSAM
CHHATTIS
GARH
ORISSA
RAJASTH
AN
2002-03
2003-04
Source: Fertiliser Statistics 2003-04, FAI, New Delhi, p.I-115.
4.6.1.3 Fertilizer Subsidy:
Allocation of funds for fertilizer subsidy continues to play a significant role in
ensuring adequate availability of fertilizer in the country as government of India
continues to fix the retail prices (MRP) of fertilizers at much lower levels than the
cost of manufacture and/or import of the same. During 2003-04, the subsidy on
152
indigenous urea disbursed was 8140 crores and phosphatic fertilizers were 3656
crores, which totals to 11796 crores. However, during 2004-05 budget allocated for
fertilizer subsidy has been 12662 crores.
The increase in fertilizer subsidy was mainly due to significant increase in cost
fo raw materials/intermediates like naphtha, phosphoric acid, ammonia etc., coupled
with increase in cost of imported fertilizers, namely MOP and DAP, which are beyond
the control of the industry.
4.6.1.4 New Pricing Policy
The erstwhile Retention Pricing-cum-Subsidy Scheme (RPS) for urea
introduced in November 1977 which provided for unit-wise pricing and subsidy, came
to an end on March 2003. The new pricing scheme (NPS) for urea was implemented
from April 2003 with an objective to encourage efficiency parameter of international
standards based on—
Most efficient feed stock
State of the art technology
Ensure viable rate of return to the units.
The main features of the New Pricing Policy are:
(i) Change over from unit specific Retention Price to Group Retention
Price: all 32 urea units classified into 6 groups based on feedstock
and vintage.
153
(ii) Phased decontrol of urea distribution/movement: Accordingly
distribution of 25 and 50 per cent of reassessed capacity was taken
out of ECA respectively in kharif 2003 and rabi 2003-04. Primary
freight on urea distributed under free category (non ECA) was
reduced by Rs. 100/T as compared to the freight allowed on quantity
of urea distributed under ECA.
(iii) In stage-II, that is, from Kharif 2004 the policy has envisaged 100
decontrol of urea, but Government of India has decided to continue
to maintain 50 per cent ECA, however, reduction in CRC of 12 units
as well as preset energy norms for all the units.
(iv) No imbursement on investment for improvement in operation or no
mopping up of gains as a result of operational efficiency.
(v) Equated freight on the basis of average normative lead and rail-road
mix of each unit for the previous three years.
4.6.2 Challenges and Opportunities thrown up by the NPS:
4.6.2.1 Challenges:
(a) Unit’s return (normative 12 per cent post tax in RPS) under strain due
to:
Units having higher retention price than the group average are
losing.
Tightening of energy norms during stage-II on efficiency
consideration.
Reduction in concession during stage-II due to relduction in CRC.
154
Non-updating of conversion costs, which are based on 1999-
2000 with no revision.
(b) No recognition of capital addition made by units, particularly older
ones, since 1.4.2000.
(c) Reduction in freight subsidy of Rs. 100/T consequent to movement
decontrol may not be compensated by commensurate saving in freight
cost due to competition/inflation.
(d) Uncertainty in policy environment beyond March 2006.
In nut shell the challenges before fertilizer industry is to be operated on thin
margin by further improving the efficiency in production as well as in marketing
activities individually or mutually among themselves.
4.6.2.2 Opportunities:
The new pricing policy sets out to full decontrol.
Tremendous opportunities on saving freight.
No capping on production of urea.
Sale or use of byproducts such as ammonia, carbon dioxide etc. are permitted
if not converted to urea or considered surplus.
Export of urea against imports by GOI.
No mopping up of any improvements made by the units.
Opportunity to naphtha based units to change over to NG/LNG under special
policy/package.
No further reassessment of capacity.
155
Besides these, the national agricultural policy plans to achieve for grain
production of 320 MT by 2011-12 which trows opportunity of increase in demand to
nearly 28-30 MT of nutrients from present level of about 17 MT of nutrients. The
information technologies are increasing at much faster speed also give opportunity
for improving efficiency.
4.6.3 Strategy
Logically the strategies are made to take full advantage of opportunities as
well as to meet the challenges thrown at the industry, thus improving the strength of
the organizations.
4.6.3.1 Production Level
Switch over to cheap source of raw materials and energy saving by suitable
modification in the plants.
Forming of joint ventures in the countries where raw materials like LNG/Rock
phosphate, phosphoric acid etc., are cheaper and amply available to source
the raw materials on long term basis.
Product exchange among the companies needs to implement in true sense to
avoid long distance freight.
4.6.3.2 Marketing Level:
Economize transportation cost (rain and road) by following least cost matrix.
Improving handling so as to avoid loss to the materials.
Economize in warehousing cost by critical review of stock time to time.
Micro planning of stocking plan to meet the demands without overstocking.
156
Strengthening the distribution channel.
Effective promotional programme with active involvement of cooperative
dealers to educate farmers for better farming practices to increase crop
productivity and to improve soil health for sustainable agriculture.
Contractual farming as forward linkage to empower farmer and to benefit
industry in win-win situation. Custom hiring facilities of farm machinery can be
created for empowering farmers.
Use IT for fast, clear communication as well as for transfer of technical
knowledge in the form of agro-portals.
Motivate farmers and cooperative dealers to take advantage of forward trade
of agricultural communities, made possible by NCDEX.
Since organic manure improves fertilizer use efficiency, special thrust by
fertilizer industry is to be given to promote biogas, composing in rural areas
which are burnt as fuel to large extent.
Farmers are to be educated that they grow faster in self help grou0p (SHG).
Fertilizer industry needs to create alliances with seed industries or other input
industries for integrated and effective services to farmers.
4.7 Discussion and Conclusion:
4.7.1 Discussion
The Fertilizer marketing is entering in an era of new challenges. Besides
substantial increase in quantum to be marketed by IFFCO, marketing base will have
to be widened covering low consumption under development tribal areas very
remote from urban masses.
157
Moreover, these tasks will have to be performed in more difficult
circumstances than before. The policy environment will be not as favourable as in
past due to increasing Fertilizer subsidy burden. At the same time infrastructure
required to improve efficacy of Fertilizer marketing system is unlikely to keep pace
with Fertilizer market expansion. The alternatives available with the manufacturers
are to bring maximum economy in their operation through better resource
management, make renewed efforts to improve quality distribution channel and seek
government support in certain areas to achieve commercial viability of marketing
operations.
4.7.2 Conclusion:
Fertilizer is key input for attaining food security of this country. Subsidy burden
is being reduced or contained by implementing norms of international standard in
NPS. The fertilizer industry requires to reduce production cost as well as marketing
costs and to maintain high degree of efficiency for gaining competitive edge. The
second green revolution has to come by true transfer of technology on farmers field,
which not only will increase productivity but it will also enable to maintain and
improve soil health for sustainable agriculture. This task is very difficult due to
second generation problems, namely, deficiency of secondary and micro nutrients,
declining response of fertilizer use, incidences on new pests, lowering down of
ground water etc. come up in agriculture.