marketing innovations: the choice between discrimination...
TRANSCRIPT
Marketing Innovations: The Choice between Discrimination and Bargaining Power
Mihkel Tombak1
September, 2003
ABSTRACT The selling of a good or service in which the identity of the buyer(s) is of interest to both the seller and the other buyer(s) is studied. We examine the licensing of a modest cost reducing technological innovation to rivals with differing costs in Cournot markets. Through both the pricing (royalties or fixed fees) and the price setting mechanism (posted price or Nash bargaining) the seller can affect which and how many firms would be sold licenses. When selling an exclusive license we find that the innovator may prefer to license a smaller rival with fixed fees than when charging royalties. Also, the licensor would prefer to charge fixed fees when selling a limited number of licenses, however, licensing would tend to be more widespread with royalties. Consumers prefer licensing via pairwise bargaining when the rival firms are relatively efficient (large). The robustness of the results to asymmetric differentiated Bertrand product markets and implications for policy are discussed. Keywords: Licensing, technological innovation, size distribution of firms JEL: D45, O32, L11
1 Rotman School of Management, and University of Toronto at Mississauga, 105 St. George St., Toronto, Ontario, CANADA M5S 3E6. e-mail:[email protected]. The author would like to acknowledge the comments of Vincenzo Denicolo, Thomas Gehrig, Joseph Harrington and Piero Tedeschi, and the seminar participants at CIRANO, EARIE, Workshop in IO in Helsinki, Workshop on Licensing in Milano, Queens University, and the WZB. Also appreciated is the financial support of NSERC, Academy of Finland, Queen’s University and University of Toronto.

2
Introduction
This study examines the selling of a good or service where the identity of the buyer(s), who are
also rivals of the seller, is important to both the seller and other buyers. This situation was
exemplified, in 1977 when JVC and Matsushita licensed its VHS video cassette technology to a
number of rivals including Mitsubishi, Panasonic, RCA and Thomson Electronics, resulting in a
wider distribution of its technology and a redistribution of profits among competitors. Many
other examples of a technology owner renting its use to rivals are given in Baumol (2002). The
seller of the technology must take into consideration not only the licensing revenues from a
particular buyer but also the effect of the license on its own product market profits and on the
profits to other potential buyers of the technology. Through both the pricing scheme (royalties
or fixed fees) and the price setting mechanism (posted price or bargaining) the seller can affect
which and how many firms would be sold licenses as well as the profitability of licensing.
The licensing of technologies plays a central role in the diffusion of innovations. It can also have
a significant impact on the revenues and returns to the innovator. For example, Texas
Instruments obtained revenues of $1.5 bil. in one year from the royalties of its licensed
technologies, and in some years these revenues have exceeded its operating income (Thurow,
1997). Licensing has become an increasingly prominent trade issue with American royalties and
license fee receipts from abroad increasing from $8.1 bil. in 1986 to $33.7 bil. in 1997 with
payments abroad growing to $9.4 bil. in 1997 (Survey of Current Business, 1998, Pg. 86 and 97).
Domestic trade in technologies is at least that volume (Katz and Shapiro, 1986) with the overall
revenues from licensing patents increasing dramatically from $15 bil in 1990 to $110 bil. in 1999
(Rivette and Kline, 2000). How these licenses are priced and marketed, however, have an
essential impact on which firms obtain licenses, the diffusion of the innovation, and what
revenues are accrued by the inventor.
We explore the incentives to license a cost reducing technology when the innovator is also active
in the product market and its rivals (and potential licensees) differ in marginal costs. Product
market competition is modelled as asymmetric Cournot. A cost reducing innovation is then

3
potentially ”drastic” to some rivals and ”modest” to others. Here we focus on innovations that
are modest for all rivals so that licensing is not crucial for those firms to remain in the market.
We also examine how the firm size distribution in the industry affects the diffusion of new
technologies and the rewards for innovation. The innovator by choosing the pricing, which firms
to license and how many licenses to sell can have an essential impact on firm-size distribution.
We model the market for the innovation in two ways. In one scenario the innovator chooses
which, (if any) firms to license and engages pairwise with the licensees in a Nash bargaining
game over the price. In another scenario the innovator announces a posted price for the license
to all its competitors, who then choose to accept or reject the offer. In effect, with the bargaining
mechanism the innovator exercises the ability to price discriminate but yields somewhat in
bargaining power whereas under the posted price (making a take-it-or-leave-it offer) the licensor
uses maximum bargaining power but loses the ability to discriminate between potential licensees
and on price. Here we study how the market mechanism chosen by the innovator affects who
obtains a license and how the mechanism affects the returns to innovation and its diffusion. We
then discuss how those results may change if the product market competition were differentiated
Bertrand with asymmetric marginal costs.
Arrow (1962) spurred considerable debate in industrial economics circles by showing that an
owner of a unique cost reducing innovation would obtain more revenue by licensing for a certain
royalty fee to all firms in a perfectly competitive market. This appeared to refute the
Schumpeterian claim that that some monopoly power increases the incentives for innovating. As
Kamien and Schwartz (1982, Chapter 2) point out, however, Arrow’s analysis concerned a given
market structure of the industry purchasing the innovation and not of the structure of the
innovation producing industry. These industries could be one and the same as indicated in the
following statement
”Sometimes the highest profits are obtained by the owner of the rights to an invention if it simultaneously uses the invention as an input in its own production and rents its use to others.” Baumol (2002, pg. 12)
Our analysis examines imperfectly competitive markets in which the industry producing and
utilizing the innovation are one and the same and where the firm-size distribution could change

4
with licensing. In this context, we find that the diffusion of licenses can be restricted depending
on the pricing and the price-setting mechanism used. For an excellent survey of the literature in
licensing see Kamien (1992).
Gallini (1984), Gallini and Winter (1985) and Katz and Shapiro (1985) have examined the
incentives of one producer to license its process technology innovation to another producer under
duopolistic market structures. The incentive in Gallini (1984) was to deter the rival from
investing in R&D and possibily produce an even better process technology. Gallini and Winter
(1985) extended the innovation game of Reinganum (1983) to examine how licensing would
affect incentives of duopolists to engage in R&D and how it would subsequently impact on
industry costs and market structure. They found that licensing stimulates R&D when industry
variation in costs is low and when industry concentration is low. In their model, the innovator
always has an incentive to license. We also examine the issues of industry costs and structure,
albeit in an asymmetric oligopolistic industry, and we focus on how the innovator markets his
R&D result.
Gallini and Wright (1990) examine the problem of information asymmetry in licensing
technology, as the licensor may have more information about the quality of the innovation than
does the licensee. They show how the form of payment to the inventor (fixed fee versus an
output based royalty) can be used to overcome, to some degree, the market failure that may result
from such information asymmetries. This is particularly a problem when the inventor is
independent of the industry purchasing the technology. As we focus on how the innovator
markets his invention, our analysis is one with complete information. Our firm asymmetries are
simply of the form of marginal cost differences ex ante the innovation and licensing. Moreover
the inventor is also a participant in the final output market. In this context there is an additional
argument for the use of royalties instead of fixed fees – the innovator can keep its product market
rival’s marginal costs higher and mitigate business ”stealing”.
Kamien and Tauman (1986) analyze the decision of an owner of an invention to use fixed fees
versus royalties in licensing to a symmetric oligopolistic industry which competes in a Cournot
fashion. They compute the number of licenses sold and find that licensing via a fixed fee is

5
superior for both inventor and consumers and that a ”drastic” innovation is licensed to a single
producer. In our model with asymmetric producers the innovation is ”modest”. Furthermore, as
the innovator in our model is also a producer our analysis has certain strategic product market
considerations which are absent in Kaimien and Tauman’s model, weighing in favor of royalties
in our setting. Royalties were shown to be superior to upfront fees in the duopoly model
analyzed by Wang (1998) and, simultaneously and independently of this analysis, for the
symmetric Cournot oligopoly by Kamien and Tauman (2001). Here we investigate the
optimality of fixed fees in an asymmetric Cournot oligopoly setting.
Few studies have examined, as we do, the issue of who is licensed (an irrelevant issue when it is
assumed that the firms are symmetric). Exceptions are Rockett (1990) and Spiegel (2003).
Rockett argues that innovators may be selective about whom they license, and analyzes the effect
of post-patent competition on the choice of to whom a drastic innovation license would be sold.
She analyzes a model of a three firm industry where one firm is the innovator and the two
remaining firms are differentiated in terms of their competitive strength. She finds that a
patentholder would license the weak competitor in order to retain a dominant position once the
patent expires with a view to deter a stronger rival from entering. Spiegel (2003) in his
examination of a winner-take-all patent race between three firms finds that ex ante the
innovation, licenses of interim knowledge may take place to the stronger rival. Our analysis
examines an n-firm oligopoly, focusing on the patent period or time period during which the
technology is confidential. The technological innovation examined here is of the nondrastic type
so that issues about exit and entry are not addressed. We also find that that the licensed rival
would be the weakest (depending on the fee structure) but in addition we find that the diffusion
of licenses depends on the size distribution of firms and on the pricing of the license.
Furthermore, we find that the extent of diffusion of licensing will be affected by how the license
is marketed and the degree of asymmetry - a more symmetric market and discrimination between
licensees can lead to greater diffusion.
The size-distribution of firms has recently received increasing attention (see the survey by
Sutton, 1997). In much of the literature size-distribution is an outcome of some stochastic
process, such as a Poisson process, by which firms find market opportunities. In our model the

6
initial size distribution is given and can then be modified by an innovation and licensing. Thus,
the final size distribution is an outcome of choices by the innovator of whether and how to
license that innovation. Gibrat’s Law, which holds that the expected growth increment in each
period is proportional to the current size of the firm, may still hold in our model if the probability
of innovation and the cost reduction of the innovation were related to firm size (e.g., if the
probability of innovating were proportional to the size of the R&D budget which, in turn, is a
percentage of sales). Generally, however, licensing leads to more symmetric market shares in
the product market but more skewed revenue flows (with the innovator obtaining greater
revenues due to the licensing fees). Consequently, licensing may be one explanation for the
empirical finding by Sutton (1998) that R&D intensive industries display no greater degree of
size inequity, as measured by sales in a market, than do the non-R&D intensive industries in a
control group.
This study is organized as follows. We develop and analyze the basic asymmetric Cournot
model of product market competition and the surpluses and costs attributable to a license for a
cost reducing innovation. We then examine how that surplus may be divided between innovator
and licensee through pricing and through the various market mechanisms such as posted price
and Nash bargaining and establish who the innovator would license under the different regimes.
We consider whether and how our results would change under the product market regime of
differentiated Bertrand with asymmetric marginal costs. In the final section we summarize and
discuss the conclusions.
2. The Surplus from Licensing
In this section we develop the basic model of the product market competition and from that
derive the surpluses from licensing a cost reducing innovation. These surpluses will then be used
in the subsequent derivation of optimal patterns of licensing and in the calculation of the returns
to innovation.
7
We begin with the computation of product market equilibrium profits given the marginal costs of
the firms.
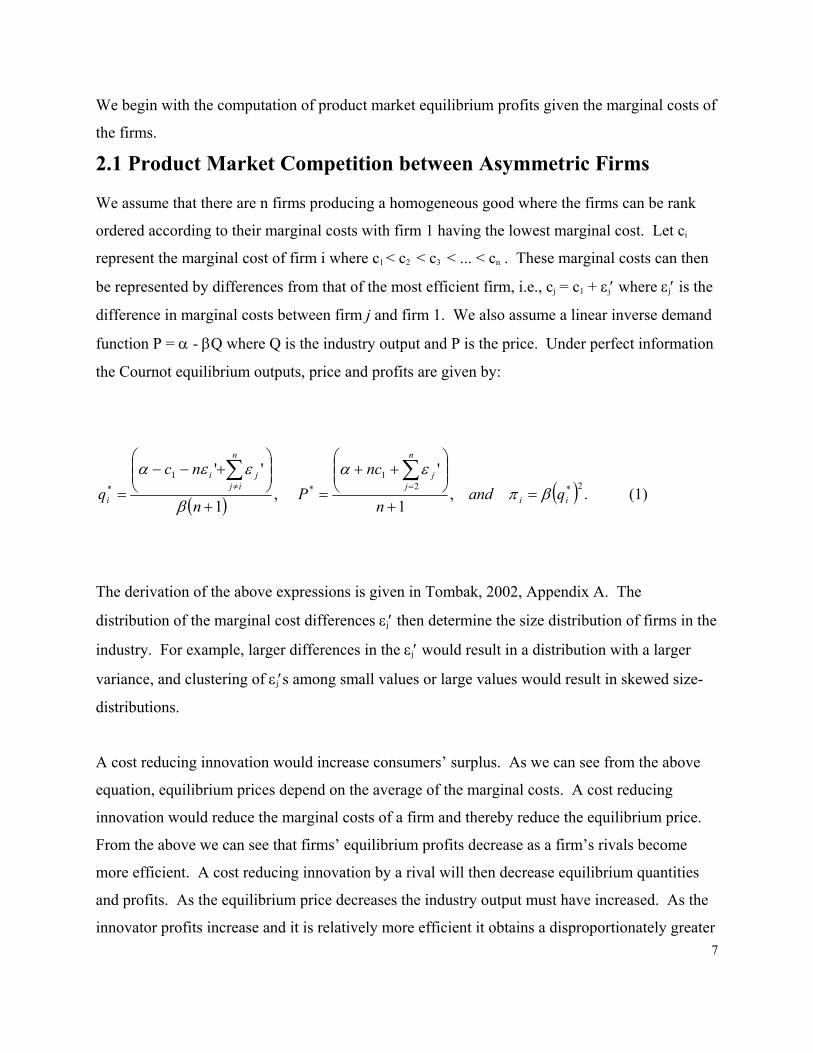
2.1 Product Market Competition between Asymmetric Firms We assume that there are n firms producing a homogeneous good where the firms can be rank
ordered according to their marginal costs with firm 1 having the lowest marginal cost. Let ci
represent the marginal cost of firm i where c1 < c2 < c3 < ... < cn . These marginal costs can then
be represented by differences from that of the most efficient firm, i.e., cj = c1 + εj′ where εj′ is the
difference in marginal costs between firm j and firm 1. We also assume a linear inverse demand
function P = α - βQ where Q is the industry output and P is the price. Under perfect information
the Cournot equilibrium outputs, price and profits are given by:
( )1
''1*
+
+−−
=∑≠
n
ncq
n
ijji
i β
εεα, ( ) .,
1
'2*2
1*
ii
n
jj
qandn
ncP βπ
εα=
+
++
=∑= (1)
The derivation of the above expressions is given in Tombak, 2002, Appendix A. The
distribution of the marginal cost differences εj′ then determine the size distribution of firms in the
industry. For example, larger differences in the εj′ would result in a distribution with a larger
variance, and clustering of εj′s among small values or large values would result in skewed size-
distributions.
A cost reducing innovation would increase consumers’ surplus. As we can see from the above
equation, equilibrium prices depend on the average of the marginal costs. A cost reducing
innovation would reduce the marginal costs of a firm and thereby reduce the equilibrium price.
From the above we can see that firms’ equilibrium profits decrease as a firm’s rivals become
more efficient. A cost reducing innovation by a rival will then decrease equilibrium quantities
and profits. As the equilibrium price decreases the industry output must have increased. As the
innovator profits increase and it is relatively more efficient it obtains a disproportionately greater
8
share of that industry output. The rivals, being relatively less efficient, would then yield some of
their share of the market to the innovator. Hence for those firms that do not enjoy the cost
reduction, the innovation would have a negative effect on their equilibrium profits.
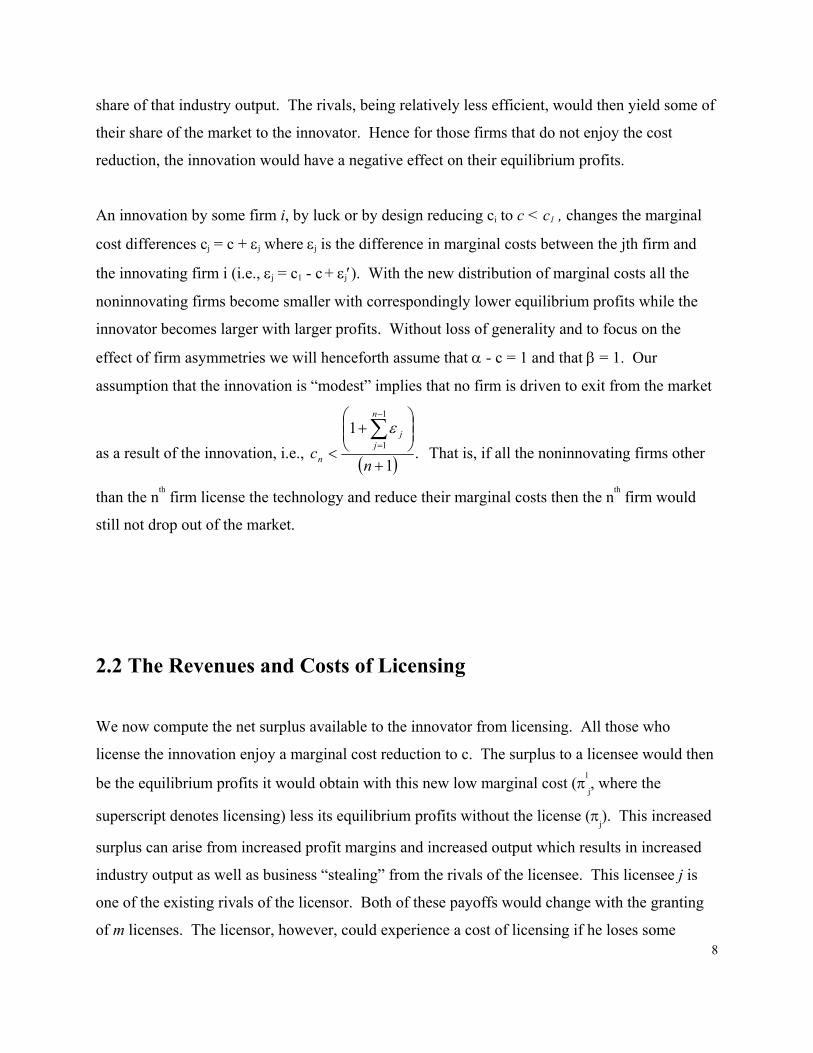
An innovation by some firm i, by luck or by design reducing ci to c < c1 , changes the marginal
cost differences cj = c + εj where εj is the difference in marginal costs between the jth firm and
the innovating firm i (i.e., εj = c1 - c + εj′). With the new distribution of marginal costs all the
noninnovating firms become smaller with correspondingly lower equilibrium profits while the
innovator becomes larger with larger profits. Without loss of generality and to focus on the
effect of firm asymmetries we will henceforth assume that α - c = 1 and that β = 1. Our
assumption that the innovation is “modest” implies that no firm is driven to exit from the market
as a result of the innovation, i.e., ( ) .1
11
1
+
+
<∑−
=
nc
n
jj
n
ε That is, if all the noninnovating firms other
than the nth firm license the technology and reduce their marginal costs then the nth firm would
still not drop out of the market.
2.2 The Revenues and Costs of Licensing
We now compute the net surplus available to the innovator from licensing. All those who
license the innovation enjoy a marginal cost reduction to c. The surplus to a licensee would then
be the equilibrium profits it would obtain with this new low marginal cost (πl
j, where the
superscript denotes licensing) less its equilibrium profits without the license (πj). This increased
surplus can arise from increased profit margins and increased output which results in increased
industry output as well as business “stealing” from the rivals of the licensee. This licensee j is
one of the existing rivals of the licensor. Both of these payoffs would change with the granting
of m licenses. The licensor, however, could experience a cost of licensing if he loses some

9
profits in the product market by making a rival more efficient (πi- πl
i, the result of business being
“stolen” by the licensee) and reduces the product market equilibrium price. The net surplus that
might be captured by licensing is then the difference between the surplus to the licensee(s) and
the cost to the licensor.
Given the product market equilibrium profits the demand curve for licenses is determined by:
where M is the set of licensed firms the summation in the above expression is then the sum of the
ε’s of all firms not in the set M and not that of firm j. The benefit of the license to the licensee is
seen in incremental product market profits when there is a set M of other firms with the license.
Since the derivative of (2) with respect to εj is 2(n/(n+1)) q
j the above value of a license increases
in ε. Thus smaller firms value the license more. With licensing of firm j the quantity for any
other firm given in (1) will go down by the εj term. In the computation of q
j the jth firm takes into
consideration that the innovator may license to other firms. Thus, as more licenses are granted to
its rivals the Σε term would decrease and the price each licensee would be willing to pay would
decrease correspondingly.
We will examine two pricing structures by which this surplus might accrue to the licensor – fixed
fees and royalties. Fixed fees involve the transfer of a lump sum from the licensee to the licensor
that, as defined in (2), would be at most πl
j - π
j. Royalties, as a per unit fee or a percentage of
sales fee for the use of the technology, play a role in the majority of licenses (see Caves,
Crookwell, and Killing, 1983). When the innovator is also a participant in the product market
royalties have an advantage in that this mode of pricing keeps the marginal costs of the licensees
above c. If the innovator sets a royalty fee of r per unit of output sold, the marginal costs of all
( )( )( )
)2(121 2
−
+⋅+
=+−=− ∑≠∉
j
n
jMk
kj
jljj
ljj
lj n
n
nqqqq εε
εππ

10
licensees are then c + r and their outputs defined in (1) would be adjusted accordingly. The
revenues to the licensor would then be rql
j where ql
j is the Cournot quantity of the licensee after
licensing the technology.
The cost of licensing is the lost product market profit of the licensor due to licensing, and this
cost will depend on which and how many firms are licensed. Granting a license makes the rival
more efficient and will reduce the asymmetry in the product market. The cost to the licensor of
providing the mth license with a fixed fee to firm j given product market profits in (1) is:
This cost to the innovating firm i of licensing to firm j is increasing in εj, hence decreasing with
the size of the rival. This occurs as the license makes a rival more efficient, and the greater εj, the
greater this efficiency effect. Also, licensing decreases asymmetry in the industry.2 The above
cost of licensing, however, can be mitigated to some degree by the pricing chosen by the licensor
(e.g. by charging per unit royalties as opposed to fixed fees). If the innovator can perfectly price
discriminate and charge a royalty rate to licensee j of rj = ε
j then the price in the product market
(P*) remains constant, the distribution of outputs remain the same, the licensing revenues are εjq
j,
and COSTi =0. The licensore, however, may find it optimal to charge royalty rates different
from εj in which case there will be some business ”stealing” effect which is computed below.
For an innovator who is also a participant in the market the incentives to license are then
governed by the difference between the surplus to be obtained and the lost product market profits
to the innovator. The maximum net surplus to the innovator when licensing a rival firm j via
fixed fees is:
( )( )( )
)3(121
12
+
+⋅+
=+−=−= ∑≠∉
j
n
jMk
kjlii
lii
liii n
qqqqCOST εεεππ

11
The expression within the square brackets above is positive by the condition for positive Cournot
quantities. Thereby the net surplus of licensing to rivals is positive for all n ≥ 2. If royalties are
used such that rj = ε
j then the revenues are ε
jq
j. If, however, the optimal royalty for a given
licensee were to deviate from (be less than) the efficiency differential then the net surplus from
such a royalty based license would be
( )( )( )
++
++⋅+
−−
++−+
=+−=
∑ ∑∑ ∑≠∉
≠∈
≠∉
≠∈
jj
n
jMk
n
jMk
kkjj
n
jMk
n
jMk
kkjj
lii
ljj
r
rrn
rrnr
nr
qrNSj
εεε
ε
ππ
121
11 2
(5)
As shown above, the net surplus from any one license under royalty pricing depends on the
royalty rate charged to the other licensees. We now consider the question of to which rival firm
the innovator prefers to grant an exclusive license under the different pricing schemes.
Proposition 1. When exclusively licensing and when n > 4, the licensor would prefer to grant
the license to a more efficient rival when charging royalties than when charging fixed fees.
Proof:
Taking the derivative of NSr
j with respect to r
j we find the optimal royalty rate (r
j*) and that the
licensor would prefer to grant an exclusive license to the firm j for which εj> r
j* and ε
j closest to
2 For a further discussion of the effect of reducing the variance in marginal costs in a Cournot setting (albeit while keeping the average marginal cost constant) see Salant and Shaffer (1999).
( )( ) ( ) )4(1112
12
2
+−
+−⋅+
=+−−= ∑≠∉
j
n
jMk
kjl
iijlj
Fj nn
nNS εε
εππππ

12
( ) ( )1.112
32
* Cnn
nrn
jkj
+
−++
= ∑≠
ε
To find the optimal fixed fee licensee we take the derivative of the net surplus NSj
F with respect
to εj and obtain,
( )( ) ( ) .111
12 2
2
+−
+−
+=
∂
∂∑≠
j
n
jk
j
Fj nn
n
NSεε
ε
Thus when charging fixed fees, the preferred licensee is the least efficient when there exist rivals
that are relatively inefficient, i.e., when there exists a firm j such that,
Comparing Fjε with r
j* yields the Proposition.
Q.E.D.
Proposition 1 shows that the rival to which the innovator would prefer to license is determined
by the market structure, by the firm-size distribution, and by how the licensor chooses to price
the license. Under fixed fee pricing, if markets are competitive (n is large) and rivals are
relatively small (Σ k∉M
εk is large) then the licensor would prefer to license the weakest of those
rivals. To see this one can rewrite (C2) as n(n+1) qj − (1+ Σ
k∉M ε
k) - ε
j > 0. For example, if the
innovator faced only two rivals, firms j and k (εj > ε
k, n =3) then firm j would be the preferred
( )( ) ( )2.1
11
2 Cnn n
jk
Fj
+
+−
= ∑≠
εε

13
licensee under either pricing scheme when εj < 1/5 (1+ε
k). As both the revenues (2) and the costs
(3) to the innovator of lost product market profits are greater when licensing inefficient rivals,
the Proposition implies that the revenue effects dominate the cost effects for fixed fee pricing
under the condition given. This is due, in part, to the licensor being able to capture some of the
rents the inefficent licensee can obtain by business stealing from the nonlicensing rival(s) (hence
the condition n > 4). Counterbalancing this effect is a phenomenon identified in Salant and
Shaffer (1999) whereby the most efficient firm’s profits are lower as the market asymmetries are
decreased (as they would with fixed fee licensing). Consequently, the COST of licensing a weak
rival is great under fixed fee licensing and the best licensor may not be the weakest. As stated
above, concerns with costs can be mitigated with the use of royalties.
The Proposition states that the optimal licensee is not necessarily robust to pricing. An innovator
who charges royalty fees would maximize the licensing revenues defined by rjq
j less any costs of
business stealing resulting from a royalty rate which deviates from εj.3 The optimal revenue
stream is achieved by licensing a rival j which satisfies (C1). The innovator must balance the
increased royalty rate he could charge to smaller (less efficient) firms which would be willing to
pay more for the cost reducing technology, with the output over which that royalty rate would be
applied. More inefficient rivals would be interested in licensing on the same terms as the
optimal licensee and would deliver the same licensing revenue stream but, under those terms,
they would become more efficient and engage in more business stealing from the licensor. As
the royalty rate is close to εj for the optimal licensee, the licensor is less concerned with any loss
in product market profits that would result from the licensing of a less efficient firm. This result
contrasts with that of Rockett (1990) as her analysis included the effects of licensing on the post-
patent period when entry may occur and licensing revenues would not be taken into
consideration.
3 Comparing r* in the Proof of Proposition 1 to that ε
j which yields zero Cournot quantities for firm j indicates that
at n=2 r* is constrained to be equal to εj .

14
Proposition 2 When exclusively licensing any given licensee, the licensor would prefer to use
royalty rates instead of fixed fees when the industry is a duopoly, otherwise fixed fees are
superior.
Proof:
From equations (4) and (5) we find that NSj
F - NSj
r > 0 iff ( ) ( ) jj
k nn εε 113 −+
+− ∑
≠
>0 from
which the industry structure in the proposition follows.
Q.E.D.
This proposition generalizes the optimality of royalty fees result of Wang (1998) from n=2 with
symmetric rivals to asymmetric rivals while showing that the result is limited to n = 2. The
intuition for this result is that with fixed fees the licensor can capture some of the rents of
nonlicensing rivals through the business ”stealing” that the licensing rivals will do to the
nonlicensing rivals. When n is very small then there are few nonlicensing rivals to steal business
from while the licensee will steal business from the licensor, hence the licensor charges royalties
to reduce the business stealing. Once n becomes large the rents from business stealing from
nonlicensing rivals increase but the rents from this depend on the distibution of the costs of these
nonlicensing rivals.
The innovator is also faced with the strategic question of whether to grant an exclusive license or
to broadly diffuse its technology. The maximum total net surplus may be obtained from the
granting of several licenses. The total net surplus would then be the sum of the net surpluses for
each of the m licenses calculated above taking into consideration that each of those net surpluses
vary with m and with the pricing of the license, i.e., the total net surplus is TNS = Σm(πl
l (m) -
πl(m-1)) - π
i(m=0)+ πl
i (m). This payoff obtained with fixed fees is compared to the royalties
from licensing the same set of licensees in the following proposition.
Proposition 3: For any given set of licensees, innovators active in the product market prefer fixed
fees to royalty payments when licensing rivals if

15
( ) ( ) ( ) .01113 2 >−+
+−
+⋅− ∑∑∑∈∈
≠∉ MjMj
j
n
jMk
k jnnn εεε
Proof:
The profit for a price discriminating, royalty charging licensor is,
( ) .11
1∑ ∑ ∑∑∈ ∈ ∈∉
−++
+=
Mj Mjj
Mkk
Mkkjjj nr
nq εεεε
The payoff from charging fixed fees to the m licensees is
( )( ) ( ) .1112
11 2
2
+−
+−⋅+
= ∑∑≠∉∈
j
n
jMk
kMj
j nnn
TNS εεε
Taking the difference
( )( ) ( ) ( )
−+
+−
+⋅−+
=− ∑∑∑∑∈∈
≠∉∈ MjMj
j
n
jMk
kMj
jj jnnn
nqTNS 2
2 11131
1 εεεε
which yields the condition in the proposition.
Q.E.D.
The condition in the proposition shows that if the number of nonlicensees were small (Σ k∉M
εk
small), the rival firms were relatively efficient (εj small) and small in number (low n) then

16
royalties may be preferred. If the licensor were perfectly price discriminating and charged
royalties then the technology would be diffused to all rivals, i.e., m=n-1. In this case, Σ k∉M
εk
would be zero and the above condition would be reduced to -4 + (n-1) ∑∈Mj
j
2ε > 0. Consequently, it
is shown why the results of Kamien and Tauman, 1986, Wang, 1998 and the symmetric oligopoly
case analyzed by Kamien and Tauman, 2001 sometimes conflict. In our case the fixed fees allow
the licensor the ability to capture the rents the licensee obtains from business ”stealing”. If there
are a sufficient number of nonlicensing rivals these rents from business ”stealing” could be
significant. The optimal number of licenses granted, however, may be more restricted under
fixed fees. The use of royalties keeps rivals’ costs high and will not reduce the willingness of
other licensees to pay. This would lead to a greater proliferation of licenses. Furthermore, as
indicated in Proposition 1, the set of licensees could be different for fixed fees and royalties. In
what follows we focus on which firms would be in the set of licensees.
Perfect price discrimination may draw the wrath of antitrust authorities due to dissimilar
treatment of what may appear to be similar transactions, so we now turn to the examination of
alternative pricing mechanisms. How much surplus the innovator will accrue depends on how
the innovation is marketed. In the analysis of Arrow (1962) all the surplus was extracted as all
the licensees were symmetric and price discrimination was a moot issue. As we shall see, under
the following different pricing setting practises, less than all the surplus is captured by the
innovator and market asymmetries and the price setting mechanism will have an effect on the
diffusion of the innovation.

17
3. Market Mechanisms for Licensing
In this section we analyze the two different modes of marketing an innovation – offering licenses
to all licensees at a certain price, or bargaining over the price with each customer. In what
follows we restrict our analysis to prices in the form of royalty rates as this form is the most
popular4 and it led to greater diffusion. In the first case, the innovator chooses a royalty rate and
potential licensees accept or reject the offer. The posted price acts as a commitment device
enabling the licensor to gain bargaining power. In the second case, the innovator may choose to
whom he would like to license the technology and then negotiates a royalty rate. Proposition 1
indicates that there is a value in being able to discriminate between licensees. But an
examination of the values licensees place on the license (2) suggests that those rivals most
interested in the license may not be those firms the innovator would want to license (by
Proposition 1). Furthermore, pairwise bargaining may allow some opportunity for the licensor
to price discriminate. In choosing between these two market mechanisms, the innovator faces a
tradeoff between excercising bargaining power and the ability to discriminate.
3.1 Posted Price
In this section we examine the effects of the innovator selling via the announcement of one price
for the license.5 We will examine the case where that price is in the form of a per-unit fee, or
royalty. The licensing agreement could (but need not) stipulate the number of licenses to be
granted. Potential licensees can then accept or reject the offer. This mechanism is similar to the
“chutzpah” mechanism described and found to be optimal for licensing symmetric firms in
4 Rostoker (1984) found that royalties alone were used in 39% of the licenses he studied. 5 A Vickery auction where the innovator announces the number of licenses to be auctioned would result in a similar allocation of licenses but the innovator would obtain somewhat less licensing revenue. In the auction of m licenses with complete information the m licensees would simply bid slightly more than the value to the m+1th potential licensee. With the price setting mechanism the licensor sets the price to slightly less than the value to the mth potential licensee.

18
Kamien (1992). Under this market mechanism the innovator utilizes the maximum bargaining
power at his disposal but loses the ability to discriminate between buyers. McAfee (1999)
examines auctions of capacity and his model shares a feature with ours – the identity of the
winner of the auction matters to the losers and smaller firms would be willing to pay more for the
capacity. Our analysis examines sales with an additional feature – the identity of the winner(s)
matter to the seller as well.
All those who accept the offer for a license enjoy a marginal cost reduction to c. The maximum
price a licensee would be willing to pay would then be the equilibrium profits it would obtain
with this new low marginal cost (πl
j) less its equilibrium profits without the license (π
j). This
difference in the equilibrium profits with and without a license determines the demand curve for
licenses. Those firms with a value greater than the stated fee would accept the offer. The
number of licenses sold, and the specific buyers of the technology, would then be determined by
the intersection of the fee with the demand curve. This presents a potential problem to the
licensor as he has limited control over who would accept and thereby obtain his technology. The
licensor experiences a cost of licensing in that he loses some profits in the product market by
making a rival more efficient (πi- πl
i). These costs would be different for different licensees
while the revenue would be the same (qrr).
Given a royalty rate r an existing rival j would purchase a license if cj > c + r or if εj >r. We
then have a precise ordering of the licensees willing to pay the royalty. In this case, the
innovator simultaneously sets the royalty rate and number of licenses granted in order to
maximize licensing revenues less the costs defined in (3), i.e.,
( ) ( )( )
( ) ( )( )
++
+
−
+−
+−−+⋅
+⋅
=−=−⋅⋅=
∑∑∑∑−−=
−−
=−−=
−−
=
mrmrn
rmnn
rm
mmqrmTNSrm
MAX
n
mnll
mn
kk
n
mnll
mn
kk
lirr
1
1
212
1
2
121
1111
0,
εεεε
ππ

19
where, qr is the equilibrium quantity produced under license by a firm, and m is the number of
licenses granted. Clearly, the maximum royalty rate which would yield the sale of m licenses
would be where r = εn-m and the royalty rate for selling m +1 licenses would then be εn-m-1. In this
situation the innovator would always sell at least one license as the first license would not
involve any lost product market profits.
Lemma 1: Under posted pricing of licenses the diffusion of licenses will be greater if the rivals
consist of a cluster of inefficient firms where the efficiency differential between rival licensees
εn- m -1 - εn- m is small.
Proof:
The total net surplus maximizing licensing royalty is determined by the point where the
difference function TNS(r=εn-m-1) – TNS(r=εn-m) ≤ 0. Given the sequence of licensees (from
smallest to largest) the TNS maximizing number of licensees is given by m that sastisfies,
( ) ( ) ( )( )
( ) ( )3.011
111
1
1
21
1
1
21
21
Cmn
mnm
mn
mn
kkmn
mnmn
mn
kknmnmn
≤
+−−++
−+−−
++−
−−
−−
=−−
−−−
−−
=+−−−
∑
∑
εεε
εεεεε
By the condition for positive Cournot quantities and by the ranking of the ε’s, the first term
above is always negative while the second term is positive. Inefficient rivals ensures that εn-m-1
and the positive portion of (C3) is large while the clustering of rival firms with similar marginal
costs ensures that the negative portion of (C3) is small. Consequently, the condition to stop
licensing is then not met.
Q.E.D.
The first term in (C3) represents the licensing revenues lost from the nonmarginal licensees from
decreasing the posted price. The second term in (C3) is the licensing revenues gained from the

20
additional licensee. As the above condition is governed by the ε’s and n, the royalty rate and the
diffusion of licenses depends on the size-distribution of rival firms. In the extreme case of
symmetric rivals then εn- m -1 - εn- m = 0 and all rivals would be licensed with the posted price equal
to the ε’s.
For an example where posted pricing leads to limited diffusion, say there were 4 firms with ε2
=0.1, ε3 =0.2, and ε4 =0.3. The condition to stop licensing (C3) becomes negative as m goes from
1 to 2 and TNS(m=1)=0.06 while TNS(m=2)= 0.02. In this example only one license would be
sold at a rate of r=0.3. In this example the licensor’s prelicensing profits are 0.1024 so one
license increases the innovator’s profits by almost 60%! If the efficiency of the second largest
rival were ε3 =0.28, then 2 licenses would be sold at a royalty rate of 0.28, illustrating a greater
diffusion of the innovation under posted prices when rivals are less differentiated. We now
analyze an alternative mode of marketing the innovation – pairwise bargaining with licensees.
3.2 Nash Bargaining
In this section we examine the allocation and proliferation of licenses when the licensor engages
pairwise in a Nash bargaining game with each potential licensee that the licensor may choose to
license. In this arrangement the licensor has the ability to discriminate from amongst those who
obtain a license as he may choose not to bargain with certain rivals. Also, the licensor may
choose a sequence of which potential licensees to negotiate with.6 Bargaining also has the
advantage of allowing some degree of price discrimination. This is often possible as licensing
agreements contain many clauses regarding the responsibilities and rights of both the licensee
and licensor that may differ from one licensor to another. For example, there may be clauses that
allow some licensees to use the technology for uses other than that related to the innovator’s
6 In our model of complete information and surplus to be had with each license (ε’s > 0) then each licensee knows that all other rivals will license the technology. Hence the sequence of pairwise bargaining games is not an issue here.

21
product market. The disadvantage (from the innovator’s perspective) is that presumably the
inventor does not have all the bargaining power and some surplus must be left to the licensees.
With Nash pairwise bargaining we are, in essence, examining the situation of price
discrimination with an equal split of the surplus between buyer and seller. In the previous
section we describe the situation of the seller posting a certain (uniform) price, and we implicitly
assume that the innovator has the bargaining power to make a take it or leave it offer. Here we
examine the situation wherein each party has some bargaining power and hence we use a
bargaining solution in which the firms split the surplus in some proportion.7
We use the Nash Bargaining game to determine the licensing royalty, r, to a licensee j such that
that is, the bargaining solution would maximize the product of the surpluses to the licensor and
the licensee. The expression in the first bracket above is the surplus of the licensor with
licensing revenues of qr where the quantity is that of the licensee when there are mb licenses
granted (the subscript b denoting the bargaining game) less the cost to the licensor of lost product
market profits with a new competitor with marginal costs of cj + r
j as defined in (2). The
expression in the second bracket is the surplus to the licensee of licensing that consists of the
product market profits with mb licensees less the licensing fee less the surplus it would have
without a license.
The Nash Bargaining Solution where both parties have equal bargaining power specifies that the
surpluses from the license would be evenly divided between licensee and licensor. As the
Cournot rents πi can be replaced by q
i
2 this allocation of rents implies,
7 Caves, Crookwell and Killing (1983) found that between a third and a half with an average of 40% of the expected rents went to the licensor. Consequently, it must be that in many cases the licensee has some bargaining power. This could be due to, among other factors, the presence of competing technologies. For example, Micronas obtained several offers to license a semiconductor manufacturing technology (Takalo and Kultti, 2000).
( ) ( ) ( )( )[ ] ( ) ( )[ ],11 −−−−−=Γ bjbljb
libijb
l
jmmmmrmq
rMAX
ππππ

22
( ) ( ) ( ) ( ) ( ) .011 2222 =−+−+−− bjbjbibijbj mqmqmqmqrmq
As there exists surplus to be had in each licensing transaction each licensee can rationally expect
that mb = n -1, i.e., all rivals will end up with a license. In the above expression then q
j(m) is the
equilibrium output of firm j with a license and qi(m
b) is the output of the licensor having licensed
firm j. Similarly, qj(m
b-1)) is the equilibrium output of firm j without a license and q
j(m
b-1) is
the output of the licensor not having licensed firm j. However, each licensee does not know
what royalty rate the other licensees have negotiated. Consequently, the royalty rates would be
determined through the simultaneous solution of a system of equations, each of the form above,
which can be restated as
( ) ( ) ( )4.01121312 22 Cnrrrrn jjjl
ljjl
lj =−−
+−
+++− ∑∑
≠≠
εε
where rj is the royalty rate of firm j and Σ
l≠j r
l is the sum of the royalty rates of the rival licensees.
The above condition is a quadratic expression in rj this leads to the following lemma.
Lemma 2: The royalty rate set by the Nash bargaining game is:
( ) ( )
( ) .122
1121241913 2
2
−
−+
+−−
+−
+
=∑∑∑≠≠≠
n
nrnrr
rjj
jll
jll
jll
j
εε
Proof: See Appendix I.
The above royalty rate is clearly influenced by the firm-efficiency (size) distribution through the
royalty rates negotiated by all other firms (Σl≠j
rl) which depend on their respective efficiencies.
Depending on that distribution of firms the royalty rate under posted pricing (εn- m) may be higher
but it could also exclude potential licensees and the licensing revenues they would bring.

23
Furthermore, posted pricing can leave more surplus to the licensees when there is a small group
of firm which are very inefficient. Comparing the results under the bargaining game with those
of posted prices we have
Proposition 3: Pairwise bargaining results in a diffusion of licenses at least as great as posted
prices and a greater diffusion when the size distribution of firms is sufficiently skewed towards a
large proportion of efficient (large) firms. Setting the royalty rate under Nash bargaining as
opposed to posted royalty, the price in the product market (P*) is lower and consumer welfare is
enhanced if and only if .22
mn
mn
jj
n
jj mr −
−
==
+< ∑∑ εε
Proof:
The proof of the first part of the proposition regarding the extent of diffusion is straightforward
as all rival firms license the technology under pairwise bargaining while under posted prices the
diffusion is restricted according to Lemma 1.
For the consumer welfare result we obtain the price in the product market after licensing with
bargaining from (2) as
( )( )1
112
+
+−+
=∑=
n
rcnP
n
jj
b
whereas the price after licensing via posted pricing is
( )( ).1
112
+
++−+
=−
−
=∑
n
mcnP
mn
mn
jj
pp
εε
Comparing the above two price equations, we obtain the condition in the Proposition.
Q.E.D.

24
The Proposition gives the condition under which licensing via one or another pricing mechanism
would yield more benefits to the consumer. Essentially which pricing mechanism is preferred
depends on the relative efficiencies of the set of firms and the firm-size distribution. If the
diffusion of licenses were equally broad under posted royalties then the rate would be ε2, the
royalty rate would be lower and the product market price also lower than with licensing via
bargaining. With the introduction of significant firm size asymmetries licensing becomes
restricted under the posted royalty regime. When the firm-size distribution is skewed towards a
large proportion of efficient firms then licensing with set rates is restricted to the smaller firms
and the royalty rate (εn-m) would then be set at a high level. With sufficient skewness towards
efficient firms in this firm-size distribution the average royalty rate under bargaining is lower
than that of royalty setting. The average royalty rate then determines the price of the ultimate
output given in (1) - when it is lower, then the product market price is lower and consumer
surplus is greater.
Using the same example as before where there were 4 firms with ε2 =0.1, ε3 =0.2, and ε4 =0.3
there are 8 solutions to the above nonlinear system of equations (solved numerically using
Newton’s method). Only one of those solutions which satisfies the logical constraint that εj ≥ rj
≥0, that solution being r2 = 0.067, r3 = 0.136, and r4 = 0.214. This yields a TNS to the licensor of
0.028 which is less than the TNS of 0.06 from the sale of one license under posted pricing. Thus
under this size distribution of firms the innovator would prefer to adopt posted pricing. If
however, the rival firms were relatively large, say ε2=0.01, ε3 =0.02, and ε4 =0.03, then the
solution to the royalty problem is r2 = 0.0069, r3=0.0142, and r4 = 0.0220. In this case the
innovator prefers bargaining as the bargaining solution yields a TNS of 0.0069 while the
maximum TNS under the posted price regime would be 0.0055 (again with one license).
Consumers also prefer the bargaining regime as the industry output is 0.7915 as opposed to
0.788 under the posted pricing of licenses. Comparing these two numerical examples illustrates
how the size distribution of firms interacts with the mode of marketing an innovation and that
exercising price discrimination can facilitate the diffusion of a technology.

25
4. Differentiated Bertrand Product Markets In this section we discuss to what extent our results are robust to the particular form of product
market competition. Clearly, firms could not exist with asymmetric marginal costs in
homogeneous Bertrand product markets so we examine markets of differentiated products. In
the case where the location of firms is fixed, the incentives to proliferate licenses increase but the
preferred licensees may change. This is due to the costs in lost product market profits to the
innovator would depend on the location of the licensee. Firms farther away from the innovator
would have less of an impact on the product market profits of the innovator. Again, firms with
higher marginal costs would be willing to pay more as their surplus from decreasing their
marginal costs would be greater. Consequently, the preferred licensees would be those with
higher marginal costs and located furthest from the innovator. But as only firms adjacent to the
innovator have direct effects on the product market profits of the innovator the costs of licensing
would be diminished compared to that of the previous analysis. Thus, the incentives to
proliferate the license would be greater with differentiated Bertrand and fixed locations.
If locations were variable then we must first address the issue of where firms locate when there
are asymmetric marginal costs. Does a firm locate closer to, or farther from a more efficient
rival? To answer this question, consider the simple case of the Hotelling model where
consumers are uniformly distributed on a unit line and have quadratic transportation cost. As
shown in Appendix II, the more efficient firm has an incentive to move closer to its less efficient
rival, while the less efficient firm wants to maximally differentiate itself from more efficient
firms to avoid price competition. Thus the effect of a proliferation of licenses of the innovation
using fixed fees will be that rival firms will become equally efficient and the former equilibrium
(if it existed) of symmetric locations will be restored. In this case, there will be a cost of
licensing to the innovator in terms of a smaller market area. However, this will again be
primarily due to the licensing of adjacent rivals and so the costs of licenses to rivals located
farther from the innovator will be by and large second order effects. Furthermore, as in the
Cournot analysis, licensing with royalties could mitigate these costs of licensing. Licensing
with fixed fees to a small set of licensees far away from the licensor can allow the licensor to
capture some of the business “stealing” effects from nonlicensing rivals. The basic feature, that

26
both the seller and the other buyers are concerned with the identity of the buyer(s), is revealed in
this analysis as well. Therefore, our result on a diffusion of licenses is robust to the type of
product market competition.
5. Conclusions and Discussion
The selling of a good or service where the identity of the buyer(s) is of interest to both the seller
and the other buyer(s) is studied. We have developed and analyzed a model of marketing a
license of a cost reducing technology to rival firms where those firms are asymmetric in marginal
costs. We examine which firms are sold licenses under different market mechanisms and using
different pricing structures. The market mechanisms examined are: posted pricing, where a price
is publicly announced and potential licensees accept or reject the offer, and Nash bargaining
where the innovator sets the price through a pairwise negotiation with each licensee. The price
structures studied are fixed fees and royalties per unit output. We find that the innovator would
prefer to: (i) use fixed fees for a certain set of licensees, (ii) when exclusively licensing with
fixed fees the optimal licensee is weaker than the optimal licensee under royalties, and (iii)
market its innovation via pairwise bargaining. We find that consumers would also prefer a
bargaining mechanism when the firm-size distribution is sufficiently skewed towards a large
proportion of large firms.
We also discuss how robust the results are to an alternative product market competition mode –
that of asymmetric differentiated Bertrand. This alternative mode of competition retains the
feature that both the seller and the buyers regard the identity of the buyer(s) as important. There
is still an aversion to making rivals more efficient. In this case, however, more efficient rivals
would be licensed if they are located far from the innovator. The result of the proliferation of
licenses still holds. Royalties would be more favored over fixed fees in order to keep rivals at a
distance. Fixed fees, however, would allow the licensor to capture business ”stealing” effects
from nonlicensing rivals. As differentiated Bertrand adds a new dimension along which firms
can be distinguished, the ability of the licensor to discriminate between licensees becomes all the
more important. This would then lead to the use of pairwise bargaining.

27
These results have implications for antitrust and technology policy. For example, courts in some
antitrust cases and the legislatures of certain countries have mandated licensing at a certain
royalty rate. In effect, they have required that the technology be marketed under the posted price
regime. This study suggests there are circumstances (firm-size distributions) where such
mandates would lead to unsatisfactory results and that allowing the innovator to price
discriminate while requiring the nonexclusive licensing can yield superior outcomes for
technology diffusion and for consumers.
References
Arrow, K., 1962, ”Economic Welfare and the Allocation of Resources for Invention”, in The Rate and Direction of Inventive Activity: Economic and Social Factors, Conference No. 13, Universities- National Bureau of Economic Research, Princeton University Press, Princeton, NJ. Baumol, W., 2002, The Free-Market Innovation Machine – Analyzing the growth miracle of capitalism, Princeton University Press, Princeton, NJ, U.S.A. Caves, R., H. Crookwell, and J. Killing, 1983, ”The Imperfect Market for Licensing” Oxford Bulletin of Economics and Statistics, Vol. 45, August, pp. 249-267. D’Aspremont, C., J.J. Gabsewicz, and J.-F-. Thisse, 1979, ”On Hotelling’s `Stability in Competition’ ”, Econometrica, Vol. 47, No. 5, pp. 1145-1150. Gallini, N., 1984, ”Deterrence by Market Sharing: A Strategic Incentive for Licensing”, American Economic Review, Vol. 74, December, pp. 931-941. Gallini, N., and R. Winter, 1985, ”Licensing in the theory of innovation”, RAND Journal of Economics, Vol. 16, No. 2, Summer, pp. 237-252. Gallini, N., and B. Wright, 1990, ”Technology transfer under asymmetric information”, RAND Journal of Economics, Vol. 21, No. 1, Spring, pp. 147-160. Kamien, M., 1992, ”Patent Licensing”, Chapter 11, Handbook of Game Theory with Economic Applications, (R. Aumann and S. Hart, eds.), Elsevier Science Publishers, Amsterdam, NL. Kamien, M., and N. Schwartz, 1982, Market Structure and Innovation, Cambridge University Press, Cambridge, England.

28
Kamien, M., and Y. Tauman, 1986, ”Fees versus Royalties and the Private Value of a Patent”, The Quarterly Journal of Economics, CI, No. 406, (August), pp. 471-491. Kamien, M., and Y. Tauman, 2001, ”Patent Licensing: The Inside Story”, MEDS Working Paper, Kellogg Graduate School of Management, Northwestern University. Katz, M. and C. Shapiro, 1985, ”On the Licensing of Innovations”, RAND Journal of Economics, Vol. 16, pp. 504-520. Katz, M. and C. Shapiro, 1986, ”How to License Intangible Property”, The Quarterly Journal of Economics, CI, No. 406, (August), pp. 567-589. McAfee, R.P., 1999, ”Four Issues in Auctions and Market Design”, forthcoming: Revista Analisis Economico, Department of Economics Working Paper, University of Texas, Austin. Reinganum, J., 1983, ”Technology Adoption under Imperfect Information” Bell Journal of Economics and Management Science, Vol. 14, No. 1, Spring, pp. 57-69. Rivette, K, and D. Klein, 2000, ”Discovering New Value in Intellectual Property”, Harvard Business Review, January-February, pp. 2-12. Rockett, K., 1990, ”Choosing the competition and patent licensing”, RAND Journal of Economics, Vol. 21, No.1, Spring, pp. 161- 171. Rostoker, M., 1984, ”A survey of corporate licensing”, IDEA, 24, pp. 59-92. Salant, S., and G. Shaffer, 1999, ”Unequal Treatment of Identical Agents in Cournot Equilibrium”, American Economic Review, 89, pp. 585-604. Spiegel, Y., 2003, ” ”, working paper, Department of Economics, Tel Aviv University. Sutton, J., 1997, ”Gibrat’s Legacy”, Journal of Economic Literature, 35, pp. 40-59. Sutton, J., 1998, Technology and Market Structure, M.I.T. Press, Cambridge, MA. Takalo, T., and K. Kultti, 2000, ”Incomplete Contracting in a Research Joint Venture: The Micronas Case”, Research Policy, Vol. 30, No. 1, pp.67-77. Thurow, L, 1997, ”Needed: A New System of Intellectual Property Rights”, Harvard Business Review, September-October, pp. 95-103. Tombak, M., 2002, ”Mergers to Monopoly”, Journal of Economics and Management Strategy, Vol. 11, No. 3, pp. 513-546. United States Department of Commerce, Survey of Current Business,Government Printing Office, Washington, D.C., October, 1998.

29
Wang, X.H.,1998, ”Fees versus royalty licensing in a Cournot duopoly”, Economics Letters, 60, pp. 55-62. Appendix I Proof of Lemma 2. Given the royalty rates of all other firms, (C4) is a concave quadratic equation in the variable r
j
which has two solutions
( ) ( )
( )122
1121241913 2
2
−
−+
+−−
+±
+
=∑∑∑≠≠≠
n
nrnrr
rjj
jll
jll
jll
j
εε
with the added constraint that ( ) ( )
−+
+−≥
+ ∑∑
≠≠
2
2
11212419 jjjl
ljl
l nrnr εε for those
solutions to be real. Uniqueness is obtained through use of the comparative statics with respect to ε
j. As ε
j increases, the benefits of licensing increase to the licensee and the cost to the licensor
of lost product market profits become greater. Consequently to balance the surpluses the Nash bargaining solution must involve a higher r
j when ε
j increases. As the derivative of C4 with
respect to εj is
( ) .12124j
jll
j
nrC εε
−−
+−=
∂∂ ∑
≠
This derivative is always negative which means that the concave function C4 shifts down and the lower root shifts to higher r
j while the higher root shifts to lower r
j. This implies that the only
solution for the rj in the equation above that satisfies the logical comparative statics for ε
j is that
which subtracts the second part of the numerator of the expression to the first part, i.e., the solution for r
j given in the lemma.
Q.E.D.
Appendix II– Differentiated Bertrand Competition with Asymmetric Costs

30
In this section we compute the equilibrium locations in a Hotelling model where the two firms have differing marginal costs. Assume a unit line with consumers uniformly distributed on the line and consumers face quadratic transportation costs (tx2 for a consumer located at x going to firm located at 0). Firms first choose locations on the line and then engage in price competition. Assume that firm 1 with marginal costs c
1 locates at point a and firm 2 with marginal costs c
2
locates at point 1-b where c1 < c
2. The demands for firms 1 and 2 are as D’Aspremont,
Gabszewicz and Thisse (1979) show
( ) ( ) ( ) ( ) .1221,
1221, 21
21212
211 batppbabppDand
batppbaappD
−−−
+−−
+=−−
−+
−−+=
With profit functions π
1(p
1,p
2)=(p
1–c
1)D
1(p
1,p
2) and π
2(p
1,p
2)=(p
2–c
2)D
2(p
1,p
2) the Nash
Equilibrium prices are
( )( ) ( )( ).1111 32*231
*1
abba batcpandbatcp −− +−−+=+−−+= Due to the envelope theorem
( ) ( ) .*1
1
222
*2
2*2
2
111
*1
1
∂∂
+∂∂
−=
∂∂
+∂∂
−=dbdp
pD
bD
cpdb
dand
dadp
pD
aD
cpda
d ππ
For positive markups and c
1 < c
2 it is easily shown that dπ
2 /db < 0 whereas dπ
1 /da < 0 only
when the degree of cost asymmetry is sufficiently low. Consequently, the Principle of Maximal Differentiation of D’Aspremont, Gabsewicz and Thisse holds only for low marginal cost differences, otherwise the low cost firm has an incentive to move closer to it less efficient rival.