marketing alternatives
TRANSCRIPT

FEEDER CATTLE MARKETING ALTERNATIVES
James Mintert, Ph.D.Professor
Dept. of Agricultural EconomicsKansas State University

For Updated Livestock Marketing Information Visit The
K-State Livestock & Meat Marketing Web Site
www.agecon.ksu.edu/livestock
SellingQuality or grade that’s easiest to produce
Most convenient time
Most convenient place
Whatever price offered

Marketing
Identifying Quality or Grade with most profit potential
Most profitable time
Most profitable place
As a result, retain some control over price and profitability

Cattle Production Alternatives
•Background Own Calves Then Market
•Retain Ownership Of Calves For Finishing At Home
•Retain Ownership And Send To A Custom Feedlot
•Purchase Calves To Background Then Market
•Finish Backgrounded Calves At Home
•Finish Backgrounded Calves In A Custom Feedlot

Feeder Cattle Marketing Alternatives
•Market At Home Via Private Treaty
•Market At Local Auction
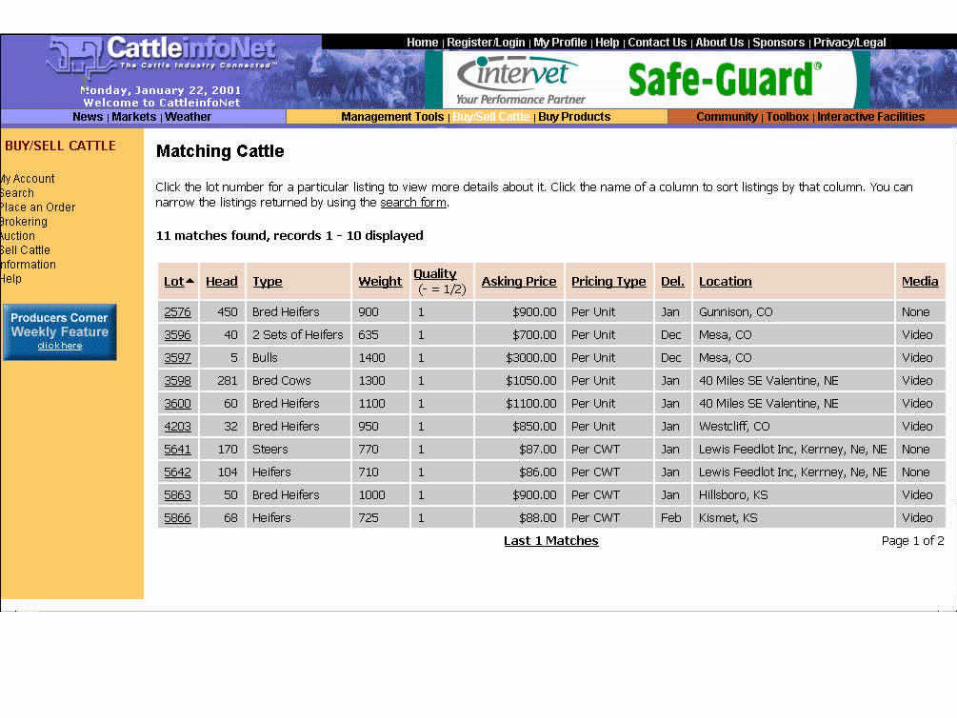
•Market Through Video Sale
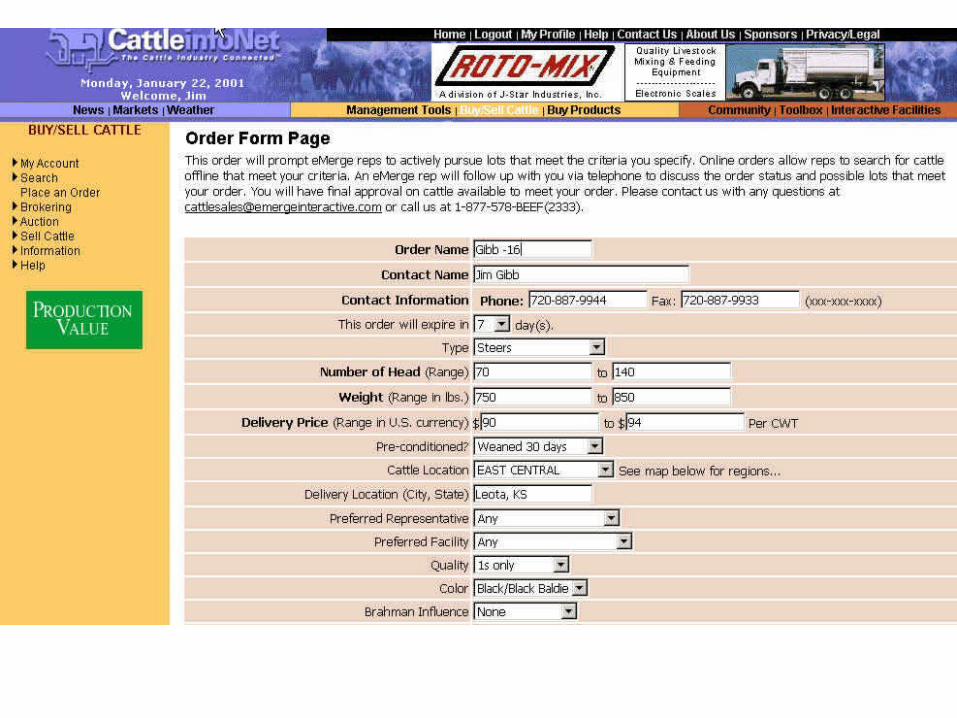
•Market Via Internet
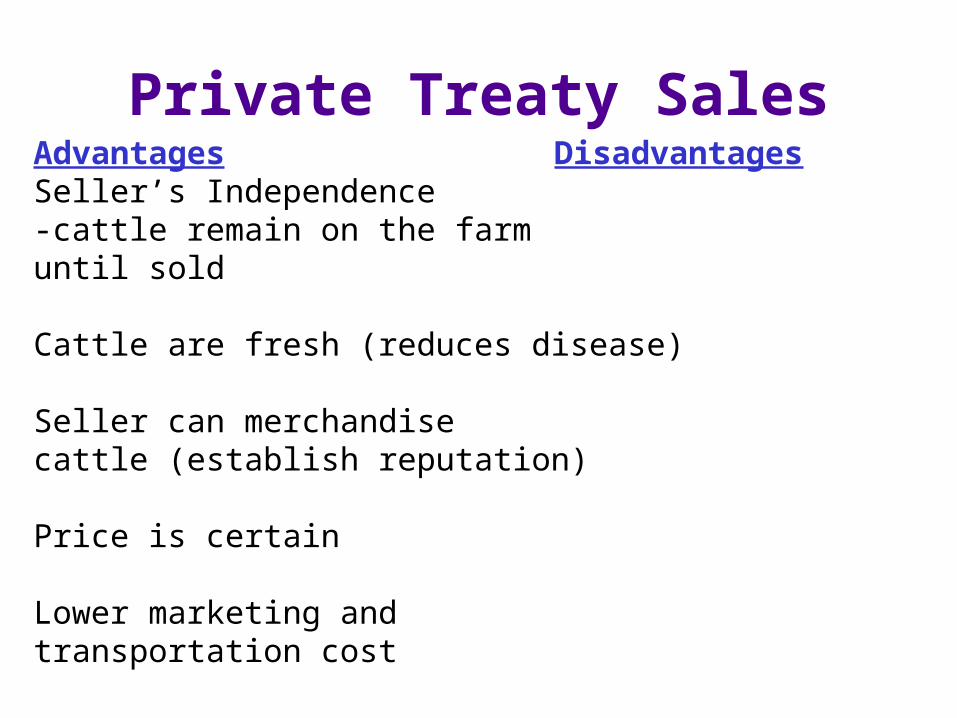
Private Treaty SalesAdvantages DisadvantagesSeller’s Independence -cattle remain on the farmuntil sold
Cattle are fresh (reduces disease)
Seller can merchandisecattle (establish reputation)
Price is certain
Lower marketing and transportation cost

Private Treaty SalesAdvantages DisadvantagesSeller’s Independence Seller totally responsible for-cattle remain on the farm success of saleuntil sold
Cattle are fresh (reduces disease) Seller must stay abreast of market
Seller can merchandisecattle (establish reputation) Seller assumes more risk
Price is certain $ Collection may be a problem
Lower marketing and Potential lack of competition
transportation cost
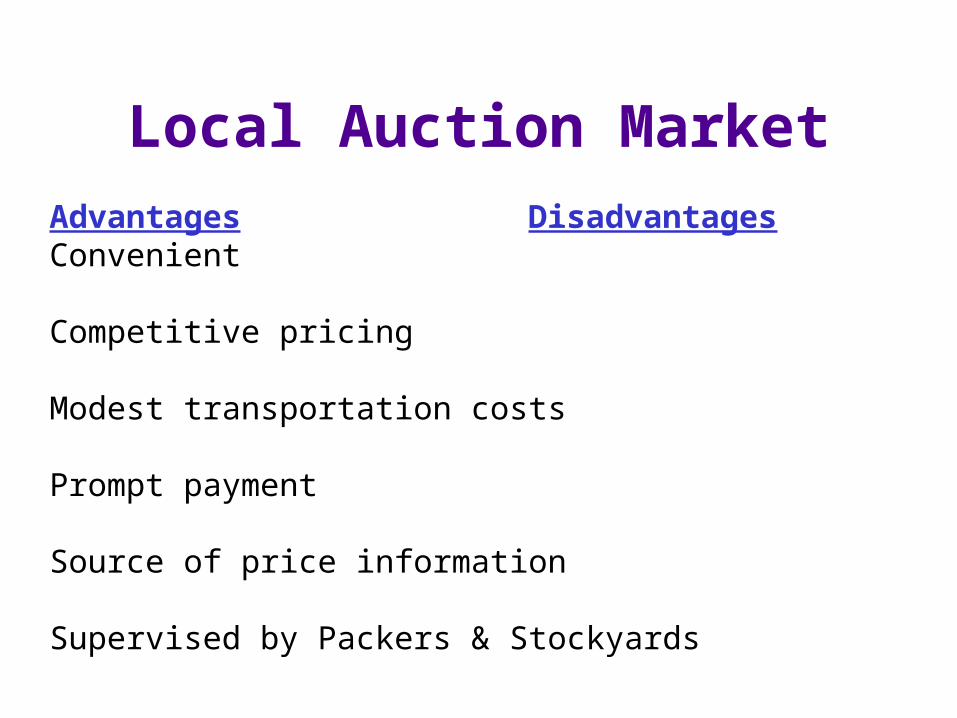
Local Auction MarketAdvantages DisadvantagesConvenient
Competitive pricing
Modest transportation costs
Prompt payment
Source of price information
Supervised by Packers & Stockyards

Local Auction MarketAdvantages DisadvantagesConvenient Seller has little effect on price
Competitive pricing Competition varies among sales
Modest transportation costs As a collection point - may spread disease
Prompt payment
Source of price information
Supervised by Packers & Stockyards

Video Auction SaleAdvantages DisadvantagesProducer sets sale conditions
Competitive pricing
Large number of buyers
Cattle remain on farm until sold

Video Auction SaleAdvantages DisadvantagesProducer sets sale Best suited for uniform loadsconditions 48,000-50,000 lbs.
Competitive pricing Must find market outlet for odd lots
Large number of buyers
Cattle remain on farm until Auctions held less frequently sold
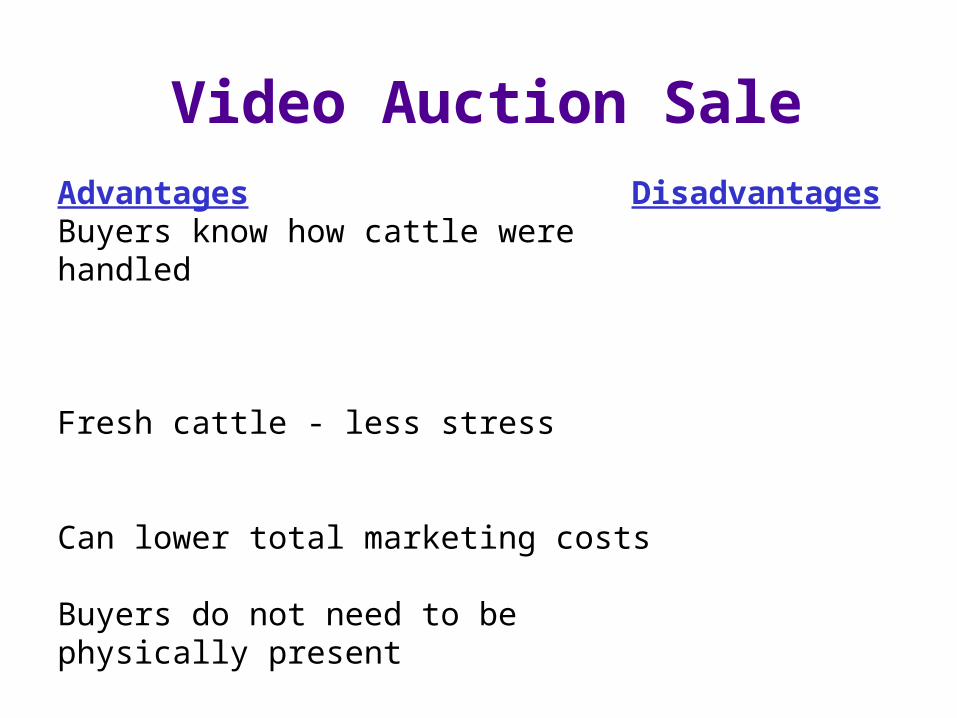
Video Auction SaleAdvantages DisadvantagesBuyers know how cattle werehandled
Fresh cattle - less stress
Can lower total marketing costs
Buyers do not need to be physically present

Video Auction SaleAdvantages DisadvantagesBuyers know how cattle were Requires consignment - have handled to commit cattle well in
advance of sale date-reduces flexibility
Fresh cattle - less stress Hard for buyers to estimateweight
Can lower total marketing costs Difficult for buyers toestimate flesh or condition
Buyers do not need to be physically present

Internet Auction SaleAdvantages Disadvantages
Essentially same advantages and disadvantages as Video Auction

Internet Brokerage SaleAdvantages DisadvantagesIndependence of seller cattle remain on the farmuntil sold
Cattle are fresh (reduces disease)
Seller can merchandisecattle (establish reputation)
Price is certain
Lower total marketing and transportation costs

Internet Brokerage SaleAdvantages DisadvantagesIndependence of seller Seller dependent on successcattle remain on the farm of auction web site in reaching until sold buyers
Cattle are fresh (reduces disease) Seller must stay abreast of market
Seller can merchandisecattle (establish reputation) Seller assumes more risk
Price is certain Potential lack of competition
Lower total marketing and transportation costs


Cattle Inventory Declined Again In 2000U.S. Cattle InventoryJanuary 1, 1925-2001
50
60
70
80
90
100
110
120
130
140
25 30 35 40 45 50 55 60 65 70 75 80 85 90 95 00Year
Mill
ion
Hea
d
January 1, 2001 = 97.3 Million Head .
0.9% Less Than . on Jan. 1, 2000 .
Source: USDA
Current inventory is about 27% smaller than in 1975

K-State Research & Extension
Average Cycle Length Is About 10 Years
Cattle Inventories By Cycle .
75
85
95
105
115
125
135
1 2 3 4 5 6 7 8 9 10 11 12 13
Year of Cycle .
Cat
tle In
vent
ory
(Mill
ion
Hea
d)
1949-1958
1958-1967
1967-19791979-1990
1/1/01
Source: USDA & KSU

Plotting Inflation Adjusted Price vs. Per Capita Consumption Provides A Picture of Beef Demand
Beef Price Quantity RelationshipsAnnual, 1980-2000.
80
81
82
83
8485
86878800
89
275
300
325
350
375
400
425
450
64 65 66 67 68 69 70 71 72 73 74 75 76 77 78 79 80Per Capita Consumption - Retail Weight .
Def
late
d B
eef P
rice
- C
ents
per
Lb
Source: USDA & Commerce Dept. Price Deflated by GDP Implicit Price Deflator 1999=100
94 95
9390
92
91
9699
9897
Declining Demand Has Plagued The Beef Industry For 20 Years
Beef Demand Declined Precipitously During The 1980’s

Beef Price Quantity RelationshipsAnnual, 1980-2000.
80
81
82
83
8485
86878800
89
275
300
325
350
375
400
425
450
64 65 66 67 68 69 70 71 72 73 74 75 76 77 78 79 80Per Capita Consumption - Retail Weight .
Def
late
d B
eef P
rice
- C
ents
per
Lb
Source: USDA & Commerce Dept. Price Deflated by GDP Implicit Price Deflator 1999=100
94 95
9390
92
91
9699
9897
Declining Demand Has Plagued The Beef Industry For 20 Years
Demand Continued To Decline During the 1990’s

Beef Price Quantity RelationshipsAnnual, 1980-2000.
80
81
82
83
8485
86878800
89
275
300
325
350
375
400
425
450
64 65 66 67 68 69 70 71 72 73 74 75 76 77 78 79 80Per Capita Consumption - Retail Weight .
Def
late
d B
eef P
rice
- C
ents
per
Lb
Source: USDA & Commerce Dept. Price Deflated by GDP Implicit Price Deflator 1999=100
94 95
9390
92
91
9699
9897
But showed signs of improving in 1999 & again in 2000
But Demand Showed Signs of Strengthening In 1999 & Again In 2000
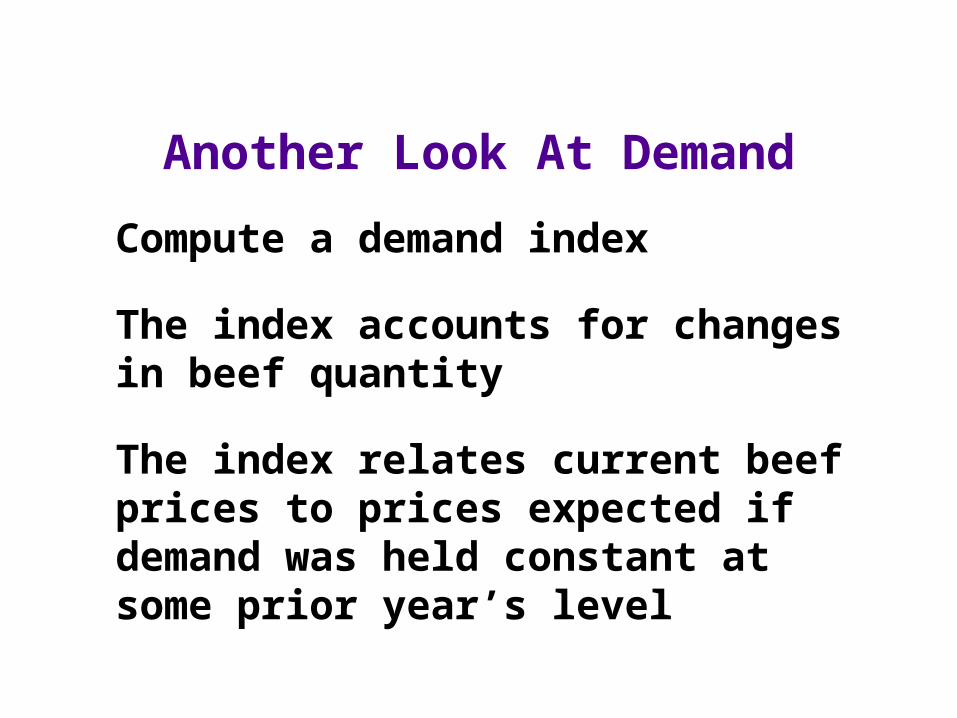
Another Look At Demand
Compute a demand index
The index accounts for changes in beef quantity
The index relates current beef prices to prices expected if demand was held constant at some prior year’s level
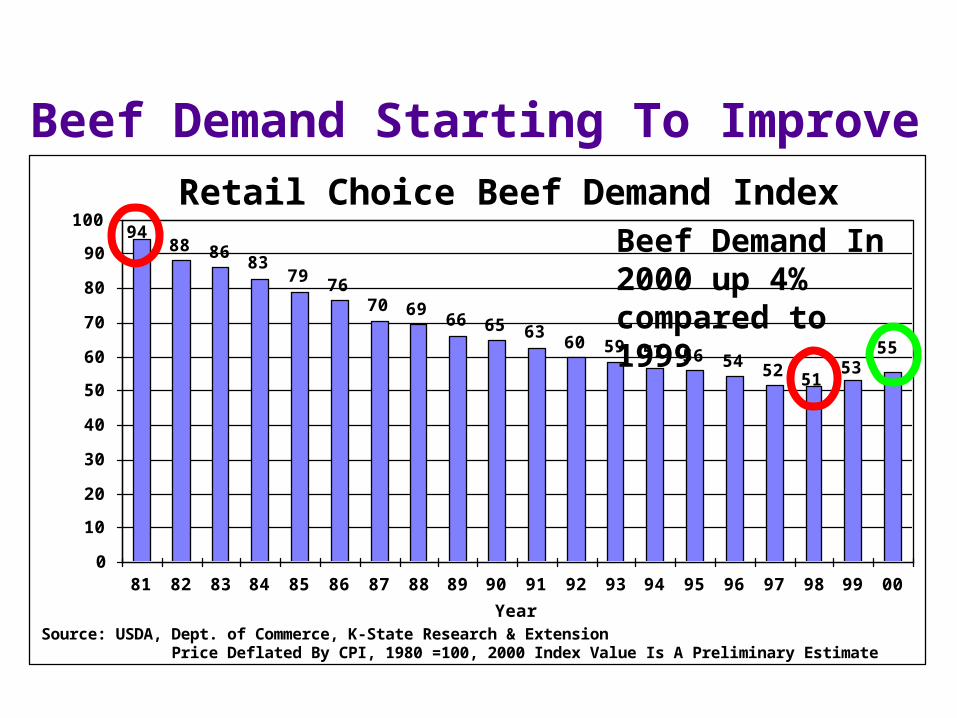
Beef Demand Starting To ImproveRetail Choice Beef Demand Index
88 86 8379 76
70 69 66 65 63 60 59 57 56 54 52 51
94
5553
0
10
20
30
40
50
60
70
80
90
100
81 82 83 84 85 86 87 88 89 90 91 92 93 94 95 96 97 98 99 00Year
Inde
x Va
lue
Source: USDA, Dept. of Commerce, K-State Research & Extension Price Deflated By CPI, 1980 =100, 2000 Index Value Is A Preliminary Estimate
Beef Demand In 2000 up 4% compared to 1999

K-State Tenderness Value Study
Objective: Determine consumer perceptions and willingness to pay for tender beef
¦ In-store experiment conducted at several urban Kansas grocery stores - summer/fall 1998
Two tests, 1) blind taste test
2) tenderness revealed
What is the value of steak tenderness?
K-State Research and Extension
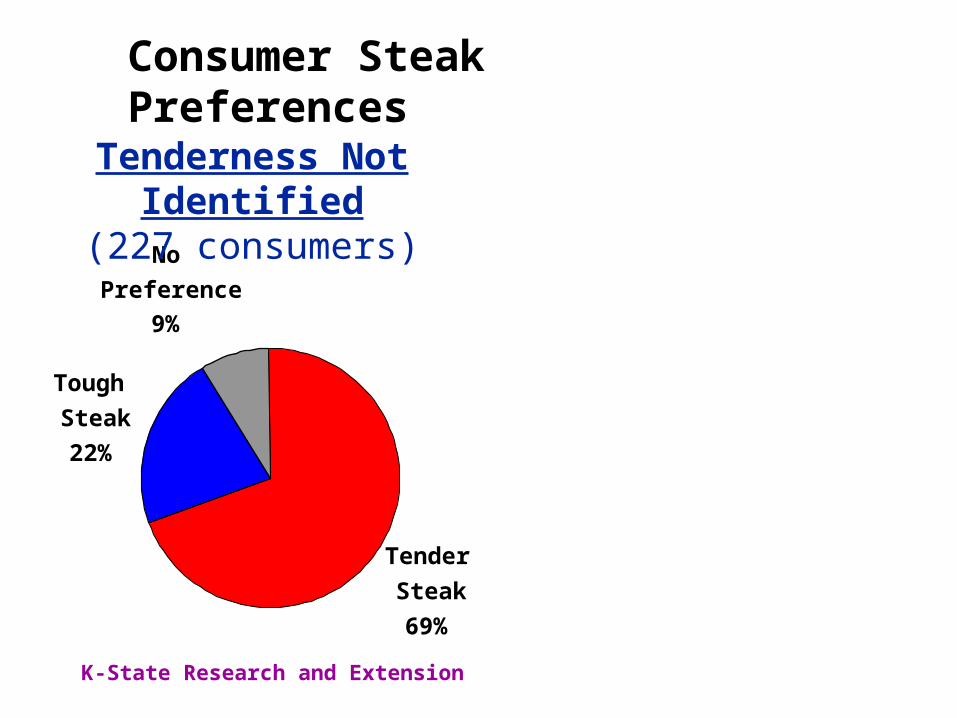
Consumer Steak Preferences
NoPreference
9%
TenderSteak69%
ToughSteak22%
Tenderness Not Identified(227 consumers)

K-State Research and Extension
Consumer Steak Preferences
NoPreference
9%
TenderSteak69%
ToughSteak22%
Tenderness Not Identified(227 consumers)
Tenderness Guaranteed(86 consumers)
TenderSteak84%
ToughSteak
9%
NoPreference
7%

Consumer Willingness to Pay for Tender Relative to Tough Ribeye Steak
(for those 69% preferring tender, 227 total consumers)
3
15
9
20
0 1 1 3 1 1 0 0
46
05
101520253035404550
$0.00 $0.67 $1.33 $2.00 $2.67 $3.33 $4.00Willingness to Pay ($/lb.)
Perc
ent o
f Res
pond
ents Average Willingness to pay
of those willing to pay $1.23/lb.

Consumer Willingness to Pay for Guaranteed Tender Relative to Tough Ribeye Steak
(for those 84% preferring tender, 86 total consumers)
14 6
27
06
0
13
03
04
36
05
101520253035404550
$0.00 $0.67 $1.33 $2.00 $2.67 $3.33 $4.00Willingness to Pay ($/lb.)
Perc
ent o
f Res
pond
ents
Average Willingness to payof those willing to pay $1.84/lb.
Beef Industry Opportunities
Provide consumer’s products they want
Some consumers willing to pay significantly for quality– Need to cater to these consumers
Food safety & health concerns need to be addressed continually

Liquidation Has Been Underway for 5 Years
U.S. Cattle Inventory Growth Rate1925-1999
-8
-6
-4
-2
0
2
4
6
8
25 30 35 40 45 50 55 60 65 70 75 80 85 90 95Year
Perc
ent
Source: USDA & KSU

But A Rebound In Profitability Will Lead To Inventory Increases
Estimated Cow-Calf Returns .
-100
-50
0
50
100
150
200
250
75 77 79 81 83 85 87 89 91 93 95 97 99 Year
$'s
Per C
ow
.
Source: K-State Research & Extension Returns ABove Variable Costs
KSU Projection For 2000
When inventories start to increase, slaughter will decline sharply

Heifer Slaughter Expected To Drop During 2001
Annual F.I. Heifer Slaughter .
6
7
8
9
10
11
12
70 72 74 76 78 80 82 84 86 88 90 92 94 96 98 00
Year
Mill
ion
Head
Source: USDA .
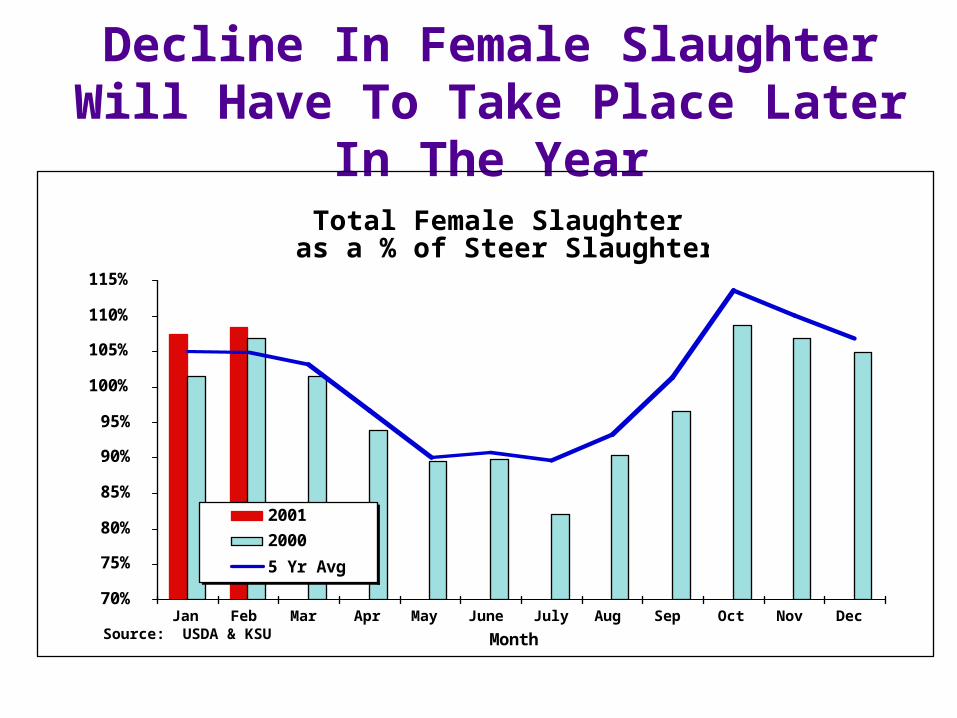
Decline In Female Slaughter Will Have To Take Place Later In The Year
Total Female Slaughter as a % of Steer Slaughter
70%
75%
80%
85%
90%
95%
100%
105%
110%
115%
Jan Feb Mar Apr May June July Aug Sep Oct Nov DecMonth
Fem
ale
Slt.
as %
of S
teer
Slt.
200120005 Yr Avg
Source: USDA & KSU

Total Cattle Slaughter Will Decline in 2001
Annual Commercial Cattle Slaughter .
31323334353637383940414243
70 72 74 76 78 80 82 84 86 88 90 92 94 96 98 00
Mill
ion
Head
.
Source: USDA Year

& Slaughter Cattle Prices Headed Higher The Next Couple Of Years
Annual Average Steer Prices .W. KS 11-13 Cwt. .
35
40
45
50
55
60
65
70
75
80
75 77 79 81 83 85 87 89 91 93 95 97 99 01Year .
Stee
r Pric
e ($
/Cw
t.)
.
Source: USDA
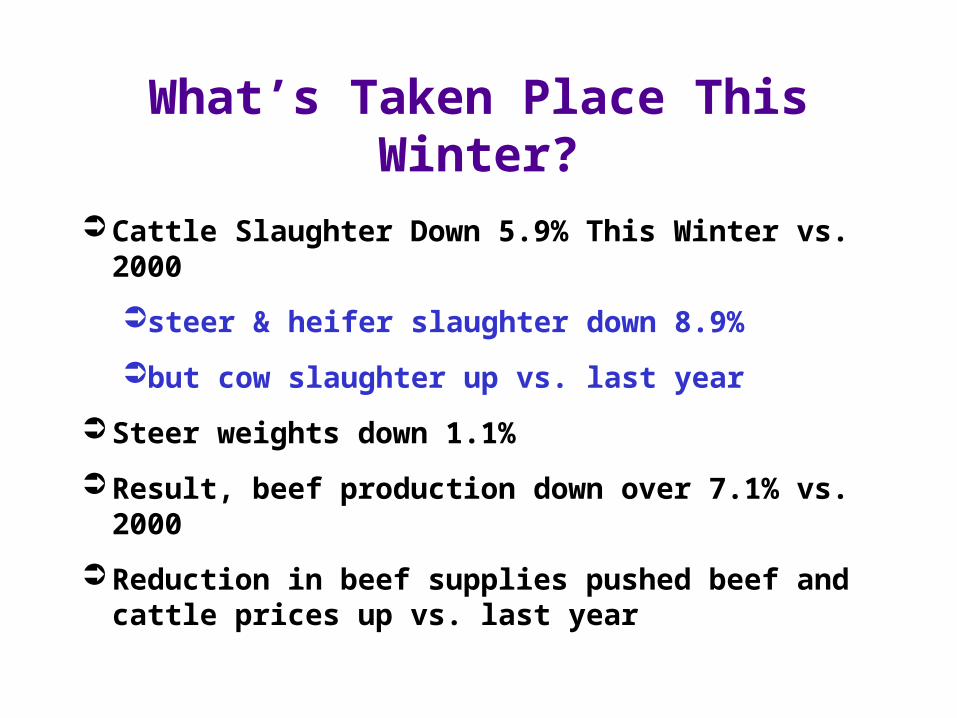
What’s Taken Place This Winter?
Cattle Slaughter Down 5.9% This Winter vs. 2000
steer & heifer slaughter down 8.9%
but cow slaughter up vs. last year
Steer weights down 1.1%
Result, beef production down over 7.1% vs. 2000
Reduction in beef supplies pushed beef and cattle prices up vs. last year

Boxed Beef Values Were Record High, But Prices Have Declined As Slaughter Increased
Weekly Box Beef Cutout ValuesChoice, 550-700 Lb. Carcasses
95
100
105
110
115
120
125
130
135
140
1/06 2/17 3/31 5/12 6/23 8/04 9/15 10/27 12/08
$'s/
cwt.
200020015 Yr Avg
Source: AMS-USDA, Des Moines, IA & KSUWeek Ending
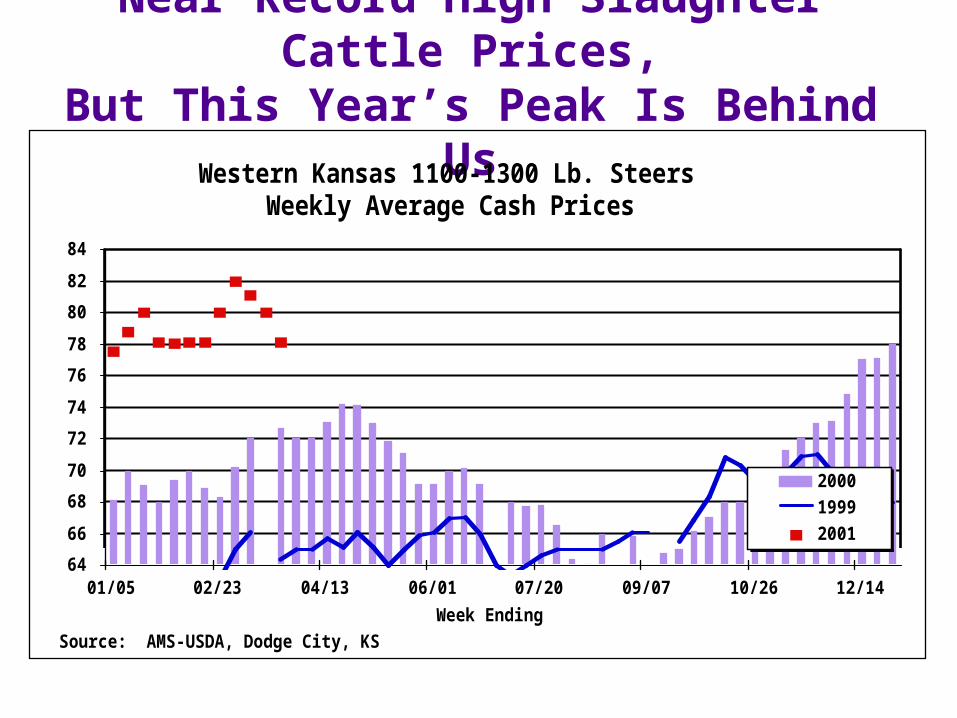
Near Record High Slaughter Cattle Prices,But This Year’s Peak Is Behind Us
Western Kansas 1100-1300 Lb. SteersWeekly Average Cash Prices
6466687072747678808284
01/05 02/23 04/13 06/01 07/20 09/07 10/26 12/14Week Ending
$/cw
t
200019992001
Source: AMS-USDA, Dodge City, KS
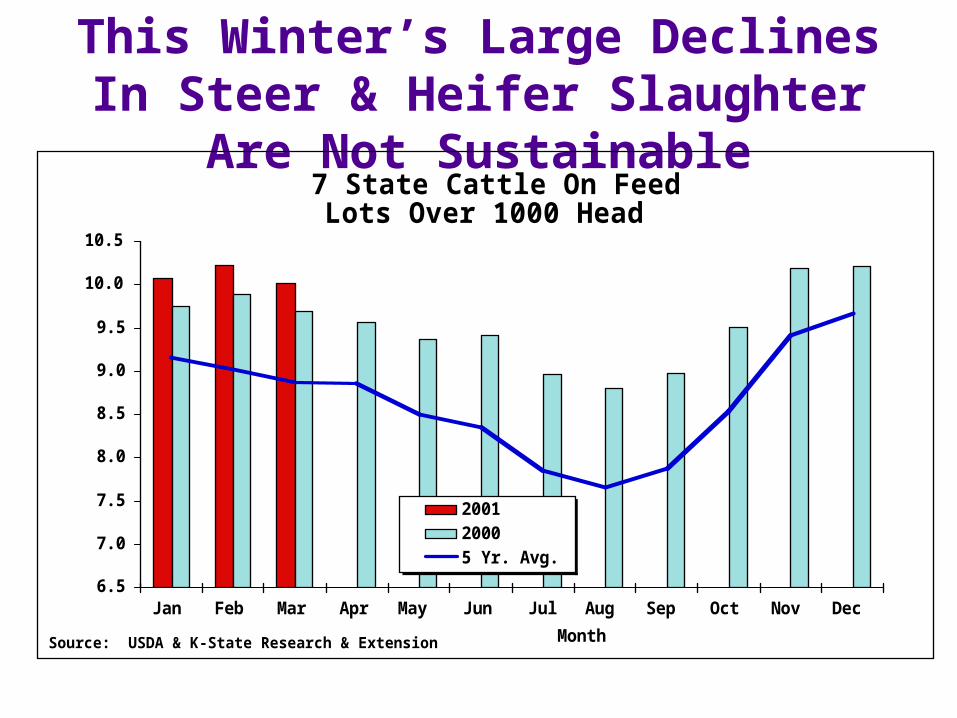
This Winter’s Large Declines In Steer & Heifer Slaughter Are Not Sustainable
7 State Cattle On Feed .Lots Over 1000 Head .
6.5
7.0
7.5
8.0
8.5
9.0
9.5
10.0
10.5
Jan Feb Mar Apr May Jun Jul Aug Sep Oct Nov DecMonth
Mill
ion
Hea
d
200120005 Yr. Avg.
Source: USDA & K-State Research & Extension

Cattle Feeders Need To Play Catch-UpFed Cattle Marketings
% of On Feed Inventory
14%
15%
16%
17%
18%
19%
20%
21%
22%
23%
Jan Feb Mar Apr May Jun Jul Aug Sep Oct Nov DecMonth
% o
f On
Feed
Inve
ntor
y
200120005 Yr. Avg.
Source: USDA & K-State Research & Extension

Futures Suggest April Prices In High $70’sFollowed By A Seasonal Decline Into Summer
Mid-Month Futures Based Price Forecasts W. Kansas 1100-1350 Lb. Choice Steers
68
70
72
74
76
78
80
82
Apr.'01
May'01
Jun.'01
Jul.'01
Aug.'01
Sep'01
Oct.'01
Nov.'01
Dec.'01
Jan.'02
Feb.'02
Mar.'02
Month
$/cw
t.
3 Yr. Avg. BasisMost Neg. BasisMost Pos. Basis
Source: CME & K-StateForecasts = Friday's Futures Settlement Prices + Basis Estimates
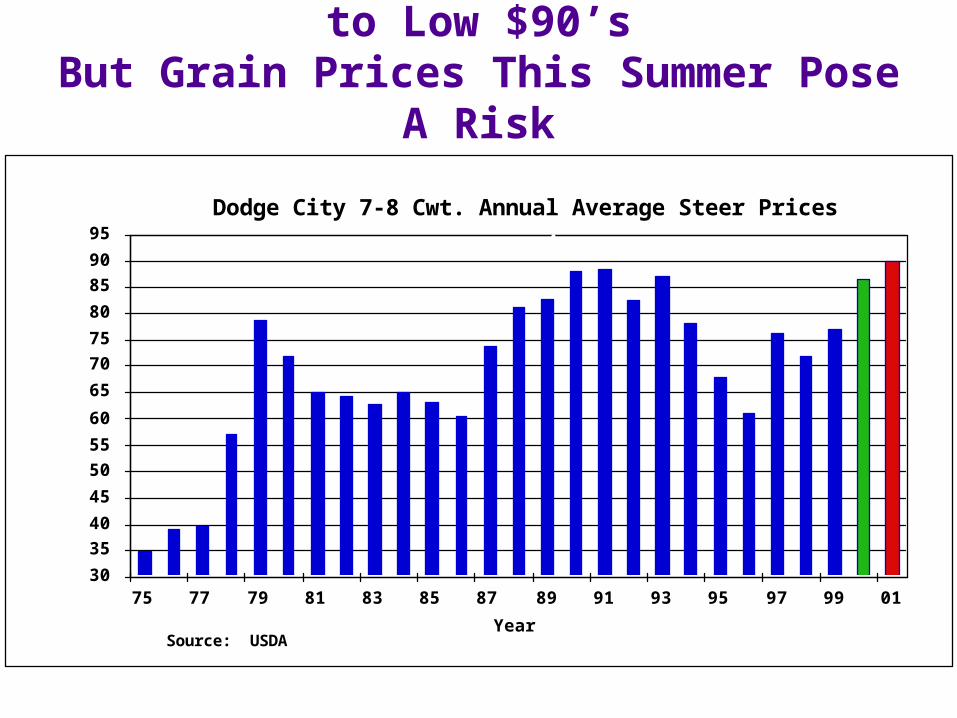
Feeder Cattle Prices In High $80’s to Low $90’sBut Grain Prices This Summer Pose A Risk
Dodge City 7-8 Cwt. Annual Average Steer Prices .
3035404550556065707580859095
75 77 79 81 83 85 87 89 91 93 95 97 99 01Year
Stee
r Pric
e ($
/Cw
t.)
.
Source: USDA

Feeder Futures Suggest A Tight Trading Range In ‘01& Feed Grain Prices Will Be Critical
Mid-Month Futures Based Price Forecasts . 700-800 Lb. Feeder Steers, Dodge City, KS .
828384858687888990919293
April'01
May'01
Jun.'01
Jul.'01
Aug.'01
Sep.'01
Oct.'01
Nov.'01
Dec.'01
Jan.'02
Month & Year .
$/cw
t.
.
3 Yr. Avg. Basis Most Neg. Basis Most Pos. Basis
Source: CME & K-State Forecasts =Friday's Settlement Prices + Basis Estimates

Summary Cow-Calf Producers In Drivers Seat Tougher For Margin Operators
– Cattle Finishers Could Lose $ This Summer
– Grazing Programs Carry Risk
Long-Term Outlook– Cyclical Peak In Cattle Prices Is Still Ahead Of Us
– Major Risk Is Beef Demand
Largest Beef ExportersRanked By Quantity Exported
1 Australia
2 U.S.
3 Brazil
4 European Union
5 Canada
6 New Zealand