market vista: q4 2009 - preview deckeri-2010-8-pd-0394. 4. sourcing leaders are being asked to...
TRANSCRIPT

Global Sourcing (GS)
Market Vista Q4 2009 – Preview Deck
Copyright © 2010, Everest Global, Inc.ERI-2010-8-PD-0394

Copyright © 2009, Everest Global, Inc.ERI-2010-8-PD-0394
2
Contents
Product overview
Illustrative contents

Copyright © 2009, Everest Global, Inc.ERI-2010-8-PD-0394
3
The increasing complexity of the outsourcing market has amplified the risk exposure for companies
Vendor and model proliferation Multiple service providers and business models
Large span of functionsTypically combination of many IT, BPO and some KPO services
Increasing scopeSignificant proportion of operations now in low cost locations
Dynamic economiesMost delivery locations are emerging economies going through rapid change
Global delivery chainServices often delivered from multiple locations with diverse risk footprint
Regulatory riskEnsuring compliance with regulatory guidelines in source and destination countries across suppliers
Performance riskManaging quality of service delivery, attrition, knowledge retention
Business case riskManaging wage inflation without affecting quality of service
Concentration risk
Data security and intellectual property riskImplementing measures to safeguard data and intellectual property
Business continuity risk
Currency risk
….
Factors driving increased risk Examples of risks
Most large companies have capabilities in global risk management. However, the level and type of risk exposure that is emerging from the globalization of services is unprecedented
Copyright © 2009, Everest Global, Inc.ERI-2010-8-PD-0394
4
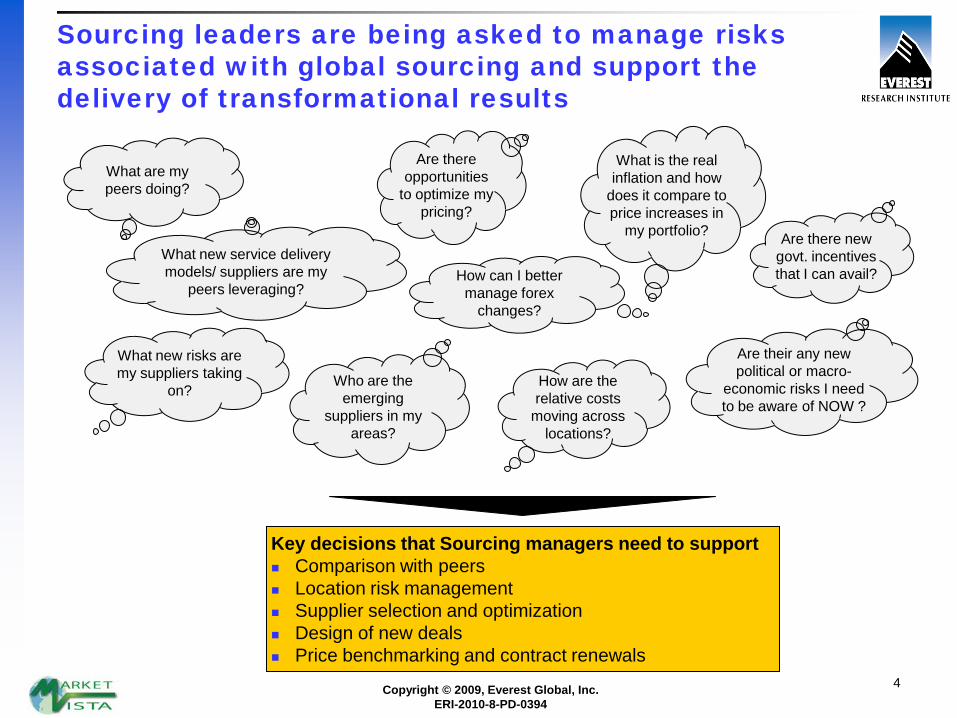
Sourcing leaders are being asked to manage risks associated with global sourcing and support the delivery of transformational results
What are my peers doing?
What is the real inflation and how
does it compare to price increases in
my portfolio?
How can I better manage forex
changes?
Are there opportunities
to optimize my pricing?
What new risks are my suppliers taking
on?Who are the
emerging suppliers in my
areas?
How are the relative costs
moving across locations?
Are there new govt. incentives that I can avail?
What new service delivery models/ suppliers are my
peers leveraging?
Are their any new political or macro-
economic risks I need to be aware of NOW ?
Key decisions that Sourcing managers need to support Comparison with peers Location risk management Supplier selection and optimization Design of new deals Price benchmarking and contract renewals
Copyright © 2009, Everest Global, Inc.ERI-2010-8-PD-0394
5
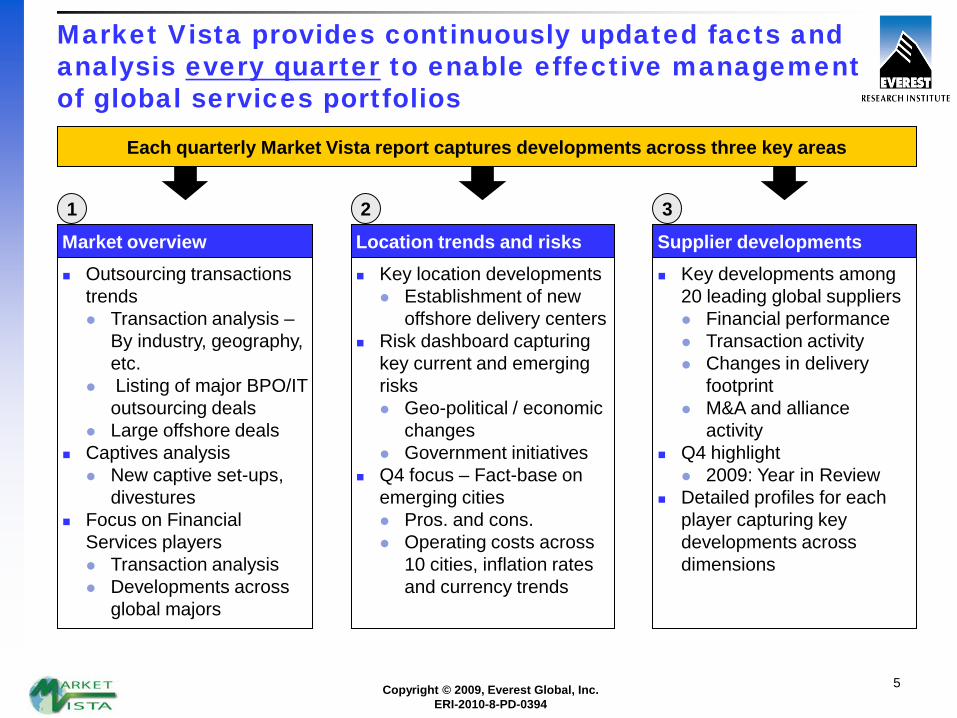
Market Vista provides continuously updated facts and analysis every quarter to enable effective management of global services portfolios
Supplier developments Key developments among
20 leading global suppliers Financial performance Transaction activity Changes in delivery
footprint M&A and alliance
activity Q4 highlight
2009: Year in Review Detailed profiles for each
player capturing key developments across dimensions
3
Location trends and risks Key location developments
Establishment of new offshore delivery centers
Risk dashboard capturing key current and emerging risks Geo-political / economic
changes Government initiatives
Q4 focus – Fact-base on emerging cities Pros. and cons. Operating costs across
10 cities, inflation rates and currency trends
2
Market overview Outsourcing transactions
trends Transaction analysis –
By industry, geography, etc.
Listing of major BPO/IT outsourcing deals
Large offshore deals Captives analysis
New captive set-ups, divestures
Focus on Financial Services players Transaction analysis Developments across
global majors
1
Each quarterly Market Vista report captures developments across three key areas
Copyright © 2009, Everest Global, Inc.ERI-2010-8-PD-0394
6
Contents
Product overview
Illustrative contents

Copyright © 2009, Everest Global, Inc.ERI-2010-8-PD-0394
7
Each section of the quarterly report comprises 30+ pages of insight and dataIllustrative Table of Contents (page 1 of 2)
Section I A: Trend analysis – Outsourcing, offshoring, and captives I-3 Outsourcing transactions analysis I-4 Offshore transaction analysis I-8 Change in outsourcing transactions (Q-o-Q) I-9 Captive developments I-10
Section I B: Focus topics I-14 Financial services outsourcing and offshoring I-15
Section I C: Data snapshots I-20 Examples of large BPO and IT deals signed this quarter I-21 List of new captive announcements made this quarter I-23 List of captives with announcements for expansion I-28 Key developments for global BFSI majors I-30
Section II A: Trend analysis – Risk and opportunity dashboard and analysis II-3 Risk and opportunity dashboard II-4 Risk and opportunity analysis II-5
Section II B: Focus topic – Emerging geographies II-9 Emerging geographies: Overview II-10 Pros and cons II-11 Operating costs II-14 Operating cost inflation II-15 Currency trends II-17
Topic Page no.
Copyright © 2009, Everest Global, Inc.ERI-2010-8-PD-0394
8
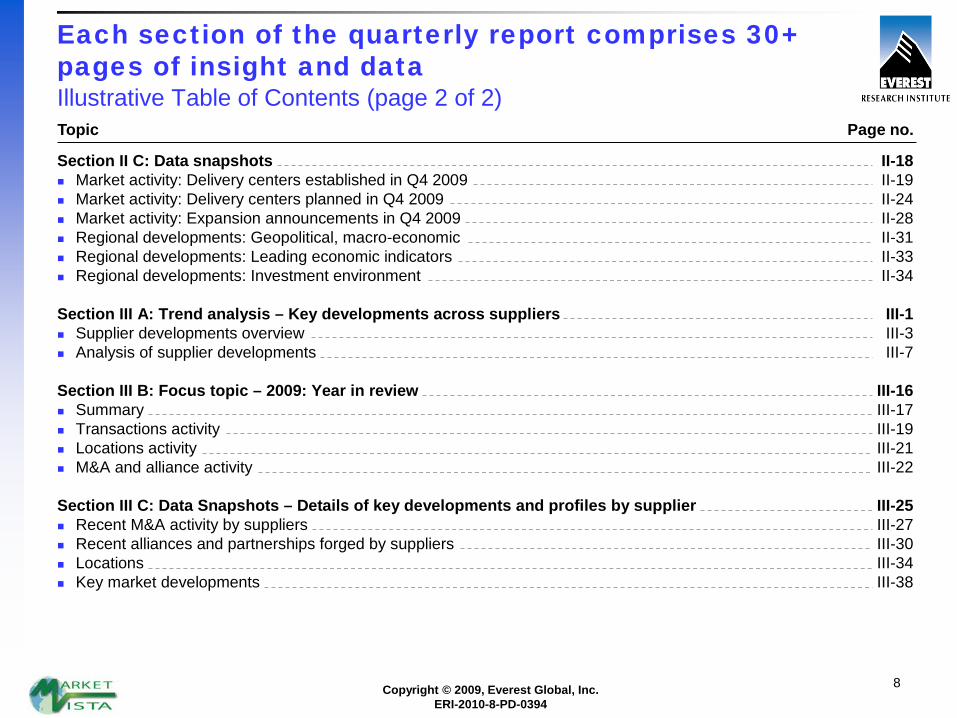
Each section of the quarterly report comprises 30+ pages of insight and dataIllustrative Table of Contents (page 2 of 2)
Section II C: Data snapshots II-18 Market activity: Delivery centers established in Q4 2009 II-19 Market activity: Delivery centers planned in Q4 2009 II-24 Market activity: Expansion announcements in Q4 2009 II-28 Regional developments: Geopolitical, macro-economic II-31 Regional developments: Leading economic indicators II-33 Regional developments: Investment environment II-34
Section III A: Trend analysis – Key developments across suppliers III-1 Supplier developments overview III-3 Analysis of supplier developments III-7
Section III B: Focus topic – 2009: Year in review III-16 Summary III-17 Transactions activity III-19 Locations activity III-21 M&A and alliance activity III-22
Section III C: Data Snapshots – Details of key developments and profiles by supplier III-25 Recent M&A activity by suppliers III-27 Recent alliances and partnerships forged by suppliers III-30 Locations III-34 Key market developments III-38
Topic Page no.

Copyright © 2009, Everest Global, Inc.ERI-2010-8-PD-0394
9
Section I – Market section | OverviewCaptures outsourcing transactions trends, captive developments with an emphasis on Financial Services players
Includes over 15 pages of data tables across transactions, captives and financial services

Copyright © 2009, Everest Global, Inc.ERI-2010-8-PD-0394
10
Section I – Market section | Illustrative output Transaction analysis for each quarter helps assess market momentum and trends over time
1 Includes only data that has been publicly disclosedSource: Everest Research Institute Transaction Intelligence Database
Index of outsourcing transactions1
NumberIndex of offshore captive health1
Number
The captive market XXXX XXXX with XX new captive announcements The outsourcing market XXXX XXXX in terms of XXXX although XX increased by XX% from XXXX ,
mainly due to XXXX
Captive divesturesCaptive announcements
XX
XX
XX
XXXXXX
Q4 2008 Q3 2009 Q4 2009
XXXX XX
Q4 2008 Q3 2009 Q4 2009

Copyright © 2009, Everest Global, Inc.ERI-2010-8-PD-0394
11
Section I – Market section | Illustrative output Analysis is further detailed at a functional level
1 Includes transactions in which functional scope may have multiple processesSource: Everest Research Institute Transaction Intelligence Database
Q-o-Q change in number of BPO transactions, by process1
Process category
Q4 2008 to Q4 2009
Q3 2009 to Q4 2009
XXXX
XXXX
XXXX
XXXX
XXXX
XXXX
XXXX
Q-o-Q change in number of ITO transactions, by process1
Decreased from last quarter
Similar to last quarter
Increased from last quarter
Process category
Q4 2008 to Q4 2009
Q3 2009 to Q4 2009
XXXX
XXXX
XXXX
XXXX

Copyright © 2009, Everest Global, Inc.ERI-2010-8-PD-0394
12
Section I – Market section | Illustrative output Coverage also includes captives, with a focus on setup, divestiture and other trends among captives
XXXX sold its research and decision support unit, XXXX, to XXXX. XXXX also signed a XX-year contract for research services from XXXX
XXXX provides market intelligence and strategic services in XX, XX, and XX and employs XX people globally
XXXX – Divests its captive unit, XXXX, to XXXX
XXXX plans to merge XXXX (which provides XX, XX, and XX across the XXXX) with XXXX, the BPO arm of the group
The planned merger will help the group expand its third-party service offerings
XXXX – Plans to merge XXXX with its BPO firm XXXX
XXXX acquired XXXX’s XXXX captive in XXXX for US$XX million. The captive performs global back-office activities, including XX, XX, XX, such as XX and XX
As part of the transaction, XXXX will provide outsourcing services to XXXX for XX years under a US$XX million contract
Approximately XX employees at the captive center will transition to XX
XXXX – Divests XXXX captive in XXXX to XXXX
Source: Everest Research Institute analysis

Copyright © 2009, Everest Global, Inc.ERI-2010-8-PD-0394
13
Section I – Market section | Illustrative output Developments among leading financial services players are profiled
ITO agreement – XXXX signed a XX-year XXXX transformation contract with XXXX worth US$XX million. XXXX will take on the management of the entire XXXX telephony estate that spans XX sites around the XXXX, with XX agents and XX users
XXXX
ITO agreement – XXXX selected XXXX to XX, XX and XX an advanced IP-based international network. Under a new XX-year agreement, XXXX will consolidate and standardize XXXX’s discrete networks, creating a single IP-based infrastructure connecting its regional networks in XX countries and territories
XXXX
Source: Everest Research Institute analysis

Copyright © 2009, Everest Global, Inc.ERI-2010-8-PD-0394
14
Section II – Locations section | Overview Key developments and emerging risks and opportunities across locations
Includes over 20 pages of data tables on
market activity, costs, wage inflation, etc.

Copyright © 2009, Everest Global, Inc.ERI-2010-8-PD-0394
15
XXXXXX
C
XXXXXX
A
XXXXXX
D
XXXXXX
B
Section II – Locations section | Illustrative output The dashboard identifies key emerging risks and opportunities across prominent offshoring regions
Source: Everest Research Institute analysis
LegendSignificant risk factor requiring attentionPotential near-term risk; may need monitoringPositive change since last assessment

Copyright © 2009, Everest Global, Inc.ERI-2010-8-PD-0394
16
Section II – Locations section | Illustrative output Key risks and opportunities are further detailed. For example in the wake of economic recovery, hiring has once again picked up among the Indian suppliers
1 Denotes Tech Mahindra, Wipro, Infosys, TCS, Cognizant, and HCL – six major Indian suppliers Note: Annual reports of suppliers have only provided actual hiring figures to Q3 2009. Figures for 2010 are estimated based on
announcements made by XXXX and XXXX onlySources: Everest Research Institute analysis; Supplier websites
Hiring trends for TWITCH1 companiesNet addition of employees in (QoQ)
In Q2 2009, many Indian firms went slow on hiring, primarily due to weakening project pipeline and longer lead time in conversion of sales opportunity. In fact, there was a net retrenchment of workforce among the Indian players
Hiring has once again picked up since Q3 and is likely to increase in Q4 2009 and 2010 Global majors are also gearing up for increased hiring from key offshore geographies such as
India. XXXX recently announced that it would expand its Indian XX business by hiring ~XX additional people in 2010. Similarly, XXXX plans to hire ~XX workforce during the same period, most of which would be in India
XXXX
XX
XX
XX-XX
-XXQ1 09 Q3 09 2010
Supplier Net addition in Q3 ‘09XXXX XX
XXXX XX
XXXX XX
XXXX XX
XXXX XX
XXXX XX
Q2 09

Copyright © 2009, Everest Global, Inc.ERI-2010-8-PD-0394
17
Section II – Locations section | Illustrative output The market activity heatmap identifies spikes of activity across regions
Brazil
Mexico
Argentina
Costa RicaPanama
Chile South Africa
MoroccoEgypt
Poland
Bulgaria
RomaniaCzech Republic
HungaryChina
PhilippinesMalaysia
Singapore
India
El Salvador
XXXX
XXXX
XXXX
XXXX
XXXX
XXXX
1 Details on new delivery centers opened are provided in the pages that follow this sectionNote: Analysis based on centers of Forbes 2000 captives and Top 20 Global Suppliers
Source: Everest Research Institute analysis
Copyright © 2009, Everest Global, Inc.ERI-2010-8-PD-0394
18
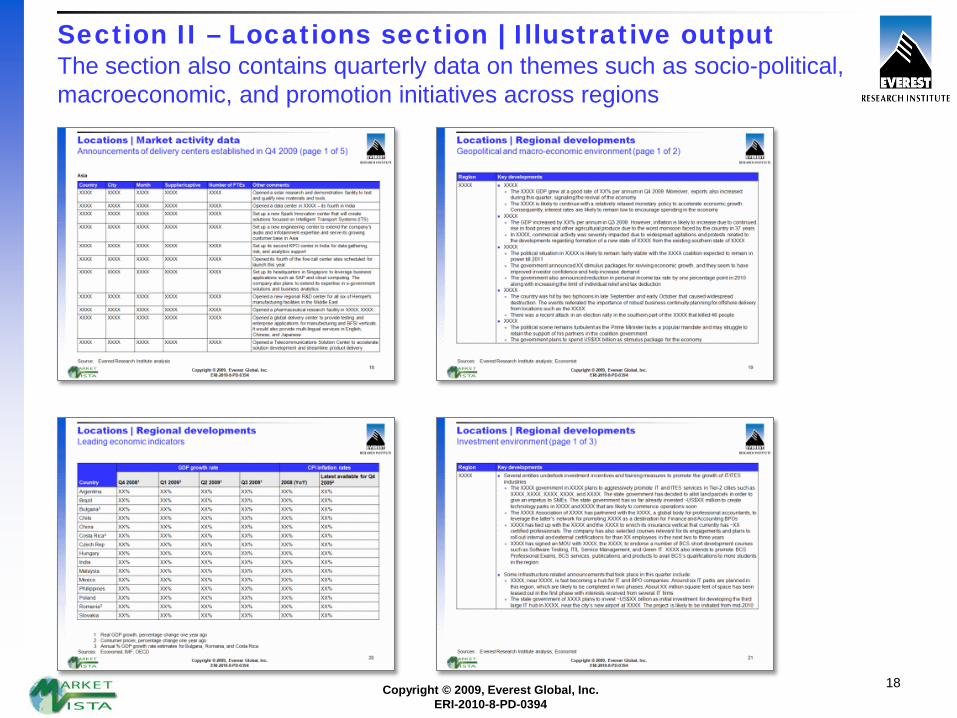
Section II – Locations section | Illustrative output The section also contains quarterly data on themes such as socio-political, macroeconomic, and promotion initiatives across regions

Copyright © 2009, Everest Global, Inc.ERI-2010-8-PD-0394
19
Section II – Locations section | Illustrative output Each quarterly report will cover a deep-dive on a specific geography / theme
Q4 2009 report includes a deep-dive on emerging
geographies covering costs, inflation, currency
trends, etc.

Copyright © 2009, Everest Global, Inc.ERI-2010-8-PD-0394
20
Section III – Supplier developments | OverviewProfiles developments across 20 leading suppliers, highlighting key implications for sourcing managers
Includes over 40 pages of data tables on M&A, new delivery centers, management
changes, etc.
Copyright © 2009, Everest Global, Inc.ERI-2010-8-PD-0394
21
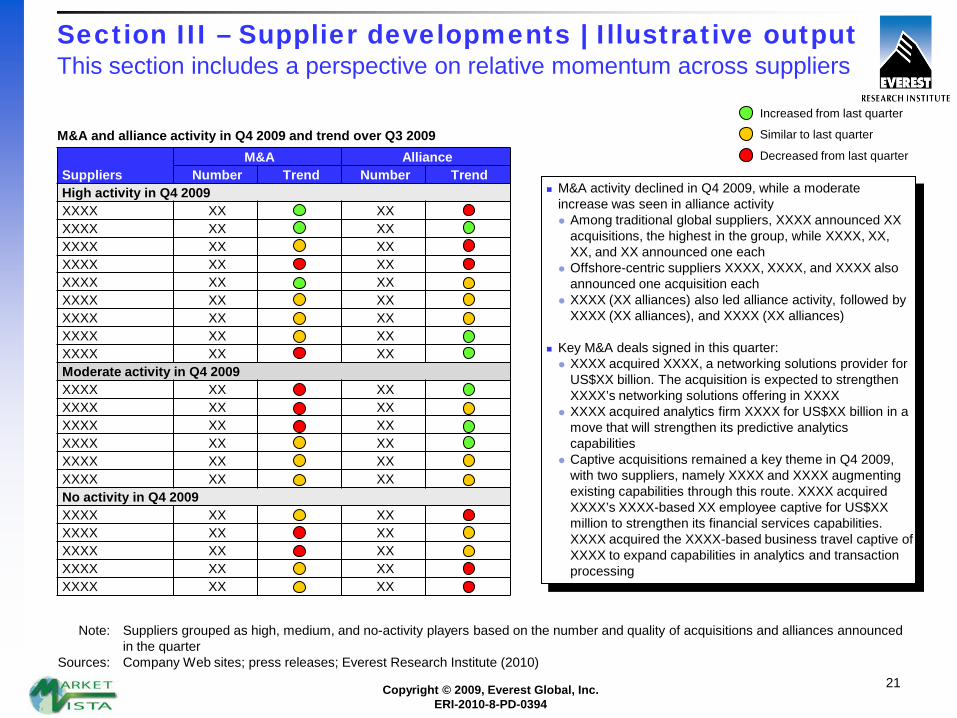
Section III – Supplier developments | Illustrative outputThis section includes a perspective on relative momentum across suppliers
M&A activity declined in Q4 2009, while a moderate increase was seen in alliance activity Among traditional global suppliers, XXXX announced XX
acquisitions, the highest in the group, while XXXX, XX, XX, and XX announced one each
Offshore-centric suppliers XXXX, XXXX, and XXXX also announced one acquisition each
XXXX (XX alliances) also led alliance activity, followed by XXXX (XX alliances), and XXXX (XX alliances)
Key M&A deals signed in this quarter: XXXX acquired XXXX, a networking solutions provider for
US$XX billion. The acquisition is expected to strengthen XXXX’s networking solutions offering in XXXX
XXXX acquired analytics firm XXXX for US$XX billion in a move that will strengthen its predictive analytics capabilities
Captive acquisitions remained a key theme in Q4 2009, with two suppliers, namely XXXX and XXXX augmenting existing capabilities through this route. XXXX acquired XXXX’s XXXX-based XX employee captive for US$XX million to strengthen its financial services capabilities. XXXX acquired the XXXX-based business travel captive of XXXX to expand capabilities in analytics and transaction processing
SuppliersM&A Alliance
Number Trend Number TrendHigh activity in Q4 2009XXXX XX XXXXXX XX XXXXXX XX XXXXXX XX XXXXXX XX XXXXXX XX XXXXXX XX XXXXXX XX XXXXXX XX XXModerate activity in Q4 2009XXXX XX XXXXXX XX XXXXXX XX XXXXXX XX XXXXXX XX XXXXXX XX XXNo activity in Q4 2009XXXX XX XXXXXX XX XXXXXX XX XXXXXX XX XXXXXX XX XX
M&A and alliance activity in Q4 2009 and trend over Q3 2009Decreased from last quarter
Increased from last quarter
Similar to last quarter
Note: Suppliers grouped as high, medium, and no-activity players based on the number and quality of acquisitions and alliances announced in the quarter
Sources: Company Web sites; press releases; Everest Research Institute (2010)

Copyright © 2009, Everest Global, Inc.ERI-2010-8-PD-0394
22
Section III – Supplier developments | Illustrative outputEach supplier is profiled in detail across multiple dimensionsSample profile – XXXX (page 1 of 2)
Location footprintLocation Status Employees DescriptionNo location activity announced in the quarter
Mergers & Acquisitions (M&A) and alliance activityType of activity Target/partner firm DescriptionAlliance XXXX XXXX formed an alliance with XXXX, a XXXX-based provider of audience relationship management.
The alliance will extend the capabilities of XXXX Interactive, a business launched by XXXX in Sep 2009. This solution helps companies develop digital marketing capabilities, enhance the development and management of their websites, and develop online marketing capabilities. As part of the alliance agreement, XXXX has taken a minority equity stake in XXXX
Recent transaction activity
Buyer name Announcement dateTCV1 estimate (US$ million)
Duration (years) Services
XXXX Nov 2009 XXXX XXXX IOXXXX Nov 2009 XXXX XXXX AOXXXX Nov 2009 XXXX XXXX AOXXXX Nov 2009 XXXX XXXX AOXXXX Oct 2009 XXXX XXXX AOXXXX Oct 2009 XXXX XXXX AOXXXX Oct 2009 XXXX XXXX AOXXXX Oct 2009 XXXX XXXX AO
Sources: Everest Research Institute (2010); company Web sites

Copyright © 2009, Everest Global, Inc.ERI-2010-8-PD-0394
23
Section III – Supplier developments | Illustrative outputEach supplier is profiled in detail across multiple dimensionsSample profile – XXXX (page 2 of 2)
Sources: Everest Research Institute (2010); company Web sites
Mergers & Acquisitions (M&A) and alliance activity (continued)Type of activity Target/partner firm DescriptionAlliance XXXX XXXX expanded its partnership with XXXX to provide customers with design, configuration and
operation services. These services integrate unified communications and collaboration tools into multiple applications across companies' information technology infrastructures. Solutions are aimed at the XXXX market
Key takeaways from Q3 2009 earnings callCategory DescriptionFinancials Revenue unchanged in the quarter at US$XX million
Operating margin declined XX bps over Q2 2009 to XX% Accenture made restructuring changes, consolidated global office space and realigned senior workforce
Pricing Some pricing pressures aimed at reducing overall client costs existed in Q3 2009Segments Geographies: Witnessed some momentum in XXXX, with the XXXX vertical seeing some signs of recovery; however,
revenue declined. Challenges continue to exist in XXXX. Decline also seen in XXXX. XXXX broadly unchanged Services: Share of revenue from consulting declined XX%, however, some signs of demand stabilization were seen. Within
SI, saw a healthy pipeline dominated by growth in the XXXX Deal sizes continued to be small with quicker payback. Outsourcing increased ~XX% (in terms of revenue contribution) due to lower scope expansion of existing projects, shift to lower cost resources at reduced prices, and higher contract cancellations. Demand was strong for infrastructure outsourcing (primarily remote management) and for ADM. BPO became a strong generator of bottom-line results
Verticals: Public services performed strongly on account of a new set of offerings. In addition, demand from healthcare grew significantly in Q3. Declines seen in communications and hi-tech and products. Financial services saw some stability, and insurance was strong. Launched the XXXX Interactive business aimed at the digital marketing segment
Talent Headcount of XX including XX employees in the global delivery network Utilization at XX%, an increase of XX bps over Q2 Attrition increased to XX% from XX% in Q2 2009 Announced plans to ramp up hiring in FY2010

Copyright © 2009, Everest Global, Inc.ERI-2010-8-PD-0394
24
Section III – Supplier developments | Illustrative output In addition, the section includes spotlight on key supplier developments in 2009
Top M&As by acquisition value Top delivery location activityTop outsourcing deals by total contract value
Traditional global suppliers
XX-XX (Q3 2009): The merger is expected to strengthen XXXX’s and XXXX’s BPO capabilities. The deal was valued at US$XX billion
XX-XX (Q3 2009): Valued at US$XX billion, the merger is expected to allow XXXX to offer a broader range of IT services
XX-XX (Q4 2009): This acquisition, valued at US$XX billion will strengthen XX’s networking solutions offering in the XXXX market
XXXX: Total of XX centers, XX onshore and XX offshore
XXXX : XX offshore centers
XXXX : XX offshore centers
XX-XX (Q4 2009): US$XX billion, XX-year deal for BPO and ITO services
XX-XX (Q4 2009): US$XX billion, XX-year deal for IO services
XX-XX (Q1 2009): US$XX billion, XX-year deal for IO services
Offshore-centric suppliers
XX-XX (Q1 2009): Valued at US$XX million, the acquisition is expected to expand XXs ITO and BPO service portfolio, and help XXXX diversify beyond telecom
XX-XX (Q4 2009): Valued at US$XX million, this acquisition will strengthen XXXX’s financial services capabilities
XX-XX (Q4 2009): Valued at US$XX million, the acquisition will strengthen XXXX’ insurance domain expertise
XXXX : XX new centers, two each onshore and offshore
XXXX : XX offshore centers
XX, XX, and XX: XX offshore centers each
XX-XX (Q1 2009): US$XX billion, XX-year deal for IO services
XX-XX (Q2 2009): US$XX million, XX-year deal for IO services
XX-XX (Q4 2009): US$XX million, XX-year deal for BPO and ITO services
1 Deal signed with XXXX2 XXXX
Source: Everest Research Institute (2010)
Copyright © 2009, Everest Global, Inc.ERI-2010-8-PD-0394
25
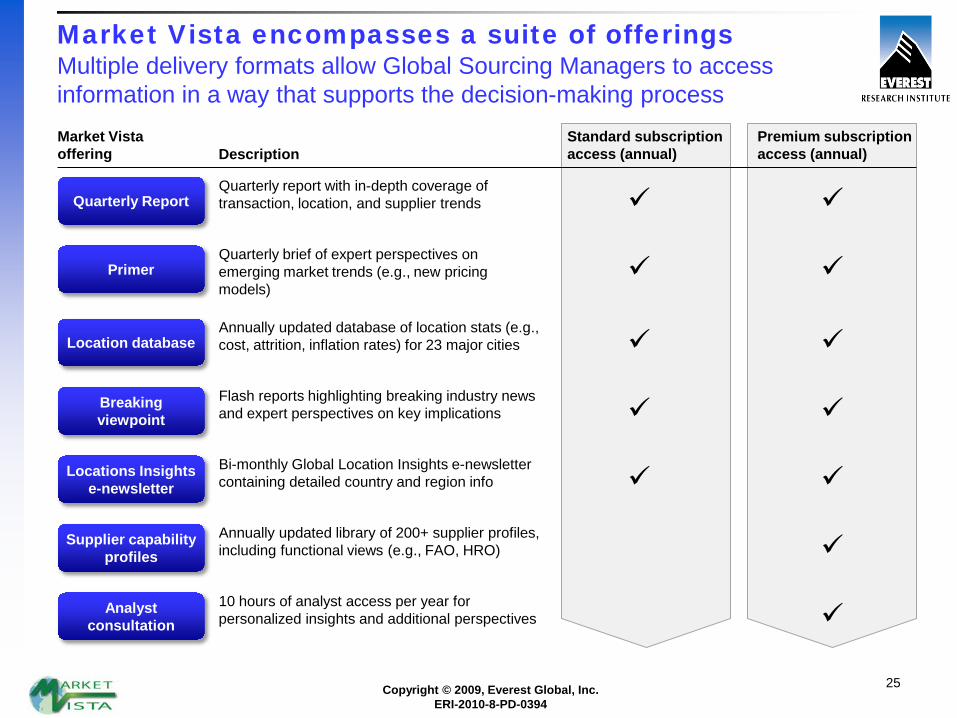
Market Vista encompasses a suite of offeringsMultiple delivery formats allow Global Sourcing Managers to access information in a way that supports the decision-making processMarket Vista offering Description
Standard subscription access (annual)
Premium subscription access (annual)
Quarterly ReportQuarterly report with in-depth coverage of transaction, location, and supplier trends
PrimerQuarterly brief of expert perspectives on emerging market trends (e.g., new pricing models)
Location databaseAnnually updated database of location stats (e.g., cost, attrition, inflation rates) for 23 major cities
Breakingviewpoint
Flash reports highlighting breaking industry news and expert perspectives on key implications
Locations Insightse-newsletter
Bi-monthly Global Location Insights e-newsletter containing detailed country and region info
Supplier capability profiles
Annually updated library of 200+ supplier profiles, including functional views (e.g., FAO, HRO)
Analyst consultation
10 hours of analyst access per year for personalized insights and additional perspectives

Copyright © 2009, Everest Global, Inc.ERI-2010-8-PD-0394
26
Appendix: Additional research references
The following documents are recommended for additional insight on the topic covered in this Research Report. The recommended documents either provide additional details on the topic or complementary content that may be of interest
For more information on this and other research published by the Everest Research Institute, please contact us:
Amneet Singh, Vice President – Global Sourcing: Anand Ramesh, Research Director:Salil Dani, Senior Research Analyst:
1. Market Vista: Q3 2009 (ERI-2009-8-R-0375); 2009. This report summarizes the key trends and developments for Q3 2009 in the global offshoring and outsourcing market.
2. Outsourcing and Offshoring Trends in Consumer Electronics (ERI-2010-2-R-0382); 2010. This research report analyzes outsourcing and offshoring activity, examines sourcing models and functional scope across leading consumer electronics companies, and captures emerging global sourcing trends in this vertical. The report also presents synthesized learnings on how leading consumer electronics companies have maximized value by leveraging global sourcing as an enabler to corporate strategy.
3. Executive Perspective – Transformational Outsourcing (ERI-2009-0-B-0392); 2010. Over the last 10 years, there has been a discernable decline in the number of outsourcing transactions over US$250 million in total contract value. However, the megadeal segment remains alive and well. One of the primary buyer motivation for large deals is to pursue true transformational outsourcing across the enterprise, bundling activities that are key to unlocking significant gains in business performance. This Executive Perspective note focuses on Transformational Outsourcing.
[email protected]@[email protected]
Everest Research InstituteTwo Galleria Tower13455 Noel Road, Suite 2100Dallas, TX 75240
Phone: +1-214-451-3110E-mail: [email protected]

Copyright © 2009, Everest Global, Inc.ERI-2010-8-PD-0394
27
Everest has the resources, experience, and capabilities to provide companies with the strategic intelligence, analysis, and insight that are crucial to making the right decisions in today’s outsourcing marketplace.
With the vision of our leadership team, the personal commitment, and indeed, the passion of our professionals to deliver real value to our clients, our organization is unsurpassed in its ability to guide your company’s future success.
Everest Research InstituteTwo Galleria Tower13455 Noel Road, Suite 2100Dallas, TX 75240U.S.A.+1-214-451-3110www.everestresearchinstitute.cominfo@everestresearchinstitute.com
Everest India Ground Floor, Tower AUnitech Business ParkSouth City - I, GurgaonNational Capital Region India 122001+91-124-304-1000
Everest CanadaThe Exchange Tower130 King Street West, Suite 1800Toronto, ON Canada M5X 1E3+1-416-865-2033
Get the answers today that lead to tomorrow’s success
Everest Netherlands & Continental EuropeAtrium Building 3rd FloorStrawinskylaan 30511007 ZX AmsterdamNetherlands+31-20-301-2138
Everest UK1st Floor, Accurist House44 Baker StreetLondon, W1U 7ALUnited Kingdom+44-870-770-0270
Everest Group150 E., 52nd Street, 16th FloorNew York, NY 10022U.S.A.+1-646-805-4000
Everest Australasia409a Wattletree RoadEast MalvernVIC 3145Australia+61-3-9509-3933
Everest AustraliaLevel 6, 90 Mount StreetNorth SydneyNSW 2060Australia+61-3-9509-3933