market segmentation - ipsos
TRANSCRIPT

2016
HIGH DEFINITIONCUSTOMERS - A POWERFUL SEGMENTATION
UNLOCKING VALUE WITH DATA SCIENCE

JUST LIKE THE BEST FILMS, DATA CAN TELLA STORY TOO – YOU JUST NEEDTO KNOW WHERETO LOOK.
HERE AT IPSOS, WE USE A NUMBER OF ADVANCEDSTATISTICAL ANALYSISTECHNIQUES TOUNCOVER THE HIDDEN STORIES, AND VALUE, IN THE DATA THAT MAY NOT BE VISIBLE AT FIRST GLANCE.
In this white paper we will explore how three types of
advanced statistical analysis – Factor, Cluster and CHAID
analysis – can help us unlock additional value from market
segmentation. They help us see our customers in high
definition, by better understanding the variables in the
survey and defining the segments.
We’re big film enthusiasts in the Ipsos Connect team, so
we’ll be looking to identify different groups of cinema-goers
based on how they look for information about new films
at the cinemas, but these tools can easily be used in any
market segmentation.

Market segmentation is about understanding the needs
of customers and how they decide between one product
or offer and another. Using market segmentation we can
build a picture of a group of customers who share the same,
or very similar, criteria or attributes. Using this information
a company can identify the groups of customers they
are best suited to, as well as the areas where they can
outperform the competition.
The ultimate objective of segmentation, therefore,
must be how to gain and retain the target customers.
A good segmentation study identifies and profiles
promising target markets so that you can reach them
with optimal marketing strategies.
ADVANCED STATISTICALANALYSIS –SPECIFICALLY FACTOR,CLUSTER AND CHAIDANALYSIS – ALLOW USTO PRODUCE A MOREPOWERFULSEGMENTATION, WITH A CLEARER VIEWOF OUR TARGETAUDIENCE.
WHAT IS MARKETSEGMENTATION?
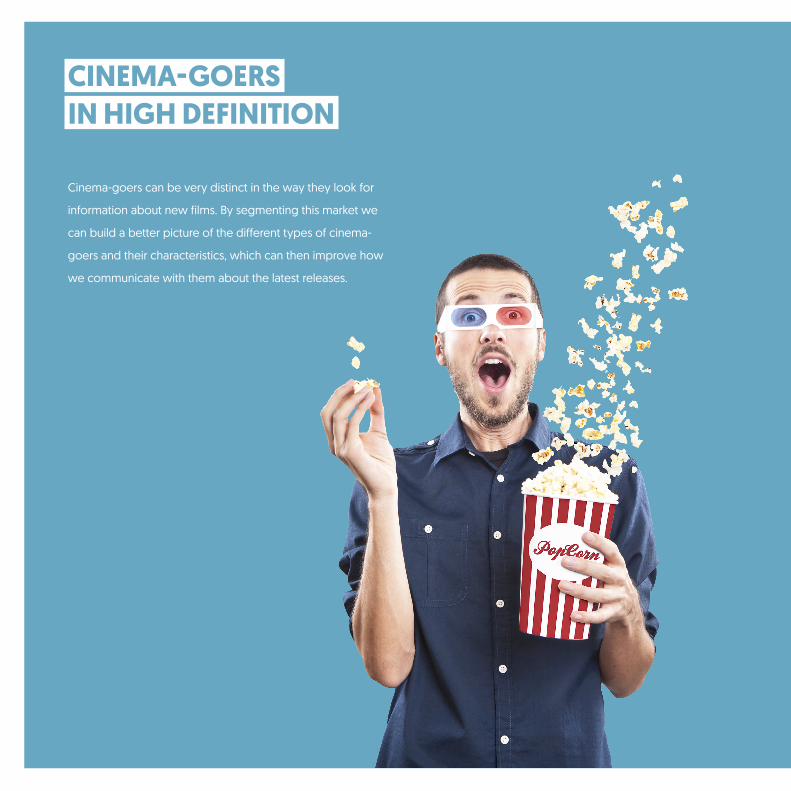
Cinema-goers can be very distinct in the way they look for
information about new films. By segmenting this market we
can build a better picture of the different types of cinema-
goers and their characteristics, which can then improve how
we communicate with them about the latest releases.
CINEMA-GOERS IN HIGH DEFINITION

OUR SAMPLE STUDYPROVIDED US WITHLOTS OF DATA, SO TO HELP US MAKESENSE OF IT WE:
RAN A FACTOR ANALYSIS
in order to reduce the number of attitudinal
attributes (32 in total) into a more manageable
number of underlying themes
USED CLUSTER ANALYSIS
to segment the consumers based
on the new factors found
APPLIED CHAID ANALYSIS
to help us profile the segments
we found
123

Attributes
4
Factor analysis is a statistical
technique broadly used
to examine the pattern of
correlations between attributes.
It allows us to reduce a large
number of attributes down to a
more manageable number of
representative concepts. With
fewer attributes to distract us
we can focus on the essence of
the question at hand.
When asked about the sources
that influence their film choice,
our cinema-goers cited,
amongst others, Facebook
comments, Twitter comments
and comments on online
reviews. Using Factor analysis
we were able to group
all of these attributes into a
single factor
– social media comments.
FACTOR ANALYSIS:SIMPLIFYINGATTRIBUTES TO ENABLEFOCUSED ANALYSIS 1 2
43
65
87
109

8 attributes
7 attributes
8 attributes
Theme 1 Theme 2 Theme 3 Theme 4
WE WERE ABLE TO DOTHIS ACROSS ALL 32ATTRIBUTES AND DISTILTHEM DOWN TO FOUR FACTORS:
1. Social media comments
2. Awards and nominations
3. Friends / family indication
4. Reviews from official
publications
9 attributes
1
5
109
2 3
46
4
7
8

Once we reduced the 32 attitudinal attributes into four
broad areas we ran the Cluster analysis. Cluster analysis is a
classification method which uses a number of mathematical
techniques to arrange sets of individuals into clusters.
The aim is to establish a set of clusters such that individuals
within a given cluster are more similar to each other than
they are to individuals in other clusters. The technique
reveals associations and structures in the data which were
previously undefined.
The clusters need to be sensible, actionable and with
characteristics that are easy to describe. They also need
to have a significant number of respondents – those with
only one or two respondents tell us very little. The clusters
are also tested by using them as cross breaks on attributes,
demographics and behavioural tabulations to ensure they
are sound.
It is worth noting that Cluster analysis is a data reduction
technique from the same family as Factor analysis.
However, while Factor analysis seeks to group attributes
or variables, Cluster analysis is concerned with grouping
individuals or respondents – in this case our cinema-goers.
CLUSTER ANALYSIS:GROUP INDIVIDUALSBY SIMILARITIES TOREVEAL SEGMENTS

In Cluster 1, the respondents put high importance on social
media comments and friends / family indication, they were
neutral about awards and nominations. Reviews from
official publications were less important to them.
So we decided to call this group Word of Mouth.
The second cluster is different from the first one.
They put more importance on the reviews from official
publications and less importance on social media
comments and friends/family indication.
We called them Critically Acclaimed.
The Hollywood cluster put high importance on
both awards and nominations and reviews from
official publications.
Now we have three distinct groups of cinema-goers
we can use CHAID analysis to get a deeper understanding
of each of them.
WHEN WE RAN THE CLUSTERANALYSIS BASED ON THE FOURFACTORS, THREE DISTINCTSEGMENTS EMERGED:
FACTORS CLUSTER 1 CLUSTER 2 CLUSTER 3
Social media comments High importance Low importance Low importance
Friends / family indication High importance Low importance Low importance
Awards and nominations Medium importance Medium importance High importance
Reviews from official publications Low importance High importance High importance
Word of Mouth
46%
Critically Acclaimed
36%
Hollywood
18%

WHAT DOES A TYPICAL ‘WORD OF MOUTH’ LOOK LIKE?
46% of the customers were classified as Word of Mouth.
When we interrogated the data we found the variable most
likely to define someone in this segment rather than any of
the other categories was the cinema brand. The data then
led us to split them by age and income, giving us the typical
profile of someone in the Word of Mouth segment – a 16 to
35-year-old who earns less than £35k a year and visits large-
chain cinemas.
CHAID ANALYSIS:MODELLING VARIABLES TO PREDICT OUTCOMES
CHAID (Chi-squared Automatic Interaction Detection)
analysis is the most common type of Decision Tree
analysis and is used to better understand how different
variables influence or predict an outcome. One of the main
advantages of this technique is that its output is highly visual
and easy to interpret.
CHAID analysis looks for distinct groups within a sample,
which, according to their responses to independent
variables, will predict or profile the variable of interest. The
dataset is repeatedly split according to the most significant
variable until there are no independent variables left or
there are no significant splits left to make. We are then left
with an effective ‘picture’ of each cluster – a portrait of the
typical cinema-goer in this group – that helps in a deeper
understanding of customers.
CHAID analysis can be a powerful technique to help in
profiling segments because we can use any sort of variables
or data in the tree.
Picture house,
Local cinema,
Apollo
80%20%
INCOME
Up to 35k a year
Below
65k a year
70%
Vue, Odeon, Cine world Picture house, City screen
75%25%
16 - 34 years old
Above 35
years old
AGE
30%
CINEMAS

WHAT DOES A TYPICAL ‘CRITICALLY ACCLAIMED’ LOOK LIKE?
36% of the customers were classified as Critically Acclaimed.
This process led us to the image of the Critically Acclaimed
as an older person with an income above £65k a year who
prefers local or more niche cinema brands, rather than the
multiplexes.
WHAT DOES A TYPICAL ‘HOLLYWOOD’ LOOK LIKE?
18% of the customers were classified as Hollywood.
The archetypal Hollywood lives in London, Birmingham,
Manchester or Liverpool, earns up to 55k a year, is between
16 and 44-years-old and has no children.
SEGMENTING TO UNLOCK GREATER VALUE
Market segmentation can be approached in a number of different ways, depending on the data available and the objectives
of the analysis. By using advanced statistical analysis we can get a high definition view of customers – making the outputs more
interesting, the action planning more reliable and reducing the time needed for analysis – helping us unlock more value from the
data. And once you understand the customers’ needs, the next stage is understanding how to reach them.
Though that’s another story…
Below 65k
a year
85%15%
AGE
Above 45
years old
Below 45
years old
70%
Over 65k
a year
75%
25%
Picture house,
Local cinemas,
Apollo,
Odeon
Cine World, Vue,
City screen
CINEMAS30%
INCOMEOther
cities
65%
35%
CITIES INCOME
CHILDREN AGE
70%
Up to
55k a
year
Other
cities
35%
Over 55k
a year
35%
60%16 - 44 years old
Above
45 years
old
40%
90%
No
Yes
10%
London,
Birmingham,
Manchester, Liverpool

ABOUT IPSOS MORI
Ipsos MORI, part of the Ipsos group, is one of the UK’s largest and most innovative research agencies, working for a wide range of global businesses, the FTSE100 and many government departments and public bodies.
We specialise in solving a range of challenges for our clients, whether related to business, consumers, brands or society. In the field of data science, we have a large and diverse team of experts including mathematicians, statisticians, data scientists and behavioural economists. We are constantly seeking to break new ground in the understanding and application of large and complex data sets.
We are passionately curious about people, markets, brands and society. We deliver information and analysis that makes our complex world easier and faster to navigate and inspires our clients to make smarter decisions.
Leo CremoneziStatistical Scientist, Ipsos ConnectT: +44 (0)20 8861 8755E: [email protected]@ipsosmori
CONTACT