market segmentation - cng no pdfs/tiax_marketsegmentation.pdf · this market segmentation report...
TRANSCRIPT


Market Segmentation
Final Report
U.S. and Canadian Natural Gas Vehicle Market Analysis:
2 I

Legal Disclaimer
This report was prepared by TIAX for America’s Natural Gas Alliance on terms specifically limiting TIAX’s liability. Our conclusions are the result of the exercise of our best professional judgment based in part upon materials and information provided to us by our subcontractors and others.
TIAX accepts no duty of care or liability of any kind whatsoever to any third party, and no responsibility for damages or loss, if any, suffered by any third party, as a result of decisions made, or not made, or actions taken, or not taken, based on this document.
This report may be reproduced only in its entirety and only with the prior written consent of TIAX.
Copyrighted materials are the property of the respective owners.
4 II


Table of Contents
Introduction
3 Vehicle Market Segments3.1 On-road Vehicles3.2 Off-road Vehicles3.3 Available Natural Gas Engines3.4 Light- and Medium-Duty Vehicle Types3.5 Light- and Medium-Duty Population and
Fuel Use3.6 Heavy-Duty Vehicle Types3.7 Heavy-Duty Population and Fuel Use
Natural Gas Vehicle Market Statistics2.1 Current Natural Gas Vehicle Inventory2.2 End User Trends
Abbreviations
Lower Heating Value Energy Content Conversion Factors
Preface
Executive Summary
Chapter 1
Chapter 3
Chapter 4
Chapter 2
4 Characteristics of Vehicle Market Segments4.1 Overview4.2 Light-duty Passenger Cars and Trucks (Private)4.3 Light-Duty Passenger Cars and Trucks (Commercial/Government)4.4 Medium-Duty Private and Commercial Trucks4.5 Heavy-Duty: Package Delivery Cars4.6 Heavy-Duty: Utility Trucks4.7 Heavy-Duty: Vans, Stake/Flat Beds, and Others4.8 Heavy-Duty: School Buses 4.9 Heavy-Duty: Transit Buses4.10 Heavy-Duty: Refuse Trucks4.11 Heavy-Duty: Local and Regional Pickup and Delivery Trucks 4.12 Heavy-Duty: Line-Haul Trucks4.13 Off-road: Ground Support Vehicles4.14 Off-road: Construction Equipment4.15 Off-road: Mining Equipment4.16 Summary
5 Geographic Characteristics of Markets 5.1 Overview5.2 Infrastructure Availability5.3 Regional Policies, Incentives, and Mandates5.4 Fuel Cost Differentials5.5 Vehicle Concentrations5.6 Strategic Corridors
6 Recommendations
Chapter 5
Chapter 6
6III


CNG
DGE
DOE
DOT
EIA
EPA
FTA
GGE
GHG
GVWR
LNG
NAAQS
NGV
OEM
PTO
SVM
VIUS
Diesel
Gasoline
LNG
Natural gas
Compressed natural gas
Diesel gallon equivalent (=131.7 cubic feet of natural gas)
Department of Energy
Department of Transportation
Energy Information Administration
Environmental Protection Agency
Federal Transit Administration
Gasoline gallon equivalent (=115.6 cubic feet of natural gas)
Greenhouse gas
Gross vehicle weight rating
Liquefied natural gas (1 gallon LNG = 0.58 DGE)
National Ambient Air Quality Standards
Natural gas vehicle
Original equipment manufacturer
Power take-off
Small volume manufacturer
Vehicle Inventory and Use Survey
129,488 BTU/gal
113,602 BTU/gal
74,720 BTU/gal
983 Btu/cubic foot (=131.4 BTU/gal of volume)
Abbreviations
Lower Heating Value Energy Content Conversion Factors
Source: Argonne National Laboratory, “Greenhouse Gases, Regulated Emissions, and Energy Use in Transportation,” 1.8c
8IV


With the primary objective of identifying the most productive and effective means to increase the use of natural gas vehicles (NGVs) in the U.S. and Canada, the TIAX team has conducted a thorough and independent assessment of the NGV market. To identify the major market development and expansion opportunities, this assessment examines key technical, economic, regulatory, social, and political drivers and challenges that shape this market. TIAX has partnered with The CARLAB, Clean Fuels Consulting, the Clean Vehicle Education Foundation, Jack Faucett Associates, the Natural Gas Vehicle Institute, and St. Croix Research to provide perspective and insights into the development of the future NGV market.
• Segmentation of the vehicle market
• Identification of market decision drivers
• Assessment of market development actions
• Analysis of competing technologies
• Analysis of market scenarios
• Integration of overall market development opportunities
The market perspectives for which decision drivers and opportunities have been identified and assessed are: light- and medium-duty vehicle ownership and production; heavy-duty vehicle ownership and production; compressed natural gas infrastructure; liquefied natural gas infrastructure; and government.
Drawing on the respective expertise of each team member, TIAX presents an integrated assessment of the U.S. and Canadian NGV market in a collection of eight reports. Each report is capable of standing alone while integrating the data, ideas, and themes of the other seven reports. The collection of reports in this TIAX analysis of the NGV market is supported by America’s Natural Gas Alliance and is intended to be transparent and accessible to a broad audience.
Identifying the most productive and effective means to increase the use of natural gas vehicles
TIAX’s overall approach relies on six key stages
Preface
10V
Executive Summary
While market segments are unique and complex, several common factors affect the use of natural gas as a vehicle fuel
Over 100,000 natural gas vehicles (NGVs) are currently in use on the roads of the U.S. and Canada. These on-road NGVs displace more than 225 million gallons of gasoline and diesel fuel in applications ranging from buses to passenger cars. In addition to these on-road vehicles, there are tens of thousands of natural gas forklifts and other off-road equipment in use. The market segments in which natural gas has achieved the greatest penetration are high fuel use applications with significant mandates and/or incentives for the use of alternative fuels.
The North American vehicle fleet is very diverse, composed of relatively standardized vehicles such as pickup trucks and passenger cars, as well as highly specialized vehicles such as street sweepers and vacuum trucks (Figure ES-1). However, these vehicles can be grouped into several broad groups. Within the on-road market, the light- and medium-duty vehicle
market segments are predominately composed of mass-produced vehicles in a few common configurations. These familiar configurations include passenger cars, trucks, SUVs, vans, and work trucks. Owing to their versatility, light- and medium-duty vehicles are present in nearly every fleet. Heavy-duty, on-road vehicles are built for specific applications and are generally built to order for each customer. Light-duty cars and trucks are the most numerous vehicles but use the least fuel per vehicle, whereas heavy-duty vehicles consume the most fuel per vehicle, making their total cost of ownership very sensitive to fuel price. Off-road fleets are predominantly construction equipment or low-speed vehicles, highly specialized to particular applications.
While market segments are unique and complex, several common factors affect the use of natural gas as a vehicle fuel. Ultimately, vehicle applications subject to the greatest economic and environmental pressures are the same applications that have seen the greatest use of natural gas. In particular, mandates and incentives created to reduce regulated motor vehicle emissions have historically driven NGV deployment. Due to increasingly stringent emissions standards for motor vehicles that can be met with conventional fuels as well as natural gas, air pollutant emissions are becoming diminished drivers for use of alternative fuels in vehicle applications. Instead, greenhouse gas emissions and a reduction in transportation fuels from geopolitically unstable regions of the world are likely to be key policy and deployment drivers for NGVs in North America.
Finally, the development of future natural gas infrastructure will be affected by a combination of factors. Prospective anchor fleets that are motivated to adopt natural gas must be matched with infrastructure development. Growth of transportation markets along strategic corridors and their geographic proximity to natural gas resources have the potential to expand natural gas infrastructure significantly.
VI

Figure ES-1
North America’s vehicle market is complex. This report examines the various vehicle market segments and their ability to use to natural gas as a fuel.
7
4
3
6
5
2
1
0
1970 1975 1980 1985 1990 1995 201020052000
U.S. Petroleum Supplies
Year
Petroleum Supplies(trillion barrels)
29%
09%
62%
Annual Growth 0.96%
Imports
U.S. Offshore
U.S. Domestic
Light Duty
0-6,000
Type
Bus
es
Shuttle
Intercity
School
Trans
Short Haul
Port
Long Haul
Regional
Van
Tow
Moving
Divided
Beverage
Refuse
Dump
Cement
Sem
i-Tra
cto
rsTr
ucks
Application Example Pass Car Class 1 Class 2 Class 3 Class 4 Class 5 Class 6 Class 7 Class 8 Major Fuels in Use
6,001-10,000
10,001-14,000
14,001-18,000
18,001-18,600
18,601-28,000
28,001-33,000
33,001ormore
Medium Duty
Gross Vehicle Weight: Rating (GVWR)in bs.
Heavy Duty
Vehicle Type/Application
Range BaseFueling
InfrastructureVehicle
AvailabilityFuel Cost Sensitivity
EnvironmentalPolicies
Light Heavy-Duty: Package Delivery Vans
12VII

1 Introduction
Over 100,000 natural gas vehicles (NGVs) are currently in use on the roads of the U.S. and Canada (Figure 1-1). These on-road NGVs displace more than 225 million gallons of gasoline and diesel fuel in applications ranging from buses to passenger cars. In addition, there are tens of thousands of natural gas forklifts and other off-road equipment in use. Delving further into the specific uses of NGVs, this report segments the market by vehicle type (e.g., passenger car), by end user application (e.g., public transit), and by geo-economic parameters (e.g., connected urban centers, goods movement corridors, and areas with similar policies). Each of these factors greatly impacts which markets and regions are most likely to adopt NGVs and helps define the potential degree of their market penetration.
Each vehicle market segment and application has its own unique characteristics in terms of vehicles employed, minimum performance requirements, drive cycle, and capital and operational costs. As a result, purchasing decisions tend to be made on case-by-case basis by individuals or fleets to meet user-specific requirements. General trends can be made within a vehicle class or within an application using generalized or average costs, annual mileage, vehicle service life, fueling prices, duty cycle, and refueling logistics. These trends can help identify potential opportunities for the growth of NGVs in particular markets, but they will not apply to every vehicle or fleet within that market. Geography will also impact these purchase decisions in terms of regional regulations, incentives, fueling infrastructure, fuel pricing structure, and public perception.
The overarching goal of this market segmentation report is to characterize how vehicles are used in North America—accounting for regional similarities and differences—to identify the challenges and opportunities that must be addressed for expansion of the NGV industry. This report begins by highlighting the current estimates of NGV penetration into the broad vehicle market and summarizing end user trends in Section 2. Next, Section 3 provides an overview of how the transportation sector is currently segmented in terms of vehicle types, applications, and fuel use. Following this overview, several market segments are reviewed in Section 4 based on key factors that impact the adoption of natural gas as a vehicle fuel. In Section 5, these discussions are followed by a look at the geographical segmentation of the market in terms of regional differences in policies and fuel prices that help explain the distribution of NGVs and natural gas infrastructure across the country. Section 5 also examines the major corridors for transportation and identifies areas where natural gas infrastructure may be targeted. Major recommendations are summarized in Section 6 for actions that will support the adoption of NGVs across all the potential market segments. Together, these sections identify and characterize specific sectors and applications with significant potential for expanded NGV use.
This market segmentation report provides an overview of the various vehicles and segments that compose the vehicle market, with a focus on natural gas vehicles in the various market segments.
1

Figure 1-1
These are a few examples of the thousands of NGVs in use in many different applications throughout North America.
...and many other applications: Passenger cars, semi-trucks, cargo vans, fork lifts
Segment Statistics
Segment Statistics
Segment Statistics
Total Vehicles 67,000
Natural Gas Vehicles 10,000
Petroleum Fuel Use (DGE) 670,000,000
Natural Gas Fuel Use (DGE) 150,000,000
Typical Daily Range (Miles) 90 to 130
Total Vehicles 140,000
Natural Gas Vehicles 1,400
Petroleum Fuel Use (DGE) 1,200,000,000
Natural Gas Fuel Use (DGE) 13,500,000
Typical Daily Range (Miles) 85
Total Vehicles 500,000
Natural Gas Vehicles 1,800
Petroleum Fuel Use (DGE) 570,000,000
Natural Gas Fuel Use (DGE) 2,300,000
Typical Daily Range (Miles) 30
Transit Buses
Refuse Trucks
School Buses
2
2 Natural Gas Vehicle Market Statistics
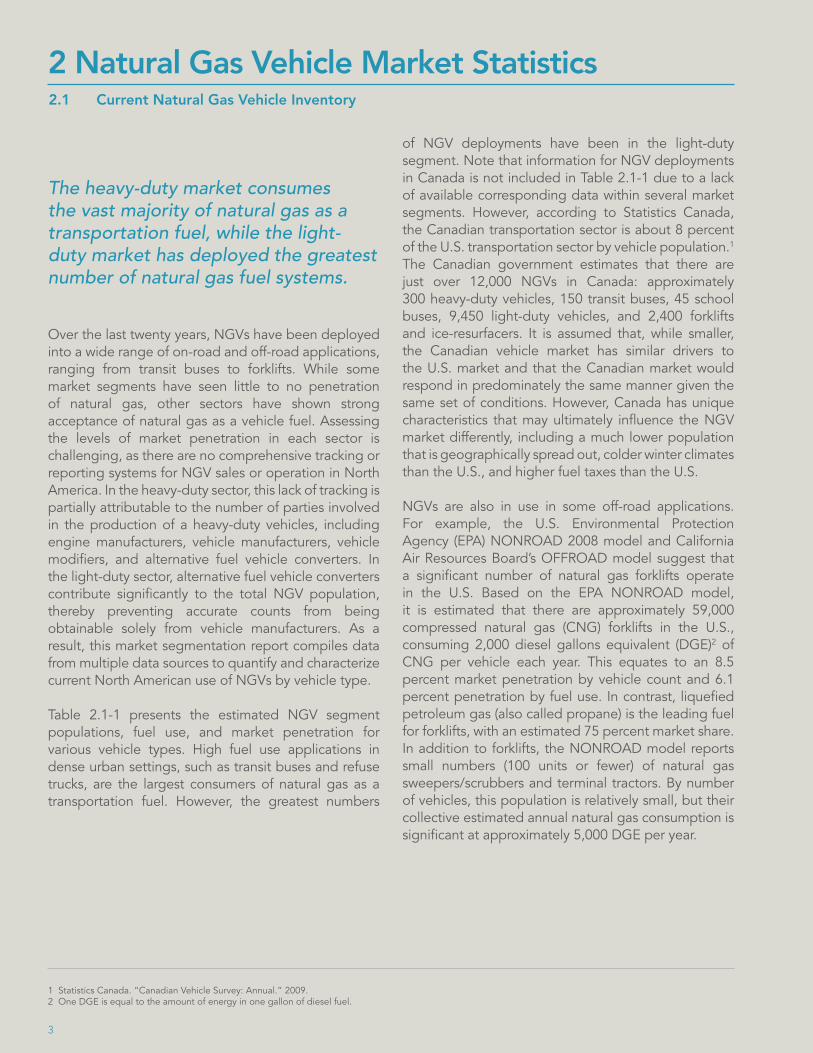
Over the last twenty years, NGVs have been deployed into a wide range of on-road and off-road applications, ranging from transit buses to forklifts. While some market segments have seen little to no penetration of natural gas, other sectors have shown strong acceptance of natural gas as a vehicle fuel. Assessing the levels of market penetration in each sector is challenging, as there are no comprehensive tracking or reporting systems for NGV sales or operation in North America. In the heavy-duty sector, this lack of tracking is partially attributable to the number of parties involved in the production of a heavy-duty vehicles, including engine manufacturers, vehicle manufacturers, vehicle modifiers, and alternative fuel vehicle converters. In the light-duty sector, alternative fuel vehicle converters contribute significantly to the total NGV population, thereby preventing accurate counts from being obtainable solely from vehicle manufacturers. As a result, this market segmentation report compiles data from multiple data sources to quantify and characterize current North American use of NGVs by vehicle type.
Table 2.1-1 presents the estimated NGV segment populations, fuel use, and market penetration for various vehicle types. High fuel use applications in dense urban settings, such as transit buses and refuse trucks, are the largest consumers of natural gas as a transportation fuel. However, the greatest numbers
of NGV deployments have been in the light-duty segment. Note that information for NGV deployments in Canada is not included in Table 2.1-1 due to a lack of available corresponding data within several market segments. However, according to Statistics Canada, the Canadian transportation sector is about 8 percent of the U.S. transportation sector by vehicle population.1 The Canadian government estimates that there are just over 12,000 NGVs in Canada: approximately 300 heavy-duty vehicles, 150 transit buses, 45 school buses, 9,450 light-duty vehicles, and 2,400 forklifts and ice-resurfacers. It is assumed that, while smaller, the Canadian vehicle market has similar drivers to the U.S. market and that the Canadian market would respond in predominately the same manner given the same set of conditions. However, Canada has unique characteristics that may ultimately influence the NGV market differently, including a much lower population that is geographically spread out, colder winter climates than the U.S., and higher fuel taxes than the U.S.
NGVs are also in use in some off-road applications. For example, the U.S. Environmental Protection Agency (EPA) NONROAD 2008 model and California Air Resources Board’s OFFROAD model suggest that a significant number of natural gas forklifts operate in the U.S. Based on the EPA NONROAD model, it is estimated that there are approximately 59,000 compressed natural gas (CNG) forklifts in the U.S., consuming 2,000 diesel gallons equivalent (DGE)2 of CNG per vehicle each year. This equates to an 8.5 percent market penetration by vehicle count and 6.1 percent penetration by fuel use. In contrast, liquefied petroleum gas (also called propane) is the leading fuel for forklifts, with an estimated 75 percent market share. In addition to forklifts, the NONROAD model reports small numbers (100 units or fewer) of natural gas sweepers/scrubbers and terminal tractors. By number of vehicles, this population is relatively small, but their collective estimated annual natural gas consumption is significant at approximately 5,000 DGE per year.
The heavy-duty market consumes the vast majority of natural gas as a transportation fuel, while the light-duty market has deployed the greatest number of natural gas fuel systems.
2.1 Current Natural Gas Vehicle Inventory
1 Statistics Canada. “Canadian Vehicle Survey: Annual.” 2009.2 One DGE is equal to the amount of energy in one gallon of diesel fuel.
3

Table 2.1-2
Natural gas vehicles have achieved the greatest market penetration in high-fuel-use applications like transit buses.
Vehicle Type Low High Low High Low High Low High
Transit bus 8,500b 12,320e 13% 18% 149,200e 151,365g 22% 23%
Refuse truck 1,300c 1,500c 1.4% 1.6% 12,856c 14,833c 1.4% 1.6%
School bus 1,360d 2,300b 0.3% 0.5% 1,696d,g 2,827d,g 0.3% 0.5%
Other heavy-duty truck 9,818a 14,778a 0.2% 0.3% 161,833a 161,838a 0.4% 0.4%
Total 20,978 30,898 0.2% 0.3% 325,585 330,863 0.7% 0.7%
Vehicle Type Low High Low High Low High Low High
Medium-duty truck4 10,000b 22,309a 0.03% 0.08% 17,623a 0.15%
Light truck 39,381a 71,500f 0.04% 0.07% 16,358a 0.02%
Passenger car 29,759a 0.02% 6,455a 0.01%
Total 79,140 123,568 0.03% 0.05% 40,436 0.03%
U.S NGV Population U.S Market Penetration(by vehicle count)
U.S Annual NGV Fuel Use (thousand DGE)
U.S. Market Penetration(by fuel use)
U.S NGV Population U.S Market Penetration(by vehicle count)
U.S Annual NGV Fuel Use (thousand GGE)3
U.S. Market Penetration(by fuel use)
On-Road Heavy-Duty Applications (>14,000 lbs GVWR)
On-Road Light- and Medium-Duty Applications (≤14,000 lbs GVWR)
Light-duty passenger car: includes cars from sub-compact to large station wagons, does not include minivans, SUVs, or pickups
Light-duty truck/van: includes Class 1 and Class 2a trucks, vans, minivans, pickups, SUVs
Medium-duty truck: includes Class 2b to Class 3 trucks and vans
Heavy-duty transit bus: bus with front and center doors and low-back seating for use in frequent-stop service
Heavy-duty refuse hauler: waste collection vehicle or garbage truck that collects trash from homes and businesses for transport to processing facility
Heavy-duty school bus: bus used for the purpose of transporting students between home and school, typically Class 6 or Class 7 vehicles
Other heavy-duty truck: Class 4 to 8 trucks, both tractor-trailers and straight trucks, does not include buses or refuse trucks
a) U.S. Energy Information Administration, “Alternatives to Traditional Transportation Fuels 2009,” April 2011b) Yborra, S. “Growth of the NGV Market: Lessons Learned Roadmap for Infrastructure Development,” 2008c) Cannon, J., “Greening Garbage Trucks: Trends in Alternative Fuel Use,” 2006d) Monahan, P., “School Bus Pollution Report Card 2006,” 2006e) American Public Transportation Association, “2012 Public Transportation Fact Book,” March 2012f) U.S. Census Bureau, “Vehicle in Use Survey,” 2002 g) U.S. DOE Energy Efficiency and Renewable Energy, Transportation Energy Data Book, Edition 31, 2012
4
3 One gasoline gallon equivalent (GGE) is equal to the amount of energy in one gallon of gasoline.4 Medium-duty truck data from EIA “Alternatives to Traditional Transportation Fuels” report was segregated based on the assumption that medium-duty pickups are
primarily Class 2a and Class 3. Other medium-duty trucks and vans are assumed to be Class 4 to Class 6. Assumption based on discussions with EIA staff.
2 Natural Gas Vehicle Market Statistics
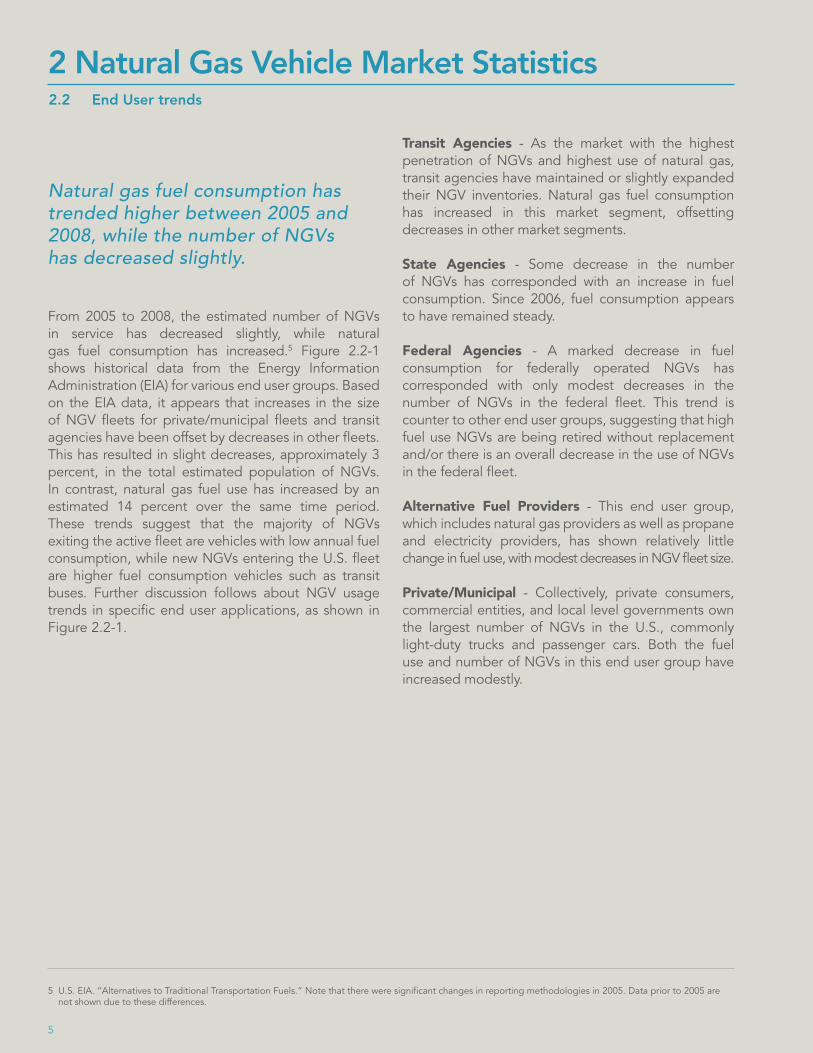
From 2005 to 2008, the estimated number of NGVs in service has decreased slightly, while natural gas fuel consumption has increased.5 Figure 2.2-1 shows historical data from the Energy Information Administration (EIA) for various end user groups. Based on the EIA data, it appears that increases in the size of NGV fleets for private/municipal fleets and transit agencies have been offset by decreases in other fleets. This has resulted in slight decreases, approximately 3 percent, in the total estimated population of NGVs. In contrast, natural gas fuel use has increased by an estimated 14 percent over the same time period. These trends suggest that the majority of NGVs exiting the active fleet are vehicles with low annual fuel consumption, while new NGVs entering the U.S. fleet are higher fuel consumption vehicles such as transit buses. Further discussion follows about NGV usage trends in specific end user applications, as shown in Figure 2.2-1.
Transit Agencies - As the market with the highest penetration of NGVs and highest use of natural gas, transit agencies have maintained or slightly expanded their NGV inventories. Natural gas fuel consumption has increased in this market segment, offsetting decreases in other market segments.
State Agencies - Some decrease in the number of NGVs has corresponded with an increase in fuel consumption. Since 2006, fuel consumption appears to have remained steady.
Federal Agencies - A marked decrease in fuel consumption for federally operated NGVs has corresponded with only modest decreases in the number of NGVs in the federal fleet. This trend is counter to other end user groups, suggesting that high fuel use NGVs are being retired without replacement and/or there is an overall decrease in the use of NGVs in the federal fleet.
Alternative Fuel Providers - This end user group, which includes natural gas providers as well as propane and electricity providers, has shown relatively little change in fuel use, with modest decreases in NGV fleet size.
Private/Municipal - Collectively, private consumers, commercial entities, and local level governments own the largest number of NGVs in the U.S., commonly light-duty trucks and passenger cars. Both the fuel use and number of NGVs in this end user group have increased modestly.
Natural gas fuel consumption has trended higher between 2005 and 2008, while the number of NGVs has decreased slightly.
2.2 End User trends
5 U.S. EIA. “Alternatives to Traditional Transportation Fuels.” Note that there were significant changes in reporting methodologies in 2005. Data prior to 2005 are not shown due to these differences.
5

Figure 2.2-1
Natural gas fuel consumption has increased recently while the natural gas vehicle population has declined slightly.
0
0
125,000
175,000
225,000
100,000
100,000
200,000
75,000
75,000
150,000
50,000
25,000
25,000
50,000
125,000
2005
2005
20092008
20092008
2006
2006
2007
2007
Total Natural Gas Vehicles
Total Natural Gas Fuel Use
Private/Municipals
Private/Municipals
State Agencies
State Agencies
Alt Fuel Providers
Alt Fuel Providers
Federal Agencies
Federal Agencies
Transit Agencies
Transit Agencies
6
(thousand GGE)
Based on EIA data available at: http://www.eia.gov/renewable/afv/archive/index.cfm
Based on EIA data available at: http://www.eia.gov/renewable/afv/archive/index.cfm
3 Vehicle Market Segments
The North American on-road vehicle fleet is very diverse, composed of relatively standardized vehicles such as pickup trucks and passenger cars as well as highly specialized vehicles such as street sweepers and tow trucks. However, these vehicles can be grouped using common physical characteristics and usage criteria, including vehicle type, weight capacity, and duty rating.
On-road vehicles are designed to travel on public streets and motorways and must meet a variety of safety requirements to be so operated. In addition, each type of on-road vehicle is assigned a weight class that represents the maximum weight that it can safely support, including cargo and passengers. This weight rating is known as the gross vehicle weight rating (GVWR). In the U.S., Department of Transportation (DOT) designations are used and are defined as follows:
• Passenger Car/Light Truck
• Class 1: ≤6,000 pounds (light-duty)
• Class 2a: 6,001 to 8,500 pounds (light-duty)
• Class 2b: 8,501 to 10,000 pounds (medium-duty)
• Class 3: 10,001 to 14,000 pounds (medium-duty)
• Class 4: 14,001 to 16,000 pounds (heavy-duty)
• Class 5: 16,001 to 19,500 pounds (heavy-duty)
• Class 6: 19,501 to 26,000 pounds (heavy-duty)
• Class 7: 26,001 to 33,000 pounds (heavy-duty)
• Class 8: ≥33,001 pounds (heavy-duty)
It is not uncommon for a single vehicle to have different weight class designations depending on the equipment installed on the vehicle. For example, the 2012 Ford F-350 pickup truck may be a Class 3 or Class 4 vehicle depending on drive train and rear axle type.6
Vehicles are also commonly grouped by weight categories: light-duty, medium-duty, and heavy-duty. The precise definition of these categories varies significantly. For the purposes of this report, light-duty is considered to include passenger cars through Class 2a vehicles. Medium-duty includes Class 2b through Class 3 vehicles, and heavy-duty includes Class 4 through Class 8 vehicles. These groupings are consistent with those used for emissions certifications and represent a reasonable separation between trucks that are mass produced (light- and medium-duty) and those that are highly customized (heavy-duty). Figure 3.1-1 provides an overview of these grouping for several common vehicle types.
While there is some overlap in the light- and medium-duty truck markets, gasoline is the dominant fuel for light-duty vehicles. Diesel is the dominant fuel in medium-duty and heavy-duty applications, primarily due to the higher fuel efficiency and torque of compression ignition engines. In applications with relatively low fuel consumption, gasoline may compete with diesel for market share.
On-road vehicle markets are complex and include dozens of vehicle applications. Vehicle manufacturers take very different approaches to producing vehicles, depending on the type of vehicle being sold.
3.1 On-road Vehicles
6 Ford. “Super Duty Specifications.” http://www.ford.com/trucks/superduty/specifications/chassis. Accessed August 2012.
7

Figure 3.1-1
The on-road vehicle market is complex and segmented by various vehicle characteristics including weight class, vehicle type, and size.
Light Duty
0-6,000
Type
Bus
es
Shuttle
Intercity
School
Transit
Short Haul
Port
Long Haul
Regional
Van
Tow
Moving
Stake/ Flat Bed
Beverage
Refuse
Dump
Cement
Car Hauler
Utility Truck
Reefer
Tank
Van
Utility Van
Pickup
Cargo Van
Sub-compact
Compact
Med Sedan
Lg Sedan
Mini-Van
SUV
PassengerVan
Gasoline Diesel Natural Gas Propane
LightPickup
Steet Sweeper
Sem
i-Tra
cto
rsM
ediu
m a
nd H
eavy
Dut
y V
oca
tio
nal T
ruck
sLi
ght
and
Med
Dut
y V
oca
tio
nal
Truc
ks
Pas
seng
er C
ars
and
Lig
ht T
ruck
s
Application Example Pass Car Class 1 Class 2 Class 3 Class 4 Class 5 Class 6 Class 7 Class 8 Major Fuels in Use
6,001-10,000
10,001-14,000
14,001-16,000
16,001-19,500
19,501-26,000
26,001-33,000
33,001ormore
Medium Duty
Gross Vehicle Weight: Rating (GVWR) in lbs.
Heavy Duty
8

3 Vehicle Market Segments
Off-road vehicles are vehicles that cannot legally operate on public roads but may share many characteristics with on-road vehicles, including windows, tires, and self-propulsion. Off-road vehicles include construction and mining equipment such as bulldozers, graders, and dump trucks, as well as ground support vehicles, such as terminal tractors at ports and baggage handling equipment at airports. Because these vehicles do not travel on public roads, they are not classified by their vehicle weight rating like on-road vehicles, although they are often marketed based on weight capacity. Instead, they are grouped by vehicle type and the power rating of their engines. Figure 3.2-1 provides an overview of several common types of off-road equipment, grouped by the horsepower categories used for emissions inventories by the EPA. Note that while there may be examples of equipment outside the indicated horsepower ranges, the intent is to show common horsepower ranges by application.
Construction and mining equipment include engines that range in size from less than 50 horsepower to more than 4,000 horsepower. It is common practice to build essentially the same type of vehicle in a very large range of sizes and power ratings. For example, Caterpillar offers track-type tractors in engine power ranges from 96 horsepower to 850 horsepower.7 Construction and mining equipment tend to be very heavy and used to move large loads, necessitating the use of high torque engines. In addition, reliability and durability are major concerns given the severe service operations required of construction and mining vehicles. As a result, compression ignition engines are preferred in these applications, leading to the near exclusive use of diesel fuel in these market segments. The predominant difference between mining and construction equipment is that mining equipment tends to be larger than construction equipment, due to a focus on maximizing the throughput of material in mining applications.
Ground support vehicles are also off-road vehicles. Although some of these vehicles (e.g., terminal tractors) can look very similar to on-road vehicles, they are not permitted to operate on public roads. Ground support vehicles are generally dedicated to serving the operations of a single facility, such as a port terminal or warehouse. In essence, this circumstance creates captured fleets. Most ground support vehicles are equipped with engines less than 300 horsepower in size. Smaller vehicles like indoor forklifts commonly use spark-ignited engines fueled by gasoline, natural gas, or propane. For applications above 100 horsepower, compression-ignition engines fueled by diesel are the dominant power source.8 A good example of larger diesel-fueled ground support vehicles are terminal tractors, which typically move very heavy loads for short distances and are used commonly throughout North American seaport terminals.
Off-road fleets are predominantly construction equipment or low-speed vehicles, highly specialized to particular applications.
3.2 Off-road Vehicles
7 CAT. “Track-Type Tractors.” http://www.cat.com/equipment/track-type-tractors. Accessed August 2012.8 U.S. EPA 2008 NONROAD model.
9

Figure 3.2-1
Off-road vehicles and equipment are generally classified by engine size, which varies widely, and diesel is the dominant fuel.
>25 25-50 51-75 76-100 101-175 176-300 301-600 601-750 751+
Dump Truck
Bull Dozer
Grader
Earth Mover
Yard Truck
Self Loader
Baggage
Belt Loaders
Fork Lift
Off
-Hig
hway
Engine Horsepower
Major Fuels in Use
Gasoline Diesel Natural Gas Propane
Typical mining and construction equipment
Motor Grader
Backhoe Loader
Mining Truck
Wheel Loader
Typical ground support equipment
Indoor Forklift Tow Tractor Yard Hostler
10
3 Vehicle Market Segments
The broad range of vehicle types and applications offered in the North American market requires a diversity of engine types and sizes. Two types of OEMs are the key players in the process to mass produce conventional on-road vehicles: vehicle OEMs and engine OEMs. One process is for vehicle OEMs to produce and install their own engine into their own vehicle chassis (i.e., they are also engine OEMs), as is commonly done for manufacturing of light-duty passenger cars and trucks. A second process is for vehicle OEMs to purchase engines from engine OEMs and integrate them into their own vehicle chassis, as is common in the heavy-duty and off-road markets. Alternative fuel vehicles including NGVs tend to be manufactured through a variation of this process that involves additional players and step, due to the need for specialized on-board fuel storage systems made by other OEM types, who must coordinate closely with vehicle and engine OEMs, as well as third parties that specialize in vehicle aftermarket conversions.
Currently, the NGV market is served by a limited number of engine OEMs that typically offer a single natural gas engine model. In some cases, these engines are installed into vehicles on the factory line as is done with traditional diesel and gasoline engines.
The benefits of OEM installations of natural gas engines are significant, including the ability to mass produce NGVs with highly integrated vehicle/engine/fuel systems. This can increase vehicle reliability, efficiency, and cost savings compared to aftermarket conversions and provide customers with a single point of purchase and full vehicle warranty.
Where OEM products are not available, the natural gas vehicle market is served by SVMs and aftermarket converters. SVMs are companies that develop and certify natural gas conversions of existing diesel and gasoline engines. These companies are required to certify their conversions annually to the same emissions standards as OEMs. The costs and complexities of this annual recertification are a leading factor in limiting the number of natural gas conversions available on the market. While the SVMs provide natural gas-compatible engines, aftermarket converters are needed to make additional modifications to the vehicles before they can operate on natural gas. These modifications include fuel tank installations, engine installations or modifications per SVM requirements, and fuel line routing. Together, OEMs, SVMs, and aftermarket converters provide natural gas engine options for on-road vehicles from passenger cars to Class 8 semi-tractors.
Historically, natural gas engine OEMs and SVMs have focused on the on-road market and offered few NGV options for off-road vehicle end users. However, in some regions and market segments, off-road vehicle OEMs are beginning to use on-road engines to comply with various emissions regulations. This makes it more feasible to substitute on-road natural gas engines for diesel engines in both on- and off-road applications. This trend could help to significantly increase deployments of NGVs in the off-road vehicle segment. Table 3.3-1 shows available light-, medium-, and heavy-duty natural gas engines for North American markets and their representative end use applications. As shown, even though natural gas engine offerings are limited, their use covers a broad range of applications from passenger cars to eighteen-wheelers.
Natural gas engines are available for most vehicle applications through a combination of original equipment manufacturers (OEMs), small volume manufacturers (SVMs), and aftermarket converters.
3.3 Available Natural Gas Engines
11

Figure 3.3-1
Natural gas engines are available for most vehicle applications.9
9 Data based on information provided by NGVAmerica, “Guide to Available Natural Gas Vehicles and Engines,” May 14, 2011.
12
Class Supplier Engine Light
-dut
y Pas
seng
er C
ars
Shut
tle B
uses
Taxis
Other
Med
ium-D
uty
Truc
ks
Light
-Dut
y Tr
ucks
Tran
sit B
uses
Shor
t-Hau
l Tru
cks
Packa
ge Deli
very
Veh
icles
Scho
ol B
uses
Long
-Hau
l Tru
cks
Utility
Truc
ks
Draya
ge Tr
ucks
Refus
e Hau
lers
Other
Hea
vy-
Duty
Truc
ks
LD OEM+SVM Honda 1.8L
LD/MD OEM+SVM Ford 4.6L
LD/MD OEM+SVM GM 6.0L
LD/MD SVM Chrysler 4.7L
LD/MD SVM GM 6.2L
LD/MD SVM Ford 6.2L
LD/MD SVM Ford 6.8L
LD SVM Ford 2.0L
LD SVM Ford 2.3L
LD SVM Ford 2.5L
LD/MD SVM Ford 4.6L
LD/MD SVM Ford 5.4L
LD SVM GM 3.5L
LD SVM GM 3.9L
LD/MD SVM GM 4.8L
LD/MD SVM GM 5.3L
LD/MD SVM GM 6.0L
MD/HD Converter BAF Technologies6.8L V-10
MD/HD Converter IMPCO Technologies 4.8L HD
MD/HD Converter IMPCO Technolo-
gies 6.0L HD
MD/HD ConverterLandi Renzo
USA/Baytech 4.8L HD
MD/HD ConverterLandi Renzo
USA/Baytech 6.0L HD
MD/HD Converter Landi Renzo
USA/Baytech 8.1L HD
HD Converter
Emission Solutions Inc./International Truck
7.6L NGPhoenix
HD OEM Cummins Westport 8.9L ISL G
HD OEM Doosan InfracoreAmerica 11L GK12
HD OEM Westport Innovations15L GX

3 Vehicle Market Segments
The light- and medium-duty vehicle market segments include passenger cars, pickup trucks, light work trucks, and cargo vans (Figure 3.4-1). Owing to their versatility, these vehicles are present in most fleets and are used for transportation or job functions that do not require specialized vehicle chassis. Due to their popularity, manufacturers are able to mass produce these vehicles with relatively few body/chassis/engine combinations. A consequence of this market structure is that individual fleets must often turn to third parties to integrate alternative fuel technologies into vehicles if the manufacturer does not provide them as standard options.
The U.S. passenger car and light truck market consists of approximately 230 million vehicles that are predominantly in the hands of private citizens and used for personal transportation. Only about 4 percent of passenger cars are in fleets of five or more vehicles.10 Light-duty vehicles are typically sold to private
customers through dealerships with few modifications and relatively short lead times.11 Because such a large majority of light-duty vehicles are purchased by private owners, offerings in this market segment are primarily dictated by consumer preferences. Purchase price and styling are significant market drivers, whereas fuel economy has only recently been significant when gasoline prices were near $4.00 per gallon. The relative priority of these market drivers reflects the relatively low fuel consumption per vehicle in the passenger car and light truck market. Incremental vehicle capital costs associated with major fuel economy improvements (e.g., hybridization) or the ability to operate on alternative fuels typically have very long payback periods when gasoline prices are low.
Like light-duty vehicles, medium-duty vehicles are also mass produced, but the vehicle body may be removed, added, or altered, and additional equipment may be added by the dealer or a third party vehicle modifier. Unlike the light-duty market, the majority of medium-duty vehicles are purchased for commercial use. Key market drivers in this segment are vehicle capability, reliability, and total cost of ownership. These factors have led to a significant use of compression-ignition engines and diesel fuel in the medium-duty market, although in low fuel use applications, the higher purchase price of a diesel-fueled vehicle may not be justified, and buyers may opt for gasoline vehicles. Additionally, for some users where fuel costs are a marginal decision driver, the increased purchase costs for diesel engines that comply with 2010 emissions standards are driving a shift toward spark-ignited (gasoline) engines. The standard practice of modifying medium-duty vehicles and working with multiple suppliers to complete a vehicle purchase provides an opportunity to integrate natural gas engines and fuel systems without significantly altering the typical medium-duty vehicle purchase process.
The light- and medium-duty vehicle markets are predominately composed of mass-produced vehicles in a few common configurations. Nearly every fleet utilizes light- and medium-duty vehicles to some degree.
3.4 Light- and Medium-Duty Vehicle Types
10 Automotive Fleet. “Fact Book.” www.fleet-central.com. 2012.11 See the Light- and Medium-Duty Vehicle Ownership and Production report of the overall TIAX assessment.
13
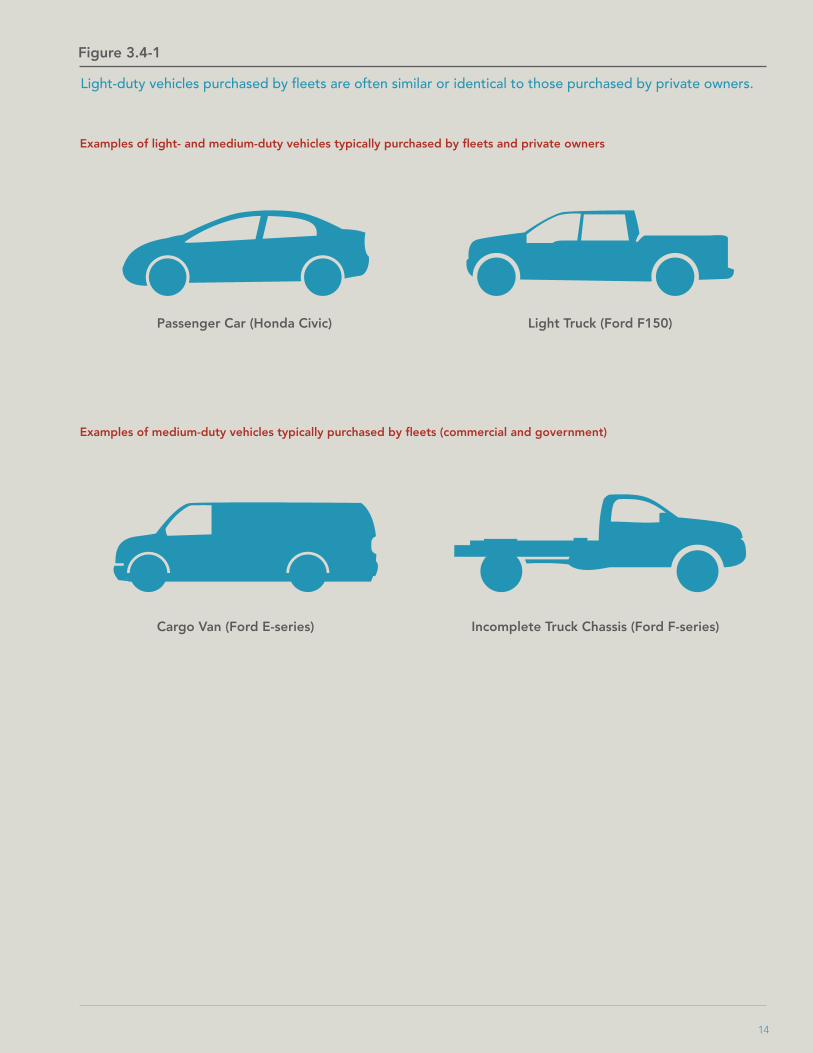
Figure 3.4-1
Light-duty vehicles purchased by fleets are often similar or identical to those purchased by private owners.
Examples of light- and medium-duty vehicles typically purchased by fleets and private owners
Examples of medium-duty vehicles typically purchased by fleets (commercial and government)
Passenger Car (Honda Civic)
Cargo Van (Ford E-series)
Light Truck (Ford F150)
Incomplete Truck Chassis (Ford F-series)
14

3 Vehicle Market Segments
the light-duty market. Based on fuel use and vehicle population data,13 it is estimated that passenger cars consume approximately 557 GGE of fuel per vehicle annually, and light-duty trucks consume 700 GGE per vehicle annually. The higher fuel consumption in the light-duty truck segment is a combination of two factors: lower fuel economy compared to passenger cars and higher fraction of ownership by commercial owners as opposed to private owners.
As shown in Figure 3.5-1, light-duty vehicles in North America are predominately gasoline fueled. This is largely a result of the lower acquisition cost of gasoline vehicles compared to diesel vehicles, but other factors also come into play (e.g., emissions standards). In the light-duty segment, purchase price rather than fuel costs tends to be a much larger component of total ownership costs, due to low annual fuel consumption. Thus, even though diesel passenger cars generally offer significant fuel efficiency benefits compared to comparable gasoline vehicles, they currently constitute a very small part of the passenger car market, and this trend is unlikely to change in the near future. In contrast, for the medium-duty market, the predominant fuel has been diesel because of the importance of fuel costs in total ownership costs. However, gasoline has recently gained market share in the medium-duty market due to recent increases in the purchase, operation, and maintenance costs of new diesel engines. These increased costs are primarily attributable to the addition of costly and complex systems to meet stricter emissions regulations for diesel engines and are unlikely to change dramatically over the next few years. Because these increased costs affect not only the acquisition cost of the vehicle but also the operating and maintenance costs, medium-duty vehicle purchasers are more frequently adopting spark-ignited (gasoline) engines. The willingness of medium-duty vehicle purchasers to select spark-ignited engines opens the door to natural gas in this market segment because vehicle performance and reliability will be similar to gasoline engines while potentially providing significant fuel cost savings over gasoline or diesel.
Light-duty vehicles are the most numerous of all the market segments, accounting for 85 percent of the total on-road fleet by vehicle count.12 These vehicles also use the least fuel on a per-vehicle basis. Together, light-duty and light medium-duty vehicles consume about three-quarters of total U.S. vehicle fuel but at a lower per-vehicle fuel consumption rate than the heavy-duty market. Light- and medium-duty vehicles are predominately fueled with gasoline, although heavier (Class 2b and Class 3) medium-duty vehicles commonly use diesel.
Light-duty vehicles, by population, are predominately privately owned and used for personal transportation. Whether used for travel to work or other domestic needs, most privately owned vehicles are used for a small portion of the day. In contrast, commercial owners average twice the annual mileage of private users in
Light-duty cars and trucks are the most numerous vehicles and as a market segment consume the most fuel but use the least fuel per vehicle.
3.5 Light- and Medium-Duty Population and Fuel Use
12 U.S. DOE Energy Efficiency and Renewable Energy. “Transportation Energy Data Book.” Edition 31. 2012. Includes passenger cars and light trucks through Class 2a. 13 Ibid.
15
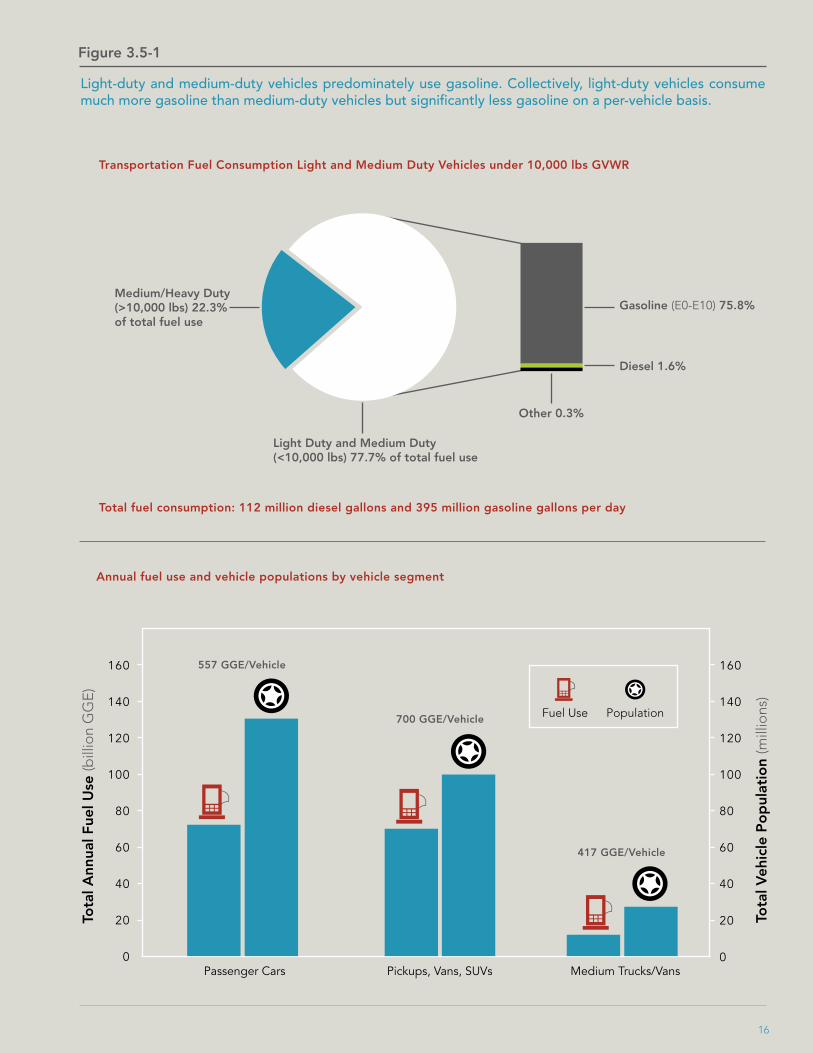
Figure 3.5-1
Light-duty and medium-duty vehicles predominately use gasoline. Collectively, light-duty vehicles consume much more gasoline than medium-duty vehicles but significantly less gasoline on a per-vehicle basis.
Transportation Fuel Consumption Light and Medium Duty Vehicles under 10,000 lbs GVWR
Total fuel consumption: 112 million diesel gallons and 395 million gasoline gallons per day
Tota
l Ann
ual F
uel U
se (b
illio
n G
GE
)
Tota
l Veh
icle
Po
pul
atio
n (m
illio
ns)
Annual fuel use and vehicle populations by vehicle segment
Medium/Heavy Duty (>10,000 lbs) 22.3% of total fuel use
Light Duty and Medium Duty (<10,000 lbs) 77.7% of total fuel use
Other 0.3%
Diesel 1.6%
Gasoline (E0-E10) 75.8%
160
80
120
40
140
60
100
20
0
160
80
120
40
140
60
100
20
0Passenger Cars
557 GGE/Vehicle
700 GGE/Vehicle
417 GGE/Vehicle
Pickups, Vans, SUVs Medium Trucks/Vans
PopulationFuel Use
16

3 Vehicle Market Segments
Heavy-duty vehicles are built for specific applications and are generally built to order for each customer.
3.6 Heavy-Duty Vehicle Types
Vocational trucks are typically ordered from the truck OEM with only the cab attached to the vehicle chassis. The truck is shipped from the OEM to a body builder that installs a customized body to the vehicle chassis. This is the same process that is used in the medium-duty market when specialized truck bodies are required. In the heavy-duty market, however, the vehicle purchaser typically has many more choices in configuring the vehicle chassis, cab, and engine. Because of the ability to customize the body and chassis, it is possible for the customer to purchase almost any vocational truck as a natural gas truck, provided at least one vehicle OEM offers a natural gas option for the base vehicle chassis. For example, Freightliner currently offers its M2-112 chassis with the Cummins ISL-G natural gas engine. As shown in Figure 3.6-1, this chassis can support a wide variety of vocational truck bodies as well as a semi-truck configuration. However, this chassis is designed for Class 7 and Class 8 applications and would not be ideal for Class 4 to Class 6 vehicles. Where natural gas options are not available from the vehicle OEM on a chassis in the proper weight class for a particular application, vocational truck purchasers must utilize SVMs to provide natural gas engine conversions. As with medium-duty vehicles, the standard practice of customizing heavy-duty vehicles provides an opportunity to integrate natural gas engines and fuel systems without significantly altering the typical heavy-duty vehicle purchase process.
Semi-trucks do not employ specialized bodies but instead use a fifth wheel to connect to and haul various semi-trailers. Despite the lack of a specialized body, semi-trucks are no less customized by the vehicle purchaser. Because semi-trucks travel more miles annually than any other vehicle type, fleets invest a great deal of time determining the precise combinations of engine, transmission, and drive train that will maximize fuel economy and minimize operating costs.
The heavy-duty market contains a diverse population of vehicles and can be separated into two general groups: vocational trucks and semi-trucks. Vocational trucks have specialty (purpose-built) bodies and support equipment; examples include cement mixers, street sweepers, and refuse trucks. This generally restricts their use to their intended application. Semi-trucks retain versatility by connecting to different trailers but are generally used for goods movement. While vocational trucks may be the most highly customized heavy-duty vehicles, both vocational and semi-trucks can be offered in thousands of configuration options by OEMs and numerous aftermarket vehicle modifiers.
17

Figure 3.6-1
As shown by these examples of four heavy-duty truck bodies on a single chassis, many heavy-duty vehicles are highly customized and intended for use in a specific application.
Semi-Truck
Tanker Truck
Fire Truck
Dump Truck
18
3 Vehicle Market Segments
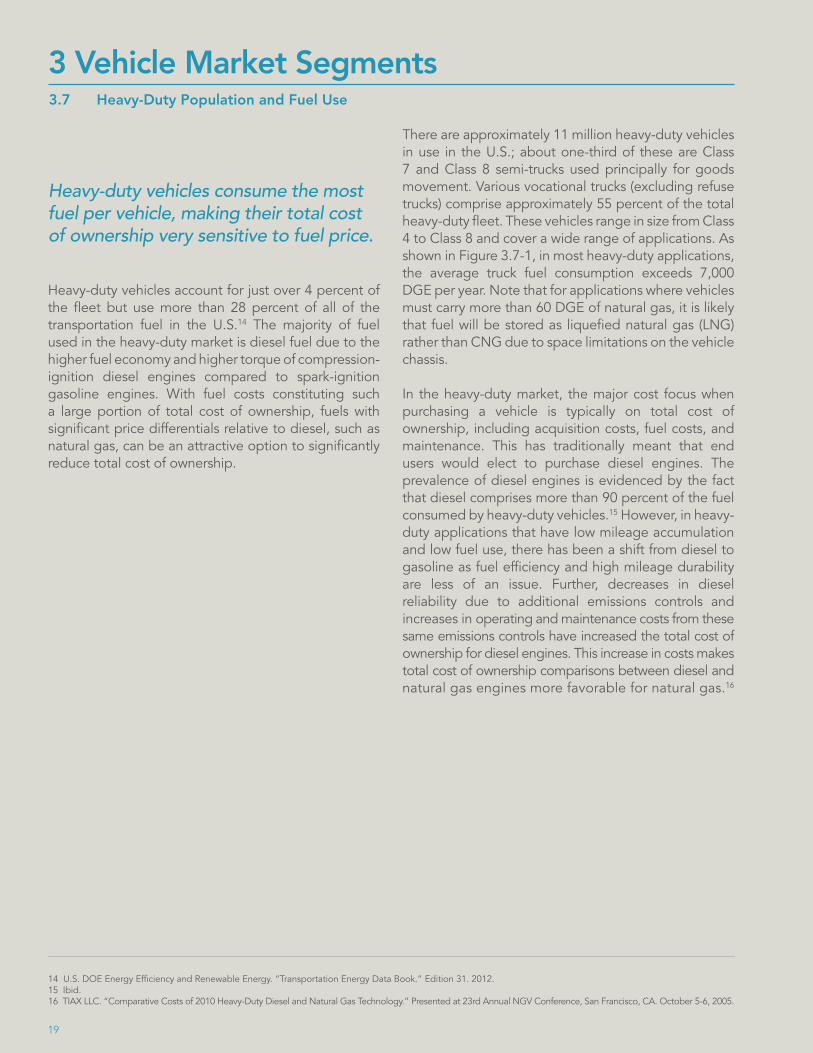
Heavy-duty vehicles consume the most fuel per vehicle, making their total cost of ownership very sensitive to fuel price.
3.7 Heavy-Duty Population and Fuel Use
There are approximately 11 million heavy-duty vehicles in use in the U.S.; about one-third of these are Class 7 and Class 8 semi-trucks used principally for goods movement. Various vocational trucks (excluding refuse trucks) comprise approximately 55 percent of the total heavy-duty fleet. These vehicles range in size from Class 4 to Class 8 and cover a wide range of applications. As shown in Figure 3.7-1, in most heavy-duty applications, the average truck fuel consumption exceeds 7,000 DGE per year. Note that for applications where vehicles must carry more than 60 DGE of natural gas, it is likely that fuel will be stored as liquefied natural gas (LNG) rather than CNG due to space limitations on the vehicle chassis.
In the heavy-duty market, the major cost focus when purchasing a vehicle is typically on total cost of ownership, including acquisition costs, fuel costs, and maintenance. This has traditionally meant that end users would elect to purchase diesel engines. The prevalence of diesel engines is evidenced by the fact that diesel comprises more than 90 percent of the fuel consumed by heavy-duty vehicles.15 However, in heavy-duty applications that have low mileage accumulation and low fuel use, there has been a shift from diesel to gasoline as fuel efficiency and high mileage durability are less of an issue. Further, decreases in diesel reliability due to additional emissions controls and increases in operating and maintenance costs from these same emissions controls have increased the total cost of ownership for diesel engines. This increase in costs makes total cost of ownership comparisons between diesel and natural gas engines more favorable for natural gas.16
Heavy-duty vehicles account for just over 4 percent of the fleet but use more than 28 percent of all of the transportation fuel in the U.S.14 The majority of fuel used in the heavy-duty market is diesel fuel due to the higher fuel economy and higher torque of compression-ignition diesel engines compared to spark-ignition gasoline engines. With fuel costs constituting such a large portion of total cost of ownership, fuels with significant price differentials relative to diesel, such as natural gas, can be an attractive option to significantly reduce total cost of ownership.
14 U.S. DOE Energy Efficiency and Renewable Energy. “Transportation Energy Data Book.” Edition 31. 2012. 15 Ibid.16 TIAX LLC. “Comparative Costs of 2010 Heavy-Duty Diesel and Natural Gas Technology.” Presented at 23rd Annual NGV Conference, San Francisco, CA. October 5-6, 2005.
19
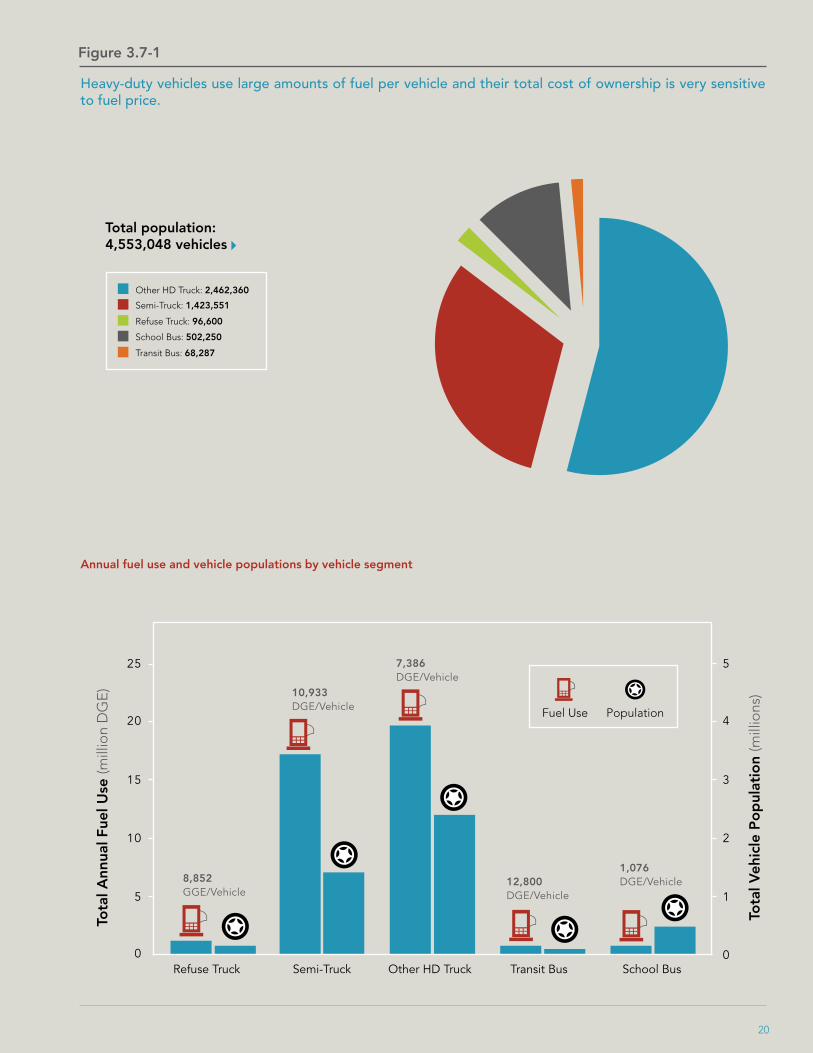
Figure 3.7-1
Heavy-duty vehicles use large amounts of fuel per vehicle and their total cost of ownership is very sensitive to fuel price.
Total population: 4,553,048 vehicles
Other HD Truck: 2,462,360
Semi-Truck: 1,423,551
School Bus: 502,250
Refuse Truck: 96,600
Transit Bus: 68,287
Tota
l Ann
ual F
uel U
se (m
illio
n D
GE
)
Tota
l Veh
icle
Po
pul
atio
n (m
illio
ns)
Annual fuel use and vehicle populations by vehicle segment
525
420
315
210
15
0 0Refuse Truck Semi-Truck
8,852 GGE/Vehicle
10,933 DGE/Vehicle
12,800 DGE/Vehicle
7,386 DGE/Vehicle
1,076 DGE/Vehicle
Other HD Truck Transit Bus School Bus
20
PopulationFuel Use

4 Characteristics of Vehicle Market Segments
Market segments are unique and complex, with many specific vehicle applications. However, several common criteria can be used to broadly compare vehicle applications with regard to the use of natural gas as a vehicle fuel.
4.1 Overview
“Base” refers to the location where the vehicle is parked or stored when not in operation. Return-to-base applications, where the vehicle is returned to the same location each day, are the most conducive to NGV use because they allow for daily refueling, thereby minimizing onboard fuel storage requirements. These return-to-base applications often include centralized maintenance facilities and staff, allowing a few trained technicians to support numerous NGVs.
“Fueling Infrastructure” describes the typical method of refueling employed for a particular vehicle application as well as the potential for adding natural gas fueling infrastructure. Fleets that fuel their vehicles at fleet yards or operations centers (e.g. warehouses and ports) are best positioned to utilize nearby public fueling stations or install fleet-controlled natural gas fueling equipment.
“Vehicle Availability” describes the number and types of vehicles currently available for a particular application. In general, more vehicle and engine options help ensure that NGVs will be suitable to vehicle users within an application. OEM-provided options provide a single responsible party for warranty and service, making these offerings more appealing.
“Fuel Cost Sensitivity” considers the relative importance of fuel costs to other vehicle purchase and operating costs. In general, high fuel consumption applications are highly sensitive to fuel costs. Low fuel consumption applications tend to be more sensitive to purchase and maintenance costs.
“Environmental Policies” as a criterion attempts to describe whether vehicle users within a particular application are sufficiently motivated by internal policies or external regulations to make vehicle purchase decisions based on the relative environmental impacts of the vehicles. It is important to remember that the requirements and evaluations for each application are broad and high level. Given the diversity and complexity of the North American vehicle market, it is certain that many exceptions to these broad evaluations exist.
The following sections describe the attributes of several key specific vehicle segments within the overall market segments discussed above. In addition, several sub-segments are described that represent common types of operation within the broader segments. For example, the package delivery sub-segment of vehicles is described as it involves pickup and delivery operations that are very different from other sub-segments like utility trucks. The goal is to provide a high level description of these key market segments as they relate to the use of natural gas. To provide a consistent basis on which to compare the segments, each segment is evaluated with respect to six key criteria, as defined further below and ranked in Table 4.1-1.
“Range” describes the typical daily operating range of vehicles in a particular application. Range is given in miles traveled for on-road applications and operating hours for off-road applications. In most applications, whether on-road or off-road, it is preferred by vehicle users that the vehicle carry enough fuel to operate for several days or be able to miss a typical refueling event without running out of fuel. This provides the user with some margin of error if daily operations deviate from the norm. At a minimum, it is assumed that a vehicle must carry enough fuel to work through an entire shift or typical day of operation.
21
Table 4.1-1
Six criteria are used for assessing market segment characteristics regarded suitability to NGV use.
Rank/Symbol Good Fair Weak
RangeDaily mileage allows refuel-ing less than once per day
Daily mileage allows refueling once per day
Daily range requires multiple refuelings per day
Base Return to fixed base location Return to base, base location may change
Long range, no single base location
Fueling InfrastructureFleet controlled or reliable pub-licly available fueling stations
Few publicly available stations, stations not controlled by fleet
Little fueling infrastruc-ture, fuel shipped in and vehicle wet fueled
Vehicle Availability
OEMs producing numerous natural gas vehicles and/or offering natural gas configu-ration options
A few NG vehicles offered by OEMs and converters but choices are very constrained
Only prototypes or conversions available
Fuel Cost SensitivityHigh fuel use application with high cost sensitivity, fuel is a major cost component
Moderate cost sensitivity, fuel prices affect operating behavior and/or services offered, fuel is a significant cost component
Low or inelastic de-mand response to fuel price changes
Environmental PoliciesEstablished policies/protocols regarding fleet impact reduction
Reductions in environmental impacts considered a secondary benefit in fleet purchase decisions
Does not place a value on fleet impacts
DEFINITIONS*
Good: Strongly enables the use of NGVs with the current state of the NGV market, or Provides significant benefits from the use of NGVs
Fair: Provides limited options to enable the use of NGVs or needs additional development, or Provides modest benefits from the use of NGVs
Weak: Requires significant additional development to enable the use of NGVs, or Provides no benefits from the use of NGVs or increases overall costs
*Note that the assessment of any criterion for any application as good, fair, or weak is subject to change as the markets and various external pressures change.
22
4 Characteristics of Vehicle Market Segments
Light-duty passenger cars and trucks owned by private consumers represent the single largest vehicle market, but purchase decisions are driven by a number of factors beyond total cost of ownership.
4.2 Light-duty Passenger Cars and Trucks (Private)
Fueling Infrastructure - In certain regions, particularly dense urban areas, natural gas fueling infrastructure is accessible by the general public. However, outside these regions, fueling infrastructure may be sparse. This is the primary reason for consumer concerns regarding range for infrequent but long range travel. Establishing fueling infrastructure along strategic corridors, coupled with high visibility to consumers that natural gas is available, can help mitigate these concerns. Additionally, OEM offerings of bi-fuel NGVs can address infrastructure and range concerns at the cost of certainty that natural gas will be used as the primary fuel in the vehicle.
Vehicle Availability - Currently, the Honda Civic Natural Gas is the only passenger car offered by an OEM. Additionally, Ford and GM offer light-duty trucks equipped with “vehicle prep packages” that prepare the vehicle for conversion by aftermarket converters. The current selection of NGVs is small in comparison to the broad range of consumer vehicle choices in the light-duty market and requires an aftermarket conversion in most light-duty sub-segments.
Fuel Cost Sensitivity - The typical replacement cycle for passenger cars and light trucks is approximately six years.18 This, coupled with the relatively low annual fuel consumption, means that acquisition costs for the vehicle are significantly greater than the fuel costs over the life of the vehicle. Consumers have also demonstrated a generally inelastic demand response to fuel prices in the short term and long term.19 That is, consumers do not purchase less gas until fuel prices increase significantly. Increases in gasoline prices from additional taxes or decreases in natural gas prices from incentives or utility level pricing could widen the price spread sufficiently to motivate additional consumers.
Environmental Policies - Consumers place various levels of value on the reduction of environmental impacts; some consumers are willing to pay more for environmental benefits, but many are not.
The majority of light-duty vehicles are passenger cars and trucks owned by private consumers for the purpose of personal transportation. These applications are typified by low fuel use (575 to 825 GGE per year), and markets are primarily driven by consumer preferences rather than total cost of ownership calculations (Figure 4.2-1).
Range - Privately owned passenger cars and light-duty trucks travel, on average, 30 miles per day, a range easily attainable by NGVs. For example, the 2012 Honda Civic Natural Gas has an estimated range of 249 miles based on a combined EPA mileage rating of 31 miles per gallon and a 8.03 gallon onboard fuel capacity,17 providing several days of fuel for the average user.
Base - Private users generally return their vehicles to their home at the end of the day. Therefore, the user is able to become familiar with the existing fueling infrastructure and possibly install personal natural gas fueling infrastructure.
17 Honda. “2012 Honda Civic Natural Gas - Specifications.” http://automobiles.honda.com/civic-natural-gas/specifications.aspx. Accessed August 2012.18 Edmunds AutoObserver. “Car Owners Hanging Onto Their Current Rides.” http://www.autoobserver.com/2009/02/car-owners-hanging-onto-their-current-rides.html. February 2009.19 U.S. Federal Trade Commission. “Gasoline Price Changes: The Dynamics of Supply, Demand, and Competition.” 2005.
23

Figure 4.2-1
Light-duty passenger cars and trucks are the largest market segment by vehicle count and offer some market potential for NGVs.
Example NGVsHonda Civic Natural Gas, Ford F150 (BAF conversion, Chevrolet Malibu (IMPCO, Natural Drive conversions))
Common refueling locations Local public stations
Typical daily range 30 miles20
Average age at first replacement 6 years
Honda Civic Natural Gas
Ford F150 CNG Truck Home Fueling Appliance
Good Fair Weak
Vehicle Type/Application
Range BaseFueling
InfrastructureVehicle
AvailabilityFuel Cost Sensitivity
EnvironmentalPolicies
Passenger Car/Light Truck (Private)
20 U.S. DOE Energy Efficiency and Renewable Energy. “Transportation Energy Data Book.” Edition 31. 2012.
24

4 Characteristics of Vehicle Market Segments
Light-duty passenger cars and trucks owned by commercial and government fleets are generally the same basic vehicles offered to the private consumer market but may be modified for a specific job. Vehicle acquisition costs exceed fuel costs over the life of the vehicle, but environmental policies may drive some purchase decisions.
4.3 Light-Duty Passenger Cars and Trucks (Commercial/Government)
Fueling Infrastructure - Small fleets may rely on public fueling infrastructure or make use of personal fueling devices. Large fleets may also rely on public fueling infrastructure or install their own fueling equipment in conjunction with natural gas utilities and fuel providers. Initial capital costs and/or ongoing station maintenance may be deterrents to some fleets to the installation of their own fueling equipment, but tax credits and financial incentives may offset some of these concerns.
Vehicle Availability - Currently, the Honda Civic Natural Gas is the only passenger car offered by an OEM. GM has announced the availability of a CNG option for its Savanna full size van later this year. Additionally, Ford and GM offer light-duty trucks equipped with “vehicle prep packages” that prepare the vehicle for conversion by aftermarket converters. OEMs typically offer additional natural gas options to commercial/government customers, providing more choices than in the private consumer market. However, the availability of NGVs still does not provide OEM options in most light-duty market sub-segments.
Fuel Cost Sensitivity - The typical replacement cycle for passenger cars and light trucks in government and commercial fleets is shorter than private fleets at approximately three years.28 This is, in part, a function of the higher annual mileage of commercial fleets compared to private consumers. While annual fuel consumption increases with mileage, acquisition costs for the vehicle are still typically greater than the fuel costs over the life of the vehicle. Increases in gasoline prices from additional taxes or decreases in natural gas prices or utility level pricing could widen the price spread sufficiently to motivate more fleets to adopt natural gas.
Environmental Policies - Most government fleets are subject to environmental policies that affect fleet purchase decisions. Many commercial fleets are adopting environmental policies, but many of these policies only require tracking of fleet impacts and do not drive purchase decisions.
Commercial light-duty vehicles are passenger cars and trucks owned by companies for business-related activities. Annual mileage in these applications is approximately twice that of private consumers, with a corresponding increase in annual fuel consumption (Figure 4.3-1). Federal fleet vehicles have lower average annual miles than commercial fleet vehicles, similar to private consumers.
Range - It is estimated that the average daily range for light-duty business vehicles is approximately 100 miles, well within the range of most NGVs. Some high fuel use light-duty applications like taxis may require fueling at least once a day. This does not preclude successful application of NGVs to these markets, as evidenced by the ongoing successful use of natural gas taxis in the U.S. Applications requiring daily, long range driving will encounter the same range limitations based on available fueling infrastructure as seen in the private consumer market.
Base - Vehicles are commonly returned to the same location each night. In large fleets, the base is typically a commercial or government fleet yard with centralized fueling and maintenance.
25

Figure 4.3-1
Commercial and government users of light-duty passenger cars and trucks use the same vehicles as private consumers but typically with higher annual usage and also offer some market potential for NGVs.
Example NGVsHonda Civic Natural Gas, GMC Savanna, Ford Crown Victoria (BAF conversion)
Common refueling locations Public stations, fleet yards
Typical daily range 100 miles21
Average age at first replacement 3 years22
Honda Civic Natural Gas
Ford Crown Victoria
Good Fair Weak
GMC Savanna CNG Van
Vehicle Type/Application
Range BaseFueling
InfrastructureVehicle
AvailabilityFuel Cost Sensitivity
EnvironmentalPolicies
Passenger Car/Light Truck (Commercial)
21 U.S. DOE Energy Efficiency and Renewable Energy. “Transportation Energy Data Book.” Edition 31. 2012. Calculated from annual VMT assuming 250 work days per year. 22 Ibid.
26
4 Characteristics of Vehicle Market Segments
Medium-duty vehicles have shorter average range than light-duty vehicles but consume more fuel per vehicle. High fuel consumption applications like pickup and delivery services can be very sensitive to fuel costs.
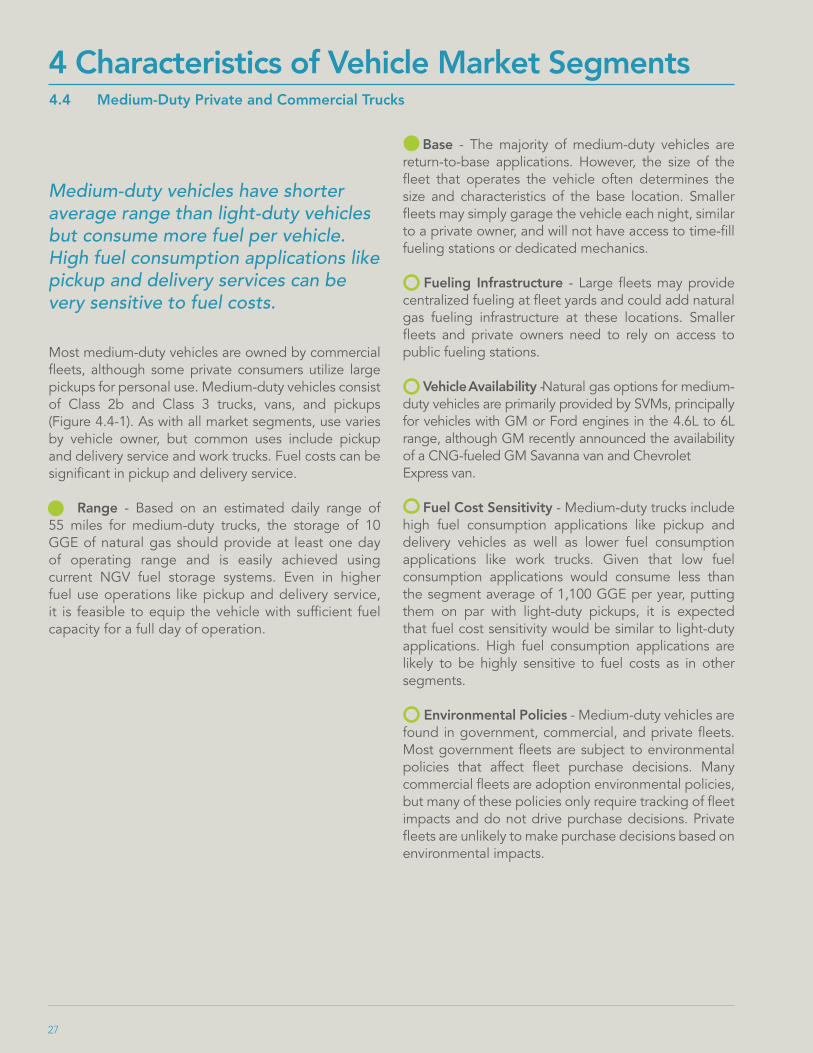
4.4 Medium-Duty Private and Commercial Trucks
Base - The majority of medium-duty vehicles are return-to-base applications. However, the size of the fleet that operates the vehicle often determines the size and characteristics of the base location. Smaller fleets may simply garage the vehicle each night, similar to a private owner, and will not have access to time-fill fueling stations or dedicated mechanics.
Fueling Infrastructure - Large fleets may provide centralized fueling at fleet yards and could add natural gas fueling infrastructure at these locations. Smaller fleets and private owners need to rely on access to public fueling stations.
Vehicle Availability - Natural gas options for medium-duty vehicles are primarily provided by SVMs, principally for vehicles with GM or Ford engines in the 4.6L to 6L range, although GM recently announced the availability of a CNG-fueled GM Savanna van and Chevrolet Express van.
Fuel Cost Sensitivity - Medium-duty trucks include high fuel consumption applications like pickup and delivery vehicles as well as lower fuel consumption applications like work trucks. Given that low fuel consumption applications would consume less than the segment average of 1,100 GGE per year, putting them on par with light-duty pickups, it is expected that fuel cost sensitivity would be similar to light-duty applications. High fuel consumption applications are likely to be highly sensitive to fuel costs as in other segments.
Environmental Policies - Medium-duty vehicles are found in government, commercial, and private fleets. Most government fleets are subject to environmental policies that affect fleet purchase decisions. Many commercial fleets are adoption environmental policies, but many of these policies only require tracking of fleet impacts and do not drive purchase decisions. Private fleets are unlikely to make purchase decisions based on environmental impacts.
Most medium-duty vehicles are owned by commercial fleets, although some private consumers utilize large pickups for personal use. Medium-duty vehicles consist of Class 2b and Class 3 trucks, vans, and pickups (Figure 4.4-1). As with all market segments, use varies by vehicle owner, but common uses include pickup and delivery service and work trucks. Fuel costs can be significant in pickup and delivery service.
Range - Based on an estimated daily range of 55 miles for medium-duty trucks, the storage of 10 GGE of natural gas should provide at least one day of operating range and is easily achieved using current NGV fuel storage systems. Even in higher fuel use operations like pickup and delivery service, it is feasible to equip the vehicle with sufficient fuel capacity for a full day of operation.
27

Figure 4.4-1
Medium-duty vehicle chassis are mass produced, and customized bodies are added based on customer needs. Medium-duty vehicles may offer significant market potential for NGVs.
Example NGVs Varies
Common refueling locations Fleet yards, Local public gas stations
Typical daily range 55 miles23
Average age at first replacement Varies
Ford E-series Cutaway
Good Fair Weak
Isuzu NPR Eco-Max
Vehicle Type/Application
Range BaseFueling
InfrastructureVehicle
AvailabilityFuel Cost Sensitivity
EnvironmentalPolicies
Medium-Duty Private and Commercial Truck
Ford E-Series Cargo Van Ford F-series Incomplete Truck
23 U.S. DOE Energy Efficiency and Renewable Energy, “Transportation Energy Data Book.” Edition 31. 2012. Estimate based on average annual mileage for Class 3 trucks, assuming 250 work days per year.
28

4 Characteristics of Vehicle Market Segments
As a segment, package delivery vehicles have several attributes that are conducive to natural gas adoption, including high fuel consumption and high sensitivity to fuel costs.
4.5 Heavy-Duty: Package Delivery Vehicles
Base - Most package delivery vehicles are returned to fleet yards for fueling and maintenance. This environment is generally the most conducive to the introduction of new vehicles and fueling infrastructure.
Fueling Infrastructure - Most package delivery vehicles are fueled at the fleet yards as this provides the fleet with some ability to control fuel costs. Given proper route selection, most package delivery vehicles can operate from a single fueling location at the fleet yard. This model of fueling should be directly applicable to NGVs.
Vehicle Availability - Like most heavy-duty vehicles, package delivery vans are typically custom built. This allows fleet purchasers to specify a natural gas fuel system for a given vehicle type without necessarily causing significant increases in delivery lead time. However, no major engine OEM currently offers a natural gas engine in the 4.6L to 6L displacement range typical of package delivery cars. With the exit of Freightliner Custom Chassis from this market segment, there is a need for other OEMs to provide a natural gas package van option.
Fuel Cost Sensitivity - Purchasing fuel constitutes a major cost of operating package delivery trucks, outstripping maintenance costs. Given the cost-sensitive nature of package delivery service, fleet operators in this segment are likely to strongly value the lower fuel costs associated with operating NGVs in package delivery service.
Environmental Policies - All three major package delivery firms in the U.S. (FedEx, UPS, and the United States Postal Service) have adopted policies to reduce environmental impacts from their fleets, produce annual reports on their efforts, and purchase and demonstrate vehicles based on their environmental policies.
A typical package delivery car will be driven by the original purchaser until it is scrapped, approximately twenty years. During this time, fuel costs are the major component of operating costs.24 Further, package delivery is a narrow margin business and minimizing fleet costs is a priority. Given these economic conditions and the proven use by UPS of more than 1,000 NGVs (Figure 4.5-1),25 the package delivery segment could be a strong adopter of natural gas.
Range - Average daily ranges for package delivery vehicles vary by route, but an analysis of U.S. Census Bureau Vehicle Inventory and Use Survey (VIUS) data for similar step vans suggests an average daily range of 65 miles. Given the highly organized nature of the major package delivery firms with regard to routes, these companies could select routes that would allow an NGV to operate with a comfortable range margin.
24 National Renewable Energy Laboratory. “UPS CNG Truck Fleet Final Results.” 2002. Fuel costs estimated as a percentage of total operating costs per mile based on scaling fuel prices given in the report to $3.00 per DGE.
25 UPS. “UPS Deploys 245 New ‘Green’ Trucks.” Press release. January 2010.
29
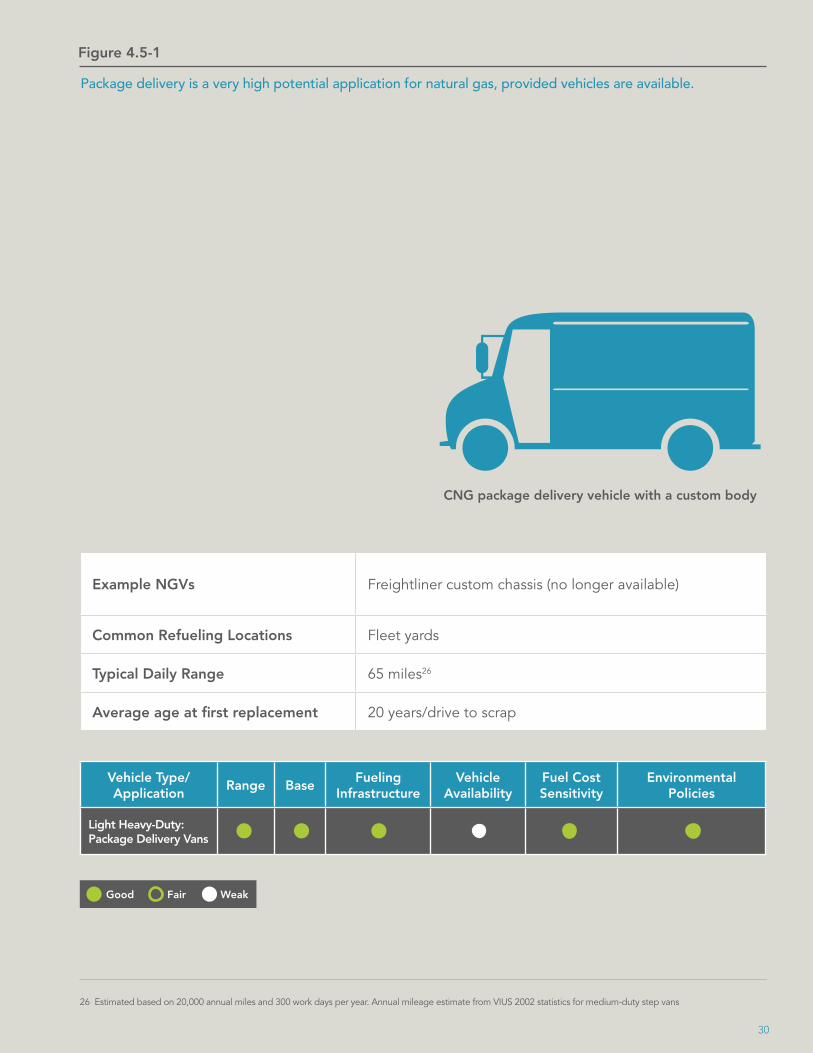
Figure 4.5-1
Package delivery is a very high potential application for natural gas, provided vehicles are available.
Good Fair Weak
Vehicle Type/Application
Range BaseFueling
InfrastructureVehicle
AvailabilityFuel Cost Sensitivity
EnvironmentalPolicies
Light Heavy-Duty: Package Delivery Vans
Example NGVs Freightliner custom chassis (no longer available)
Common Refueling Locations Fleet yards
Typical Daily Range 65 miles26
Average age at first replacement 20 years/drive to scrap
CNG package delivery vehicle with a custom body
26 Estimated based on 20,000 annual miles and 300 work days per year. Annual mileage estimate from VIUS 2002 statistics for medium-duty step vans
30
27 Tomic, J., B. Van Amburg. “Heavy-Duty Hybrid Utility Trucks – HTUF Deployment Experiences and Results.” Presented at EVS-23, Anaheim, CA. 2007.
4 Characteristics of Vehicle Market Segments
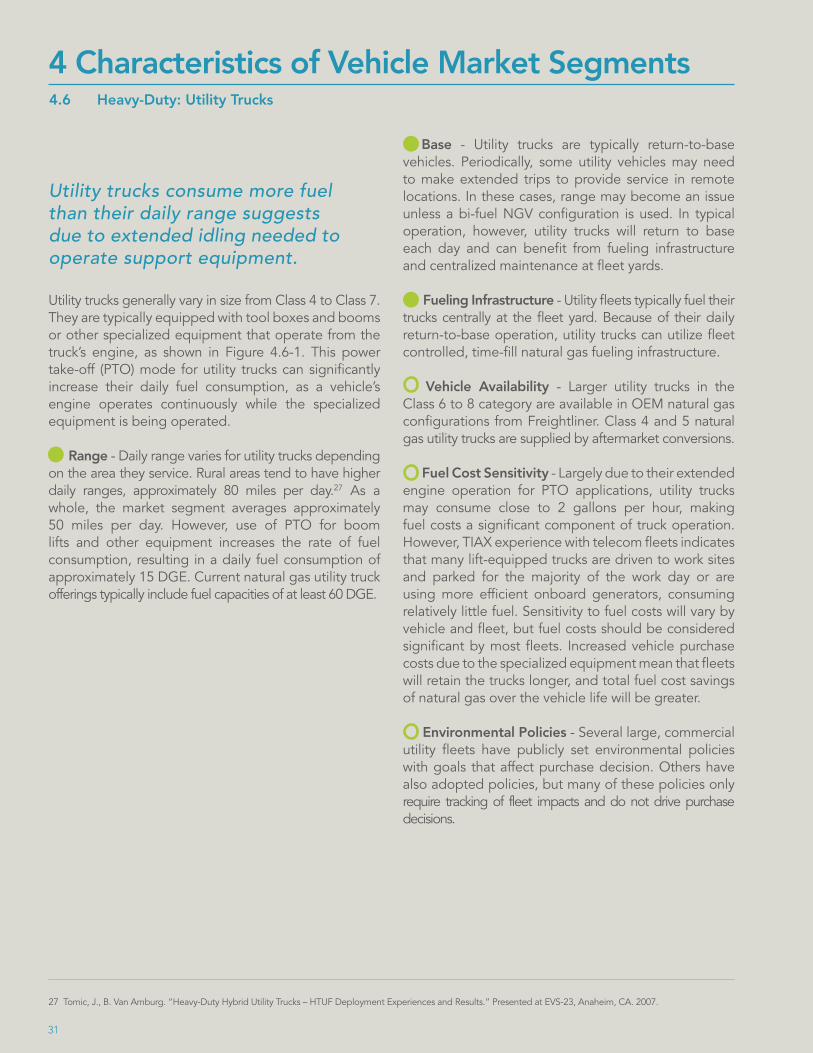
Utility trucks consume more fuel than their daily range suggests due to extended idling needed to operate support equipment.
4.6 Heavy-Duty: Utility Trucks
Base - Utility trucks are typically return-to-base vehicles. Periodically, some utility vehicles may need to make extended trips to provide service in remote locations. In these cases, range may become an issue unless a bi-fuel NGV configuration is used. In typical operation, however, utility trucks will return to base each day and can benefit from fueling infrastructure and centralized maintenance at fleet yards.
Fueling Infrastructure - Utility fleets typically fuel their trucks centrally at the fleet yard. Because of their daily return-to-base operation, utility trucks can utilize fleet controlled, time-fill natural gas fueling infrastructure.
Vehicle Availability - Larger utility trucks in the Class 6 to 8 category are available in OEM natural gas configurations from Freightliner. Class 4 and 5 natural gas utility trucks are supplied by aftermarket conversions.
Fuel Cost Sensitivity - Largely due to their extended engine operation for PTO applications, utility trucks may consume close to 2 gallons per hour, making fuel costs a significant component of truck operation. However, TIAX experience with telecom fleets indicates that many lift-equipped trucks are driven to work sites and parked for the majority of the work day or are using more efficient onboard generators, consuming relatively little fuel. Sensitivity to fuel costs will vary by vehicle and fleet, but fuel costs should be considered significant by most fleets. Increased vehicle purchase costs due to the specialized equipment mean that fleets will retain the trucks longer, and total fuel cost savings of natural gas over the vehicle life will be greater.
Environmental Policies - Several large, commercial utility fleets have publicly set environmental policies with goals that affect purchase decision. Others have also adopted policies, but many of these policies only require tracking of fleet impacts and do not drive purchase decisions.
Utility trucks generally vary in size from Class 4 to Class 7. They are typically equipped with tool boxes and booms or other specialized equipment that operate from the truck’s engine, as shown in Figure 4.6-1. This power take-off (PTO) mode for utility trucks can significantly increase their daily fuel consumption, as a vehicle’s engine operates continuously while the specialized equipment is being operated.
Range - Daily range varies for utility trucks depending on the area they service. Rural areas tend to have higher daily ranges, approximately 80 miles per day.27 As a whole, the market segment averages approximately 50 miles per day. However, use of PTO for boom lifts and other equipment increases the rate of fuel consumption, resulting in a daily fuel consumption of approximately 15 DGE. Current natural gas utility truck offerings typically include fuel capacities of at least 60 DGE.
31

Figure 4.6-1
Utility trucks are often equipped with additional equipment that is powered from the truck, leading to higher fuel consumption, and may offer significant market potential for NGVs.
Good Fair Weak
Vehicle Type/Application
Range BaseFueling
InfrastructureVehicle
AvailabilityFuel Cost Sensitivity
EnvironmentalPolicies
Light Heavy-Duty: Utility Trucks
Example NGVs International 4300 with Emissions Solutions DT466 conversion, Freightliner M2-112 with OEM equipped Cummins ISL-G
Common Refueling Locations Fleet yards
Typical Daily Range 50 miles28
Average age at first replacement Varies
Utility truck with a man-lift that is often powered by the engine
28 Estimated based on 12,750 annual miles and 250 work days per year. Annual mileage estimate from VIUS 2002 statistics for medium-duty and light-heavy-duty utility trucks.
32
29 Based on VIUS 2002 annual mileage data for utility body straight trucks.30 Based on conversations with Los Angeles Freightliner sales staff.
4 Characteristics of Vehicle Market Segments
Drive cycles and routes are highly variable for the numerous types of heavy-duty trucks active throughout North America. In many cases, these vehicles have relatively short range requirements and return to a centralized location at the end of the work shift.
4.7 Heavy-Duty: Vans, Stake/Flat Beds, and Others
Range - Assuming a typical five day work week, the average daily mileage for this segment is estimated to be approximately 55 miles.29 Because of the diversity of this segment, the mileage for certain applications is much higher than the average. This group includes refrigerated vans (reefers), pole trucks, basic enclosed vans, and curtain side trucks. These trucks are generally involved in the movement of goods and may average 50 percent more annual mileage than the segment average. However, even these higher mileage applications are unlikely to require more than 20 DGE per day. For return-to-base applications, equipping these trucks with sufficient fuel for one or more days of operation is typically possible.
Base - Most trucks in this segment are expected to return-to-base daily and can benefit from fueling infrastructure and centralized maintenance at fleet yards.
Fueling Infrastructure - Because of their daily return-to-base operation, many trucks can utilize fleet controlled, time-fill natural gas fueling infrastructure. Fleets that are not large enough to reasonably distribute the cost of personally controlled fueling infrastructure will be dependent on the availability of public stations.
Vehicle Availability - Trucks in the Class 6 to 8 category are available from Freightliner in many different vocational body configurations with an OEM natural gas option using the Cummins ISL-G engine and fuel capacities of up to 75 DGE for CNG and 95 DGE for LNG.30 A variety of aftermarket conversions from several converters are also available, and some trucks can be ordered from the factory with natural gas engine preparation packages.
Fuel Cost Sensitivity - Fuel cost sensitivity will vary strongly by application and is not directly linked to annual mileage due to variations in fuel economy and use of PTO equipment.
Environmental Policies - This market segment contains many fleets of all sizes that are commonly operated throughout North America. Environmental policies vary on a regional, state, and federal basis. Several larger commercial fleets and some governmental fleets have adopted strong policies that drive purchase decisions.
This section considers heavy-duty truck applications not described elsewhere in this report. These heavy-duty trucks include a wide range of Class 4 to Class 8 (14,001 to 33,000+ lbs GVWR) vehicles, with some of the most common body configurations shown in Figure 4.7-1. Drive cycles and routes are highly variable for the numerous types of heavy-duty trucks active throughout North America. In many cases, these vehicles have relatively short range requirements and return to a centralized location at the end of the work shift. As a broad segment, these trucks travel approximately 14,000 miles annually, but significant variations occur between applications and fleets. Because of the diversity of this group, the benefits of NGVs to the fleet owner must be evaluated on a fleet-by-fleet (and often vehicle-by-vehicle) basis.
33
Figure 4.7-1
Heavy-duty vocational trucks are available with a wide variety of customized chassis and bodies and offer some market potential for NGVs.
Good Fair Weak
Vehicle Type/Application
Range BaseFueling
InfrastructureVehicle
AvailabilityFuel Cost Sensitivity
EnvironmentalPolicies
Light Heavy-Duty: Other Trucks
Example NGVsInternational 4300, Freightliner M2-112, Ford E-450, Chevrolet Express
Common Refueling Locations Fleet yards, public fueling stations
Typical Daily Range 55 miles
Average age at first replacement Varies
Ford E-450 Incomplete Vehicle(BAF Technologies)
Chevrolet Express Cutaway with Box Van(Baytech)
Freightliner M2-112 Stake Truck
34

31 School Bus Fleet. “2009 North American School Bus Sales.” www.schoolbusfleet.com. Accessed October 2010.
4 Characteristics of Vehicle Market Segments
The importance of reducing the exposure of children to air toxics motivated the transition of more than 1,000 school buses to natural gas. However, school districts are generally cost constrained and rely on incentives to offset the incremental capital costs of natural gas.
4.8 Heavy-Duty: School Buses
Fueling Infrastructure - School buses are typically housed and fueled at one central location and thus are an anchor fleet. Initial investments into natural gas fueling infrastructure can be large but can also be utilized by a large fleet of buses and provide reasonable return on investment when fuel use is high. Furthermore, the ability to refuel overnight using time-fill natural gas stations, which fill at a slower rate than fast-fill stations, can help reduce infrastructure costs.
Vehicle Availability - Two of the largest school bus manufacturers, Bluebird and Thomas Built, currently offer a Type D (rear engine) natural gas school bus powered by the Cummins ISL-G engine. In 2009, only 13 percent of school bus sales were Type D compared to 67 percent for the more popular Type C (front engine) school bus.31 The size of the ISL-G prevents integration into the current Type C products. The smaller 7.1 L Emissions Solutions engine is available for Type C products as a SVM conversion. Type A and B buses may be available through SVMs as the buses are typically built on Ford and GM truck chassis (e.g. Ford E-450).
Fuel Cost Sensitivity - On average, school buses are relatively low fuel use applications compared to other heavy-duty segments, including transit buses. School districts are often cash-constrained, and the capital costs of adding natural gas infrastructure and the incremental vehicle costs can dominate purchase decisions. Incentives, particularly an alternative fuel vehicle incentive similar to that provided to transit buses by the Federal Transit Administration (FTA), would relieve much of the capital cost constraints of school bus fleet operators.
Environmental Policies - Several “clean school bus” programs have been implemented prior to 2010 at the federal and state levels with the laudable goal of reducing the exposure of children to diesel exhaust. Examples include California’s Lower Emitting School Bus Program, which helps school districts pay the extra capital or infrastructure costs associated with natural gas school buses. Such programs have provided much needed funding assistance for school bus operators to modernize their fleets. Schools continue to operate on very restricted budgets and rely on incentives to make the switch to clean fuels despite the recognition of the potential environmental benefits.
With over 500,000 school buses in North America, this market segment could be a significant consumer of natural gas. A focus on reducing environmental impacts to school children has helped establish several clean school bus programs, but many school districts still require incentives or other funding assistance to offset the incremental costs of natural gas buses (Figure 4.8-1).
Range - School districts have different range requirements depending on the area of coverage and route type. Well over 1,000 natural gas school buses have been deployed in North America, and most districts have some routes that could be well suited for service by natural gas school buses. Periodically, school buses may need to travel longer distances for special events such as field trips; depending on distance, such uses might be less conducive to using natural gas school buses.
Base - School buses, whether operated by a school district or a private operator, return to their base location frequently. In many cases, the bus will return to the yard twice a day, at the end of the day and between the morning and afternoon trips to pick up and drop off students. This allows school buses to benefit from centralized fueling and maintenance at fleet yards.
35
Figure 4.8-1
On average, school buses are short range applications that return to their fleet yard multiple times per day and offer some limited market potential for NGVs.
Good Fair Weak
Vehicle Type/Application
Range BaseFueling
InfrastructureVehicle
AvailabilityFuel Cost Sensitivity
EnvironmentalPolicies
Light Heavy-Duty: School Buses
Example NGVs Thomas Built Type D, Blue Bird Type D
Common Refueling Locations Fleet yards
Typical Daily Range 30 miles32
Average age at first replacement Varies
Type C or Type 3 (front engine) school bus
Type D or Type 4 (rear engine) school bus
32 School Bus Fleet. “2007-2008 School Transportation Statistics.” www.schoolbusfleet.com. Accessed October 2010.
36

33 Based on data from American Public Transportation Association, “2012 Public Transportation Fact Book,” March 2012.34 Ibid35 American Public Transportation Association. “Standard Bus Procurement Guidelines.” 2010.
4 Characteristics of Vehicle Market Segments
Transit buses have been one of the most successful segments for adoption of NGVs, in large part due to their high fuel use and high priority as targets for reducing diesel engine emissions.
4.9 Heavy-Duty: Transit Buses
This leads to high daily fuel consumption compared to other vehicles traveling similar distances. Natural gas buses are able to store sufficient fuel for several days of operation by placing fuel tanks on the generally unused space on the roof of the bus. This is common for popular low-floor buses, which can more easily accommodate wheelchair access.
Base - Transit buses are typically stationed at one central location or a series of garages throughout the region and benefit from fueling infrastructure and centralized maintenance at fleet yards.
Fueling Infrastructure - Transit fleets are typically fueled at one central location or a series of garages throughout the region. For the most part, they are anchor fleets for which stations are built specifically to support that fleet. Initial investment intzo natural gas fueling infrastructure can be quite high for large transit fleets, but they provide reasonable return on investment through high fuel consumption.
Vehicle Availability - More than a dozen OEMs currently offer transit buses in various configurations, making this segment the most mature in terms of vehicle availability. With the departure of Detroit Diesel and John Deere from the on-road bus market, transit bus manufacturers are primarily left with Cummins as the single remaining engine OEM. Doosan has recently begun offering an engine repower option, but there is a need for additional engine manufacturers to offer OEM products integrated into new buses.
Fuel Cost Sensitivity - Because of their high fuel use, fuel costs for transit buses are a major component of total operating costs. Coupled with FTA incentives that offset the overwhelming majority of the incremental costs for natural gas buses, there is a significant and compelling cost argument to switching to natural gas in transit operations.
Environmental Policies - Transit buses are highly visible vehicles, operating in congested urban environments. This has highlighted the need to reduce environmental impacts from transit buses, especially to their ridership and city residents, as important operational goals for many transit agencies.
Approximately 11,000 natural gas transit buses have been placed into operation in North America over the past fifteen years. Nearly one in four transit buses operate on natural gas, and many of those operate in densely populated urban environments. Because of their high fuel usage, approximately 12,100 DGE per year,33 and their urban operating areas, natural gas transit buses can produce significant cost reductions compared to traditional diesel buses. By the very nature of where urban transit buses are operated, they have been high-priority targets for use of natural gas as a means to reduce diesel engine emissions (Figure 4.9-1).
Range - Transit buses are estimated to average approximately 44,000 miles per year or 130 miles per day.34 However, to meet FTA testing requirements, buses must be equipped with 350 miles of range.34 It is, therefore, common for transit operators to refuel their buses well before the majority of their fuel is consumed. Routes are variable across transit agencies, but it is common for transit buses to average approximately 3.4 miles per gallon due to their stop-and-go operation.35
37
Figure 4.9-1
The transit bus market is well suited to the use of natural gas and offer significant market potential for NGVs.
Good Fair Weak
Vehicle Type/Application
Range BaseFueling
InfrastructureVehicle
AvailabilityFuel Cost Sensitivity
EnvironmentalPolicies
Light Heavy-Duty: Other Trucks
Example NGVsNorth American Bus Industries 416, New Flyer Xcelsior, Orion VII
Common Refueling Locations Fleet yards
Typical Daily Range 130 miles
Average age at first replacement 12 years/drive to scrap
North American Bus Industries 416 New Flyer Xcelsior
North American Bus Industries BRT (articulated bus)
Orion VII
38
36 Based on data from National Renewable Energy Laboratory, “Waste Management’s LNG Truck Fleet,” 2001. Includes the effect of PTO operation.37 There is a need for a larger natural gas engine in the 12 L displacement range to provide sufficient torque and horsepower for transfer trucks that may haul over 90,000
lbs. Transfer trucks are typically semi-trucks that haul refuse from aggregation facilities to landfills. As a result, they require larger engines than refuse trucks performing curbside pickup. Both Cummins Westport and Doosan are pursuing engines in this size range, while Westport Innovations offers their GX engine through select semi-truck manufacturers.
4 Characteristics of Vehicle Market Segments
Refuse trucks are a high fuel use application that has shown significant growth in deployment of NGVs. While incentives for natural gas refuse trucks have been available, much of the growth in the market has been driven by regulations mandating clean vehicles.
4.10 Heavy-Duty: Refuse Trucks
Base - Refuse trucks are typically stationed at one central location or a series of garages throughout the region and benefit from fueling infrastructure and centralized maintenance at fleet yards.
Fueling Infrastructure - Refuse are typically fueled at one central location or a series of garages throughout the region. For the most part, they are anchor fleets in which stations are built specifically to support that fleet. Initial investment into natural gas fueling infrastructure can be large but can also be utilized by a large fleet of trucks and thus provide reasonable return on investment due to the high fuel consumption. Further, there are opportunities for renewable natural gas production and use at landfills.
Vehicle Availability - Several manufacturers offer natural gas refuse trucks including Autocar, Peterbilt, American LaFrance, Crane Carrier, Mack, and Heil. Only one engine, the Cummins ISL-G, is currently available from an OEM.37
Fuel Cost Sensitivity - Refuse trucks performing curbside pickup have severe stop-and-go driving cycles and high use of power-takeoff equipment that result in very low fuel economy compared to other heavy-duty trucks. The per-vehicle fuel consumption is high, making fuel costs a major component of total operating costs.
Environmental Policies - Refuse trucks are highly visible vehicles, operating in congested urban environments. In some regions, this has led to regulations requiring significant emissions reductions. Use of low-emissions natural gas trucks has been a common method of complying with such regulations. With the introduction of 2010 EPA-compliant diesel engines, new natural gas trucks will have little advantage over diesel in terms of air pollutant emissions. Increasingly, other environmental factors, such as greenhouse gas (GHG) emissions and noise reduction, will dictate the environmental value of heavy-duty natural gas trucks, including those in the refuse sector.
The refuse truck market segment shares many characteristics with the transit bus market segment. Fuel costs are significant for this sector due to their stop-and-go and PTO operation. Concerns over their environmental impact have driven some purchase decisions. However, unlike the highly incentivized transit market, much of the refuse market has adopted natural gas in response to regulations requiring clean vehicles (Figure 4.10-1).
Range - Natural gas refuse haulers have been used by several different agencies that have found the vehicle range to be acceptable for their operations. Based on their estimated 85 mile average daily range and fuel economy of approximately 2 miles per gallon,36 natural gas refuse trucks need a minimum fuel capacity of 40 DGE. Most refuse trucks are equipped with significantly more fuel capacity.
39
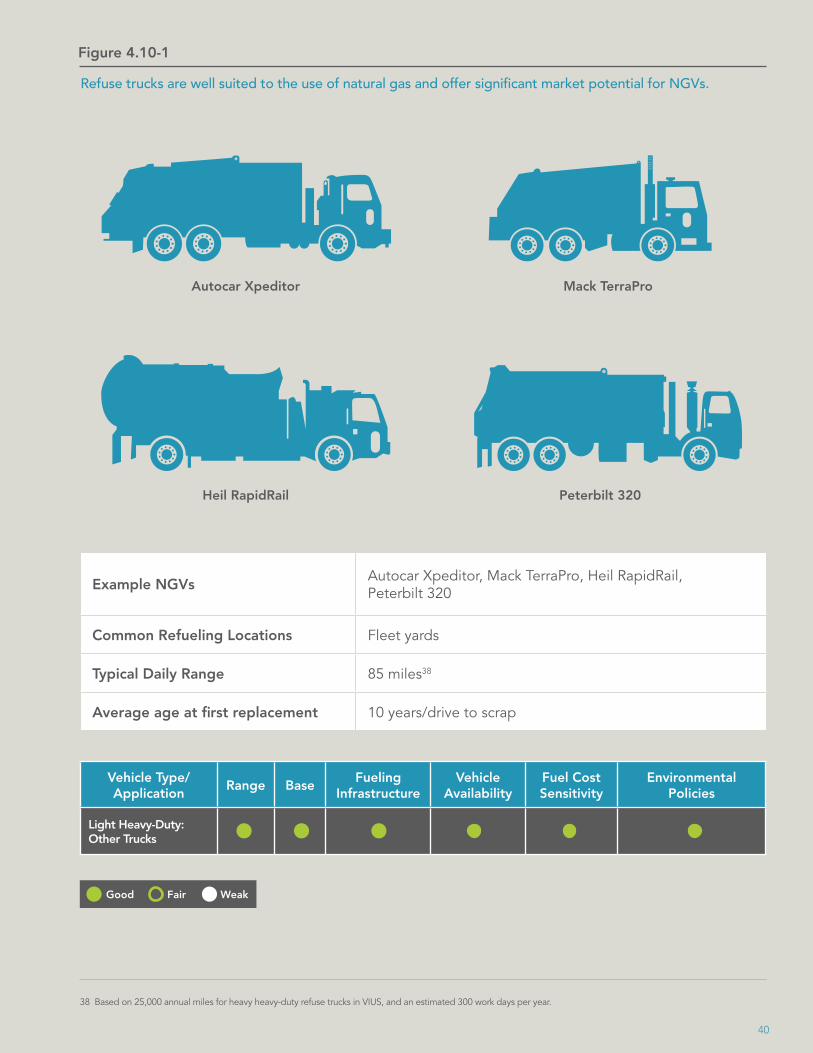
Figure 4.10-1
Refuse trucks are well suited to the use of natural gas and offer significant market potential for NGVs.
Good Fair Weak
Vehicle Type/Application
Range BaseFueling
InfrastructureVehicle
AvailabilityFuel Cost Sensitivity
EnvironmentalPolicies
Light Heavy-Duty: Other Trucks
Example NGVsAutocar Xpeditor, Mack TerraPro, Heil RapidRail, Peterbilt 320
Common Refueling Locations Fleet yards
Typical Daily Range 85 miles38
Average age at first replacement 10 years/drive to scrap
Autocar Xpeditor Mack TerraPro
Peterbilt 320Heil RapidRail
38 Based on 25,000 annual miles for heavy heavy-duty refuse trucks in VIUS, and an estimated 300 work days per year.
40
39 U.S. Census Bureau. “Vehicle Inventory and Use Survey.” 2002.40 While many trucks in this segment are used line-haul trucks, “Vehicle Availability” refers to new trucks only.
4 Characteristics of Vehicle Market Segments
As a high fuel use segment, local and regional pickup and delivery trucks can realize significant fuel cost benefits in switching to natural gas. Many fleets in this segment are reliant on publicly available fueling infrastructure.
4.11 Heavy-Duty: Local and Regional Pickup and Delivery Trucks
tend to have higher mileages. On average, the short haul segment travels 200 miles per day or fewer. This range is achievable for natural gas trucks, particularly when using LNG, and will provide one or more days of fuel for many truck operators.
Base - Short-haul trucks are generally return-to-base operations, returning to a fleet yard at the end of each day. Depending on the size of the fleet and type of truck operator, employee, or owner-operator, the truck may or may not have access to fueling and maintenance at the fleet yard. For independent operators, their base location may change as they acquire new contracts.
Fueling Infrastructure - Because of the regional nature of their operation, short-haul trucks may rely on fueling infrastructure at their fleet yards or local public fueling stations. A recent example is the establishment of a large public fueling station and smaller fleet controlled fueling stations for approximately 800 LNG and CNG port trucks serving the ports of Los Angeles and Long Beach. Due to the variability in daily operations for many short haul trucks, access to both public and private fueling stations will be important to most operators.
Vehicle Availability40 - Three major over-the-road truck manufacturers currently offer natural gas semi-trucks. Two engines are available, the 320 horsepower Cummins ISL-G and the larger 450 horsepower Westport GX (based on the Cummins ISX engine). Despite the introduction of these vehicles over the last four years, there is still a need for an 11 to 12 liter engine to better match the needs of the short haul market.
Fuel Cost Sensitivity - Short-haul trucks can consume more than 10,000 DGE of fuel per year, making fuel cost a major component of operating costs.
Environmental Policies - Some large fleets are adopting policies to reduce environmental impacts, and some shippers are beginning to request lower-impact cargo transportation. However, many short haul trucks are owned by small, independent operators that do not typically make purchase decisions based on environmental considerations.
Trucks with detachable trailers, known as semi-tractors, are the most common type of Class 7 and Class 8 trucks on the road. Semi-tractors, on average, also consume more fuel per vehicle than almost any other market segment. Approximately 65 percent of the miles traveled by these trucks are traveled with a daily range of 200 miles or less.39 This market segment includes port trucks, food distribution trucks, and other short haul trucks (Figure 4.11-1). Natural gas trucks in this market can provide significant fuel cost reductions compared to diesel semi-trucks. Furthermore, their localized area of operation allows these trucks to rely on local fueling infrastructure.
Range - Most short-haul trucks operate from a fleet yard and are dispatched to move goods. Daily mileage generally increases with trip distances and fewer daily trips. Therefore, trucks that make numerous short trips, from a port terminal to a rail yard, for example, tend to have lower daily mileages due to the time spent loading and unloading cargo as well as the lower road speeds. Trucks performing regional haul operations, from a food distribution warehouse to a grocery store for example,
41

Figure 4.11-1
Local and regional haul trucks are high fuel consumption vehicles that can serve as anchor fleets and may offer significant market potential for NGVs.
Good Fair Weak
Vehicle Type/Application
Range BaseFueling
InfrastructureVehicle
AvailabilityFuel Cost Sensitivity
EnvironmentalPolicies
Light Heavy-Duty: Other Trucks
Example NGVs Freightliner M2-112, Peterbilt 384, Kenworth T800
Common Refueling Locations Fleet yards, Public fueling stations (truck stops)
Typical Daily Range 200 miles41
Average age at first replacement 6 years for new trucks, drive to scrap for used trucks
Port “Drayage” Truck waiting in terminal queues with shipping containers
Grocery Distribution Truck hauling 53 foot refrigerated van
41 Based on VIUS 2002 data for heavy heavy-duty semi-tractors with single trailers.
42
42 Note that pending changes to federal fuel economy regulations will likely drive a shift to smaller engines.
4 Characteristics of Vehicle Market Segments
Line-haul trucks are the largest consumer of fuel on a per vehicle basis and are highly sensitive to fuel costs. However, the adoption of natural gas in this area will require that natural gas fueling infrastructure be greatly expanded.
4.12 Heavy-Duty: Line-Haul Trucks
Base - Line-haul drivers generally spend more time away from their home base than any other truck, potentially spending a week or more on the road. As a result, line-haul truck drivers often rely on public truck stops and networks of maintenance providers to fuel and service their trucks. These resources are lacking in many regions of North America for natural gas trucks.
Fueling Infrastructure - Many large fleets have company-owned fueling facilities available at strategic locations to serve their vehicles, due to the fuel price advantage over retail stations. These locations are potential locations for fleet controlled natural gas fueling infrastructure. Publicly accessible fueling infrastructure could be co-located at truck stops or along major transportation corridors but is currently insufficient for cross-country line-haul operations.
Vehicle Availability - Line-haul trucks are similar to regional and local pickup and delivery trucks. Many used line-haul trucks are sold into the regional and local markets. Therefore, some of the experience providing natural gas short haul trucks is transferrable to the line-haul market. However, even the largest natural gas engine, the 450 horsepower Westport GX, is undersized for most line-haul operations. Two manufacturers produce trucks that could be used in limited line-haul service using the Westport GX engine, Peterbilt’s 386 and Kenworth’s T800.42
Fuel Cost Sensitivity - As the largest consumer of fuel per vehicle, the line-haul market segment is extremely sensitive to fuel costs. Fuel costs in the first two years of a truck’s operation can exceed the original purchase price of the truck. Therefore, fuel cost savings can be a major incentive for the purchase of natural gas trucks, provided the fueling infrastructure exists to support their operation.
Environmental Policies - Large fleets are adopting policies to reduce environmental impacts, and some shippers are beginning to request lower-impact transportation of their cargo. Small, independent operators do not typically make purchase decisions based on environmental considerations but may be affected by the policies of large shippers.
By far the largest consumer of fuel per vehicle, the line-haul truck market is typified by Class 8 semi-trucks hauling one or more trailers in interstate operations (Figure 4.12-1). These trucks may travel more than 500 miles per day and, as such, fuel costs and reliability are major concerns in line-haul operation. At present, no truck manufacturer offers a natural gas powered truck intended for high mileage line-haul operation, due primarily to the lack of sufficient fueling infrastructure.
Range - New line-haul trucks can travel more than 200,000 miles per year, consuming more than 30,000 DGE per truck annually. It is not uncommon for these trucks to carry 200 to 300 DGE of fuel onboard and travel over 500 miles per day. Line-haul trucks may idle overnight to provide electricity and air conditioning to the driver, increasing fuel consumption by one to two gallons per hour, although this practice has been reduced due to new alternatives to idling and new regulations restricting idling. Based on current tank configurations, it is possible to store approximately 150 to 180 DGE of LNG onboard a line-haul truck. For the highest mileage operations, this fuel capacity would probably require the driver to refuel at least once per day.
43

Figure 4.12-1
Line-haul trucks consume more fuel than any other application and are an attractive market for NGVs but rely on a broad, geographically distributed network of fueling stations to support their operations.
Good Fair Weak
Vehicle Type/Application
Range BaseFueling
InfrastructureVehicle
AvailabilityFuel Cost Sensitivity
EnvironmentalPolicies
Light Heavy-Duty: Other Trucks
Example NGVs Peterbilt 386, Kenworth T800 (limited service)
Common Refueling Locations Fleet yards, Public fueling stations (truck stops)
Typical Daily Range 300+ miles43
Average age at first replacement 4 years
A typical line-haul truck with an aerodynamic body and sleeper cabin, hauling a 53 foot dry van trailer
43 Based on an average of 104,000 annual miles for heavy heavy-duty trucks with operating ranges greater than 500 miles, assuming 350 operating days per year.
44

44 Argonne National Laboratory. “Full Fuel Cycle Comparison of Fork Lift Propulsion Systems.” 2008.45 U.S. EPA NONROAD 2008 model natural gas vehicle population data.
4 Characteristics of Vehicle Market Segments
The centralized nature of ground support vehicle operations is conducive to the use of natural gas engines and fuel. Challenges with integrating sufficient onboard fuel storage could impact deployment in high use applications.
4.13 Off-road: Ground Support Vehicles
tractors typically consume between one and two gallons per hour respectively,44 requiring between 8 and 16 DGE of on-board fuel storage to complete a work shift. These storage capacities have been demonstrated but can be challenging due to the limited space on many ground support vehicles.
Base - Ground support vehicles typically operate at specific facilities and rarely operate outside these areas. These vehicles may be used periodically or nearly continuously but are refueled and maintained by fleet operators in centralized locations.
Fueling Infrastructure - Ground support equipment may be fueled by bringing the vehicle to a centralized fueling facility but may also be “wet-fueled,” meaning that fuel trucks bring fuel to the ground support vehicles between shifts.
Vehicle Availability - According to the U.S. EPA, more than 43,000 natural gas forklifts in the 40 to 50 horsepower (Class IV, 3,000 to 6,000 lb) capacity range are in use in the U.S.45 These forklifts are available directly from OEMs in natural gas configurations. Several natural gas terminal tractors have been demonstrated in operation, and at least one manufacturer offers a factory-supplied natural gas terminal tractor. There are few natural gas options for the many other types of ground support equipment, including tugs, fueling equipment, baggage handlers, and larger forklifts.
Fuel Cost Sensitivity - Despite the nearly constant use of many ground support vehicles, their total daily fuel costs are usually much lower than other operating costs, such as labor costs.
Environmental Policies - Ground support equipment operating at seaports and airports are increasingly subject to environmental regulations, providing additional incentives for end users to deploy NGVs. Equipment operating at private companies may benefit from very low emissions by allowing the equipment to operate indoors (e.g., warehouses and distribution centers). Other alternative fuels such as electricity and propane also compete in this market.
Ground support vehicles are typically low to medium horsepower, low speed vehicles that operate at specific facilities (Figure 4.13-1). Aircraft support vehicles, forklifts, and terminal tractors are examples of ground support equipment. Because many ground support vehicles are relatively low horsepower applications, fuel consumption per hour can be low. However, because many of these vehicles are used continuously for eight or more hours per day, annual fuel consumption can be significant and provide an opportunity for attractive fuel cost savings when switching to natural gas.
Range - Ground support vehicles typically have significant amounts of engine idling time or operation of PTO equipment. Therefore, vehicle operating range is more appropriately expressed in terms of hours of operation between refueling events. Forklifts and terminal
45

Figure 4.13-1
Ground support vehicles are specialized equipment that operate as part of a captured fleet and offer some market potential for NGVs.
Good Fair Weak
Vehicle Type/Application
Range BaseFueling
InfrastructureVehicle
AvailabilityFuel Cost Sensitivity
EnvironmentalPolicies
Light Heavy-Duty: Other Trucks
Example NGVs Autocar Xspotter terminal tractor, Toyota 8-series forklift
Common Refueling Locations Fleet yards
Typical Daily Range 8 hours -12 hours of operation
Average age at first replacement Drive to scrap
Class IV forklift (Toyota) Terminal Tractor (Autocar)
Typical Ground Support Equipment
46
4 Characteristics of Vehicle Market Segments
The construction market consists of highly specialized vehicles that move frequently between job sites. There is currently little, if any, availability of natural gas construction equipment. This is, in part, due to the challenges of fueling logistics associated with natural gas.
4.14 Off-road: Construction Equipment
to construction equipment, finding space on the vehicle that does not impact operations can be an issue. Due to the highly specialized nature of construction equipment, the addition of fuel tanks that cannot conform to existing fuel tank locations can create safety and visibility issues. As a result, high-use construction equipment will likely have challenges with range. It should be noted that the strictest federal emissions standards for off-road vehicles (Tier 4) are similar to on-road engines and will likely require the use of catalysts and particulate filters for diesel engines, creating similar packaging issues as those faced by NGVs.
Base - Construction vehicles and equipment are typically based at a single job site for relatively long periods of time before being moved to the next job site. Scheduled maintenance of these vehicles generally occurs at a fleet yard. Fuel is usually brought to the job site.
Fueling Infrastructure - Because of constantly changing job sites and restrictions against on-road operation, fuel for construction vehicles must often be brought to the job site where vehicles are typically wet-fueled. Alternatively, fuel may be stored in tanks for refueling of equipment as needed. This can make reliable and practical delivery of natural gas challenging.
Vehicle Availability - Within the wide variety of construction equipment, there are numerous sizes and types of construction equipment that could use existing natural gas engines. To date, few, if any, construction vehicles are available in natural gas configurations.
Fuel Cost Sensitivity - For many types of construction equipment, capital costs and maintenance costs are very high. Ultimately, productivity, reliability, and operability are the most important purchase decision drivers in this market segment.
Environmental Policies - Some public agencies require lower emission construction equipment to be used on their job sites. However, these requirements can generally be met by repowering the equipment with newer diesel engines. Environmental impact reductions are generally not drivers for fleet purchase decisions in this segment.
The construction market segment is composed of highly specialized equipment that vary in size from less than 50 horsepower to over 1,000 horsepower. Some examples are shown in Figure 4.14 1. Despite the availability of natural gas engines in many of the common horsepower ranges used in construction equipment, few, if any, natural gas options are available for construction equipment. Two key challenges, fuel tank integration and changing regions of operation, have made transitions from traditional diesel fueled equipment difficult.
Range - In both the construction and mining markets, vehicle productivity is crucial to cost effective operation. To maintain maximum productivity, construction equipment must be able to operate for an entire shift without refueling. While weight is generally not an issue that would preclude adding sufficient natural gas fuel storage
47

Figure 4.14-1
Construction fleets are composed of highly specialized equipment that moves between job sites and may not offer significant market potential for NGVs.
Good Fair Weak
Vehicle Type/Application
Range BaseFueling
InfrastructureVehicle
AvailabilityFuel Cost Sensitivity
EnvironmentalPolicies
Light Heavy-Duty: Other Trucks
Example NGVs None
Common Refueling Locations Job sites
Typical Daily Range Varies
Average age at first replacement Drive to scrap
Motor Grader
Skid Steer Loader
Back-hoe Excavator
Track-type Tractor
Various construction equipment with specialized designs for specific tasks
48
46 Liebherr Mining Power. “Optimizing Powered Haulage Investment in Surface Coal Applications.” http://www.minexpo.com/Presentations/baucom.pdf. Accessed October 2010.
4 Characteristics of Vehicle Market Segments
Mining vehicles and equipment, while similar in look and function to construction equipment, are better suited to the adoption of NGVs due to a consistent work site and high fuel use per vehicle. Few, if any, natural gas options are available for mining equipment.
4.15 Off-road: Mining Equipment
Base - Mining equipment is usually stationed at the mine for years, creating a return-to-base anchor fleet with consistent fuel consumption and centralized maintenance.
Fueling Infrastructure - Mining vehicles and equipment are fueled on site in centralized operations that could be conducive to adding one or more natural gas fueling stations (LNG, most likely). Wet fueling, needed to transport fuel from the centralized fueling station to the mining equipment, is also a possibility. The continuous operation of mining equipment and the consistent high fuel use should minimize fuel boil off of LNG fueling stations and onboard fuel tanks.
Vehicle Availability - As with construction equipment, natural gas powered mining vehicles and equipment are not currently available. Natural gas propulsion engines are available in low to mid horsepower ranges, up to 450 horsepower, but larger engines are not available. Natural gas engines for stationary power generation are available in higher horsepower ratings but will require some additional development before being integrated into mining equipment.
Fuel Cost Sensitivity - For mining fleets, fuel costs can represent 50 percent of operating costs.46 Given that larger equipment can consume over 100,000 DGE annually, this provides a strong incentive for fuel cost reductions. However, any strategy for fuel cost reductions cannot compromise vehicle productivity.
Environmental Pol ic ies - Product iv i ty, reliability, and operability are the most important purchase decision drivers in this market segment. Environmental impact reductions are generally not drivers for fleet purchase decisions in this segment.
Although similar to their counterparts in the construction industry, vehicles and equipment used for mining operations (Figure 4.15-1) tend to be larger, due to a focus on maximizing throughput of material. This increase in size requires larger engines, some of which range from 1,000 to 4,000 horsepower. Currently, there is very limited availability of natural gas engines suitable for this market segment. However, high fuel consumption per vehicle and other use logistics make this niche attractive for engine and vehicle OEMs to consider for expansion of NGV offerings.
Range - Continuous operation of mining equipment has led manufacturers to increase fuel capacities on mining equipment to minimize downtime related to refueling. Smaller equipment may consume 30 DGE per eight hour shift, and the largest equipment may consume over 1,400 DGE in the same shift. As with construction equipment, the specialized design of mining equipment can make it challenging to integrate sufficient natural gas fuel storage on board the vehicle.
49

Figure 4.15-1
Mining vehicles are some of the largest vehicles in operation. Their size and continuous operation make mining a high fuel consumption application and may offer significant market potential for NGVs.
Good Fair Weak
Vehicle Type/Application
Range BaseFueling
InfrastructureVehicle
AvailabilityFuel Cost Sensitivity
EnvironmentalPolicies
Light Heavy-Duty: Other Trucks
Example NGVs None
Common Refueling Locations Mine sites
Typical Daily Range 8+ hours of operation
Average age at first replacement Drive to scrap
Underground Mining Loader/Hauler Large Rubber-Tire Loader
Large Dump Truck (up to 400 ton payload)
Underground Mining Truck
Various mining vehicles, specialized for underground or above-ground operation
50
4 Characteristics of Vehicle Market Segments
In general, economic, environmental, and social pressures drive vehicle purchase decisions. These pressures will ultimately dictate which market segments seek alternatives to conventional transportation fuels and what alternative fuels they select. Of the six criteria used to evaluate the various market segments previously discussed, two of these criteria represent market drivers that incentivize or disincentivize the adoption of alternative fuels. These criteria are fuel cost sensitivity and environmental policies and represent economic and environmental/social pressures respectively. While not complete or exhaustive, these two criteria are important and reflect reasonably well the markets that have seen the greatest penetration of natural gas.
Table 4.16-1 summarizes the qualitative assessments of each of the previously discussed market segments and vehicle applications. Based on this “scorecard,” transit bus, refuse truck, and package delivery van applications have the strongest market drivers for adoption of natural gas. These applications are also well suited to the use of natural gas based on their market enabling features. Specifically, these are short range and return-to-base applications.
It is important to note that the state of these qualitative assessments will change over time. Fuel cost sensitivity is ultimately a function of fuel price. Currently, gasoline and diesel fuel prices are low enough that vehicle users in low fuel consumption applications focus on other costs and considerations when making a purchase decision. However, as the price of gasoline and diesel fuel rises, so too does vehicle users’ sensitivity to fuel costs. If fuel prices return to, or exceed, previous highs of approximately $4.80 per gallon,47 many of the applications currently ranked as “fair” or “weak” to fuel cost sensitivity could find fuel costs to be a major purchase decision driver.
Similarly, environmental policies are also variable and evolve continually. In this context, environmental policies may also reflect social policies such as reduction in conventional transportation fuel. These policies can be major market drivers when manifested in the form of mandates and regulations. Therefore, an application with little to no social or environmental policy pressures to adopt an alternative fuel may quickly be exposed to increased pressures based solely on changes to regulations or other societal factors.
Finally, the information provided for each market segment in this section is a broad average. It is possible to find applications within each segment where natural gas could be competitive, provided there is vehicle availability and fueling infrastructure or sufficient incentive to establish these. For example, in the refuse truck and transit markets, regulations have driven vehicle users to adopt cleaner technologies. Combined with incentives to offset the cost of infrastructure and incremental vehicle costs, these segments have shown significant NGV deployments. In Southern California, similar combinations of regulations and incentives, including the creation of a large public fueling station, resulted in the transition of almost 10 percent of the trucks hauling goods from the local ports to natural gas. Even large commercial fleets like Wal-Mart, UPS, Verizon, and AT&T have selected natural gas in certain applications based on sustainability and cost reduction goals.
Vehicle applications subject to the greatest economic and environmental pressures are also the same applications that have seen the greatest use of natural gas.
4.16 Summary
47 U.S. EIA. “Weekly Retail Gasoline and Diesel Prices.” http://www.eia.gov/dnav/pet/pet_pri_gnd_dcus_nus_w.htm. Accessed August 2012.
51

VehicleType/Application
Passenger Car/LightTruck (Private)
Passenger Car/LightTruck (Commercial)
Med-Duty Private and Commercial Van/Truck
Heavy-Duty:Package Delivery
Heavy-Duty:Utility Trucks
Heavy-Duty:School Bus
Heavy-Duty:Transit Bus
Off-road Service/UtilityVehicles
Heavy-Duty:Refuse Trucks
ConstructionEquipment
Heavy-Duty:Local/Regional Haul
MiningEquipment
Heavy-Duty:Line Haul Truck
Heavy-Duty: Stake,Flat Bed, and others
Range BaseFueling
InfrastructureVehicle
AvailabilityFuel CostSensitivity
EnvironmentalPolicies
Market Enablers Market Drivers
Table 4.16-1
This scorecard summarizes the relative state of various applications with regard to their current market potential for NGVs.
Good Fair Weak
52

5 Geographic Characteristics of Markets
Different regions of the U.S. and Canada have policies and economics that drive market penetration in different ways. These market conditions result in geographical differences in motivators and business models for adoption of NGVs. The following sections consider several geographic characteristics of the NGV market (Figure 5.1 1). These sections address the following characteristics:
Infrastructure Availability – identifies known natural gas fueling infrastructure and discusses the challenges of strategically locating new infrastructure.
Regional Policies, Incentives and Mandates – looks at the distribution of various policies for alternative fueled vehicles and considers the future direction of these policies.
Fuel Cost Differentials – examines the geographic variations in the price difference between natural gas and diesel fuel. The correlation between fuel consumption and the fuel cost spread is also considered.
Vehicle Concentrations – attempts to identify regions of high vehicle concentrations and the factors that affect concentrations of certain types of vehicles.
Strategic Corridors – compares the geographic correspondence of major transportation corridors in the U.S and Canada and their proximity to new natural gas resources (shale gas).
In addition to market segmentation by vehicle type and application, the NGV market is also segmented by geography. Several geographic aspects of the NGV market interact to drive market penetration.
5.1 Overview
53

Figure 5.1-1
Five major geographic aspects of the NGV market interact to drive market penetration.
VehicleConcentrations
Fuel CostSpread
StrategicCorridors
InfrastructureAvailability
Regional Policies,Incentives, and
Mandates
54

5 Geographic Characteristics of Markets
Over 1,000 natural gas fueling stations exist in the U.S. and Canada, principally in large cities. A major challenge for infrastructure development is the proper matching of infrastructure growth to end user needs. Overbuilding of infrastructure can lead to underutilized stations and the stranding of capital. Under-building infrastructure can create significant problems for end users and disincentivize further adoption of NGVs. Historically, most fueling infrastructure has been built to serve anchor fleets where a minimum level of utilization is assured and station capacity is sufficient to meet the needs of the anchor fleet. These stations may then be expanded or made available to the public as additional demand warrants. This approach will likely be the one taken in the future and appears to be a reasonable model for avoiding the traps of stranded capital and insufficient capacity.
The previously mentioned approach is reasonable in the near term as there are still numerous large and mid-sized fleets that could act as anchor fleets and justify the creation of dedicated fueling infrastructure. Long term, however, it is important to identify methods of aggregating demand from small fleets and private users. Without the ability to aggregate demand, it will be difficult to match infrastructure growth with demand.
Figure 5.2-1 provides a combined view U.S. population density, truck volume, and natural gas fueling station locations. Natural gas stations tend to be clustered in high population density areas for several reasons. First, high density urban areas are most likely to suffer from air pollution problems and be in nonattainment of health-based ambient air quality standards. Historically, this has driven the creation of mandates and incentives for the use of low-emissions alternative fuel vehicles like NGVs, which creates a localized need for fueling stations. Second, high population areas are also correlated with high vehicle densities, so more stations are needed in these areas to support a given level of market penetration. For example, there will be more transit bus operations in dense urban areas than rural areas, requiring a greater concentration of fueling stations to meet the fueling demands of urban transit fleets. In general, stations have been located to serve local anchor fleets like transit, refuse, airport, and municipal fleets. Many of these stations are also accessible to the public but may not be operated like typical fueling stations. As a result, stations are often obscure or inaccessible to the public or other fleets.
Figure 5.2-1 also provides a tabulated view of the relative requirements for infrastructure build-out for certain market segments. Note that geographic distribution refers to the range from the base location a fleet might require to have stations available. Station density refers to the number of stations needed within the typical range of operation of a fleet. As shown, the segments with the most geographically confined operations provide anchor fleets that require the least infrastructure build-out to support a fleet. Line-haul trucks offer a significant market for fuel use but require broader distribution of stations and higher station concentrations along key travel corridors. The light-duty market for private consumers is the most difficult market for infrastructure development, requiring a large number of stations, high station density, and very broad distributions of those stations.
Natural gas fueling stations tend to be clustered in major population centers, and matching infrastructure growth to vehicle demand is challenging.
5.2 Infrastructure Availability
55

Natural Gas Fueling Station Interstate
National Highway System Routes
Figure 5.2-1
Natural gas fueling stations tend to be located in major population centers but are widely spaced in less populated areas.
48 Based on data from U.S. Department of Energy Alternative Fuels and Advanced Vehicles Data Center, August 2012; U.S. Department of Transportation “Freight Analysis Framework,” 2007; HowStuffWorks “Maps of United States Population Density,” http://maps.howstuffworks.com/united-states-population-density-map.htm, 2010.
Relative fueling infrastructure needs for certain market segments48
Segment Number of Stations Needed
GeographicalDistribution
StationDensity
Passenger Car/Light Truck
Commercial Medium/Heavy-Duty
Local and Regional Haul Trucks
Line-Haul Trucks
56
Note: Long-haul freight trucks serve locations at least 50 miles apart, excluding trucks that are in intermodal movements.
Significant issue Minor issue Moderate issue
Population
Persons persq. km
Over 400200 to 399100 to 19950 to 9910 to 491 to 9Under 1
Persons persq. km
Over 1040520 to 1039 260 to 519130 to 259
25 to 1291 to 24
Under 1
5 Geographic Characteristics of Markets
In general, state, province, and local level policies that affect the NGV industry are similar across the U.S. and Canada in that they promote alternative fuel vehicles as a whole. These policies include, to varying degrees, grants for purchase of vehicles; education and outreach; fuel, vehicle, and infrastructure tax incentives; and non-tax incentives, such as free parking and carpool lane access. Figure 5.3-1 summarizes the extent of these various policies in the U.S., focused primarily on the control of air toxics.
In the U.S., the degree of NGV penetration has been heavily influenced by state and local policies. In the past, adoption of NGVs has been driven in particular by air quality concerns. To meet the U.S. National Ambient Air Quality Standards (U.S. NAAQS) of the Clean Air Act, the EPA designated specific counties across the country as being in nonattainment and requiring corrective action plans. The health-based NAAQS require designated air basins to meet ambient air quality standards for six air pollutants: carbon monoxide, lead, sulfur dioxide, ozone, nitrogen dioxide, and particulate matter. Especially for California, which has some of
the worst air quality regions (nonattainment areas) in the U.S., the adoption of NGVs has coincided with the need to significantly improve air quality. However, air quality as a strategy motivator for NGVs may be limited moving forward. With the introduction of increasingly stringent vehicle emission standards across the light- and heavy-duty sectors for all fuels, the air pollutant emissions benefits of NGVs over conventional vehicles are primarily upstream of the vehicle (i.e., associated with fuel extraction, production, and transportation). Thus, it becomes increasing difficult to use ambient air quality as rationale to target deployments of alternative fuel vehicles in large urban areas, even as they remain in nonattainment status. This implies that the focus of future regulations for NGVs and alternative fuels will need to shift away from air pollutant emissions and focus on other societal benefits, such as reduced GHG emissions and increased displacement of conventional transportation fuels.
Several new regulations to reduce GHG emissions from the on-road market are in development or slated for approval. The general trend is to require improvements in the Corporate Average Fuel Economy standards that have long applied to light-duty vehicles. In addition, two U.S. regulatory agencies are now seeking to adopt fuel efficiency and/or GHG reduction standards for heavy-duty vehicles. Some credit is expected to be provided for the use of fuels that generate fewer GHGs in their production. While natural gas has GHG advantages over conventional transportation fuels on a production basis, fuel economy from natural gas engines will likely need to keep pace with or exceed diesel and gasoline engines.
Reduction of dependency on transportation fuel from geopolitically unstable regions of the world has been partly addressed through the establishment of the EPA’s Renewable Fuels Standard. However, it is not clear what actions will be taken beyond this standard. Many renewable fuel strategies face challenges associated with land use and water consumption. Much work remains to be done to address GHG emissions and dependency on transportation fuel from geopolitically unstable regions without reducing the gains made in air toxics reductions. In the past, incentives and mandates have been a key part of the approach to achieving environmental goals. They are likely to remain part of the approach in the future.
Historically, incentives and mandates for NGVs have been driven by air quality concerns. In the future, GHG emissions and dependency on transportation fuel from geopolitically unstable regions will be key concerns.
5.3 Regional Policies, Incentives, and Mandates
57

Information
Funding/ Financial Assistance
Guidance
Other Incentives
Regulation and Mandates
Tax based Credits/Incentives
Local Level Incentives
Share of AFVIncentives/Mandates
Number of AFV Incentives/Mandates
9%
16%
11%
10%23%
20%
11%
Figure 5.3-1
The number and types of incentives and mandates for alternative fuel vehicles varies greatly.
58
5 Geographic Characteristics of Markets
Fuel cost has been one of the major advantages of natural gas over conventional transporation fuels. This advantage is most strongly manifested in high fuel use, fuel cost sensitive applications, such as transit bus and refuse applications. Since these NGV applications displace diesel fuel (rather than gasoline), the critical factor becomes the price differential between natural gas and diesel fuel.
On an energy equivalent basis, the cost of natural gas is between one-third and two-thirds the cost of diesel fuel. As this fuel cost differential increases, the greater the financial incentive is for end users to purchase NGVs as a means to improve vehicle lifecycle costs. Figure 54.4-1 shows a “snapshot” the fuel cost differentials by state in the U.S. and tabulates fuel consumption for the top nine states based on CNG vehicle fuel consumption. As shown in the figure, there appears to be little direct correlation between fuel price differential and fuel consumption. This lack of correlation is likely due to a variety of other market pressures that would not exist in a fully mature supply/demand driven market.
For all of the states tabulated in Figure 5.4-1, with the exception of Utah, two-thirds or more of statewide fuel consumption is due to transit fleets. In addition, the top four states are also the states with the greatest number of incentives and mandates regarding alternative fuels. This suggests that incentives and mandates, particularly those associated with transit fleets, may be the predominant factors currently driving natural gas consumption. This should not be interpreted as disregarding the cost benefits of natural gas. Regulations and mandates are often fuel-neutral, meaning that the affected fleets may comply with the regulation using a variety of alternative fuels and technologies (e.g., natural gas, propane, hybridization, and electrification). In this context, the fuel cost advantages of natural gas are important as natural gas competes with other compliance options.
One key reason that natural gas adoption tends to rely on regulations and incentives rather than fuel cost differential is the incremental cost of transitioning to natural gas. In particular, the infrastructure costs associated with installing fleet controlled natural gas fueling stations can be prohibitive for many fleets without funding assistance to offset costs. Additionally, the incremental cost of NGVs can prevent adoption in low fuel consumption applications where the return on investment is low. Hence, combining regulation and incentives, as has been done in the transit market, will likely have the greatest effect on natural gas fuel consumption in the near term.
The difference in cost between conventional transporation fuel and natural gas can drive natural gas fuel and vehicle sales.
5.4 Fuel Cost Differentials
59

State CNG Consumption49
(GGE)Fuel Price
Differential50 ($/DGE)
California 92,917,000 2.23
25,364,000 1.95
9,451,000 1.03
13,347,000 2.00
8,831,000 2.14
6,366,000 1.24
6,887,000 2.17
1,246,000 1.22
2,046,000 1.31
New York
Arizona
Texas
Georgia
District of Columbia
Utah
Colorado
Massachusetts
0.0 to 0.5
0.5 to 1.0
1.0 to 1.5
1.5 to 2.0
2.0 to 2.5
2.5+
Diesel-CNG PriceDifferential ($/DGE)
Figure 5.4-1
Diesel-CNG fuel price differentials vary widely by region.
49 U.S. EIA. “Alternatives to Traditional Transportation Fuels 2009.” http://www.eia.gov/renewable/afv/archive/index.cfm. Accessed August 2012.50 Based on data from American Petroleum Institute, “July 2012 Summary Reports,” http://www.api.org/Oil-and-Natural-Gas-Overview/Industry-Economics/~/media/Files/
Statistics/gasoline-diesel-summary.ashx, July 2012; EIA, “Natural Gas Prices,” http://www.eia.gov/dnav/ng/ng_pri_sum_dcu_SAL_a.htm, accessed August 23, 2012; EIA, “Refiner Petroleum Product Prices by Sales Type,” http://www.eia.gov/dnav/pet/pet_pri_refoth_dcu_nus_a.htm, accessed August 23, 2012.
60
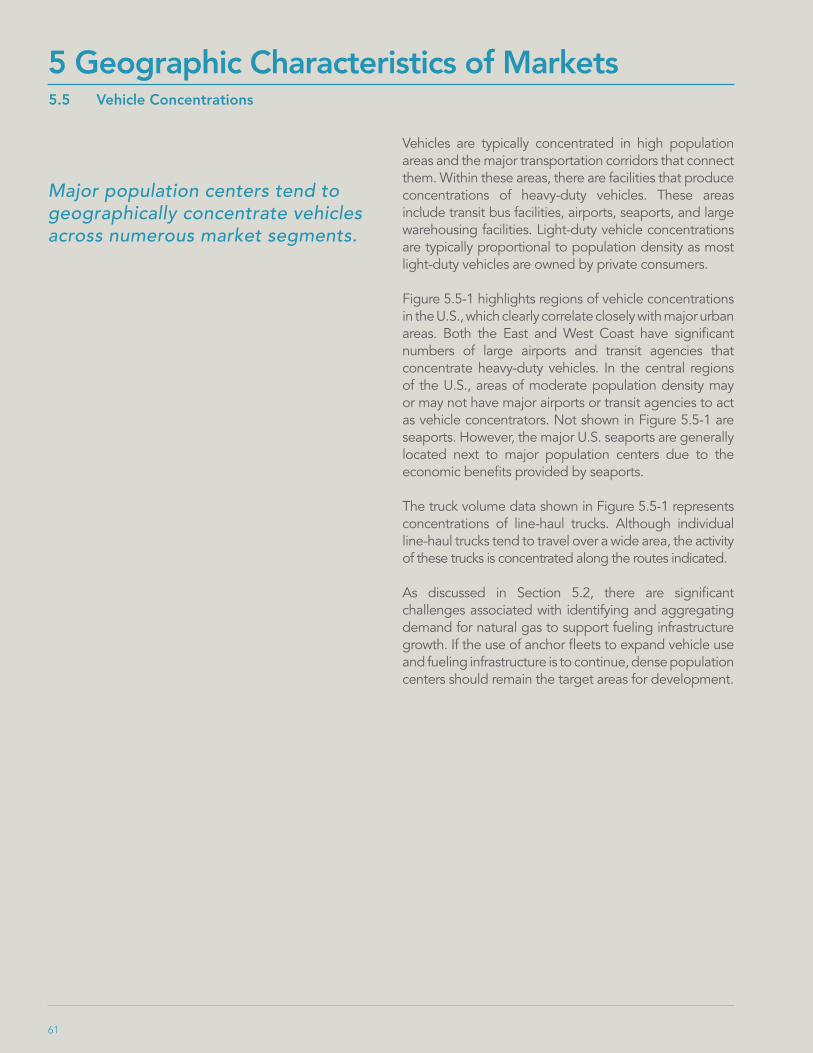
5 Geographic Characteristics of Markets
Vehicles are typically concentrated in high population areas and the major transportation corridors that connect them. Within these areas, there are facilities that produce concentrations of heavy-duty vehicles. These areas include transit bus facilities, airports, seaports, and large warehousing facilities. Light-duty vehicle concentrations are typically proportional to population density as most light-duty vehicles are owned by private consumers.
Figure 5.5-1 highlights regions of vehicle concentrations in the U.S., which clearly correlate closely with major urban areas. Both the East and West Coast have significant numbers of large airports and transit agencies that concentrate heavy-duty vehicles. In the central regions of the U.S., areas of moderate population density may or may not have major airports or transit agencies to act as vehicle concentrators. Not shown in Figure 5.5-1 are seaports. However, the major U.S. seaports are generally located next to major population centers due to the economic benefits provided by seaports.
The truck volume data shown in Figure 5.5-1 represents concentrations of line-haul trucks. Although individual line-haul trucks tend to travel over a wide area, the activity of these trucks is concentrated along the routes indicated.
As discussed in Section 5.2, there are significant challenges associated with identifying and aggregating demand for natural gas to support fueling infrastructure growth. If the use of anchor fleets to expand vehicle use and fueling infrastructure is to continue, dense population centers should remain the target areas for development.
Major population centers tend to geographically concentrate vehicles across numerous market segments.
5.5 Vehicle Concentrations
61

Figure 5.5-1
Natural gas fueling stations tend to be concentrated in major population centers and widely spaced in less-populated areas.
62
InterstateTransit AgencyAirport
National Highway System Routes
Note: Long-haul freight trucks serve locations at least 50 miles apart, excluding trucks that are in intermodal movements.51
Population
Persons persq. km
Over 400200 to 399100 to 19950 to 9910 to 491 to 9Under 1
Persons persq. km
Over 1040520 to 1039 260 to 519130 to 259
25 to 1291 to 24
Under 1
51 Based on data from U.S. Department of Transportation, “Freight Analysis Framework,” 2007; HowStuffWorks, “Maps of the United States Population Density,” http://maps.howstuffworks.com/united-states-population-density-map.htm, 2010.
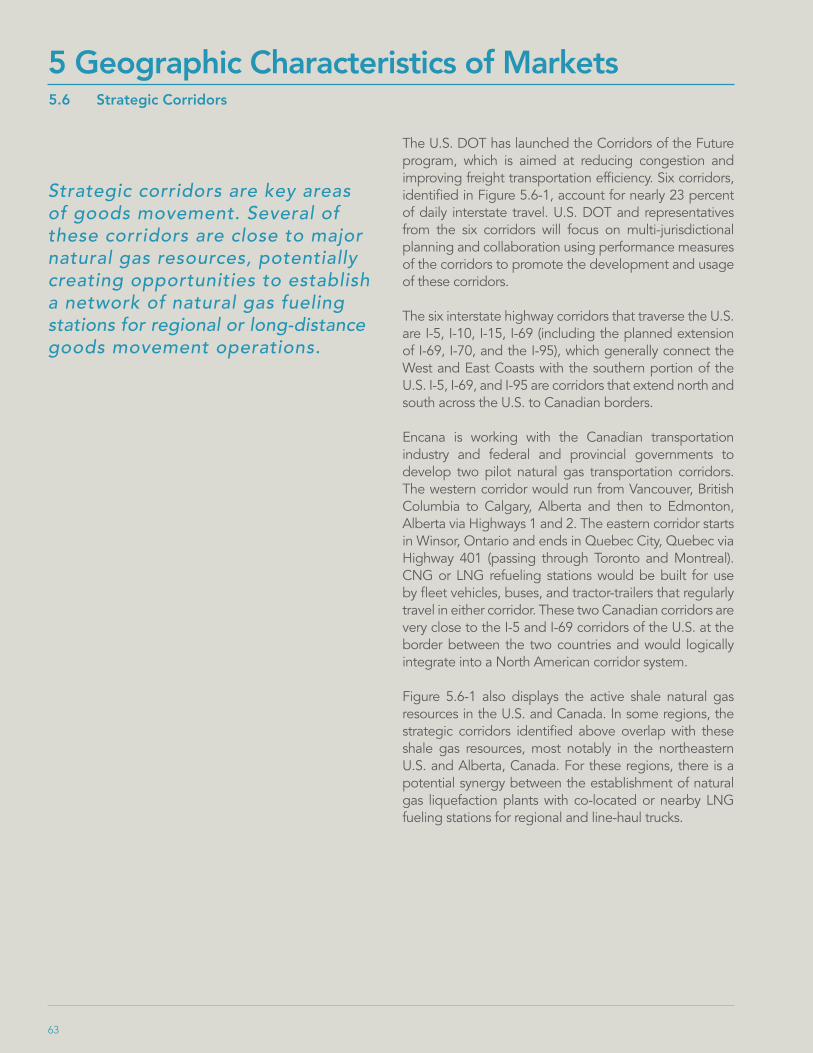
5 Geographic Characteristics of Markets
The U.S. DOT has launched the Corridors of the Future program, which is aimed at reducing congestion and improving freight transportation efficiency. Six corridors, identified in Figure 5.6-1, account for nearly 23 percent of daily interstate travel. U.S. DOT and representatives from the six corridors will focus on multi-jurisdictional planning and collaboration using performance measures of the corridors to promote the development and usage of these corridors.
The six interstate highway corridors that traverse the U.S. are I-5, I-10, I-15, I-69 (including the planned extension of I-69, I-70, and the I-95), which generally connect the West and East Coasts with the southern portion of the U.S. I-5, I-69, and I-95 are corridors that extend north and south across the U.S. to Canadian borders.
Encana is working with the Canadian transportation industry and federal and provincial governments to develop two pilot natural gas transportation corridors. The western corridor would run from Vancouver, British Columbia to Calgary, Alberta and then to Edmonton, Alberta via Highways 1 and 2. The eastern corridor starts in Winsor, Ontario and ends in Quebec City, Quebec via Highway 401 (passing through Toronto and Montreal). CNG or LNG refueling stations would be built for use by fleet vehicles, buses, and tractor-trailers that regularly travel in either corridor. These two Canadian corridors are very close to the I-5 and I-69 corridors of the U.S. at the border between the two countries and would logically integrate into a North American corridor system.
Figure 5.6-1 also displays the active shale natural gas resources in the U.S. and Canada. In some regions, the strategic corridors identified above overlap with these shale gas resources, most notably in the northeastern U.S. and Alberta, Canada. For these regions, there is a potential synergy between the establishment of natural gas liquefaction plants with co-located or nearby LNG fueling stations for regional and line-haul trucks.
Strategic corridors are key areas of goods movement. Several of these corridors are close to major natural gas resources, potentially creating opportunities to establish a network of natural gas fueling stations for regional or long-distance goods movement operations.
5.6 Strategic Corridors
63

Figure 5.6-1
Shale gas plays are active natural gas resources from shale rock. This map shows the geographic relationship of such North American natural gas resources to potential strategic NGV corridors.
I-5I-10I-15I-69Future I-69I-70
I-95Shale PlaysHwy 1Hwy 2Hwy 401
Corridors of the Future
64
Hwy 401
Hwy 1
Hwy 2
6 Recommendations
Develop natural gas fuel tracking methodology: Similar to the issues with tracking of NGVs, no comprehensive tracking system currently exists for natural gas fueling stations and the volumes of fuel dispensed (throughput) at each station. Periodically, time-intensive surveys are conducted that attempt to determine this information, but up-to-date and complete data are generally lacking. This lack of data makes it difficult to assess the extent of fueling infrastructure build-out, thereby hindering the planning process for strategic growth beyond limited regions.
Work with and incentivize OEMs to expand NGV and/or engine offerings: Across nearly every market segment reviewed in this report, there are significantly fewer NGV product offerings today compared to diesel and gasoline vehicles. For example, only one OEM passenger NGV is currently offered, a compact sedan. Only two OEM heavy-duty natural gas engines are currently available, although one or more additional engines are expected to soon be added. Several OEMs for various vehicle types have exited the NGV market over the last decade, although they are now considering re-entering the NGV market. SVMs have been able to partially fill this void by providing several additional vehicle and/or engine options, principally to fleets. However, the use of SVMs often leads to higher costs for NGVs due to low volumes and lack of a single responsible party for warranty. Future incentives need to be applied on a level playing field to better encourage OEMs to sustain, expand, or enter the business of making and selling NGVs and natural gas engines.
Continue to encourage and incentivize SVMs to expand NGV offerings: As noted above, SVMs play an important role and fill a significant void by providing NGV and natural gas engine options for the North American market. Some SVMs have begun to work closely with OEMs, modifying vehicles to OEM standards and selling the vehicle through an OEM dealership. This model potentially addresses several of the aforementioned issues while providing expanded vehicle choices. Future incentives need to be applied on a level playing field to better encourage better encourage SVMs to sustain and expand their NGV products and services.
Each vehicle market segment and application has its own unique characteristics (Table 6-1). Through the process of analyzing transportation market segments and the current penetration of NGVs into these markets, two overarching issues are identified in this report: 1) significant gaps that exist in available information regarding NGV deployments and fuel consumption inventories, and 2) relatively few commercial offerings of NGV platforms for potential end users to purchase. Recommendations to address these two issues are as follows:
Develop NGV tracking methodology: No comprehensive and publicly accessible database exists to track the sale and use of NGVs in either the U.S. or Canada. Estimates of population and fuel use are available from federal sources, but these data sets are surveys that lack numerous details needed to identify the specifics of successful NGV applications. The development of a more robust and detailed tracking methodology for NGVs is important to improve the understanding of the existing NGV market and enable it to move forward.
Vehicle availability and fueling infrastructure are key NGV market enablers. Sustaining and expanding NGV markets in North America significantly depends on a widening of commercial NGV offerings and obtaining a better understanding about how natural gas infrastructure is used.
65

Table 6-1
Vehicle availability and fueling infrastructure are key market enablers. More vehicle options and a better understanding of how natural gas infrastructure is used are important to further developing the NGV market in North America.
66
VehicleType/Application
Passenger Car/LightTruck (Private)
Passenger Car/LightTruck (Commercial)
Med-Duty Private and Commercial Van/Truck
Heavy-Duty:Package Delivery
Heavy-Duty:Utility Trucks
Heavy-Duty:School Bus
Heavy-Duty:Transit Bus
Off-road Service/UtilityVehicles
Heavy-Duty:Refuse Trucks
ConstructionEquipment
Heavy-Duty:Local/Regional Haul
MiningEquipment
Heavy-Duty:Line Haul Truck
Heavy-Duty: Stake,Flat Bed, and others
Range BaseFueling
InfrastructureVehicle
AvailabilityFuel CostSensitivity
EnvironmentalPolicies
Market Enablers Market Drivers
Good Fair Weak

67
This assessment was sponsored by America’s Natural Gas Alliance with the support of participating American Gas Association companies.
For questions, please contact:
TIAX LLC20813 Stevens Creek Blvd, Suite 250Cupertino, CA 95014
http://www.tiaxllc.com/services/
The opinions expressed within the Executive Summaries of Modules 1 and 2 of this market assessment are the work product of America’s Natural Gas Alliance (ANGA) and participating American Gas Association (AGA) companies based upon data provided by TIAX LLC. The Final Reports of Modules 1 through 5 are the work of TIAX LLC as a market assessment sponsored by ANGA with the support of participating AGA companies.