market review - office 2012 - odu - old dominion … are still controlling the market in hampton...
TRANSCRIPT

39
Author Casey J. O’Hearn
Associate Vice President
Jones Lang LaSalle
Data Analysis Geoff Thomas
Research & Financial Analyst
Jones Lang LaSalle
Financial The E. V. Williams Center for Real Estate and Economic Support Development (CREED) functions and reports are funded by
donations from individuals, organizations and the CREED IPAC and Council Advisory Boards.
Disclosure The data used for this report are deemed reliable; however, neither Old Dominion University, the E. V. Williams Center for Real Estate and Economic Development, nor sponsoring companiesand/or individuals makes any representation or warranty as to itsaccuracy.
20
12
OFFIC
E
H A M P T O N
R O A D S
M A R K E T
R E V I E W
OFFICE

402012 Hampton Roads Real Estate Market Review
The information in this report relies on market reports from the RCAnalytics, REIS, the CoStar Group Inc., and individualinterviews of local office brokers. The methodology or parameters of building size included in the report for all of HamptonRoads were 20,000 SF and higher for the largest completed lease transactions in 2011; 5,000 SF and higher wereincluded for the top completed office building sales transactions in 2011; approximately five acres and higher were includ-ed for the top completed office land sales transactions in 2011; and 20,000 SF and higher were included for top newconstruction deliveries in 2011.
METHODOLOGY
2012 O F F I C E
he Hampton Roads office market ended
2011 with positive absorption year over year
but overall, the statistical performance
reflected another sluggish year end with a
luke warm outlook on potential growth through 2012.
Still representing a tenant-oriented marketplace driven
by economic incentives and stagnant leasing activity,
the Hampton Roads office market is forecasted to
have another year of sluggish growth with the 2012
elections on the horizon affecting the local core
defense industry.
The 4th quarter 2011 overall vacancy rate for
Hampton Roads decreased to 13.5% from the 4th
quarter 2010 rate of 14.6%. This positive absorption
can be credited to no new product being delivered to
the Hampton Roads office market in 2011. Hampton
Roads did outperform the national office market
vacancy rate which finished 2011 down twenty basis
points from the end of 2010 at 16.0% direct vacancy.
However, the total vacancy for the national office
market finished 2011 at 17.6% reflecting a significant
amount of sublease space throughout the market.
General Overview
T

EconomyThe Hampton Roads economy has taken a discernible blow in the past two quarters. Major changesin defense spending and private industry out of state relocations have created economic tension forthe area. This migration will most likely be reflected in the first quarters of 2012. Contrary to recentevents, unemployment is still on a downward trend. Preliminary data suggests the November unem-ployment rate fell 30 basis points from October to 6.7 percent. Gross metro product has actuallyclimbed by 90 basis points, signaling no slow down in Hampton Roads' output. Considerable achieve-ments have been made to improve the areas ports and alleviate traffic congestion by expanding theMidtown tunnel. Gaps left by the decommissioned USJFCOM have been partially filled by the expan-sion of Navy Cyber Forces. However, reflecting on recovery progress of other Virginia cities, HamptonRoads has seen the smallest percentage increase in GDP, increases in credit delinquencies, and stillheavy dependence on defense spending.
Market ConditionsEndogenous shocks that occurred in the end of 2011 will likely be felt into 2012, decelerating forwardprogress. Tour activity has been extremely active with a major increase in defense contractors shop-ping for space. The expansion of Navy Cyber Forces has caught the eye of technology firms-one indus-try which Hampton Roads lacks. Although the activity looks promising, the area has just witnessed amajor outflow of tenants.Current tenants in the mar-ket are taking advantageof vacancies and consoli-dating offices, others arelooking to relocate to moredesirable properties.
Although major steps havebeen taken to improve thelocal economy, HamptonRoads relies on two indus-tries: defense and ship-ping. Past events haveproven that one pen strokecan severely impair thearea’s economic vitalityand Hampton Roads is notout of the woods yet. Current plans to relocate one of the area’s three carrier divisions to Florida hasthe possibility of removing 6,000 jobs and $425 million in annual revenue. Green Mountain Coffeerecently opened a facility in Isle of Wright, but rumors are circulating that they will be losing their patentfor the K-Cup instant-brew packaging in 2013, which may severely affect their revenue if other coffeecompanies can now compete with Green Mountain lines.
Key Market Indicators
Supply 30,934,900 sf
Direct vacancy rate 13.5 %
Total vacancy rate 13.9%
Under construction (% preleased) 262,289sf
Leasing activity 12 mo. % change 10.2%
YTD net absorption 44,306 sf
12-month overall rent % change -4.1%
Class A overall asking rent $21.27 psf
Class B overall asking rent $16.48 psf
12-month forecast
Pric
ing
Dem
and
Supp
ly
STILL KICKING THE CAN DOWNHAMPTON ROADS
20
12
OFFIC
E
41

422012 Hampton Roads Real Estate Market Review
2012 O F F I C E
OutlookConditions in Hampton Roads are not goingto improve significantly in 2012. Most likely,commercial real estate markets need to re-stabilize after the last wave of negativeabsorption. Continued reliance on defensespending will most likely keep growth onstandby as the market holds its breath for the2012 elections.
Tenant PerspectiveTenants are still controlling the market in Hampton Roads with vacancy rates driving concession packages.Forward looking tenants should lock-in longer terms to take advantage of lower rental rates. Longer terms willultimately provide stronger concessions packages which currently run $2 to $3 dollars per square foot per leaseyear for a new deal. Hampton Roads is currently one of the least expensive areas for businesses in the State ofVirginia. The combination of state and local government support and tenant concessions provides favorable leas-ing conditions for new tenants. Speculative development is all but nonexistent and developers, due to financingconstraints, are only able to build when a credit tenant has signed a long term lease. New construction shouldremain sluggish as the market absorbs existing high vacancies and does not warrant additional supply.
20%
15%
10%
5%
0%
1,200,000
800,000
400,000
0
-400,00
Net New Supply, Net Absorption and Total Vacancy
2007 2008 2009 2010 2011
Net New Supply Net Absorption Total Vacancy
Squa
re F
eet
2,000,000
1,500,000
1,000,000
500,000
02007 2008 2009 2010 2011
Leasing Activity Sublease Space
Leasing Activity vs. Sublease Vacant Space
Squa
re F
eet
Sublease space includes vacant space
20
12
OFFIC
E
43
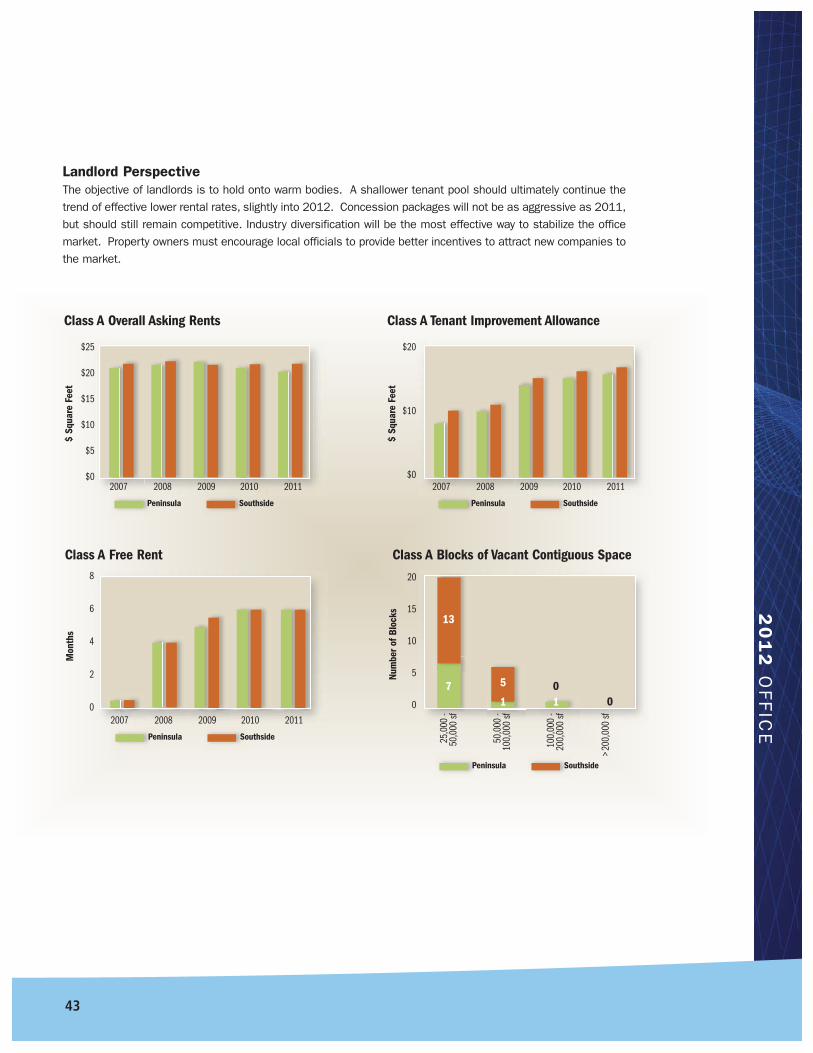
Landlord PerspectiveThe objective of landlords is to hold onto warm bodies. A shallower tenant pool should ultimately continue thetrend of effective lower rental rates, slightly into 2012. Concession packages will not be as aggressive as 2011,but should still remain competitive. Industry diversification will be the most effective way to stabilize the officemarket. Property owners must encourage local officials to provide better incentives to attract new companies tothe market.
$25
$20
$15
$10
$5
$0
$20
$10
$0
$ Sq
uare
Fee
t
$ Sq
uare
Fee
t
2007 2008 2009 2010 2011 2007 2008 2009 2010 2011
Peninsula Southside Peninsula Southside
Class A Overall Asking Rents Class A Tenant Improvement Allowance
8
6
4
2
0
20
15
10
5
0
Mon
ths
Num
ber o
f Blo
cks
2007 2008 2009 2010 2011
25,0
00 -
50,0
00 sf
50,0
00 -
100,
000
sf
100,
000
-20
0,00
0 sf
>200
,000
sf
Peninsula Southside
Peninsula Southside
Class A Free Rent Class A Blocks of Vacant Contiguous Space
13
7 5
10
01

442012 Hampton Roads Real Estate Market Review
2012 O F F I C E
Submarket Leverage – Market History and Forecast
Landlord-favorable conditions
Tenant-favorable conditions
Balanced conditions
Property Clock – Current Market Conditions
Land
lord
Lev
erag
e Tenant Leverage
PeakingMarket
FallingMarket
RisingMarket
BottomingMarket
Peninsula
Southside
Submarket 2009 2010 2011 2012 2013
Newport News
Hampton
Williamsburg
Yorktown
Norfolk
Virginia Beach
Portsmouth
Chesapeake
Suffolk
Completed Lease Transactions
Tenant Address Submarket SF TypeNavy Cyber Forces 116 Lake View Parkway Suffolk 125,000 ExpansionUS Coast Guard 300 Main Street Norfolk 121,643 Renewal Hewlett-Packard Development Company, L.P. 1434 Crossways Boulevard Chesapeake 112,297 Renewal AMSEC 550 Wood Lake Circle Chesapeake 67,615 Renewal SSAI 208 Golden Court Virginia Beach 63,029 RenwalNorfolk Department of Human Services 741 Monticello Ave Norfolk 60,000 Renewal General Dynamics Information Technology, Inc 700 Independence Parkway Chesapeake 59,509 RenewalSentara 1441 Crossways Boulevard Chesapeake 54,476 RenewalAECOM 741 Monticello Avenue Norfolk 35,000 ExpansionSAIC 2877 Guardian Lane Virginia Beach 32,000 NewSDV Properties LLC 133 Waller Mill Rd Williamsburg 28,764 NewAmerigroup 1301 Executive Boulevard Chesapeake 25,500 NewStrayer University 675 Old Oyster Point Road Newport News 25,000 NewCrescent Recovery 510 Independence Boulevard Chesapeake 23,424 RenewalCDYNE Corporation 505 Independence Boulevard Chesapeake 23,328 NewCommonwealth of VA, Dept. of General Services 2600 Washington Ave Newport News 23,129 Renewal H&A Architects & Engineers 222-236 Central Park Ave Virginia Beach 23,000 NewBon Secours 1040 University Boulevard Portsmouth 13,729 NewCACI 999 Waterside Drive Norfolk 11,600 ExpansionHunton Williams World Trade Center Norfolk 10,000 New Harry Jernigan CPA, PC 5101 Cleveland St Virginia Beach 9,481 NewPAPCO, INC 5101 Cleveland St Virginia Beach 6,050 New
Hampton Roads methodology: Inventory includes all Class A, B, & C office properties > 20,000 square feet, excluding all condo, medical and government owned buildings, andowner occupied buildings
20
12
OFFIC
E
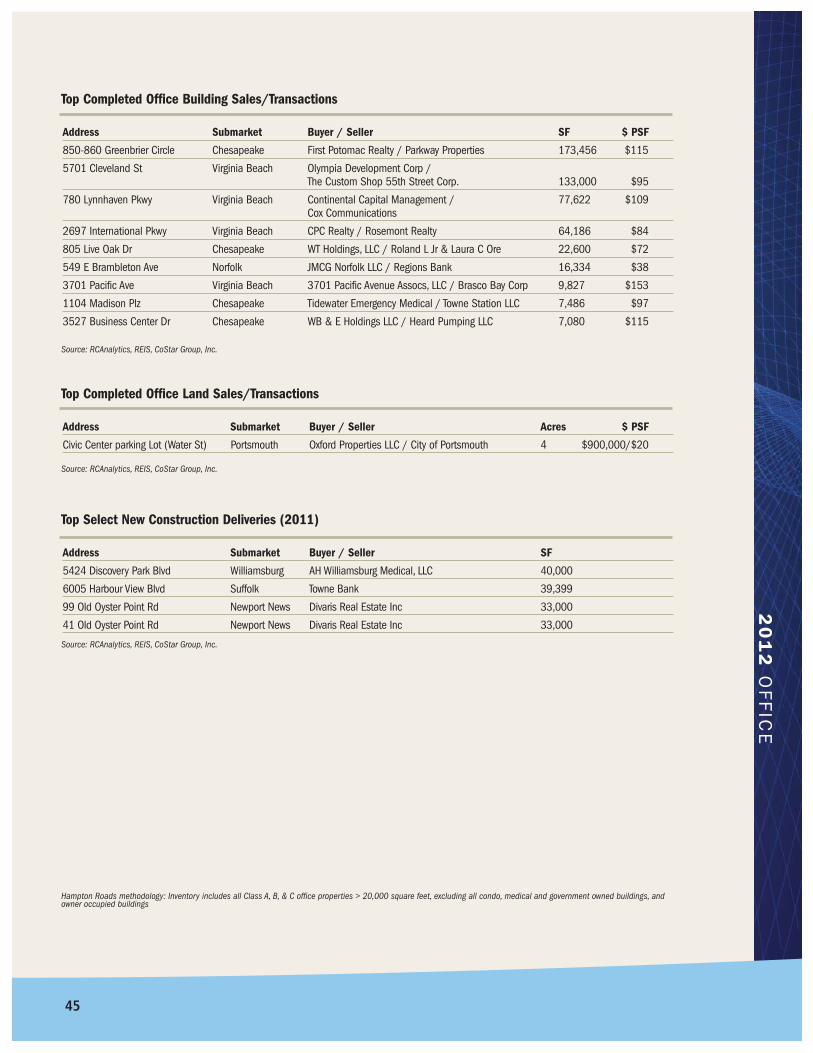
Top Completed Office Building Sales/Transactions
Address Submarket Buyer / Seller SF $ PSF
850-860 Greenbrier Circle Chesapeake First Potomac Realty / Parkway Properties 173,456 $115
5701 Cleveland St Virginia Beach Olympia Development Corp / The Custom Shop 55th Street Corp. 133,000 $95
780 Lynnhaven Pkwy Virginia Beach Continental Capital Management / 77,622 $109Cox Communications
2697 International Pkwy Virginia Beach CPC Realty / Rosemont Realty 64,186 $84
805 Live Oak Dr Chesapeake WT Holdings, LLC / Roland L Jr & Laura C Ore 22,600 $72
549 E Brambleton Ave Norfolk JMCG Norfolk LLC / Regions Bank 16,334 $38
3701 Pacific Ave Virginia Beach 3701 Pacific Avenue Assocs, LLC / Brasco Bay Corp 9,827 $153
1104 Madison Plz Chesapeake Tidewater Emergency Medical / Towne Station LLC 7,486 $97
3527 Business Center Dr Chesapeake WB & E Holdings LLC / Heard Pumping LLC 7,080 $115
Source: RCAnalytics, REIS, CoStar Group, Inc.
Top Completed Office Land Sales/Transactions
Address Submarket Buyer / Seller Acres $ PSF
Civic Center parking Lot (Water St) Portsmouth Oxford Properties LLC / City of Portsmouth 4 $900,000/$20
Top Select New Construction Deliveries (2011)
Address Submarket Buyer / Seller SF
5424 Discovery Park Blvd Williamsburg AH Williamsburg Medical, LLC 40,000
6005 Harbour View Blvd Suffolk Towne Bank 39,399
99 Old Oyster Point Rd Newport News Divaris Real Estate Inc 33,000
41 Old Oyster Point Rd Newport News Divaris Real Estate Inc 33,000
Source: RCAnalytics, REIS, CoStar Group, Inc.
Source: RCAnalytics, REIS, CoStar Group, Inc.
Hampton Roads methodology: Inventory includes all Class A, B, & C office properties > 20,000 square feet, excluding all condo, medical and government owned buildings, andowner occupied buildings
45
462012 Hampton Roads Real Estate Market Review
2012 O F F I C E
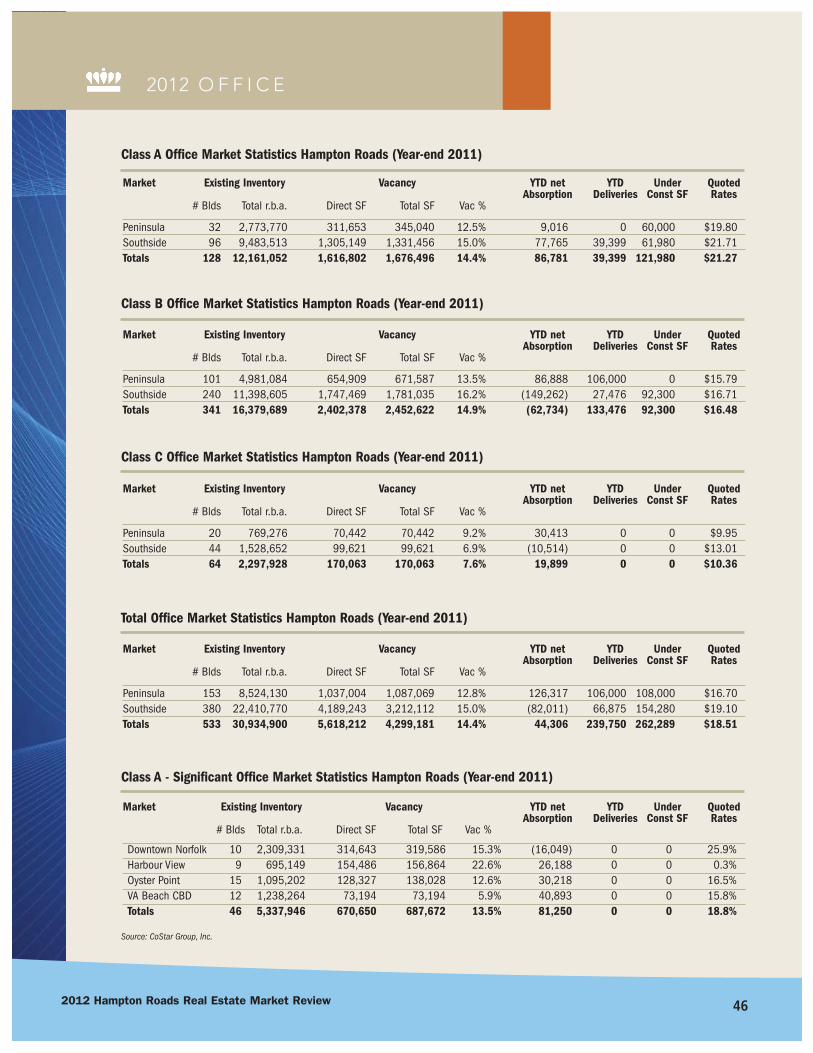
Class A Office Market Statistics Hampton Roads (Year-end 2011)
Market Existing Inventory Vacancy YTD net YTD Under QuotedAbsorption Deliveries Const SF Rates
# Blds Total r.b.a. Direct SF Total SF Vac %
Peninsula 32 2,773,770 311,653 345,040 12.5% 9,016 0 60,000 $19.80Southside 96 9,483,513 1,305,149 1,331,456 15.0% 77,765 39,399 61,980 $21.71Totals 128 12,161,052 1,616,802 1,676,496 14.4% 86,781 39,399 121,980 $21.27
Class B Office Market Statistics Hampton Roads (Year-end 2011)
Market Existing Inventory Vacancy YTD net YTD Under QuotedAbsorption Deliveries Const SF Rates
# Blds Total r.b.a. Direct SF Total SF Vac %
Peninsula 101 4,981,084 654,909 671,587 13.5% 86,888 106,000 0 $15.79Southside 240 11,398,605 1,747,469 1,781,035 16.2% (149,262) 27,476 92,300 $16.71Totals 341 16,379,689 2,402,378 2,452,622 14.9% (62,734) 133,476 92,300 $16.48
Class C Office Market Statistics Hampton Roads (Year-end 2011)
Market Existing Inventory Vacancy YTD net YTD Under QuotedAbsorption Deliveries Const SF Rates
# Blds Total r.b.a. Direct SF Total SF Vac %
Peninsula 20 769,276 70,442 70,442 9.2% 30,413 0 0 $9.95Southside 44 1,528,652 99,621 99,621 6.9% (10,514) 0 0 $13.01Totals 64 2,297,928 170,063 170,063 7.6% 19,899 0 0 $10.36
Total Office Market Statistics Hampton Roads (Year-end 2011)
Market Existing Inventory Vacancy YTD net YTD Under QuotedAbsorption Deliveries Const SF Rates
# Blds Total r.b.a. Direct SF Total SF Vac %
Peninsula 153 8,524,130 1,037,004 1,087,069 12.8% 126,317 106,000 108,000 $16.70Southside 380 22,410,770 4,189,243 3,212,112 15.0% (82,011) 66,875 154,280 $19.10Totals 533 30,934,900 5,618,212 4,299,181 14.4% 44,306 239,750 262,289 $18.51
Source: CoStar Group, Inc.
Class A - Significant Office Market Statistics Hampton Roads (Year-end 2011)
Market Existing Inventory Vacancy YTD net YTD Under QuotedAbsorption Deliveries Const SF Rates
# Blds Total r.b.a. Direct SF Total SF Vac %
Downtown NorfolkHarbour ViewOyster PointVA Beach CBDTotals
2,309,331695,149
1,095,2021,238,2645,337,946
314,643154,486128,327
73,194670,650
319,586156,864138,028
73,194687,672
15.3%22.6%12.6%
5.9%13.5%
(16,049)26,18830,21840,89381,250
00000
00000
25.9%0.3%
16.5%15.8%18.8%
109
151246

20
12
OFFIC
E
47
Source: CoStar Group, Inc.
Class B - Significant Office Market Statistics Hampton Roads (Year-end 2011)
Market Existing Inventory Vacancy YTD net YTD Under QuotedAbsorption Deliveries Const SF Rates
# Blds Total r.b.a. Direct SF Total SF Vac %
Downtown NorfolkHarbour ViewOyster PointVA Beach CBDTotals
2,185,124488,862
2,000,458708,701
5,383,145
565,7631,441
313,18192,888
973,273
566,9631,441
329,85996,929
995,192
25.9%0.3%
16.5%15.8%18.8%
(51,135)12,95928,374
(63,554)(73,356)
066,000
00
66,000
00000
$16.71$26.00$15.87$17.22$16.55
289
421897
Source: CoStar Group, Inc.
Class C - Significant Office Market Statistics Hampton Roads (Year-end 2011)
Market Existing Inventory Vacancy YTD net YTD Under QuotedAbsorption Deliveries Const SF Rates
# Blds Total r.b.a. Direct SF Total SF Vac %
Downtown NorfolkHarbour ViewOyster PointVA Beach CBDTotals
236,1990
171,6730
407,872
31,0000
5,9320
36,932
31,0000
5,9320
36,932
13.1%0.0%3.5%0.0%9.1%
00
2,6720
2,672
00000
00000
NANA
$14.75N/A
$14.75
6060
12
Source: CoStar Group, Inc.
Significant Office Market Statistics Hampton Roads (Year-end 2011)
Market Existing Inventory Vacancy YTD net YTD Under QuotedAbsorption Deliveries Const SF Rates
# Blds Total r.b.a. Direct SF Total SF Vac %
Downtown NorfolkHarbour ViewOyster PointVA Beach CBDTotals
4,730,6541,184,0113,267,3331,946,965
11,128,963
911,406155,927447,440166,082
1,680,855
917,549158,305473,819170,123
1,719,796
20.1%13.4%14.5%
9.5%15.9%
(67,184)39,13761,264
(22,661)10,566
00
66,0000
66,000
00000
$19.38$24.11$17.14$19.84$19.36
44186330
155
REGIONAL OFFICE MARKET COMPARISONThe relative vitality of the Hampton Roads office market can be more clearly illustrated by comparing the area’s2011 performance to the nearby Virginia markets of Richmond, the District of Columbia, as well as the NorthCarolina markets of Raleigh-Durham and Charlotte. Clearly our regional competitive areas fared well in compari-son to the United States’ national office vacancy rate.
Q4 2011 DATA — FROM COSTAR OFFICE MARKET REPORTThe office vacancy rate in the Richmond, VA office market area ended the year at a direct vacancy of 10.9% andtotal vacancy of 11.8%. In Raleigh-Durham, NC the market closed the year at 16.0% direct and 16.8% total. TheCharlotte, NC market finished at 16.8% direct and 18.1% total. And finally the office vacancy rate in the Districtof Columbia (Washington D.C.) office market finished 2011 at 13.0% direct vacancy and 14.2% total.

DOWNTOWN NORFOLK
CLASS A150 West Main Street . . . . . . . . . . . . . . . . . . . . .226,183 Bank of America . . . . . . . . . . . . . . . . . . . . . . . . . .340,000 Crown Center . . . . . . . . . . . . . . . . . . . . . . . . . . . . .62,000 Dominion Tower . . . . . . . . . . . . . . . . . . . . . . . . . .403,276 Fort Norfolk Medical Office Tower . . . . . . . . . . .196,000 Main Street Tower . . . . . . . . . . . . . . . . . . . . . . . . .200,000 Norfolk Southern Tower . . . . . . . . . . . . . . . . . . . . .301,463 Town Point Center . . . . . . . . . . . . . . . . . . . . . . . . .130,266 World Trade Center . . . . . . . . . . . . . . . . . . . . . . . .366,941 Wells Fargo Center . . . . . . . . . . . . . . . . . . . . . . .255,000
CLASS B101 Granby Street . . . . . . . . . . . . . . . . . . . . . . . . .22,000 141 W. Virginia Beach Blvd. (ABC Building) . . . . . .10,000 201 Granby Mall Building . . . . . . . . . . . . . . . . . . .76,071 250 W. Brambleton Avenue . . . . . . . . . . . . . . . . . .17,984 345 W. Freemason . . . . . . . . . . . . . . . . . . . . . . . . .11,000 500 Plume Street . . . . . . . . . . . . . . . . . . . . . . . . . .60,000 500 E. Main St. (BB&T) . . . . . . . . . . . . . . . . . . . .230,000 City Centre . . . . . . . . . . . . . . . . . . . . . . . . . . . . . . .54,138 Hague Medical Center . . . . . . . . . . . . . . . . . . . . . .31,659 Madison Office Building . . . . . . . . . . . . . . . . . . . .82,000 Monticello Arcade . . . . . . . . . . . . . . . . . . . . . . . . . .44,500 The Monticello Building . . . . . . . . . . . . . . . . . . . . .70,000 Plume Center West . . . . . . . . . . . . . . . . . . . . . . . . .82,375 RBC Centura Tower . . . . . . . . . . . . . . . . . . . . . . . .111,600 St. Paul Building . . . . . . . . . . . . . . . . . . . . . . . . . . .47,308 Seaboard Center . . . . . . . . . . . . . . . . . . . . . . . . . .30,000 Tazewell Building . . . . . . . . . . . . . . . . . . . . . . . . . .38,000 The Helena Building . . . . . . . . . . . . . . . . . . . . . . . .20,100 Towne Bank Building . . . . . . . . . . . . . . . . . . . . . . .52,698 Wainwright Building . . . . . . . . . . . . . . . . . . . . . . . .83,151 York Street Center . . . . . . . . . . . . . . . . . . . . . . . . . .52,293
CLASS C220 West Freemason Street . . . . . . . . . . . . . . . . . .10,775 255 Granby Street . . . . . . . . . . . . . . . . . . . . . . . . .30,000 400 Gresham Drive (The Medical Building) . . . . . .78,867 700 Monticello Avenue . . . . . . . . . . . . . . . . . . . . .22,760 700 Boush Street . . . . . . . . . . . . . . . . . . . . . . . . .16,825 Anders Williams Building . . . . . . . . . . . . . . . . . . . .14,000 Duke Grace Building . . . . . . . . . . . . . . . . . . . . . . .26,417 Ghent-Olney Building . . . . . . . . . . . . . . . . . . . . . . .24,000 Lonsdale Building . . . . . . . . . . . . . . . . . . . . . . . . . .18,000 Norfolk Community Services . . . . . . . . . . . . . . . . .16,192 Wainwright Building . . . . . . . . . . . . . . . . . . . . . . . .82,318
OWNER OCCUPIEDAT&T . . . . . . . . . . . . . . . . . . . . . . . . . . . . . . . . . .200,000 Atlantic Building . . . . . . . . . . . . . . . . . . . . . . . . . . .14,000 Decker Building . . . . . . . . . . . . . . . . . . . . . . . . . . .10,000 Dominion Enterprises . . . . . . . . . . . . . . . . . . . . . .220,000 Landmark Communications . . . . . . . . . . . . . . . . . .66,500 Norfolk Telcom Center . . . . . . . . . . . . . . . . . . . . . . .60,000 Peta . . . . . . . . . . . . . . . . . . . . . . . . . . . . . . . . . . . .25,000 Standard Forms . . . . . . . . . . . . . . . . . . . . . . . . . . .30,000 Two Commercial Place . . . . . . . . . . . . . . . . . . . . .234,450 Virginian Pilot Building . . . . . . . . . . . . . . . . . . . . .174,141
AIRPORT/NORTHAMPTON
CLASS ATwin Oaks I . . . . . . . . . . . . . . . . . . . . . . . . . . . . . . .88,000 Twin Oaks II . . . . . . . . . . . . . . . . . . . . . . . . . . . . . .88,000 The Concourse . . . . . . . . . . . . . . . . . . . . . . . . . .325,000
CLASS BAirport Executive Center . . . . . . . . . . . . . . . . . . . . .70,609 Circle South . . . . . . . . . . . . . . . . . . . . . . . . . . . . . .48,000 HRSA-ILA Bldg (Longshoremen’s) . . . . . . . . . . . . . .21,678 Northhampton Executive Center
corrected buiding size . . . . . . . . . . . . . . . . . . . .69,904
CLASS CElectrical Workers Corporation Office . . . . . . . . . . .22,020
OWNER OCCUPIEDCMA/CGM (USA) . . . . . . . . . . . . . . . . . . . . . . . . . .90,000 Commander Corporate Center . . . . . . . . . . . . . . . .65,000 Silver Oak . . . . . . . . . . . . . . . . . . . . . . . . . . . . . . . .78,200 Zim-American Israeli Shipping . . . . . . . . . . . . . . . .30,000
CENTRAL NORFOLK
CLASS B100 Kingsley Lane, DePaul Health Park” . . . . . . . .48,000 110 Kingsley Lane, DePaul Medical Building” . . . .39,054 160 Lingsley Lane, DePaul Medical Atrium” . . . . . .40,000 241 Corporate Blvd. (VA Eye Development) . . . . . .34,070 930 Majestic Avenue . . . . . . . . . . . . . . . . . . . . . . . .9,500 5360 Robin Hood Road . . . . . . . . . . . . . . . . . . . . .42,000 Almeda Business Center (flex) . . . . . . . . . . . . . . . .84,000 Central Center Office Building . . . . . . . . . . . . . . . . .53,815 Commerce Park Place(flex) . . . . . . . . . . . . . . . . . .58,783 Gateway II(flex) . . . . . . . . . . . . . . . . . . . . . . . . . . . .45,000 Lafayette Executive Center . . . . . . . . . . . . . . . . . . .18,641 Lawson Building . . . . . . . . . . . . . . . . . . . . . . . . . . .20,022 Norfolk Business Center (flex) . . . . . . . . . . . . . . . .89,000 Norfolk Business Center II (flex) . . . . . . . . . . . . . .126,926 Norfolk Commerce Center I(flex) . . . . . . . . . . . . . . .73,000 Norfolk Commerce Center III(flex) . . . . . . . . . . . . .168,000 Norfolk Commerce Center IV(flex) . . . . . . . . . . . . . .79,980 Norfolk Commerce Center V(flex) . . . . . . . . . . . . . .72,000
CLASS C4100 Building . . . . . . . . . . . . . . . . . . . . . . . . . . . .20,614 Atlas Building . . . . . . . . . . . . . . . . . . . . . . . . . . . . .30,476 Blair Building . . . . . . . . . . . . . . . . . . . . . . . . . . . . .15,000 Southern Office Building . . . . . . . . . . . . . . . . . . . . .11,061 Time Building . . . . . . . . . . . . . . . . . . . . . . . . . . . . .32,000
OWNER OCCUPIEDAmerican Funds Building . . . . . . . . . . . . . . . . . . .106,000
CHESAPEAKE/GREENBRIER
CLASS ABECO Corp HQ (609 Independence) . . . . . . . . . . .22,400 Crossways Center . . . . . . . . . . . . . . . . . . . . . . . . . .52,702 CHKD Health Center (Volvo Park VI) . . . . . . . . . . . .25,000 Chubb Building . . . . . . . . . . . . . . . . . . . . . . . . . . .97,500 Dendrite One . . . . . . . . . . . . . . . . . . . . . . . . . . . . .50,000 Dendrite Two . . . . . . . . . . . . . . . . . . . . . . . . . . . . . .50,000 EDS - 1434 Crossways Blvd . . . . . . . . . . . . . . . .111,000 Greenbrier Tower I . . . . . . . . . . . . . . . . . . . . . . . . . .87,900 Greenbrier Tower II . . . . . . . . . . . . . . . . . . . . . . . . .86,976 HR Realtors Association Bldg (638 Independence) .40,000 Independence Place . . . . . . . . . . . . . . . . . . . . . . .73,345 Lake Center I . . . . . . . . . . . . . . . . . . . . . . . . . . . . .60,000 Lake Center II . . . . . . . . . . . . . . . . . . . . . . . . . . . . .64,000 Liberty One . . . . . . . . . . . . . . . . . . . . . . . . . . . . . . .50,000 Liberty Two . . . . . . . . . . . . . . . . . . . . . . . . . . . . . . .50,000 Liberty Three . . . . . . . . . . . . . . . . . . . . . . . . . . . . . .75,000 1403 Greenbrier Parkway (Gateway Bank) . . . . . . .75,000
CLASS BAtlantic Business Center . . . . . . . . . . . . . . . . . . . . .60,000 Battlefield Corporate Center . . . . . . . . . . . . . . . . . .98,000 Battlefield Lakes Tech Center I . . . . . . . . . . . . . . . .38,500 Battlefield Lakes Tech Center II . . . . . . . . . . . . . . . .29,000 Battlefield Lakes Tech Center III . . . . . . . . . . . . . . .18,000 Battlefield Technology Center . . . . . . . . . . . . . . . . .51,578 Battlefield Technology Center I . . . . . . . . . . . . . . . .97,000 Battlefield Technology Center II (MCI) . . . . . . . . . . .81,478 Branch Executive Quarter-Hamilton . . . . . . . . . . . .11,600 Branch Executive Quarter-Jefferson . . . . . . . . . . . . .23,838 Branch Executive Quarter-Madison . . . . . . . . . . . . .16,788 Chelsea Commons WCMB . . . . . . . . . . . . . . . . . . .12,400 1580 Crossways Blvd . . . . . . . . . . . . . . . . . . . . . . .10,800 Crossways Commerce Center II . . . . . . . . . . . . . .145,300 Crossways Commerce Center I . . . . . . . . . . . . . . . .45,000 Crossways I . . . . . . . . . . . . . . . . . . . . . . . . . . . . .137,007 Crossways II (flex) . . . . . . . . . . . . . . . . . . . . . . . . . .84,751 Crossways III . . . . . . . . . . . . . . . . . . . . . . . . . . . . .61,992 Dominion Business Center . . . . . . . . . . . . . . . . . . .20,000 Eden North Center . . . . . . . . . . . . . . . . . . . . . . . . .18,700 Greenbrier Business Centre (flex) . . . . . . . . . . . . . .91,561 Greenbrier Circle Corporate Center . . . . . . . . . . . .233,138 Greenbrier Executive Center II
(I was torn down for a hotel) . . . . . . . . . . . . . . .26,787 Greenbrier Point II . . . . . . . . . . . . . . . . . . . . . . . . .16,000
Greenbrier Tech Center One (flex) . . . . . . . . . . . . . .95,414 Greenbrier Tech Center Two (flex) . . . . . . . . . . . . . .82,340 Hanbury Office Park . . . . . . . . . . . . . . . . . . . . . . . .24,000 Hanbury Road Business Center . . . . . . . . . . . . . . . .9,000 Independence Technology Center I . . . . . . . . . . . . .98,000 Rose and Womble Business Center . . . . . . . . . . . .13,432 SunTrust Bank Building . . . . . . . . . . . . . . . . . . . . .23,000 737 Volvo Parkway . . . . . . . . . . . . . . . . . . . . . . . . .36,000 Volvo Park (Progressive Drive) . . . . . . . . . . . . . . . . .52,000 Volvo VII . . . . . . . . . . . . . . . . . . . . . . . . . . . . . . . . .13,000 Greenbrier Business Center . . . . . . . . . . . . . . . . . .50,000 Greenbrier Square . . . . . . . . . . . . . . . . . . . . . . . . .26,250 Heritage Bank Building . . . . . . . . . . . . . . . . . . . . . .12,654 Riverwalk Professional Bldg . . . . . . . . . . . . . . . . . .10,000 Woodbrier Terrace . . . . . . . . . . . . . . . . . . . . . . . . . .10,000 Wright Building . . . . . . . . . . . . . . . . . . . . . . . . . . .12,000
CLASS C2125 Smith Avenue . . . . . . . . . . . . . . . . . . . . . . . .42,423 Knells Ridge Plaza . . . . . . . . . . . . . . . . . . . . . . . . .15,500 Old Greenbrier Village . . . . . . . . . . . . . . . . . . . . . . .34,015
OWNER OCCUPIEDCox Communications . . . . . . . . . . . . . . . . . . . . .150,000 Dollar Tree . . . . . . . . . . . . . . . . . . . . . . . . . . . . . .300,000 First Data . . . . . . . . . . . . . . . . . . . . . . . . . . . . . . . .42,557 Household Finance . . . . . . . . . . . . . . . . . . . . . . . .60,000 Panasonic Call Center . . . . . . . . . . . . . . . . . . . . . .55,000
HILLTOP/OCEANFRONT
CLASS APavilion Center (Towne Bank) . . . . . . . . . . . . . . . . .85,177 Potter Professional Center . . . . . . . . . . . . . . . . . . .27,500 William E. Wood Building . . . . . . . . . . . . . . . . . . . .20,000
CLASS B1206 Laskin Road Executive Center . . . . . . . . . . . .33,000 Beach Health Pavilion . . . . . . . . . . . . . . . . . . . . . .57,800 Beach Tower . . . . . . . . . . . . . . . . . . . . . . . . . . . . . .23,000 Birdneck Office Park . . . . . . . . . . . . . . . . . . . . . . . .10,182 Birdneck Square . . . . . . . . . . . . . . . . . . . . . . . . . . .17,285 Camelot Professional Center . . . . . . . . . . . . . . . . .40,725 Colonial Mill Professional Center . . . . . . . . . . . . . .23,555 Damalas Centre . . . . . . . . . . . . . . . . . . . . . . . . . . .16,900 First Colonial Office Park . . . . . . . . . . . . . . . . . . . .18,000 General Booth Professional Center . . . . . . . . . . . . .11,000 Gibson Pavilion . . . . . . . . . . . . . . . . . . . . . . . . . . . .30,000 Great Neck Professional Bldg. . . . . . . . . . . . . . . . .20,000 Heritage Commons . . . . . . . . . . . . . . . . . . . . . . . . .11,000 Hilltop West Executive Center . . . . . . . . . . . . . . . . .23,000 Louisa Avenue Building One . . . . . . . . . . . . . . . . . .11,000 Louisa Avenue Building Two . . . . . . . . . . . . . . . . . .11,000 Louisa Avenue Building Three . . . . . . . . . . . . . . . . . .8,195 Mill Dam Crossing . . . . . . . . . . . . . . . . . . . . . . . . .22,037 Rudd Building . . . . . . . . . . . . . . . . . . . . . . . . . . . .13,000 Sandpiper Key Associates Bldg. . . . . . . . . . . . . . . .32,000 1092 Laskin Road . . . . . . . . . . . . . . . . . . . . . . . . .18,240
CLASS COceana East . . . . . . . . . . . . . . . . . . . . . . . . . . . . .10,360”
CORPORATE LANDING
CLASS BExecutive Center at Corporate Landing . . . . . . . . .45,000”Princess Anne Executive Park . . . . . . . . . . . . . . . .59,756”Verizon Building . . . . . . . . . . . . . . . . . . . . . . . . . . .10,000
OWNER OCCUPIEDAl-Anon . . . . . . . . . . . . . . . . . . . . . . . . . . . . . . . . .30,000 Liberty Tax Service . . . . . . . . . . . . . . . . . . . . . . . . .30,000 GEICO . . . . . . . . . . . . . . . . . . . . . . . . . . . . . . . . .250,000
KEMPSVILLE
CLASS AChadwick Building . . . . . . . . . . . . . . . . . . . . . . . . .80,000 Grayson Building . . . . . . . . . . . . . . . . . . . . . . . . . .42,000 Metroplex 1 . . . . . . . . . . . . . . . . . . . . . . . . . . . . . .35,000
CLASS B1201 Lake James Office . . . . . . . . . . . . . . . . . . . .12,000 3386 Holland Road . . . . . . . . . . . . . . . . . . . . . . . .20,000 5301 Providence Road (Providence South) . . . . .12,000
2011 Office Building Directory
2012 Hampton Roads Real Estate Market Review 48

Arrowhead Office Court . . . . . . . . . . . . . . . . . . . . . .10,000 Atrium of College Park Square . . . . . . . . . . . . . . . .36,379 Central Park I (552 Central Dr) . . . . . . . . . . . . . . . .18,000 Central Park II (544 Central) . . . . . . . . . . . . . . . . .43,000 College Park Square III . . . . . . . . . . . . . . . . . . . . . .30,150 Courtyard at Providence . . . . . . . . . . . . . . . . . . . .17,879 Fairfield Square . . . . . . . . . . . . . . . . . . . . . . . . . . .12,933 Holland South . . . . . . . . . . . . . . . . . . . . . . . . . . . .14,843 Holland/Taft Professional Center . . . . . . . . . . . . . .11,850 Kempsville Office Park . . . . . . . . . . . . . . . . . . . . . .30,722 Oxford Square . . . . . . . . . . . . . . . . . . . . . . . . . . . .13,544 Woolpert Building . . . . . . . . . . . . . . . . . . . . . . . . . .36,700
LYNNHAVEN
CLASS AChase Building . . . . . . . . . . . . . . . . . . . . . . . . . . . .31,910 Lynnhaven Commons Complex . . . . . . . . . . . . . . .25,000 Lynnhaven Commons (office bldg) . . . . . . . . . . . . .26,000 Lynnhaven II . . . . . . . . . . . . . . . . . . . . . . . . . . . . . .36,000 Lynnwood Plaza . . . . . . . . . . . . . . . . . . . . . . . . . . .87,157 Marsh Landing . . . . . . . . . . . . . . . . . . . . . . . . . . . .62,117 Oceana Center One . . . . . . . . . . . . . . . . . . . . . . . .39,928 Oceana Place . . . . . . . . . . . . . . . . . . . . . . . . . . . . .75,369 Park West AMSEC . . . . . . . . . . . . . . . . . . . . . . . . .66,180 Pinehurst Centre . . . . . . . . . . . . . . . . . . . . . . . . .103,000 Reflections I . . . . . . . . . . . . . . . . . . . . . . . . . . . . . .62,924 Reflections II . . . . . . . . . . . . . . . . . . . . . . . . . . . . .73,676 Reflections III . . . . . . . . . . . . . . . . . . . . . . . . . . . . .67,000 Reflections IV . . . . . . . . . . . . . . . . . . . . . . . . . . . . .80,000 Viking Building . . . . . . . . . . . . . . . . . . . . . . . . . . . .18,900 Windwood Center . . . . . . . . . . . . . . . . . . . . . . . . . .78,348
CLASS B2700 International Parkway . . . . . . . . . . . . . . . . . .53,000 Advanced Technology Building . . . . . . . . . . . . . . . .32,000 Basgier Bldg. I . . . . . . . . . . . . . . . . . . . . . . . . . . . .18,200 Basgier Bldg. II . . . . . . . . . . . . . . . . . . . . . . . . . . . .20,000 Bennett Office Building (120 S. Lynnhaven) . . . . . .10,522 Commercial Place . . . . . . . . . . . . . . . . . . . . . . . . .36,400 Gateway Bank Building (641 Lynnhaven) . . . . . . . .18,000 Lynnhaven Corporate Center I . . . . . . . . . . . . . . . .36,046 Lynnhaven Corporate Center II . . . . . . . . . . . . . . . .40,300 Lynnhaven Executive Center . . . . . . . . . . . . . . . . . .18,000 Lynnhaven Five . . . . . . . . . . . . . . . . . . . . . . . . . . . .24,549 Lynnhaven North . . . . . . . . . . . . . . . . . . . . . . . . . .10,000 Lynnhaven Professional Center . . . . . . . . . . . . . . . .12,000 Lynnhaven Station . . . . . . . . . . . . . . . . . . . . . . . . .26,226 Parkway Center 3 and 4 . . . . . . . . . . . . . . . . . . . . .64,567 Parkway Center I & II . . . . . . . . . . . . . . . . . . . . . . .32,112 Parkway III (Unisys) . . . . . . . . . . . . . . . . . . . . . . . .50,428 Parkway West (flex) . . . . . . . . . . . . . . . . . . . . . . . . .41,563 RBM Building . . . . . . . . . . . . . . . . . . . . . . . . . . . . .14,170 Sabre Street I . . . . . . . . . . . . . . . . . . . . . . . . . . . . .68,000 Sabre Street II . . . . . . . . . . . . . . . . . . . . . . . . . . . .60,000 Sabre Street III . . . . . . . . . . . . . . . . . . . . . . . . . . . .40,000 Sabre Street IV . . . . . . . . . . . . . . . . . . . . . . . . . . . .40,000 South Lynnhaven Business Park . . . . . . . . . . . . . . .40,000 U.S. Commerce Center (Tidewater Tech) . . . . . . . . .26,819 Yorktown Commerce Center
(228 N. Lynnhaven) . . . . . . . . . . . . . . . . . . . . . .30,529
OWNER OCCUPIEDCenit Bank Bldg . . . . . . . . . . . . . . . . . . . . . . . . . . .40,000 Global Technical Systems . . . . . . . . . . . . . . . . . . . .46,000 Hall Automotive . . . . . . . . . . . . . . . . . . . . . . . . . . .29,865 SAIC . . . . . . . . . . . . . . . . . . . . . . . . . . . . . . . . . . . .60,000
LITTLE NECK
CLASS B3300 Building (Virginia Beach Blvd.) . . . . . . . . . . .11,000 King’s Grant Office Building . . . . . . . . . . . . . . . . . .13,000 Little Neck Office Park (3300 Bldg) . . . . . . . . . . . .33,000 Little Neck Office Park (3300 South) . . . . . . . . . . .50,000 Little Neck Office Park (3400 Bldg) . . . . . . . . . . . .22,000 Little Neck Towers . . . . . . . . . . . . . . . . . . . . . . . . . .48,860 Lynnhaven Station 101 North Lynnhaven ( . . . . . . .28,000 NEXCOM Building . . . . . . . . . . . . . . . . . . . . . . . . . .75,000 NEXCOM Expansion . . . . . . . . . . . . . . . . . . . . . . . .18,000 Plaza Trail Office Building . . . . . . . . . . . . . . . . . . . .15,975 Rose Hall Commons . . . . . . . . . . . . . . . . . . . . . . . .12,266 Rose Hall Professional Center . . . . . . . . . . . . . . . .20,000 Rosemont Interstate Center I . . . . . . . . . . . . . . . . .41,400
Rosemont Interstate Center II . . . . . . . . . . . . . . . . .51,835 Rosemont Interstate Center III* . . . . . . . . . . . . . . .38,000 Sun Building . . . . . . . . . . . . . . . . . . . . . . . . . . . . .11,600 Transouth Building (3615 VB Blvd) . . . . . . . . . . . .12,500
CLASS CBirchwood Office Park . . . . . . . . . . . . . . . . . . . . . .11,688 Byler Building . . . . . . . . . . . . . . . . . . . . . . . . . . . . .16,592
OWNER OCCUPIEDPlan-It Building . . . . . . . . . . . . . . . . . . . . . . . . . . . .24,000
MILITARY CIRCLE
CLASS ARiverside Commerce Center (120 Corporate Blvd.) 70,000 Riverside Corporate Center . . . . . . . . . . . . . . . . . . .86,682
CLASS BCentura Bank Building . . . . . . . . . . . . . . . . . . . . . .40,442 Circle East . . . . . . . . . . . . . . . . . . . . . . . . . . . . . . .41,047 College Park Executive Center . . . . . . . . . . . . . . . . .20,000 FBI Building . . . . . . . . . . . . . . . . . . . . . . . . . . . . . .50,000 I.T.T. Building . . . . . . . . . . . . . . . . . . . . . . . . . . . . . .49,379
CLASS CExecutive Office - Janaf . . . . . . . . . . . . . . . . . . . . .28,800 Janaf Office Building . . . . . . . . . . . . . . . . . . . . . . . .37,329
OWNER OCCUPIEDPortfolio Recovery Building . . . . . . . . . . . . . . . . . . .34,850 Sentara . . . . . . . . . . . . . . . . . . . . . . . . . . . . . . . . .45,000 Union Mission (former VA Natural Gas) . . . . . . . . .75,403
NEWTOWN/WITCHDUCK
CLASS AAAA Headquarters . . . . . . . . . . . . . . . . . . . . . . . . .47,045 Amelia Building . . . . . . . . . . . . . . . . . . . . . . . . . . .64,660 Amerigroup Building I . . . . . . . . . . . . . . . . . . . . . .106,000 Amerigroup Building II . . . . . . . . . . . . . . . . . . . . .106,000 BB&T Building . . . . . . . . . . . . . . . . . . . . . . . . . . . .30,000 Expressway Corporate Center . . . . . . . . . . . . . . . . .85,658 Gallery I . . . . . . . . . . . . . . . . . . . . . . . . . . . . . . . . .30,000 Gallery II . . . . . . . . . . . . . . . . . . . . . . . . . . . . . . . . .30,000 Greenwich Center . . . . . . . . . . . . . . . . . . . . . . . . . .56,000 Greenwich Commons . . . . . . . . . . . . . . . . . . . . . . .55,000 Greenwich Station . . . . . . . . . . . . . . . . . . . . . . . . .29,000 Halifax Building . . . . . . . . . . . . . . . . . . . . . . . . . . .71,100 Mass Mutual Building . . . . . . . . . . . . . . . . . . . . . . .45,500 Smithfield Building . . . . . . . . . . . . . . . . . . . . . . . .145,000 Verizon Center . . . . . . . . . . . . . . . . . . . . . . . . . . .135,000 Westmoreland Building . . . . . . . . . . . . . . . . . . . . .83,436
CLASS B144 Business Park Drive . . . . . . . . . . . . . . . . . . . .17,000 168 Business Park Drive . . . . . . . . . . . . . . . . . . . .19,300 184 Business Park Drive . . . . . . . . . . . . . . . . . . . .27,784 209 Business Park Drive . . . . . . . . . . . . . . . . . . . .11,250 232 Business Park Drive . . . . . . . . . . . . . . . . . . . .14,000 396 Witchduck Road . . . . . . . . . . . . . . . . . . . . . . .12,000 6330 Newtown Road . . . . . . . . . . . . . . . . . . . . . . .55,181 American Teleservices Building . . . . . . . . . . . . . . . .12,232 Azalea Village . . . . . . . . . . . . . . . . . . . . . . . . . . . . .20,000 BCF Building . . . . . . . . . . . . . . . . . . . . . . . . . . . . .24,000 BPC Building . . . . . . . . . . . . . . . . . . . . . . . . . . . . .29,074 Colonial Corporate Center . . . . . . . . . . . . . . . . . . .41,772 Commerce Centre (200-259 Expressway Ct) . . . . .35,500 Commonwealth Building . . . . . . . . . . . . . . . . . . . .10,000 Interstate Corporate Center . . . . . . . . . . . . . . . . .430,000 Parliament Drive Professional Bldg . . . . . . . . . . . . .10,000 TRC Center I . . . . . . . . . . . . . . . . . . . . . . . . . . . . . .62,000 TRC Center II . . . . . . . . . . . . . . . . . . . . . . . . . . . . .36,884 TRC Center III . . . . . . . . . . . . . . . . . . . . . . . . . . . . .52,000 Witchduck Crossing . . . . . . . . . . . . . . . . . . . . . . . .15,326
CLASS CWitchduck Office Court . . . . . . . . . . . . . . . . . . . . . .18,000
OWNER OCCUPIEDCox Cable Building . . . . . . . . . . . . . . . . . . . . . . . . .45,000 Cox Expansion . . . . . . . . . . . . . . . . . . . . . . . . . . . .25,000
Copy Data (Ikon) . . . . . . . . . . . . . . . . . . . . . . . . . .20,000 Lendman . . . . . . . . . . . . . . . . . . . . . . . . . . . . . . . .10,000 Newtown Square . . . . . . . . . . . . . . . . . . . . . . . . . .78,000
PEMBROKE/CENTRAL BUSINESS DISTRICT
CLASS A249 Central Park Avenue . . . . . . . . . . . . . . . . . . . .59,000 Convergence Center . . . . . . . . . . . . . . . . . . . . . . . .85,000 Convergence Center II . . . . . . . . . . . . . . . . . . . . . . .85,000 Convergence Center III . . . . . . . . . . . . . . . . . . . . . .99,000 Corporate Center VI . . . . . . . . . . . . . . . . . . . . . . . .59,000 Five Columbus Center . . . . . . . . . . . . . . . . . . . . . .20,000 Fulton Bank Plaza . . . . . . . . . . . . . . . . . . . . . . . . .90,315 One Columbus Center . . . . . . . . . . . . . . . . . . . . .134,000 OSS Building (former Ticketmaster) . . . . . . . . . . . .30,000 Six Columbus Center . . . . . . . . . . . . . . . . . . . . . . .36,000 Southport Center . . . . . . . . . . . . . . . . . . . . . . . . . .65,000 Town Center (222 Central Park) . . . . . . . . . . . . . .256,900 Town Center North Tower . . . . . . . . . . . . . . . . . . . . .53,000 Two Columbus Center . . . . . . . . . . . . . . . . . . . . . .109,000
CLASS B4701 Columbus . . . . . . . . . . . . . . . . . . . . . . . . . . .32,000 4705 Columbus Street . . . . . . . . . . . . . . . . . . . . .33,000 4801 Columbus Street . . . . . . . . . . . . . . . . . . . . .40,000 Corporate Center I . . . . . . . . . . . . . . . . . . . . . . . . .51,000 Corporate Center II . . . . . . . . . . . . . . . . . . . . . . . . .52,475 Corporate Center III . . . . . . . . . . . . . . . . . . . . . . . .51,000 Corporate Center IV . . . . . . . . . . . . . . . . . . . . . . . .76,012 Holland Commerce Center . . . . . . . . . . . . . . . . . . .30,000 Holland Office Park . . . . . . . . . . . . . . . . . . . . . . . . .32,000 Independence Business Center . . . . . . . . . . . . . . .62,000 Independence Technology Center - Technocenter I .50,000 Independent Plaza . . . . . . . . . . . . . . . . . . . . . . . . .36,655 Pembroke Commercial Bldg. (4425 Corporation Lane)
70,760 Pembroke Office Park . . . . . . . . . . . . . . . . . . . . . .294,000 Prism Plaza . . . . . . . . . . . . . . . . . . . . . . . . . . . . . .32,000 Southgate Centre . . . . . . . . . . . . . . . . . . . . . . . . . .43,200 Southport Business Center(flex) (Baskin Bldg) . . . .20,683 Southport Trade Center(flex) . . . . . . . . . . . . . . . . . .30,883 Thalia One . . . . . . . . . . . . . . . . . . . . . . . . . . . . . . .18,408 Thalia Professional Center . . . . . . . . . . . . . . . . . . .15,000 The Meadows . . . . . . . . . . . . . . . . . . . . . . . . . . . . .32,433 VST Building . . . . . . . . . . . . . . . . . . . . . . . . . . . . .25,000
CLASS C4224 Holland Road . . . . . . . . . . . . . . . . . . . . . . . .10,104 Dragas Office Park . . . . . . . . . . . . . . . . . . . . . . . . .30,896 Haygood Buildings . . . . . . . . . . . . . . . . . . . . . . . . .22,392 Haygood Executive Park . . . . . . . . . . . . . . . . . . . . .36,472 Holland Plaza Office Building . . . . . . . . . . . . . . . . .14,513 Old Donation Executive Park . . . . . . . . . . . . . . . . . .20,347 Larkspur Village . . . . . . . . . . . . . . . . . . . . . . . . . . .16,184 Pocahontas Center . . . . . . . . . . . . . . . . . . . . . . . . .17,800
OWNER OCCUPIEDAlantec Financial Fed Credit Union . . . . . . . . . . . . .12,000 AVIS . . . . . . . . . . . . . . . . . . . . . . . . . . . . . . . . . . .168,000 Coastal Training Technologies . . . . . . . . . . . . . . . . .60,000 Commonwealth College . . . . . . . . . . . . . . . . . . . . .30,000 Electronic Systems Building . . . . . . . . . . . . . . . . . .10,000 ISC . . . . . . . . . . . . . . . . . . . . . . . . . . . . . . . . . . . . .40,000 QED Building . . . . . . . . . . . . . . . . . . . . . . . . . . . . .30,000 REIN Building . . . . . . . . . . . . . . . . . . . . . . . . . . . . .24,500 Virginia Natural Gas Building . . . . . . . . . . . . . . . . .48,242
PORTSMOUTH
CLASS ABB&T Building (500 Crawford) . . . . . . . . . . . . . . . .35,327 Harbourfront Corporate Center (801 Water St) . . . .53,000
CLASS B307 County Street . . . . . . . . . . . . . . . . . . . . . . . . .13,475 355 Crawford Street Building . . . . . . . . . . . . . . . . .79,367 600 Crawford Street . . . . . . . . . . . . . . . . . . . . . . . .16,171 Boyette Professional Center . . . . . . . . . . . . . . . . . .13,000 Bristol Square . . . . . . . . . . . . . . . . . . . . . . . . . . . .10,800
49

Towne Bank Building (200 High St) . . . . . . . . . . . .34,000 JJH Building . . . . . . . . . . . . . . . . . . . . . . . . . . . . . .17,563 New Kirn Building . . . . . . . . . . . . . . . . . . . . . . . . . .44,000 PortCentre I (flex) . . . . . . . . . . . . . . . . . . . . . . . . .100,000 Port Trade Center . . . . . . . . . . . . . . . . . . . . . . . . . .14,223 The Seaboard Building . . . . . . . . . . . . . . . . . . . . . .65,000 Wachovia Bank . . . . . . . . . . . . . . . . . . . . . . . . . . .48,000
CLASS CCrawford Executive Center . . . . . . . . . . . . . . . . . . .20,340
SUFFOLK
CLASS AMAST One . . . . . . . . . . . . . . . . . . . . . . . . . . . . . . .60,000 JTASC Building . . . . . . . . . . . . . . . . . . . . . . . . . . .408,365
CLASS BBridgeway Technology Center I . . . . . . . . . . . . . . .125,000 Bridgeway Technology Center II . . . . . . . . . . . . . . . .67,500 Bridgeway Technology Center III . . . . . . . . . . . . . . .72,384 Brinkley Building . . . . . . . . . . . . . . . . . . . . . . . . . . .20,500 Brinkley Building II . . . . . . . . . . . . . . . . . . . . . . . . .21,000 Harbour Breeze Professional Center . . . . . . . . . . . .52,265 Harbour View Medical Arts Center . . . . . . . . . . . . .47,000 Harbor View Professional Center (1033 & 1035) .23,000”Konikoff Medical Office Building . . . . . . . . . . . . . .22,675”Lakeview Technology GSA Center . . . . . . . . . . . . .110,000 Lakeview Tech Center II . . . . . . . . . . . . . . . . . . . . .86,400”Main Street Center . . . . . . . . . . . . . . . . . . . . . . . . .13,800 Washington Street Center . . . . . . . . . . . . . . . . . . . .12,000
OWNER OCCUPIEDRubicon NGP - Lakeview Technical Center . . . . . .351,075 Lockheed Martin . . . . . . . . . . . . . . . . . . . . . . . . . .50,000 Overton Building . . . . . . . . . . . . . . . . . . . . . . . . . . .12,940 Rose & Womble Building . . . . . . . . . . . . . . . . . . . .25,000 Towne Bank Center . . . . . . . . . . . . . . . . . . . . . . . . .19,318
DOWNTOWN HAMPTON
CLASS AHarbour Centre . . . . . . . . . . . . . . . . . . . . . . . . . . .158,855
CLASS B10-16 W. Queens Way . . . . . . . . . . . . . . . . . . . . . .11,238 47 W. Queens Way . . . . . . . . . . . . . . . . . . . . . . . . .12,500 Mill Point Center . . . . . . . . . . . . . . . . . . . . . . . . . . .10,000 One Mallory Street . . . . . . . . . . . . . . . . . . . . . . . . .14,000
CLASS C55 W. Queens Way . . . . . . . . . . . . . . . . . . . . . . . . .12,132
DOWNTOWN NEWPORT NEWS
CLASS B2600 Building . . . . . . . . . . . . . . . . . . . . . . . . . . .118,018 Wachovia Bank Building . . . . . . . . . . . . . . . . . . . . .17,846
OWNER OCCUPIEDNewport News Shipbuilding, Bldg 520-521” . . . . .50,000
HAMPTON ROADS CENTER
CLASS A6 Manhattan Square . . . . . . . . . . . . . . . . . . . . . . .30,106 1001 N Campus Parkway . . . . . . . . . . . . . . . . . . .19,000 Allstate Building . . . . . . . . . . . . . . . . . . . . . . . . . . .17,000 HealthNet Building . . . . . . . . . . . . . . . . . . . . . . . . .60,482 Lakefront Plaza I . . . . . . . . . . . . . . . . . . . . . . . . . . .77,442 Morgan Marrow Building . . . . . . . . . . . . . . . . . . . .12,000 Olympia Place . . . . . . . . . . . . . . . . . . . . . . . . . . . .72,395 Oxford Plaza . . . . . . . . . . . . . . . . . . . . . . . . . . . . . .64,297 Parkway Executive Center . . . . . . . . . . . . . . . . . . . .45,000 Research Quad - Building One . . . . . . . . . . . . . . . .60,000 Research Quad - Building Three . . . . . . . . . . . . . .100,000
CLASS B400 Butler Farm Road . . . . . . . . . . . . . . . . . . . . . .96,446 404 Butler Farm Road . . . . . . . . . . . . . . . . . . . . . .54,715 421 Butler Farm Road . . . . . . . . . . . . . . . . . . . . . .56,515 Hampton I . . . . . . . . . . . . . . . . . . . . . . . . . . . . . . .68,532 Hampton II . . . . . . . . . . . . . . . . . . . . . . . . . . . . . . .67,000 Hampton III . . . . . . . . . . . . . . . . . . . . . . . . . . . . . .45,000 Hampton Technology Center I . . . . . . . . . . . . . . . . .56,575
NDS Building . . . . . . . . . . . . . . . . . . . . . . . . . . . .35,000 Raytheon . . . . . . . . . . . . . . . . . . . . . . . . . . . . . . . .50,000 Research Office Building . . . . . . . . . . . . . . . . . . . .30,000
CLASS CNASA Langley Research Center . . . . . . . . . . . . . . .11,790 3217 Armistead Avenue . . . . . . . . . . . . . . . . . . . . .24,043
COLISEUM CENTRAL
CLASS AClaiborne Building (Regional Mall Office) . . . . . . .150,000 Executive Tower . . . . . . . . . . . . . . . . . . . . . . . . . . .134,164 Pinewood Plaza . . . . . . . . . . . . . . . . . . . . . . . . . . .77,500
CLASS B2115 Executive Drive . . . . . . . . . . . . . . . . . . . . . . .62,000 2310 Tower Place . . . . . . . . . . . . . . . . . . . . . . . . . .10,500 Bank of America Building . . . . . . . . . . . . . . . . . . . .14,434 Colony Square of Hampton . . . . . . . . . . . . . . . . . .30,050 Riverdale Complex . . . . . . . . . . . . . . . . . . . . . . . .168,000 Sheraton Office Bldg. . . . . . . . . . . . . . . . . . . . . . . .12,673 Todds Lane Professional Center . . . . . . . . . . . . . . .12,500 West Telemarketing . . . . . . . . . . . . . . . . . . . . . . . . .55,855
OWNER OCCUPIEDLangley Federal Credit Union . . . . . . . . . . . . . . . . .72,800
NEWMARKET
CLASS BNewmarket Building . . . . . . . . . . . . . . . . . . . . . . . .21,262 NetCenter . . . . . . . . . . . . . . . . . . . . . . . . . . . . . . .546,171 UPS Call Center . . . . . . . . . . . . . . . . . . . . . . . . . .103,000
CLASS CRouse Tower . . . . . . . . . . . . . . . . . . . . . . . . . . . . .150,000
OWNER OCCUPIEDNN Shipbuilding Employee Credit Union . . . . . . . . .15,000
OYSTER POINT
CLASS A601 Thimble Shoals Boulevard . . . . . . . . . . . . . . . .30,000 Atrium At Oyster Point . . . . . . . . . . . . . . . . . . . . . .62,971 Cedar One . . . . . . . . . . . . . . . . . . . . . . . . . . . . . . .15,467 Cedar Two . . . . . . . . . . . . . . . . . . . . . . . . . . . . . . . .27,000 Contemporary Cybernetics . . . . . . . . . . . . . . . . . . .60,000 Ferguson Corporate Center II . . . . . . . . . . . . . . . .150,000 Fountain Plaza One . . . . . . . . . . . . . . . . . . . . . . .100,000 Fountain Plaza Two . . . . . . . . . . . . . . . . . . . . . . . . .80,000 Fountain Plaza Three . . . . . . . . . . . . . . . . . . . . . . .80,000 Langley Federal Centre . . . . . . . . . . . . . . . . . . . . . .51,982 Merchants Walk . . . . . . . . . . . . . . . . . . . . . . . . . . .28,000 One City Center . . . . . . . . . . . . . . . . . . . . . . . . . . .70,000 One Oyster Point . . . . . . . . . . . . . . . . . . . . . . . . . .36,226 Oyster Point Interstate Center . . . . . . . . . . . . . . . . .64,000 Patrick Henry Corporate Center . . . . . . . . . . . . . . .98,883 Riverside Health Center Building (Warwick) . . . . .104,500 Peninsula Professional Building . . . . . . . . . . . . . . .30,800 Rock Landing Corporate Center II . . . . . . . . . . . . . .33,476 SunTrust Building . . . . . . . . . . . . . . . . . . . . . . . . .100,955 Symantec Corp. Building . . . . . . . . . . . . . . . . . . .100,000 Tower Park (733 &735 Thimble Shoals) . . . . . . . . .31,667 Town Center One . . . . . . . . . . . . . . . . . . . . . . . . . .60,000 TowneBank Center . . . . . . . . . . . . . . . . . . . . . . . . .60,000 Two City Center . . . . . . . . . . . . . . . . . . . . . . . . . . . .63,600 Two Oyster Point . . . . . . . . . . . . . . . . . . . . . . . . . . .39,137 Turner Bldg (1060 Loftis) . . . . . . . . . . . . . . . . . . .21,000”Wachovia Building . . . . . . . . . . . . . . . . . . . . . . . . .42,921 William E Wood Building (1030 Loftis) . . . . . . . . . .26,000
CLASS B11790 Jefferson Avenue . . . . . . . . . . . . . . . . . . . .20,662 745 Bluecrab (flex) . . . . . . . . . . . . . . . . . . . . . . . .16,000 BB&T Plaza (603 Pilot House) . . . . . . . . . . . . . . . .37,348 Cale Colony 17 . . . . . . . . . . . . . . . . . . . . . . . . . . .17,000 Canon Place . . . . . . . . . . . . . . . . . . . . . . . . . . . . . .26,000 Comb-Bay Park . . . . . . . . . . . . . . . . . . . . . . . . . . .32,000 Dunwoody Place . . . . . . . . . . . . . . . . . . . . . . . . . . .19,798 Executive Center . . . . . . . . . . . . . . . . . . . . . . . . . . .95,399 Fishing Point Complex(flex) . . . . . . . . . . . . . . . . . .50,000 International Distribution Center . . . . . . . . . . . . . . .36,000 McCale Professional Park . . . . . . . . . . . . . . . . . . . .40,000
Middle Ground Business Center . . . . . . . . . . . . . . .62,000 Oyster Point Center . . . . . . . . . . . . . . . . . . . . . . . . .44,000 Oyster Point Business Center . . . . . . . . . . . . . . . . .25,000 Oyster Point Place (flex) . . . . . . . . . . . . . . . . . . . . .38,000 Oyster Point West . . . . . . . . . . . . . . . . . . . . . . . . .176,560 Park Central Executive Center . . . . . . . . . . . . . . . . .54,425 Park Place (751 & 753 Thimble Shoals) . . . . . . . .25,000 Peninsula Business Center I (flex) . . . . . . . . . . . . .21,817 Peninsula Business Centre II (flex) . . . . . . . . . . . . .40,475 Peninsula Business Centre III (flex) . . . . . . . . . . . . .60,000 Rock Landing Corporate Center IV . . . . . . . . . . . . .18,125 Rock Landing Corporate Center V . . . . . . . . . . . . . .18,125 Technology Center (flex) . . . . . . . . . . . . . . . . . . . . .81,000 Thimble Shoals Business Center (flex) . . . . . . . . . .55,377 Thimble Shores Lakefront . . . . . . . . . . . . . . . . . . . .25,000
CLASS C714-716-718 J.Clyde Morris Blvd. . . . . . . . . . . . . .15,000 Drucker & Falk Building . . . . . . . . . . . . . . . . . . . . .30,000 Pilgrim Landing . . . . . . . . . . . . . . . . . . . . . . . . . . . .10,650 Regent Park . . . . . . . . . . . . . . . . . . . . . . . . . . . . . .25,000
OWNER OCCUPIEDApplied Research Center . . . . . . . . . . . . . . . . . . .121,000 Fountain Plaza Two . . . . . . . . . . . . . . . . . . . . . . . . .80,000 Muller Martini Building . . . . . . . . . . . . . . . . . . . . . .24,000 Peninsula Retail Credit . . . . . . . . . . . . . . . . . . . . . .30,000
SUBURBAN NEWPORT NEWS
CLASS BBay Savings Bank Building . . . . . . . . . . . . . . . . . . .18,000 Colony Square of Denbigh II . . . . . . . . . . . . . . . . . .26,100 Denbigh Professional Park . . . . . . . . . . . . . . . . . . .40,598 Ferguson Enterprises . . . . . . . . . . . . . . . . . . . . . . .75,800 MCI Building . . . . . . . . . . . . . . . . . . . . . . . . . . . . . .60,000 Tidewater Tech (616 Denbigh Blvd) . . . . . . . . . . . .15,778
CLASS CMariner Building . . . . . . . . . . . . . . . . . . . . . . . . . . .26,000 Teagle Building . . . . . . . . . . . . . . . . . . . . . . . . . . . .22,000
OWNER OCCUPIEDCNU Building . . . . . . . . . . . . . . . . . . . . . . . . . . . . .40,000
WILLIAMSBURG/JAMES CITY/YORKCOUNTY
CLASS A263 McLaws Circle . . . . . . . . . . . . . . . . . . . . . . . . .26,967 Atrium Building . . . . . . . . . . . . . . . . . . . . . . . . . . . .24,000 Casey New Town - SunTrust . . . . . . . . . . . . . . . . . .60,000 Courthouse Green . . . . . . . . . . . . . . . . . . . . . . . . .30,000 Design Center . . . . . . . . . . . . . . . . . . . . . . . . . . . . .13,700 First Union Center . . . . . . . . . . . . . . . . . . . . . . . . .32,000 Langley Federal Credit Union . . . . . . . . . . . . . . . . .20,000 Williamsburg Commerce Center . . . . . . . . . . . . . . .32,000 Palladian Office Building . . . . . . . . . . . . . . . . . . . .21,000 Patriot Park Business Center . . . . . . . . . . . . . . . . .24,000 Sentara New Town Medical Building . . . . . . . . . . . .50,000 Sun Trust (Courthouse St.) . . . . . . . . . . . . . . . . . . .60,000 William E. Wood Building . . . . . . . . . . . . . . . . . . .20,000”
CLASS B104 Bypass Road . . . . . . . . . . . . . . . . . . . . . . . . .11,100 7601 George Washington Memorial Highway . . . . .10,000 Chartertowne Professional Center . . . . . . . . . . . . . .12,800 Greens Springs Office Park . . . . . . . . . . . . . . . . . . .37,000 Kristinsand Office Park . . . . . . . . . . . . . . . . . . . . . .15,221 Packets Executive Center . . . . . . . . . . . . . . . . . . . .23,000 Quarterland Commons Office Condos . . . . . . . . .120,000 Rivergate Center . . . . . . . . . . . . . . . . . . . . . . . . . . .36,000 Wachovia Bank . . . . . . . . . . . . . . . . . . . . . . . . . . .10,500 Williamsburg Office Park . . . . . . . . . . . . . . . . . . . . .79,600
Disclaimer: The information in this report is deemed reliable.The Old Dominion University E. V. Williams Center for RealEstate and Economic Development makes no representationor warranty as to its accuracy. . . . . . . . . . . . . . . . . . . . . . . . . . . . . . . . . . . . . . . . . . . . . . .BOLD indicates change/addition from last year.
502012 Hampton Roads Real Estate Market Review

OFFICE SUBMARKETS
Southside1 Airport/Northampton
2 Chesapeake/Greenbrier
3 Downtown Norfolk
4 Central Norfolk
5 Hilltop/Oceanfront
6 Corporate Landing
7 Kempsville
8 Little Neck
9 Lynnhaven
10 Military Circle
11 Newtown/Witchduck
12 Northern Suffolk
13 Pembroke
14 Portsmouth
Peninsula15 Downtown Hampton
16 Hampton Roads Center
17 Coliseum Central
18 Downtown Newport News
19 Newmarket
20 Oyster Point
21 Suburban Newport News
22 Williamsburg/
James City Co./
York County
20
12
OFFIC
E
51