market research report : waste management market in india 2015 - sample
TRANSCRIPT

2
Executive Summary
Market
Drivers & Challenges
Government Initiatives
Competition
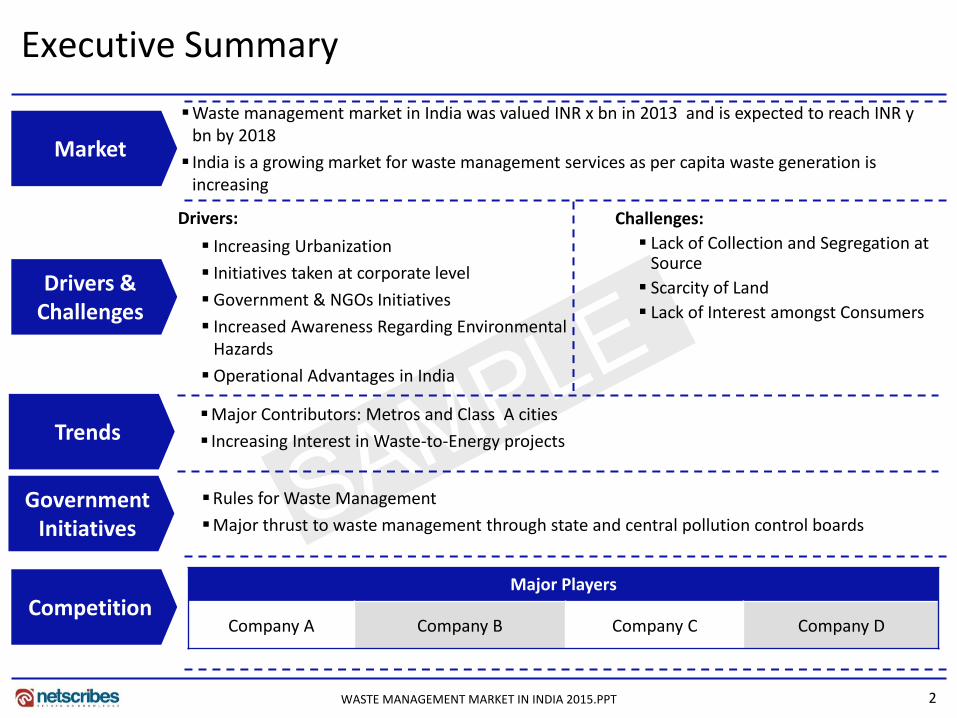
Waste management market in India was valued INR x bn in 2013 and is expected to reach INR y bn by 2018
India is a growing market for waste management services as per capita waste generation is increasing
Drivers:
Increasing Urbanization
Initiatives taken at corporate level
Government & NGOs Initiatives
Increased Awareness Regarding Environmental Hazards
Operational Advantages in India
Challenges:
Lack of Collection and Segregation at Source
Scarcity of Land
Lack of Interest amongst Consumers
Rules for Waste Management
Major thrust to waste management through state and central pollution control boards
Major Players
Company A Company B Company C Company D
Trends Major Contributors: Metros and Class A cities
Increasing Interest in Waste-to-Energy projects
WASTE MANAGEMENT MARKET IN INDIA 2015.PPT
3 WASTE MANAGEMENT MARKET IN INDIA 2015.PPT
•Macroeconomic Indicators
•Market Overview
•Business Opportunities
•Drivers & Challenges
•Trends
•Government Regulations
•Competitive Landscape
•Strategic Recommendations
•Appendix
4
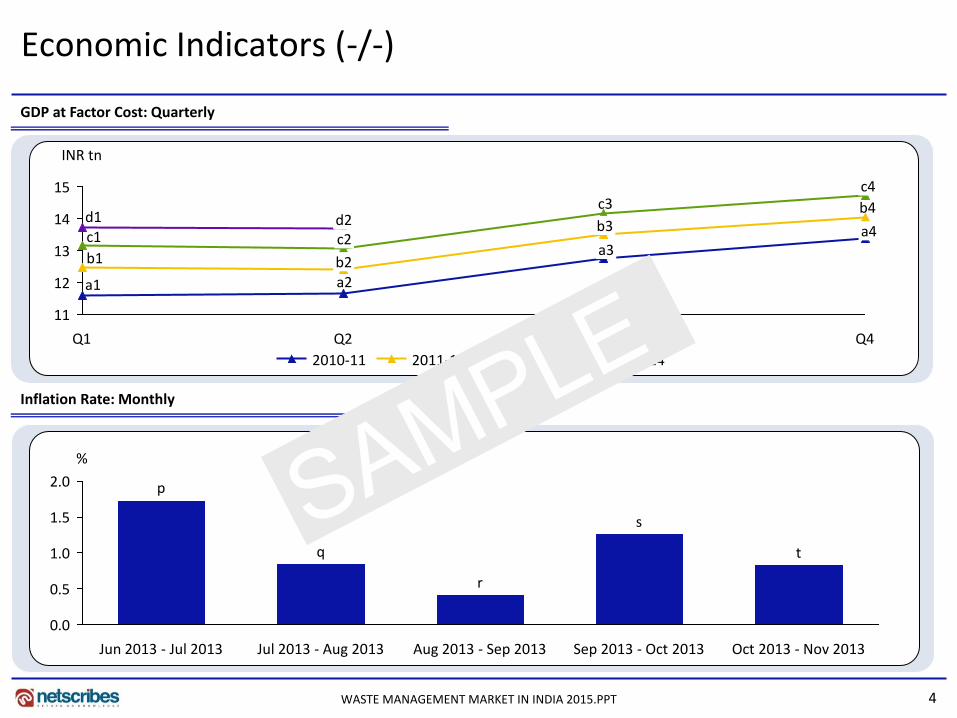
Economic Indicators (-/-)
GDP at Factor Cost: Quarterly
Inflation Rate: Monthly
11
12
13
14
15
INR tn
Q4
c4
d2 c2
b2 a2
Q1
d1 b4
a4
Q3
c3
b3
a3
Q2
c1
b1
a1
2013-14 2012-13 2011-12 2010-11
0.0
0.5
1.0
1.5
2.0
%
Oct 2013 - Nov 2013
t
Sep 2013 - Oct 2013
s
Aug 2013 - Sep 2013
r
Jul 2013 - Aug 2013
q
Jun 2013 - Jul 2013
p
WASTE MANAGEMENT MARKET IN INDIA 2015.PPT
5
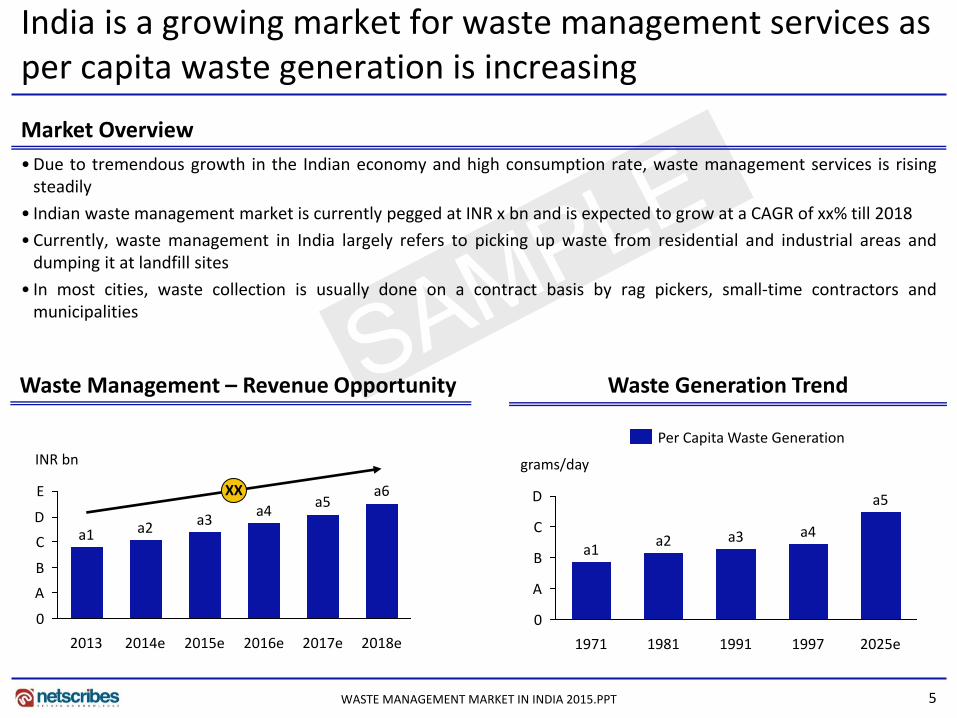
India is a growing market for waste management services as per capita waste generation is increasing
Waste Management – Revenue Opportunity
• Due to tremendous growth in the Indian economy and high consumption rate, waste management services is rising steadily
• Indian waste management market is currently pegged at INR x bn and is expected to grow at a CAGR of xx% till 2018
• Currently, waste management in India largely refers to picking up waste from residential and industrial areas and dumping it at landfill sites
• In most cities, waste collection is usually done on a contract basis by rag pickers, small-time contractors and municipalities
Market Overview
Waste Generation Trend
D
C
B
A
0
grams/day
a1
2025e
a5
1997
a4
1991
a3
1981
a2
1971
Per Capita Waste Generation
E
D
C
B
A
0
INR bn
2017e
a5
2016e
a4
2015e
a3
2014e
a2
2013
a1
XX
2018e
a6
WASTE MANAGEMENT MARKET IN INDIA 2015.PPT
6
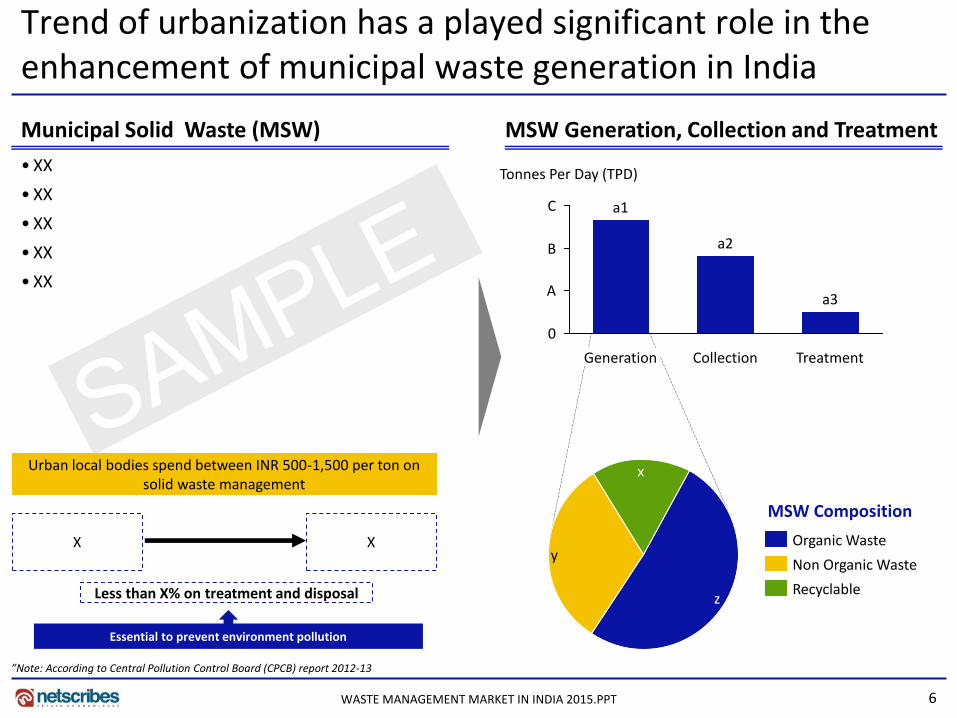
Trend of urbanization has a played significant role in the enhancement of municipal waste generation in India
MSW Generation, Collection and Treatment
• XX
• XX
• XX
• XX
• XX
Municipal Solid Waste (MSW)
”Note: According to Central Pollution Control Board (CPCB) report 2012-13
X X
Less than X% on treatment and disposal
Urban local bodies spend between INR 500-1,500 per ton on solid waste management
Essential to prevent environment pollution
C
B
A
0
a3
Collection
a2
Generation
a1
Tonnes Per Day (TPD)
Treatment
x
y
z Recyclable
Non Organic Waste
Organic Waste
MSW Composition
WASTE MANAGEMENT MARKET IN INDIA 2015.PPT
7
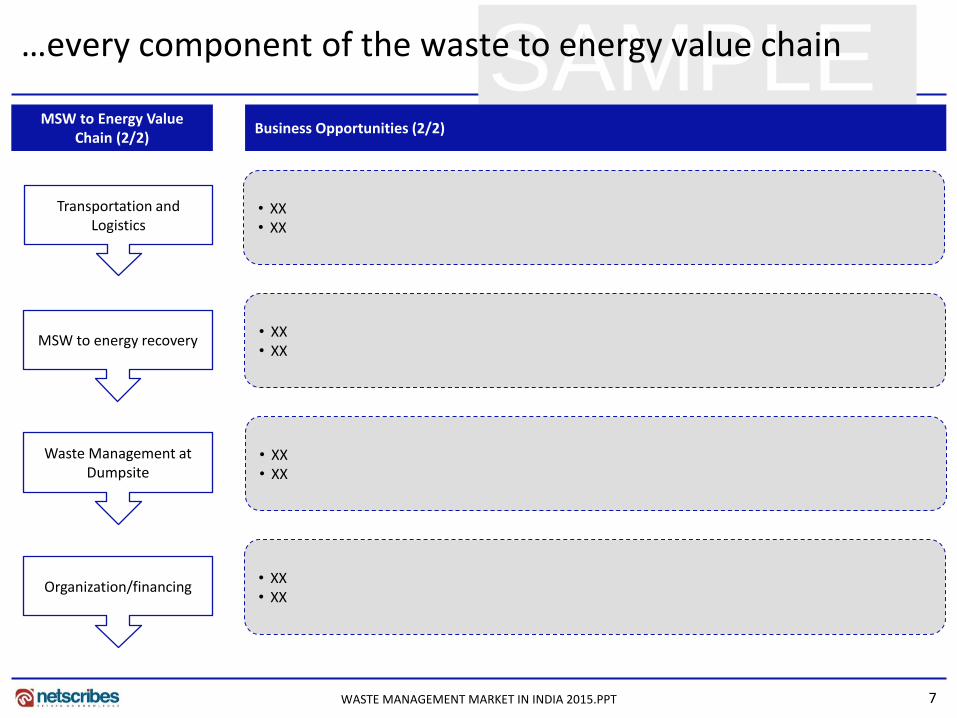
SAMPLE …every component of the waste to energy value chain
MSW to Energy Value Chain (2/2)
Business Opportunities (2/2)
Transportation and Logistics
MSW to energy recovery
Waste Management at Dumpsite
Organization/financing
• XX • XX
• XX • XX
• XX • XX
• XX • XX
WASTE MANAGEMENT MARKET IN INDIA 2015.PPT

8
SAMPLE Various companies will be benefitted in each part of the waste to energy value chain
WASTE MANAGEMENT MARKET IN INDIA 2015.PPT
Primary Collection and Segregation
• X
Separation of Wet Organic Wastes
• X
Transport and Logistics • X
Storage and Secondary Collection
• X
Waste Recycling • X
MSW Waste to Energy Recovery
• X
Management of Waste at Landfills
• X
Components In Value Chain
Companies that could benefit from the Waste to Energy sector
9
SAMPLE
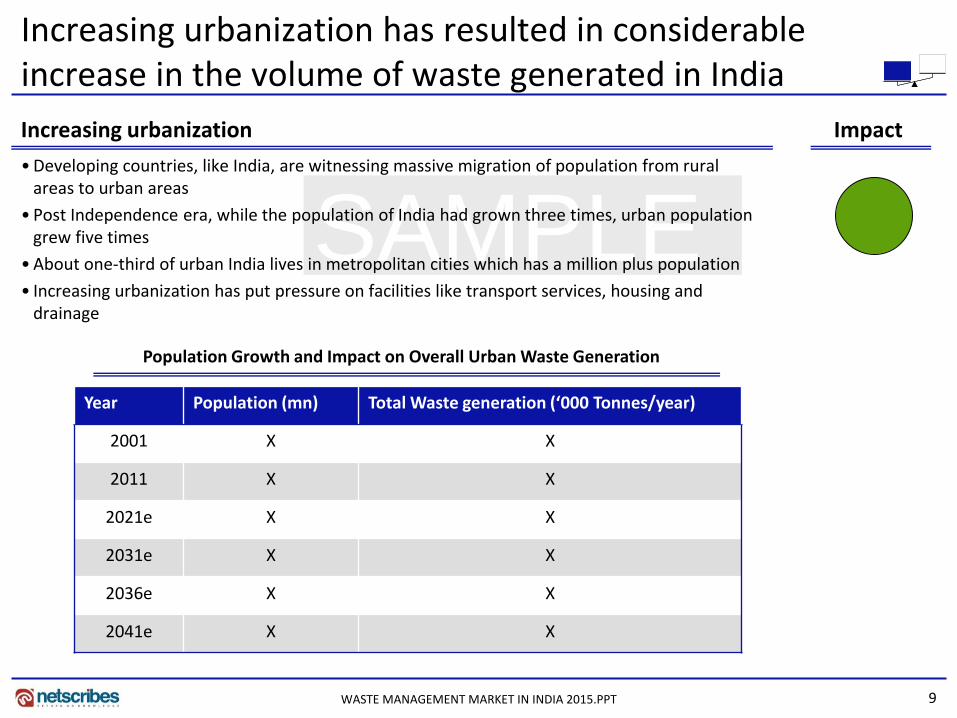
Increasing urbanization has resulted in considerable increase in the volume of waste generated in India
• Developing countries, like India, are witnessing massive migration of population from rural areas to urban areas
• Post Independence era, while the population of India had grown three times, urban population grew five times
• About one-third of urban India lives in metropolitan cities which has a million plus population
• Increasing urbanization has put pressure on facilities like transport services, housing and drainage
Increasing urbanization Impact
WASTE MANAGEMENT MARKET IN INDIA 2015.PPT
Population Growth and Impact on Overall Urban Waste Generation
Year Population (mn) Total Waste generation (‘000 Tonnes/year)
2001 X X
2011 X X
2021e X X
2031e X X
2036e X X
2041e X X
10
SAMPLE
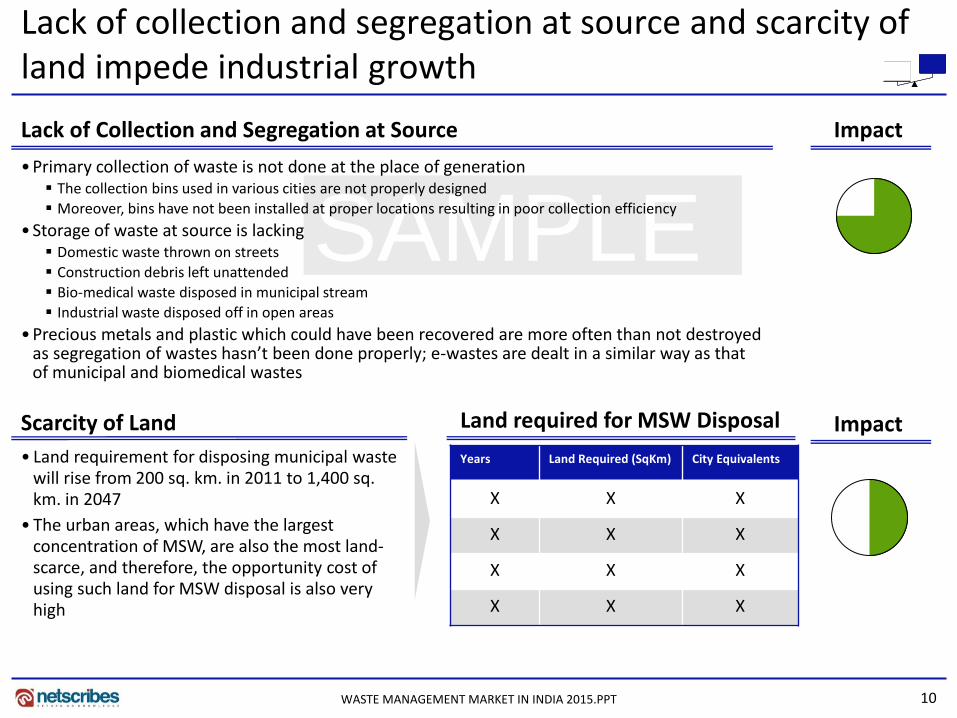
Lack of collection and segregation at source and scarcity of land impede industrial growth
Impact Lack of Collection and Segregation at Source
• Primary collection of waste is not done at the place of generation The collection bins used in various cities are not properly designed
Moreover, bins have not been installed at proper locations resulting in poor collection efficiency
• Storage of waste at source is lacking Domestic waste thrown on streets
Construction debris left unattended
Bio-medical waste disposed in municipal stream
Industrial waste disposed off in open areas
• Precious metals and plastic which could have been recovered are more often than not destroyed as segregation of wastes hasn’t been done properly; e-wastes are dealt in a similar way as that of municipal and biomedical wastes
Impact
• Land requirement for disposing municipal waste will rise from 200 sq. km. in 2011 to 1,400 sq. km. in 2047
• The urban areas, which have the largest concentration of MSW, are also the most land-scarce, and therefore, the opportunity cost of using such land for MSW disposal is also very high
Scarcity of Land Land required for MSW Disposal
Years Land Required (SqKm) City Equivalents
X X X
X X X
X X X
X X X
WASTE MANAGEMENT MARKET IN INDIA 2015.PPT

11
SAMPLE
Metropolitan cities and Class A cities generate over x% of waste in India
Major Contributors: Metros and Class A cities A handful of cities
account for the majority of waste
generated
• India produces around x lakh MT of e-waste per year Mumbai generates nearly 61,000 tonnes of electronic waste per year followed by New Delhi, which generates
43,000 tonnes of waste
Bangalore ranks third in terms of e waste generation and produces nearly 37,000 tonnes of waste per year
• Cities are getting more and more crowded resulting in more generation of waste
• Lot of people are migrating from villages to cities in search of jobs
Note: Waste generation quantities in 2011; Class A cities: Population Range: 1,00,000 – 4,999,999
Solid Waste Generation Share*
x
z
y
Others Class A Cities Metro Cities
Solid Waste Generation in Metro Cities*
0 C B A
Ton
nes Per D
ay
Bengaluru a6
Hyderabad a5
Chennai a4
Delhi a3
Kolkata a2
Mumbai a1
WASTE MANAGEMENT MARKET IN INDIA 2015.PPT
12
SAMPLE
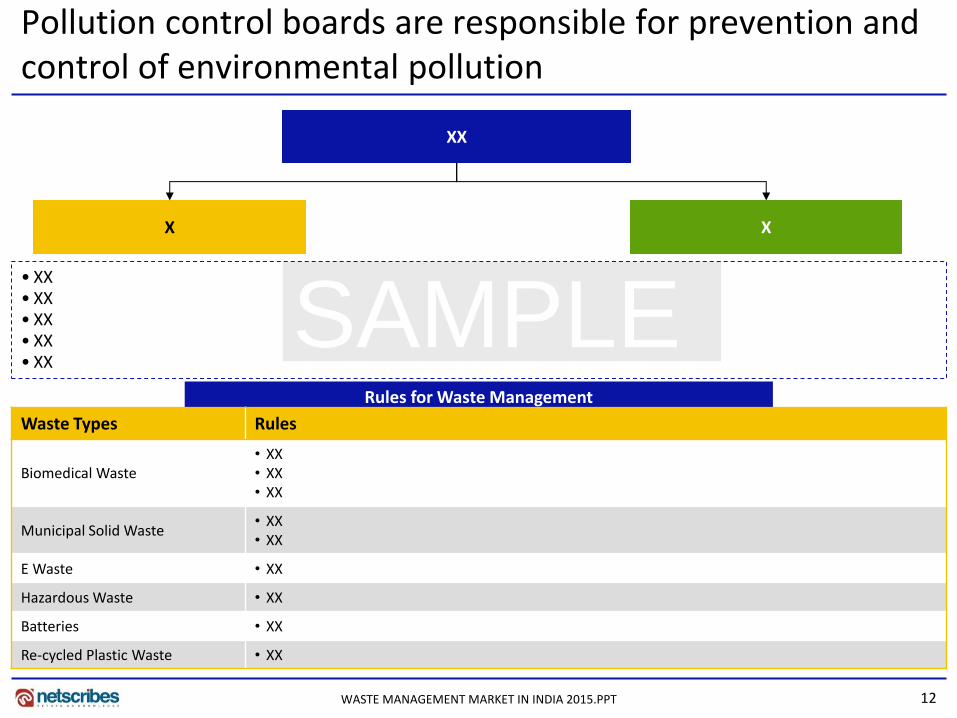
Pollution control boards are responsible for prevention and control of environmental pollution
XX
X X
• XX • XX • XX • XX • XX
Rules for Waste Management
Waste Types Rules
Biomedical Waste • XX • XX • XX
Municipal Solid Waste • XX • XX
E Waste • XX
Hazardous Waste • XX
Batteries • XX
Re-cycled Plastic Waste • XX
WASTE MANAGEMENT MARKET IN INDIA 2015.PPT
13
SAMPLE
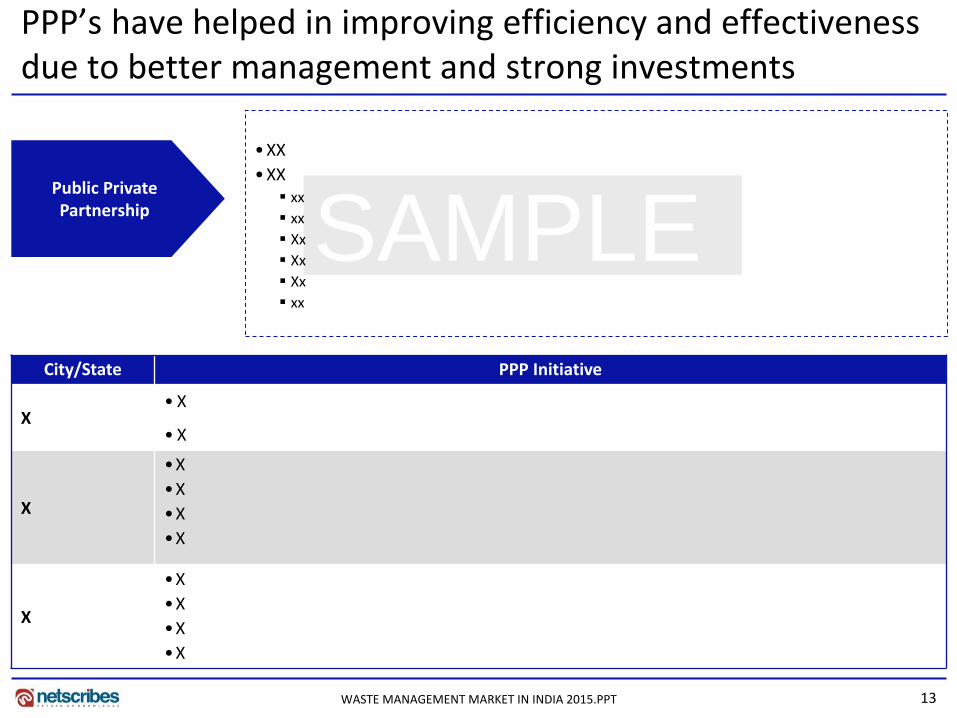
PPP’s have helped in improving efficiency and effectiveness due to better management and strong investments
Public Private Partnership
• XX
• XX xx
xx
Xx
Xx
Xx
xx
City/State PPP Initiative
X • X
• X
X
•X
•X
•X
•X
X
•X
•X
•X
•X
WASTE MANAGEMENT MARKET IN INDIA 2015.PPT
14
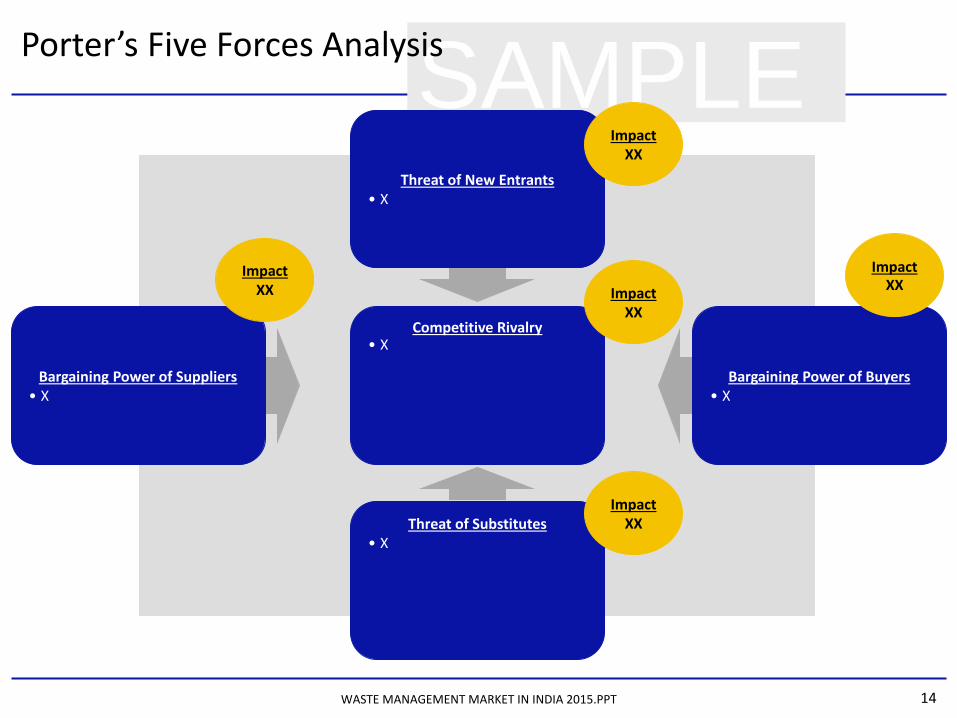
SAMPLE Porter’s Five Forces Analysis
Competitive Rivalry • X
Bargaining Power of Suppliers • X
Bargaining Power of Buyers • X
Threat of Substitutes • X
Threat of New Entrants • X
Impact XX
Impact XX
Impact XX
Impact XX
Impact XX
WASTE MANAGEMENT MARKET IN INDIA 2015.PPT
15
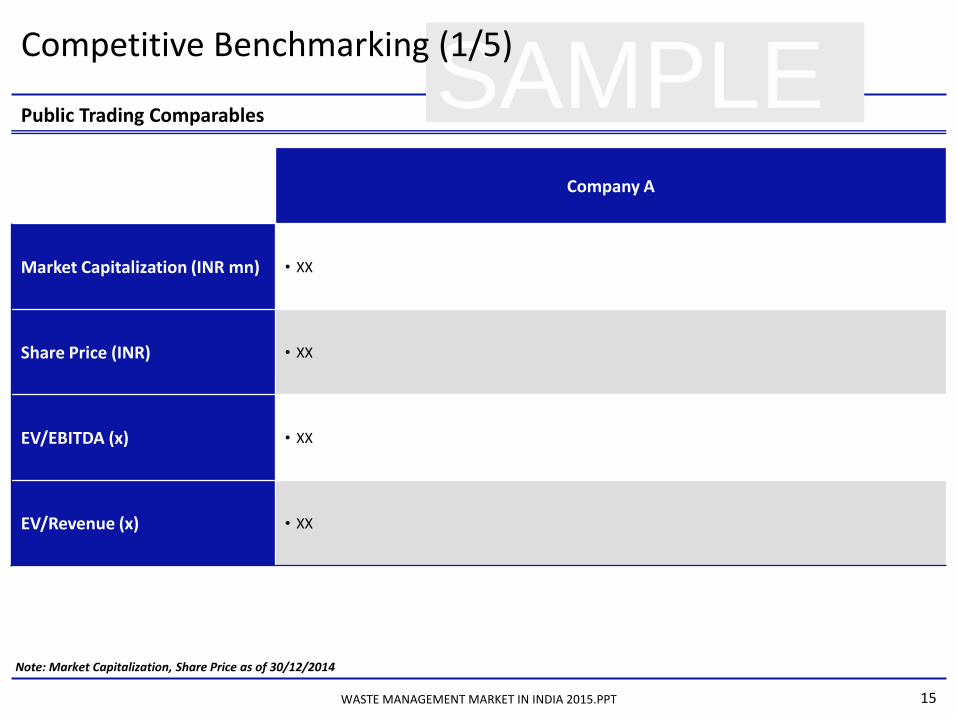
SAMPLE Competitive Benchmarking (1/5)
Public Trading Comparables
Company A
Market Capitalization (INR mn) • XX
Share Price (INR) • XX
EV/EBITDA (x) • XX
EV/Revenue (x) • XX
Note: Market Capitalization, Share Price as of 30/12/2014
WASTE MANAGEMENT MARKET IN INDIA 2015.PPT
16
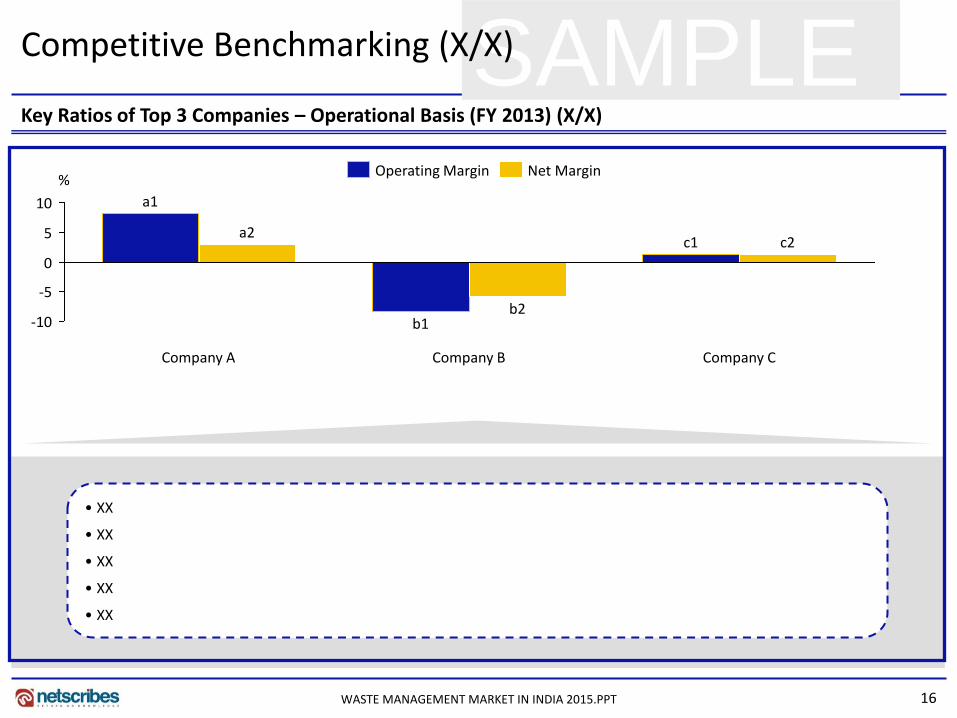
SAMPLE Key Ratios of Top 3 Companies – Operational Basis (FY 2013) (X/X)
Competitive Benchmarking (X/X)
-10
-5
0
5
10
%
Company C
c2 c1
Company B
b2 b1
Company A
a2
a1
Net Margin Operating Margin
• XX
• XX
• XX
• XX
• XX
WASTE MANAGEMENT MARKET IN INDIA 2015.PPT

17
SAMPLE Public: Domestic Company – Company A(x/x)
Key People
Products and Services
Company Information Offices and Centres – India
Corporate Address • XX
Tel No. • XX
Fax No. • XX
Website • XX
Year of Incorporation • XX
Ticker Symbol • XX
Stock Exchange • XX
Category Products/Services
Waste Management Services
• XX
Name Designation
• XX • XX
• XX • XX
• XX • XX
• XX • XX
Mumbai
Head Office
WASTE MANAGEMENT MARKET IN INDIA 2015.PPT
18
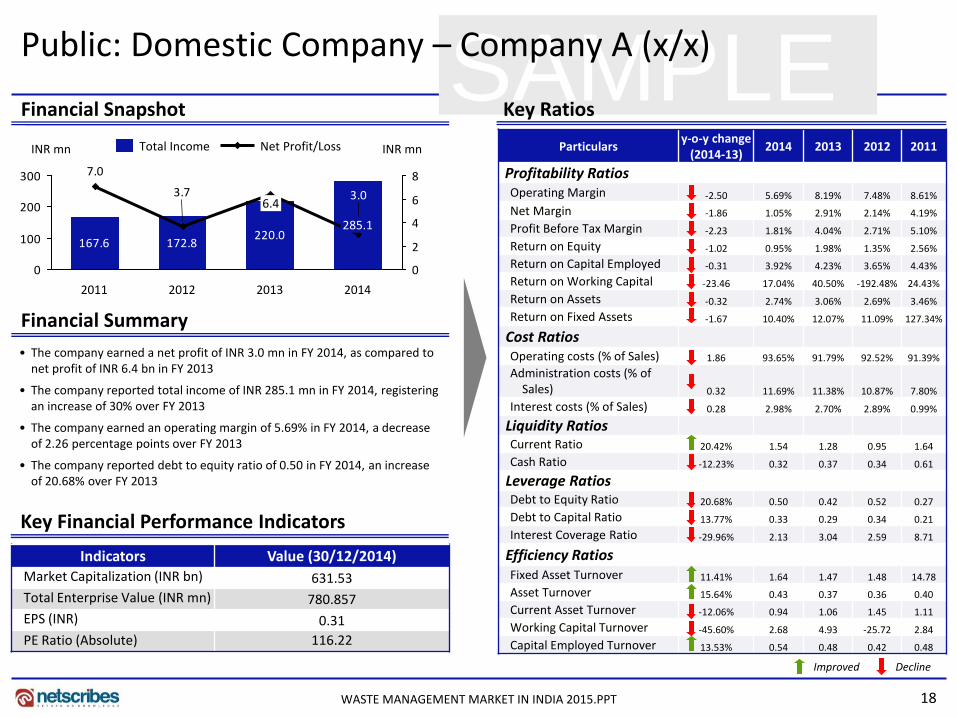
SAMPLE Financial Snapshot Key Ratios
Financial Summary
• The company earned a net profit of INR 3.0 mn in FY 2014, as compared to net profit of INR 6.4 bn in FY 2013
• The company reported total income of INR 285.1 mn in FY 2014, registering an increase of 30% over FY 2013
• The company earned an operating margin of 5.69% in FY 2014, a decrease of 2.26 percentage points over FY 2013
• The company reported debt to equity ratio of 0.50 in FY 2014, an increase of 20.68% over FY 2013
Key Financial Performance Indicators
Indicators Value (30/12/2014) Market Capitalization (INR bn) 631.53
Total Enterprise Value (INR mn) 780.857
EPS (INR) 0.31
PE Ratio (Absolute) 116.22
Particulars y-o-y change
(2014-13) 2014 2013 2012 2011
Profitability Ratios
Operating Margin -2.50 5.69% 8.19% 7.48% 8.61%
Net Margin -1.86 1.05% 2.91% 2.14% 4.19%
Profit Before Tax Margin -2.23 1.81% 4.04% 2.71% 5.10%
Return on Equity -1.02 0.95% 1.98% 1.35% 2.56%
Return on Capital Employed -0.31 3.92% 4.23% 3.65% 4.43%
Return on Working Capital -23.46 17.04% 40.50% -192.48% 24.43%
Return on Assets -0.32 2.74% 3.06% 2.69% 3.46%
Return on Fixed Assets -1.67 10.40% 12.07% 11.09% 127.34%
Cost Ratios
Operating costs (% of Sales) 1.86 93.65% 91.79% 92.52% 91.39%
Administration costs (% of Sales) 0.32 11.69% 11.38% 10.87% 7.80%
Interest costs (% of Sales) 0.28 2.98% 2.70% 2.89% 0.99%
Liquidity Ratios
Current Ratio 20.42% 1.54 1.28 0.95 1.64
Cash Ratio -12.23% 0.32 0.37 0.34 0.61
Leverage Ratios
Debt to Equity Ratio 20.68% 0.50 0.42 0.52 0.27
Debt to Capital Ratio 13.77% 0.33 0.29 0.34 0.21
Interest Coverage Ratio -29.96% 2.13 3.04 2.59 8.71
Efficiency Ratios
Fixed Asset Turnover 11.41% 1.64 1.47 1.48 14.78
Asset Turnover 15.64% 0.43 0.37 0.36 0.40
Current Asset Turnover -12.06% 0.94 1.06 1.45 1.11
Working Capital Turnover -45.60% 2.68 4.93 -25.72 2.84
Capital Employed Turnover 13.53% 0.54 0.48 0.42 0.48
Improved Decline
Net Profit/Loss Total Income
167.6220.0
172.8
3.7 3.0
7.0
0
100
200
300
0
2
4
6
8
INR mn INR mn
2011 2014
285.1
2013
6.4
2012
Public: Domestic Company – Company A (x/x)
WASTE MANAGEMENT MARKET IN INDIA 2015.PPT

19
SAMPLE Key Business Segments Key Geographic Segments*
Business Highlights
Description News
Overview
• XX • XX • XX • XX
Current and Pending Investors
• XX
Future Plan • XX
100%
80%
60%
40%
20%
0%
2014
x
e-Waste Management & Recycling
80%
100%
60%
40%
20%
0%
2012
x
India
The company has earned revenues from India only for
the last 4 fiscals
Public: Domestic Company – Company A (x/x)
The company has earned revenues from e-waste
Management and Recycling segment only for the last 4
fiscals
Note: Due to lack of critical data, the graph could not be generated for the year 2014
WASTE MANAGEMENT MARKET IN INDIA 2015.PPT

20
SAMPLE
• XX • XX
• XX • XX
T O
W S
Public: Domestic Company – Company A – SWOT Analysis (x/x)
WASTE MANAGEMENT MARKET IN INDIA 2015.PPT
21
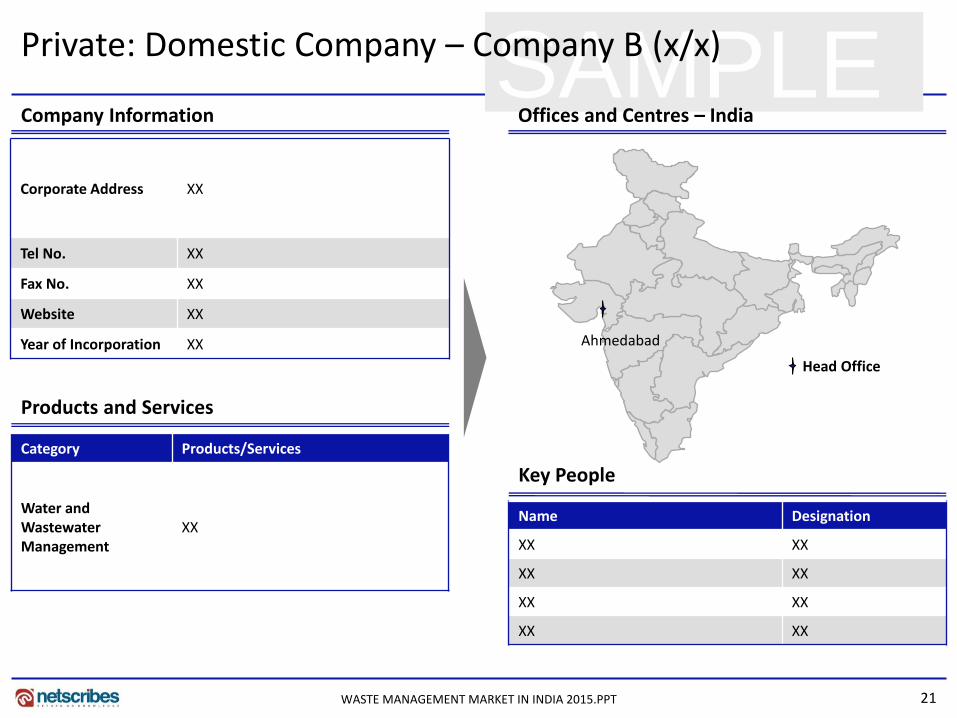
SAMPLE Private: Domestic Company – Company B (x/x)
Key People
Products and Services
Company Information Offices and Centres – India
Category Products/Services
Water and Wastewater Management
XX Name Designation
XX XX
XX XX
XX XX
XX XX
Ahmedabad
Corporate Address XX
Tel No. XX
Fax No. XX
Website XX
Year of Incorporation XX
Head Office
WASTE MANAGEMENT MARKET IN INDIA 2015.PPT
22
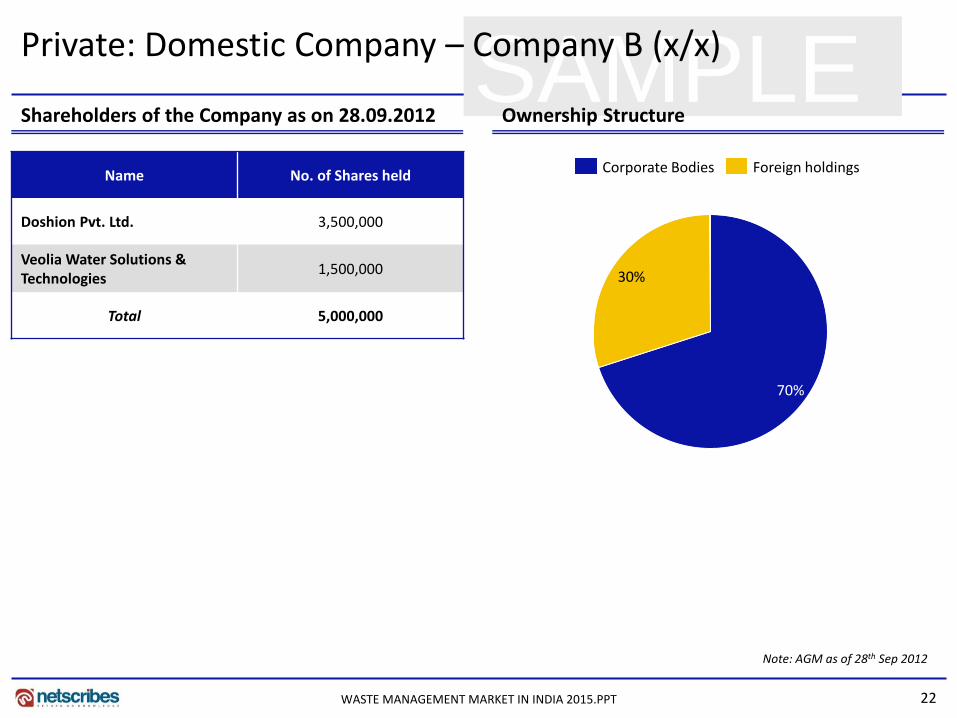
SAMPLE Shareholders of the Company as on 28.09.2012 Ownership Structure
Name No. of Shares held
Doshion Pvt. Ltd. 3,500,000
Veolia Water Solutions & Technologies
1,500,000
Total 5,000,000
30%
70%
Corporate Bodies Foreign holdings
Note: AGM as of 28th Sep 2012
Private: Domestic Company – Company B (x/x)
WASTE MANAGEMENT MARKET IN INDIA 2015.PPT
23
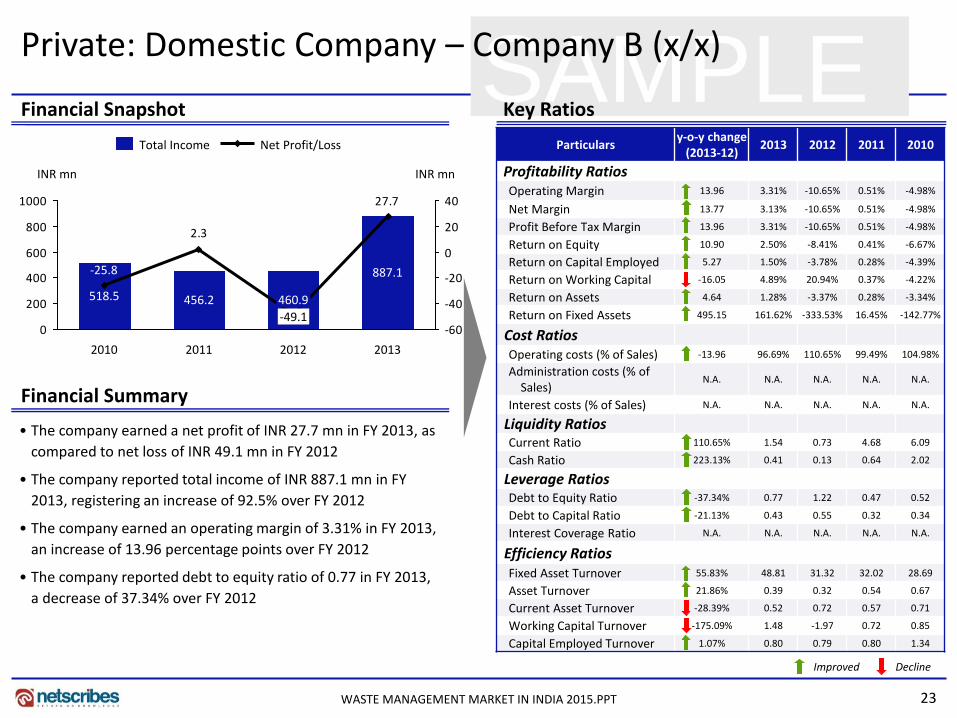
SAMPLE Financial Snapshot Key Ratios
Improved Decline
Financial Summary
• The company earned a net profit of INR 27.7 mn in FY 2013, as
compared to net loss of INR 49.1 mn in FY 2012
• The company reported total income of INR 887.1 mn in FY
2013, registering an increase of 92.5% over FY 2012
• The company earned an operating margin of 3.31% in FY 2013,
an increase of 13.96 percentage points over FY 2012
• The company reported debt to equity ratio of 0.77 in FY 2013,
a decrease of 37.34% over FY 2012
Net Profit/Loss Total Income
27.7
2.3
0
200
400
600
800
1000
-60
-40
-20
0
20
40
INR mn INR mn
2013
887.1
2012
-49.1
460.9
2011
456.2
2010
-25.8
518.5
Private: Domestic Company – Company B (x/x)
Particulars y-o-y change
(2013-12) 2013 2012 2011 2010
Profitability Ratios Operating Margin 13.96 3.31% -10.65% 0.51% -4.98%
Net Margin 13.77 3.13% -10.65% 0.51% -4.98%
Profit Before Tax Margin 13.96 3.31% -10.65% 0.51% -4.98%
Return on Equity 10.90 2.50% -8.41% 0.41% -6.67%
Return on Capital Employed 5.27 1.50% -3.78% 0.28% -4.39%
Return on Working Capital -16.05 4.89% 20.94% 0.37% -4.22%
Return on Assets 4.64 1.28% -3.37% 0.28% -3.34%
Return on Fixed Assets 495.15 161.62% -333.53% 16.45% -142.77%
Cost Ratios Operating costs (% of Sales) -13.96 96.69% 110.65% 99.49% 104.98%
Administration costs (% of Sales)
N.A. N.A. N.A. N.A. N.A.
Interest costs (% of Sales) N.A. N.A. N.A. N.A. N.A.
Liquidity Ratios Current Ratio 110.65% 1.54 0.73 4.68 6.09
Cash Ratio 223.13% 0.41 0.13 0.64 2.02
Leverage Ratios Debt to Equity Ratio -37.34% 0.77 1.22 0.47 0.52
Debt to Capital Ratio -21.13% 0.43 0.55 0.32 0.34
Interest Coverage Ratio N.A. N.A. N.A. N.A. N.A.
Efficiency Ratios Fixed Asset Turnover 55.83% 48.81 31.32 32.02 28.69
Asset Turnover 21.86% 0.39 0.32 0.54 0.67
Current Asset Turnover -28.39% 0.52 0.72 0.57 0.71
Working Capital Turnover -175.09% 1.48 -1.97 0.72 0.85
Capital Employed Turnover 1.07% 0.80 0.79 0.80 1.34
WASTE MANAGEMENT MARKET IN INDIA 2015.PPT
24
SAMPLE Business Highlights
Description News
Overview XX
Network XX
Awards XX
Private: Domestic Company – Company B (x/x)
WASTE MANAGEMENT MARKET IN INDIA 2015.PPT
25
SAMPLE Private: Domestic Company – Company B – SWOT Analysis (5/5)
XX XX
XX XX
T O
W S
WASTE MANAGEMENT MARKET IN INDIA 2015.PPT
26
Thank you for the attention
About Netscribes, Inc. Netscribes, Inc. is a knowledge-consulting and solutions firm with clientele across the globe. The company’s expertise spans areas of investment & business research, business & corporate intelligence, content-management services, and knowledge-software services. At its core lies a true value proposition that draws upon a vast knowledge base. Netscribes, Inc. is a one-stop shop designed to fulfil clients’ profitability and growth objectives.
Waste Management – India report is part of Netscribe’s Energy Industry Series. For any queries or customized research requirements, contact us at:
Disclaimer: This report is published for general information only. Although high standards have been used in the preparation, “Netscribes” is not responsible for any loss or damage arising from use of this document. This document is the sole property of Netscribes and prior permission is required for guidelines on reproduction.
Phone: +91 22 4098 7600 E-Mail: [email protected]
WASTE MANAGEMENT MARKET IN INDIA 2015.PPT