market research report : business intelligence market india 2014
TRANSCRIPT

Business Intelligence & Analytics Market - India
April 2014

2
Executive Summary
Market
Drivers & Challenges
Trends
Competition
Business Intelligence (BI) & Analytics market in India was valued at around INR xxx bn in 20xx and is estimated to grow at a CAGR of around xx% between 20xx to 20xx
Need to gather, analyze and generate insightful reports from extensive amounts of data & information across industry verticals pushes the demand for BI applications
Growing competition and changing market dynamics are leading organizations to adopt BI & analytics for gaining the competitive edge in the marketplace
Adoption of Mobile BI
Focus on In-memory Analytics
Emerging Social Media Analytics
Drivers
– Advent of Smartphones
– Rise in Usage Among SMBs
– Increase in Adoption by BFSI Sector
– Emergence of New Technologies
Challenges
– Deficiency of Trained Analysts
– Lack of Operational & Cultural Readiness
Major Players
SAP India Private Limited IBM India Pvt. Ltd.Microsoft Corporation India Pvt.
Ltd.
MAIA Intelligence Pvt. Ltd. Qlik Tech India Pvt. Ltd. Teradata India Pvt. Ltd.
BUSINESS INTELLIGENCE & ANALYTICS MARKET IN INDIA 2014.PPT
3BUSINESS INTELLIGENCE & ANALYTICS MARKET IN INDIA 2014.PPT
•Macroeconomic Indicators
•Introduction
•Market Overview
•Features & Benefits
•Costs & Best Practices
•Selection & Implementation
•BI Adoption in Key Sectors
•Drivers & Challenges
•Trends
•Competitive Landscape
•Case Studies
•Strategic Recommendations
•Appendix
4
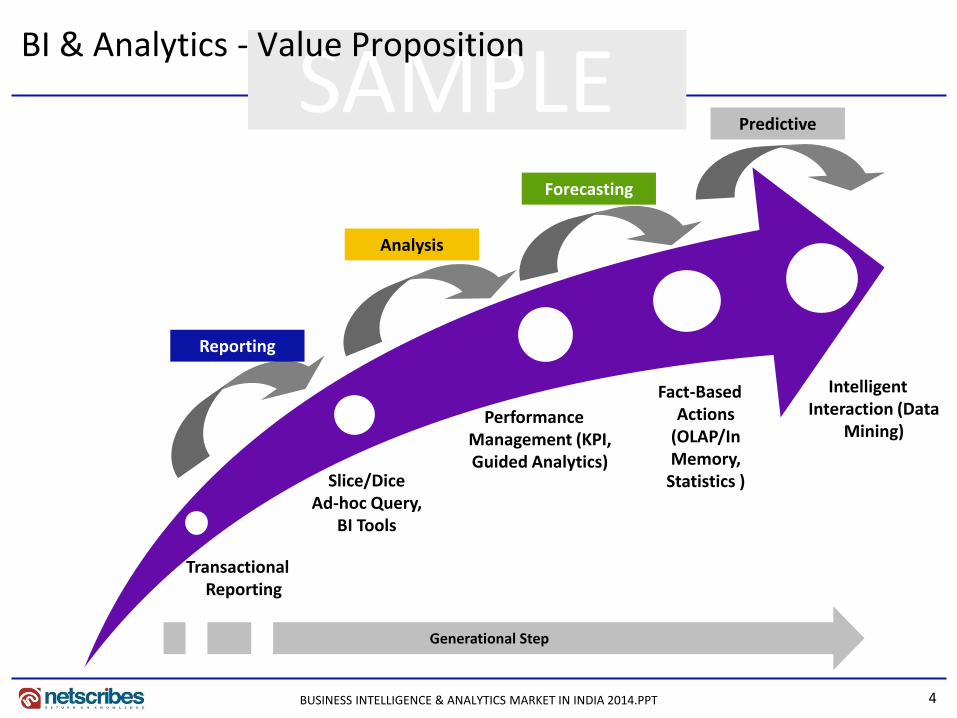
SAMPLE BI & Analytics - Value Proposition
Transactional Reporting
Slice/DiceAd-hoc Query,
BI Tools
PerformanceManagement (KPI, Guided Analytics)
Fact-Based Actions
(OLAP/In Memory,
Statistics )
IntelligentInteraction (Data
Mining)
Reporting
Analysis
Forecasting
Predictive
Generational Step
BUSINESS INTELLIGENCE & ANALYTICS MARKET IN INDIA 2014.PPT

5
SAMPLE Data intensive processes arising from hyper activity in key industry verticals drive the BI & Analytics market
BUSINESS INTELLIGENCE & ANALYTICS MARKET IN INDIA 2014.PPT
Market Size & Growth – India
x
x
x
x
0
INR bn
Xxx%
20xx
x
20xx
x
20xx
x
20xx
x
20xx
x
20xx
x66%
34%
• BI & Analytics market in India is estimated to be valued at
around INR xx bn and is expected to register a CAGR of
about xx% to reach INR xx bn by the end of 20xx
• SMBs (Small and Medium Businesses) contributed close
to INR x bn towards the overall BI & Analytics market in
India in 2013
• Over xx % of the BI & Analytics demand is generated by
the major industry verticals including BFSI and Telecom
Market Segmentation – India (2013)
BI & Analytics Market – Overview Key Industries using BI – India (2013)
xxxx
19.0%
10.3%
14.7%
20.6%
35.4%
xxxxxxxxxx

6
SAMPLE BI & Analytics Usage in SMBs (2/2)
Adoption of cloud based BI will continue to grow significantly over the coming 2-3 years
BUSINESS INTELLIGENCE & ANALYTICS MARKET IN INDIA 2014.PPT
BI Usage in SMBs (2013)
7.85
4.04
0
2
4
6
8
10
12
INR bn
2013
11.89
xxxx
60.6%
39.4%
xxxx
2013
SMBs Share in xxx is likely to witness growth of ~x%
SMBs Share in xxx is likely to witness growth of ~x%
7
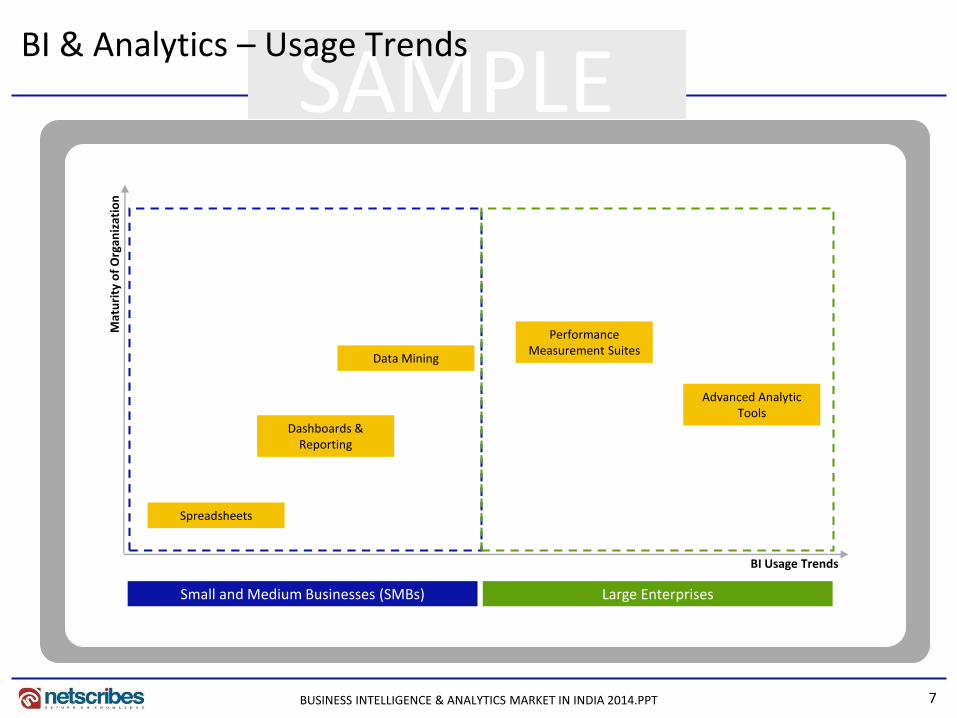
SAMPLE BI & Analytics – Usage Trends
BUSINESS INTELLIGENCE & ANALYTICS MARKET IN INDIA 2014.PPT
Small and Medium Businesses (SMBs) Large Enterprises
BI Usage Trends
Mat
uri
ty o
f O
rgan
izat
ion
Spreadsheets
Dashboards & Reporting
Data Mining
Performance Measurement Suites
Advanced Analytic Tools
8
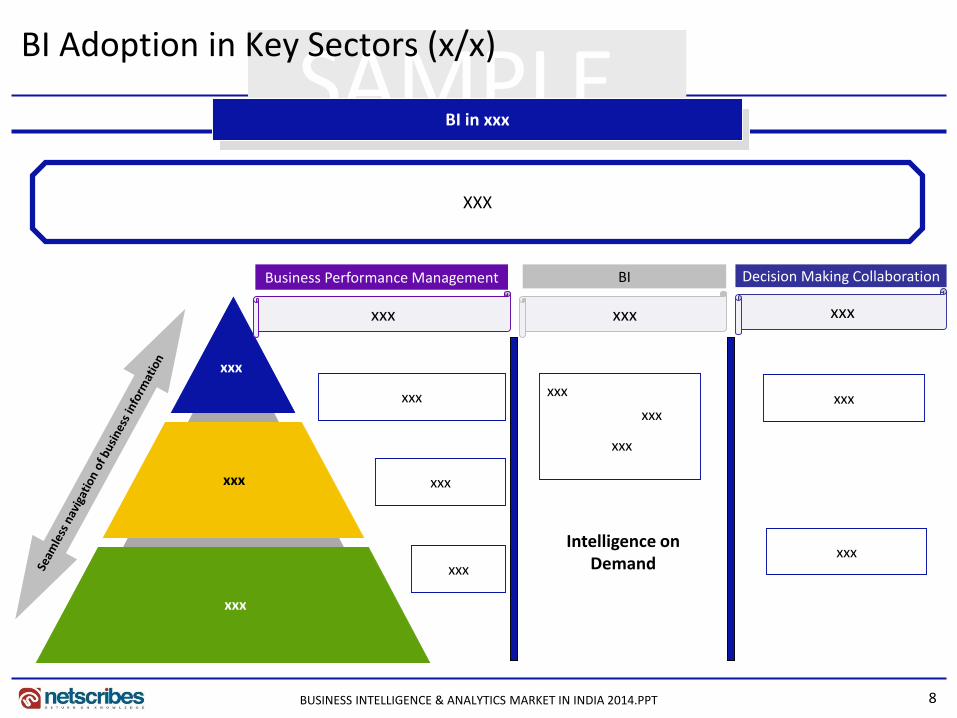
SAMPLE BI Adoption in Key Sectors (x/x)
BI in xxx
XXX
xxx
xxx
xxx
xxx xxx xxx
Business Performance Management BI Decision Making Collaboration
xxx
xxx
xxx
Intelligence on Demand
xxx
xxx
xxx
xxx
xxx
BUSINESS INTELLIGENCE & ANALYTICS MARKET IN INDIA 2014.PPT

9BUSINESS INTELLIGENCE & ANALYTICS MARKET IN INDIA 2014.PPT
Drivers & Challenges
Drivers
Advent of Smartphones
Rise in Usage among SMBs
Increase in Adoption by BFSI Sector
Emergence of New Technologies
Challenges
Deficiency of Trained Analysts
Lack of Operational & Cultural Readiness

10
SAMPLE
BUSINESS INTELLIGENCE & ANALYTICS MARKET IN INDIA 2014.PPT
Use of BI in cloud is making it more affordable and easily available
• XXX
Emergence of New Technologies Impact
xxx
New Technologies
xxx
xxx
xxx
Benefits
Makes BI tools more affordable
Ensures ease of use and quicker implementation
Makes data analytics more used by SMBs
XXX
• Advantages of cloud based BI:
xxx Cloud BI is particularly essential to xxx, however, most xxx are implementing a hybrid computing environment

11
SAMPLE Emerging Social Media Analytics (3/5)
Social Networking – Growth (20XX)
Unique Visitors – Growth
19.9
51.6
51.7
0 2 4 6 8 10 12 14 16 18 20 22 24 26 28 30 32 34 36 38 40 42 44 46 48 50 52
XXX
XXX
XXX
%
3.65.8
35.3
3.87.9
52.1
0
10
20
30
40
50
60
mn
5.6%36.2%
47.6%
XXXXXXXXX
Jul-12Jul-11
XXX
BUSINESS INTELLIGENCE & ANALYTICS MARKET IN INDIA 2014.PPT
12
SAMPLE
BUSINESS INTELLIGENCE & ANALYTICS MARKET IN INDIA 2014.PPT
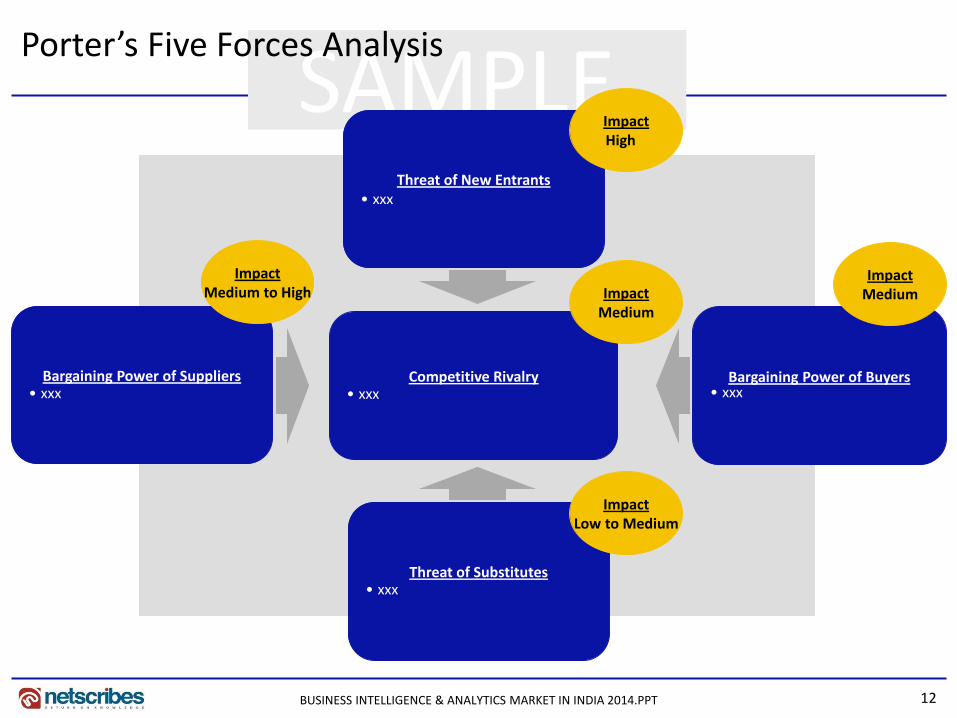
Porter’s Five Forces Analysis
Competitive Rivalry• xxx
Bargaining Power of Buyers• xxx
Threat of New Entrants• xxx
ImpactMedium
ImpactHigh
ImpactMedium
Bargaining Power of Suppliers• xxx
ImpactMedium to High
Threat of Substitutes• xxx
ImpactLow to Medium
13
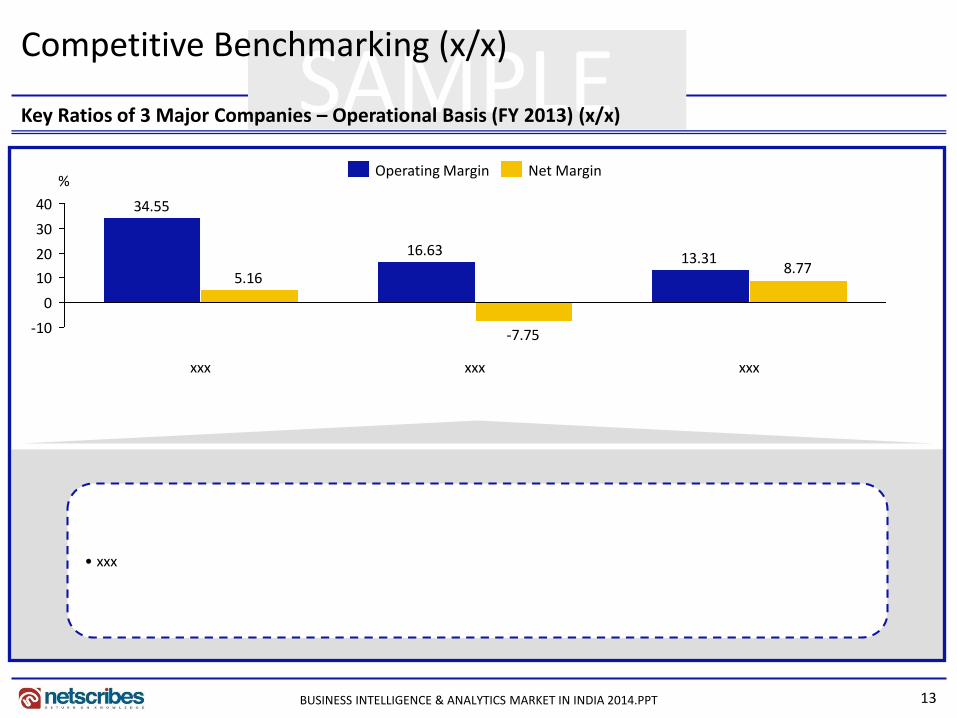
SAMPLE Key Ratios of 3 Major Companies – Operational Basis (FY 2013) (x/x)
Competitive Benchmarking (x/x)
13.3116.63
34.55
8.77
-7.75
5.16
-10
0
10
20
30
40
%
xxxxxxxxx
Net MarginOperating Margin
• xxx
BUSINESS INTELLIGENCE & ANALYTICS MARKET IN INDIA 2014.PPT
14
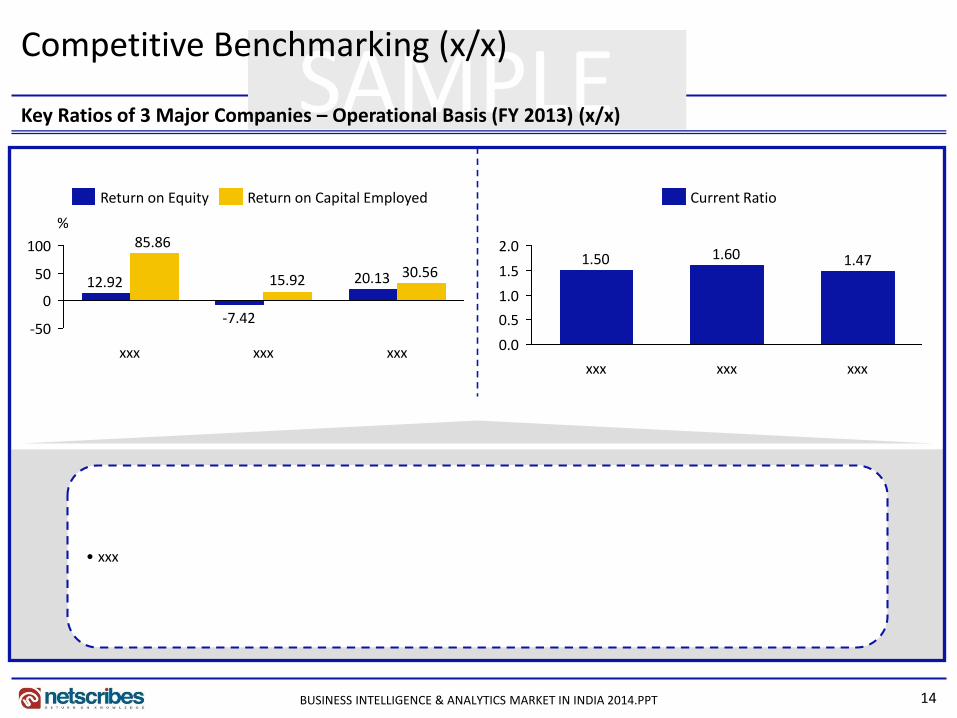
SAMPLE Key Ratios of 3 Major Companies – Operational Basis (FY 2013) (x/x)
Competitive Benchmarking (x/x)
20.13
-7.42
12.9230.5615.92
85.86
-50
0
50
100
%
xxxxxxxxx
Return on Capital EmployedReturn on Equity
1.471.601.50
0.0
0.5
1.0
1.5
2.0
xxxxxxxxx
Current Ratio
• xxx
BUSINESS INTELLIGENCE & ANALYTICS MARKET IN INDIA 2014.PPT
15
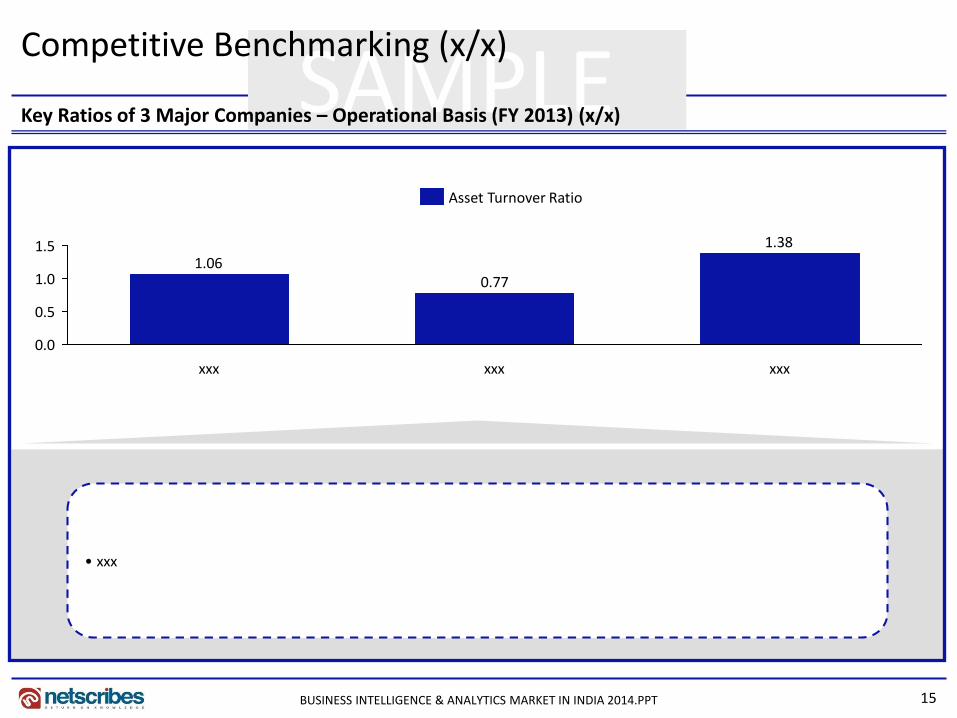
SAMPLE Key Ratios of 3 Major Companies – Operational Basis (FY 2013) (x/x)
Competitive Benchmarking (x/x)
1.38
0.771.06
0.0
0.5
1.0
1.5
xxxxxxxxx
Asset Turnover Ratio
• xxx
BUSINESS INTELLIGENCE & ANALYTICS MARKET IN INDIA 2014.PPT
16
SAMPLE
Key People
Products and Services
Company Information Offices and Centres – India
Corporate Address
Tel No.
Fax No.
Website
Year of Incorporation
Ticker Symbol
Stock Exchange
Category Products/Services
Name Designation
Pune Head Office
Public: Domestic Company – Player 1 (x/x)
BUSINESS INTELLIGENCE & ANALYTICS MARKET IN INDIA 2014.PPT
17
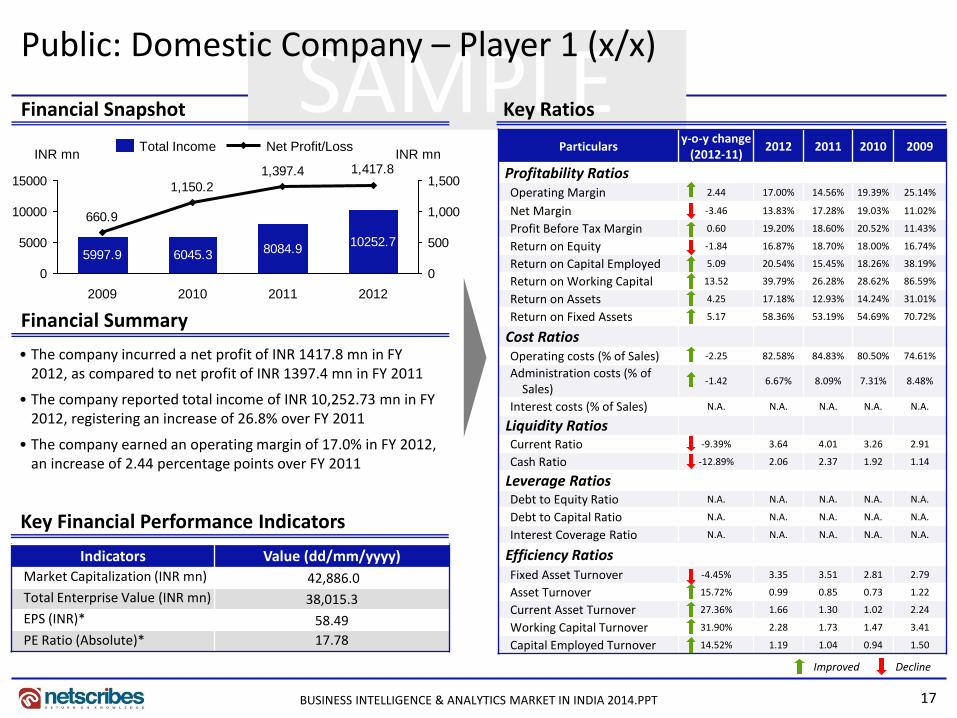
SAMPLE Financial Snapshot Key Ratios
Financial Summary
• The company incurred a net profit of INR 1417.8 mn in FY 2012, as compared to net profit of INR 1397.4 mn in FY 2011
• The company reported total income of INR 10,252.73 mn in FY 2012, registering an increase of 26.8% over FY 2011
• The company earned an operating margin of 17.0% in FY 2012, an increase of 2.44 percentage points over FY 2011
Key Financial Performance Indicators
Indicators Value (dd/mm/yyyy)Market Capitalization (INR mn) 42,886.0
Total Enterprise Value (INR mn) 38,015.3
EPS (INR)* 58.49
PE Ratio (Absolute)* 17.78
Particulars y-o-y change
(2012-11)2012 2011 2010 2009
Profitability RatiosOperating Margin 2.44 17.00% 14.56% 19.39% 25.14%
Net Margin -3.46 13.83% 17.28% 19.03% 11.02%
Profit Before Tax Margin 0.60 19.20% 18.60% 20.52% 11.43%
Return on Equity -1.84 16.87% 18.70% 18.00% 16.74%
Return on Capital Employed 5.09 20.54% 15.45% 18.26% 38.19%
Return on Working Capital 13.52 39.79% 26.28% 28.62% 86.59%
Return on Assets 4.25 17.18% 12.93% 14.24% 31.01%
Return on Fixed Assets 5.17 58.36% 53.19% 54.69% 70.72%
Cost RatiosOperating costs (% of Sales) -2.25 82.58% 84.83% 80.50% 74.61%
Administration costs (% of Sales)
-1.42 6.67% 8.09% 7.31% 8.48%
Interest costs (% of Sales) N.A. N.A. N.A. N.A. N.A.
Liquidity RatiosCurrent Ratio -9.39% 3.64 4.01 3.26 2.91
Cash Ratio -12.89% 2.06 2.37 1.92 1.14
Leverage RatiosDebt to Equity Ratio N.A. N.A. N.A. N.A. N.A.
Debt to Capital Ratio N.A. N.A. N.A. N.A. N.A.
Interest Coverage Ratio N.A. N.A. N.A. N.A. N.A.
Efficiency RatiosFixed Asset Turnover -4.45% 3.35 3.51 2.81 2.79
Asset Turnover 15.72% 0.99 0.85 0.73 1.22
Current Asset Turnover 27.36% 1.66 1.30 1.02 2.24
Working Capital Turnover 31.90% 2.28 1.73 1.47 3.41
Capital Employed Turnover 14.52% 1.19 1.04 0.94 1.50
Improved Decline
Net Profit/LossTotal Income
10252.78084.96045.35997.9
1,417.81,397.4
1,150.2
660.9
0
5000
10000
15000
0
500
1,000
1,500
INR mnINR mn
2012201120102009
Public: Domestic Company – Player 1 (x/x)
BUSINESS INTELLIGENCE & ANALYTICS MARKET IN INDIA 2014.PPT
18
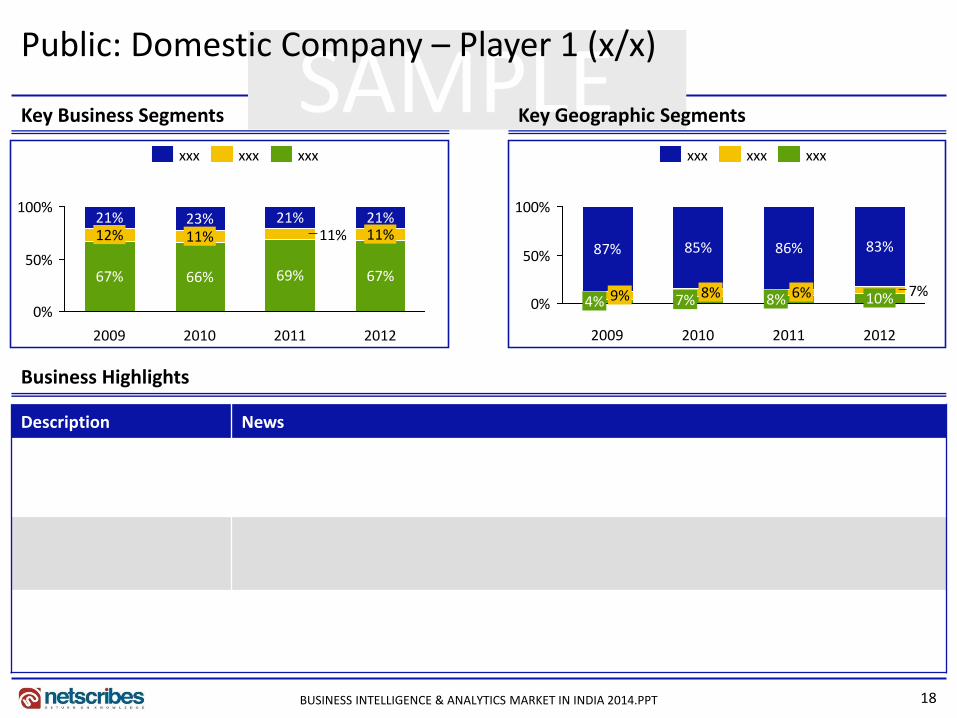
SAMPLE Key Business Segments Key Geographic Segments
Business Highlights
Description News
11%
0%
50%
100%
2012
67%
11%21%
2011
69%
21%
2010
66%
11%23%
2009
67%
12%21%
xxxxxxxxx
7%0%
50%
100%
2012
10%
83%
2011
8% 6%
86%
2010
7% 8%
85%
2009
4% 9%
87%
xxxxxxxxx
Public: Domestic Company – Player 1 (x/x)
BUSINESS INTELLIGENCE & ANALYTICS MARKET IN INDIA 2014.PPT

19
SAMPLE
• xxx • xxx
• xxx• xxx
TO
WS
Public: Domestic Company – Player 1 (x/x)
BUSINESS INTELLIGENCE & ANALYTICS MARKET IN INDIA 2014.PPT
20
SAMPLE Private: Domestic Company – Player 2 (x/x)
Key People
Products and Services
Company Information Offices and Centres – India
Category Products/Services
Name Designation
Bangalore
Corporate Address
Tel No.
Fax No.
Website
Year of Incorporation
Head Office
BUSINESS INTELLIGENCE & ANALYTICS MARKET IN INDIA 2014.PPT
21
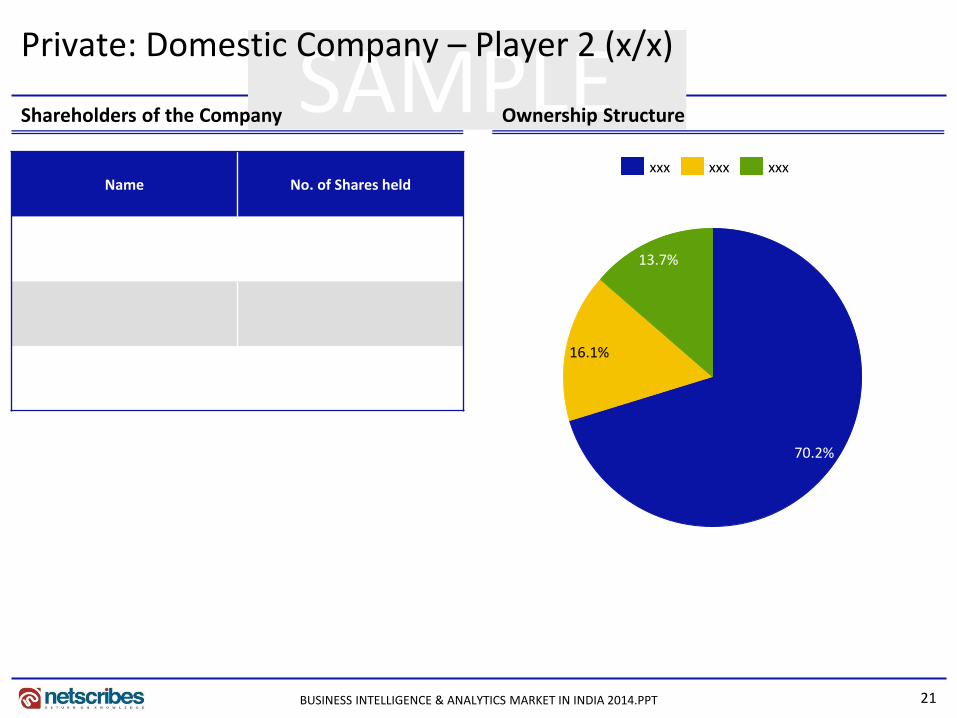
SAMPLE Private: Domestic Company – Player 2 (x/x)
Shareholders of the Company Ownership Structure
Name No. of Shares held
BUSINESS INTELLIGENCE & ANALYTICS MARKET IN INDIA 2014.PPT
13.7%
16.1%
70.2%
xxxxxxxxx

22
SAMPLE Financial Snapshot Key Ratios
Particulars y-o-y change
(2012-11)2012 2011 2010 2009
Profitability RatiosOperating Margin -0.66 2.49% 3.15% 7.82% 7.17%
Net Margin -0.15 1.78% 1.93% 5.11% 6.50%
Profit Before Tax Margin -0.66 2.49% 3.15% 7.82% 7.17%
Return on Equity 0.00001 0.0001% 0.0001% 0.0002% 0.0003%
Return on Capital Employed -0.00002 0.0001% 0.0001% 0.0003% 0.0003%
Return on Working Capital 0.000001 0.000209% 0.000211% 0.0004% 0.0003%
Return on Assets -0.00001 0.0001% 0.0001% 0.0002% 0.0003%
Return on Fixed Assets -0.00003 0.0003% 0.0003% 0.0014% 0.0083%
Cost RatiosOperating costs (% of Sales) 0.66 97.51% 96.85% 92.18% 92.83%
Administration costs (% of Sales)
N.A. N.A. N.A. N.A. N.A.
Interest costs (% of Sales) N.A. N.A. N.A. N.A. N.A.
Liquidity RatiosCurrent Ratio -9.75% 1.58 1.75 1.96 2.52
Cash Ratio -33.53% 0.17 0.26 0.33 1.01
Leverage RatiosDebt to Equity Ratio 151.97% 0.25 0.10 0.00 0.07
Debt to Capital Ratio 121.87% 0.20 0.09 0.00 0.06
Interest Coverage Ratio N.A. N.A. N.A. N.A. N.A.
Efficiency RatiosFixed Asset Turnover 13.44% 0.00012 0.00011 0.00018 0.00115
Asset Turnover 8.16% 0.00002 0.00002 0.00002 0.00004
Current Asset Turnover 7.77% 0.00003 0.00003 0.00003 0.00003
Working Capital Turnover 25.98% 0.00008 0.00007 0.00005 0.00004
Capital Employed Turnover 19.72% 0.00004 0.00004 0.00004 0.00004
Private: Domestic Company – Player 2 (x/x)
Improved Decline
Financial Summary
• The company earned a net profit of INR 624 in FY 2012, as
compared to net profit of INR 583 in FY 2011
• The company reported total income of INR 35,128 in FY 2012,
as compared to INR 30,200 in FY 2011
• The company earned an operating margin of 2.49% in FY 2012,
a decrease of 0.66 percentage points over FY 2011
• The company reported debt to equity ratio of 0.001 in FY 2011,
a decrease of 98.87% over FY 2010
Net Profit/LossTotal Income
35,128.030,200.0
35,029.0
29,919.0
624.0
1791.01945.0
0
10,000
20,000
30,000
40,000
0
500
1000
1500
2000
INRINR
20122011
583.0
20102009
BUSINESS INTELLIGENCE & ANALYTICS MARKET IN INDIA 2014.PPT

23
SAMPLE Business Highlights
Private: Domestic Company – Player 2 (x/x)
Description News
BUSINESS INTELLIGENCE & ANALYTICS MARKET IN INDIA 2014.PPT
24
SAMPLE
• xxx • xxx
• xxx• xxx
TO
WS
Private: Domestic Company – Player 2 (x/x)
BUSINESS INTELLIGENCE & ANALYTICS MARKET IN INDIA 2014.PPT

25
SAMPLE Case Study x
Case: BI deployed to reduce time and manpower consumption
SolutionsRequirements Benefits
• XXX • xxx• xxx
Solution Used
xxx
Client Organization ICT Vendor
xxx xxx
Industry
xxx
BUSINESS INTELLIGENCE & ANALYTICS MARKET IN INDIA 2014.PPT

26
Thank you for the attention
About Netscribes, Inc.Netscribes, Inc. is a knowledge-consulting and solutions firm with clientele across the globe. The company’s expertise spans areas of investment & business research, business & corporate intelligence, content-management services, and knowledge-software services. At its core lies a true value proposition that draws upon a vast knowledge base. Netscribes, Inc. is a one-stop shop designed to fulfil clients’ profitability and growth objectives.
Business Intelligence Market – India report is part of Netscribes’ Technology Series.For any queries or customized research requirements, contact us at:
Disclaimer: This report is published for general information only. Although high standards have been used in the preparation, “Netscribes” is not responsible for any loss or damage arising from use of this document. This document is the sole property of Netscribes and prior permission is required for guidelines on reproduction.
Follow us on:
Phone: +91 22 4098 7600E-Mail: [email protected]
BUSINESS INTELLIGENCE & ANALYTICS MARKET IN INDIA 2014.PPT