market research for market readiness manual i. market research/consumer testing 1 ii. market...
TRANSCRIPT

Copyright © 2016, Oregon State University, Food Innovation Center, Catherine Durham, Ann Colonna.
Market Research for
Market Readiness Manual
February 16, 2017 Version 1.1
The Market Research for Market Readiness protocol was designed and developed by
Catherine Durham, Marketing Economist And
Ann Colonna, Sensory Program Manager
Sarah Masoni Assisted in Recruiting Alpha and Beta Testers of the Protocol
DeDe Long, Graduate Research Assistant, contributed to early versions of the spreadsheet, and James B. Miller, Student Assistant, contributed to the Website
Food Innovation Center Oregon State funds for this project are matched with Federal funds under the Federal-State Marketing Improvement Program of the Agricultural Marketing Service, U.S. Department of Agriculture, Grant 11404658 “Market Research for Market Readiness.”
Contents I. Market Research/Consumer Testing ................................................................................... 1
II. Market Research for Market Readiness Overview ............................................................. 1
III. Consumer Testing Considerations ...................................................................................... 5
A. Testing Sites .................................................................................................................... 5
B. Test Conditions and Needs ............................................................................................. 7
C. Consumer Base ............................................................................................................... 7
D. Incentives ........................................................................................................................ 7
E. Participants must be Informed ........................................................................................ 8
F. Formal Consent ............................................................................................................... 8
G. Participant Screening ...................................................................................................... 8
H. Number of Consumers .................................................................................................... 9
I. Do you plan to test Multiple Flavors? ............................................................................. 9
J. Sensory Focus on Ballot ................................................................................................. 9
IV. The Workbook .................................................................................................................. 10
V. Ballot Creation Instructions .............................................................................................. 11
A. Overview ....................................................................................................................... 11
B. Ballot Template Page (1) .............................................................................................. 11
i. Survey Consent .......................................................................................................... 11
ii. Concept Question ...................................................................................................... 12
iii. Three Liking Rating Questions ................................................................................. 13
iv. Attribute (Just about Right) Questions 5-8. ............................................................... 15
v. Open-ended question ................................................................................................. 16
C. Ballot Template Page (2) .............................................................................................. 16
Purchase-Intent-Price Question ................................................................................. 17
ii. How-Many ................................................................................................................. 20
iii. Check-All-That-Apply Questions: ............................................................................ 21
iv. Multiple Choice Questions ........................................................................................ 22
VI. Ballot Completion Check List .......................................................................................... 23
VII. Test Day ............................................................................................................................ 23
A. Product Preparation and Serving ................................................................................... 24
B. Product .......................................................................................................................... 25
C. Multiple Samples .......................................................................................................... 25
D. Test Management .......................................................................................................... 25
VIII. Entering Survey Results into the DATA Worksheet ........................................................ 26
A. Setting Up Your Excel program .................................................................................... 27
B. Automation.................................................................................................................... 27
C. Coding for Data Entry ................................................................................................... 27
Multiple Choice (Scale Questions) ............................................................................ 28
IX. Evaluating Results ............................................................................................................ 30
A. Purchase-Intent-Concept (P-I-C) .................................................................................. 30
B. Liking Ratings (9-PT-Scale) ......................................................................................... 30
C. Just-About-Right ........................................................................................................... 30
D. Open-Ended Questions ................................................................................................. 31
E. Purchase-Intent-Price question (P-I-P).......................................................................... 31
F. How-Many .................................................................................................................... 32
G. Check All that Apply (C-A) .......................................................................................... 32
H. Multiple Choice (M-C).................................................................................................. 32
X. Final Remarks and Considerations ................................................................................... 34
A. Money Versus Time ...................................................................................................... 34
B. Third Party Testing........................................................................................................ 34
C. Third Party ‘Light’ ........................................................................................................ 34
XI. Computerized Surveys ...................................................................................................... 35
XII. For Extension, Outreach and other Non-profit Professionals Assisting Start-ups............ 36
XIII. Contacts, Feedback, and Other Information ..................................................................... 36
XIV. Acknowledgements ........................................................................................................... 36
XV. Funding ............................................................................................................................. 36
Appendix 1 Multiple Flavors ................................................................................................. 37
A. Ballot Adjustments ........................................................................................................ 37
B. Number of Samples/Palette Cleansing .......................................................................... 38
C. Sample Preparation ....................................................................................................... 38
D. Serving Order ................................................................................................................ 38
Figures Figure II-1 Example Just-About-Right Chart ................................................................................ 3
Figure II-2 Purchase-Intent-Price Chart......................................................................................... 3
Figure II-3 Purchase-Intent-Price Compared to Check-all-that-apply Responses ......................... 4
Figure III-1 A pleasant and welcoming test site ............................................................................ 5
Figure III-2 An in-store test ........................................................................................................... 5
Figure III-3 Needs for an Outdoor test site: Table, Chairs, and Shelter ........................................ 6
Figure V-1 Filled Ballot Page (1) Example ................................................................................. 14
Figure V-2 With Attribute Cells filled in on left, Q5 displays as on right. ................................. 16
Figure V-3 Appearance of Ballot Page 2 Worksheet ................................................................... 16
Figure V-4 Appearance of Top of Ballot Template page (2) Worksheet .................................... 18
Figure V-5Appearance of Bottom of Ballot Template page (2) Worksheet ................................ 19
Figure V-6 Information Entry for Multiple choice Questions ..................................................... 22
Figure VII-1 Needs for an Outdoor test site: Table, Chairs, Shelter ...................................... 23
Figure VII-2 Branded Test with Labeled Package ...................................................................... 24
Figure VIII-1Check all that apply entry....................................................................................... 29
Figure IX-1 Figures for ‘Final Multiple Choice M-C’ tab .......................................................... 33
Figure Appendix-1 Presentation .................................................................................................. 38
Figure Appendix-2 Example of Overall Liking Compare .......................................................... 39

Market Research/Consumer Testing 1
I. Market Research/Consumer Testing The objective of the consumer testing described in this manual is to determine the acceptance and potential of the product you are testing with current or target market consumers. Acceptance Testing is often used by food producers and processors to better understand consumer acceptance of their product overall and/or attributes within the product, concept, package or even product label. Depending on where a company is in the development of their product(s), questions on price and purchase intent might be added to the questions used in Acceptance Testing to examine the market potential for their product. The Market Research for Market Readiness (MKTRD) protocol is designed for you to run your own consumer acceptance and market potential investigation in order to: (1) assess liking for your new product, (2) consider whether ingredients and flavors are at the right level, and (3) examine price and purchase intent with potential consumers.
This manual will teach you how to conduct a limited consumer test designed specifically for new product testing by food product entrepreneurs and value-added producers. The consumer test is restricted in length and targets only a readily available population intercepted at a public venue.
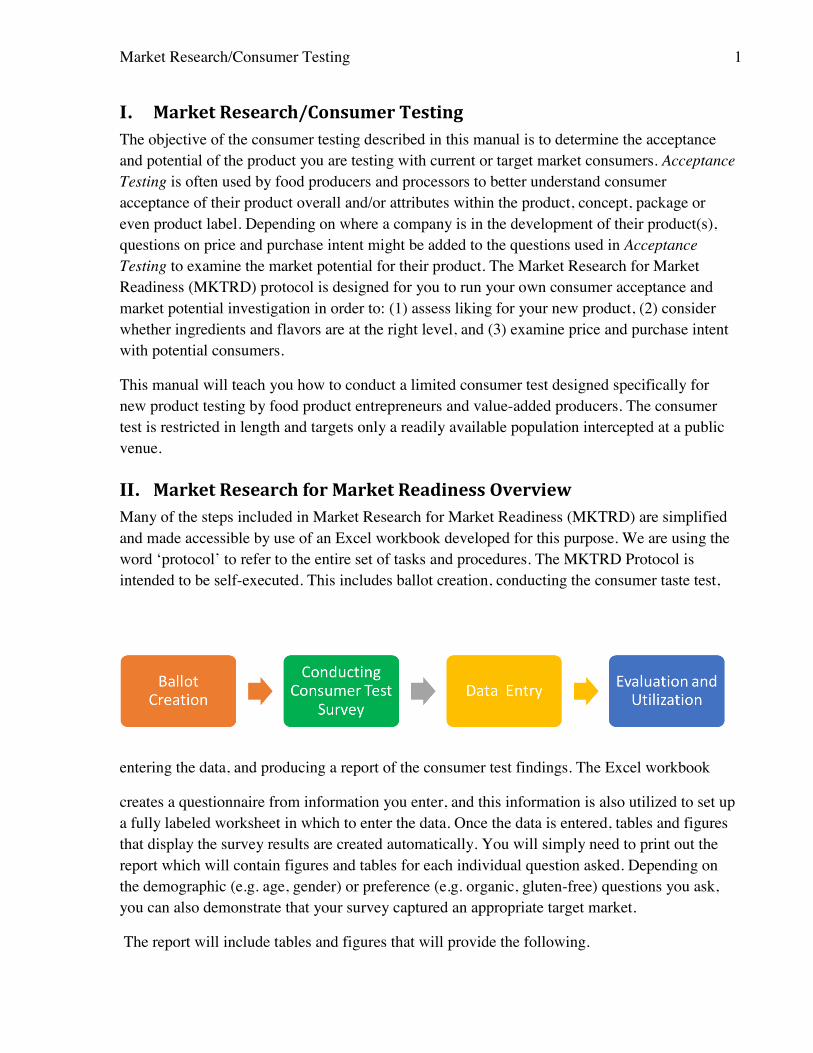
II. Market Research for Market Readiness Overview Many of the steps included in Market Research for Market Readiness (MKTRD) are simplified and made accessible by use of an Excel workbook developed for this purpose. We are using the word ‘protocol’ to refer to the entire set of tasks and procedures. The MKTRD Protocol is intended to be self-executed. This includes ballot creation, conducting the consumer taste test,
entering the data, and producing a report of the consumer test findings. The Excel workbook
creates a questionnaire from information you enter, and this information is also utilized to set up a fully labeled worksheet in which to enter the data. Once the data is entered, tables and figures that display the survey results are created automatically. You will simply need to print out the report which will contain figures and tables for each individual question asked. Depending on the demographic (e.g. age, gender) or preference (e.g. organic, gluten-free) questions you ask, you can also demonstrate that your survey captured an appropriate target market.
The report will include tables and figures that will provide the following.
Market Research for Market Readiness Overview 2
1) Valuable feedback regarding the sensory attributes of your food product. This will help you to better understand what consumers like and dislike about your product, so that you can refine your recipe to best meet consumer needs.
2) Critical information on how a range of retail prices for your product will affect potential consumers. Additionally, you can get a better idea of how frequently informed consumers would purchase your product.
3) Provide ‘proof of concept’ to bolster your business plan, and collect actual data to present to potential investors or business partners.
4) The liking and purchase information can also be used in a ‘marketing pitch’ to potential retail buyers. You can include survey questions that target a specific demographic for particular retailers (e.g. young / old, affluent, gluten free, etc.)
More specifically, the sensory information you gather may help you make some critical adjustments in formulation to attract more customers. Knowledge regarding price and purchase intent is critical for an entrepreneur; you don’t want to make an investment unless you can make a profit, and that won’t happen unless consumers like your willing to buy it at price point sufficient to do so. In the survey purchase intent is asked at several prices because, you may not be certain of your costs, to determine a profitable price yet. The information you gather on product liking and pricing will be a valuable component of a business plan that you could share with investors. The third use of the information would be in marketing your product to consumers and retailers: findings that indicate most customers are willing to pay the suggested retail price for your product will definitely help to convince retailers to carry your product. You may also receive information that could improve your marketing focus and strategy. You can decide to include questions in the survey that will provide you with specific demographic information (such as age, income, food allergens, etc.) for the consumers you have surveyed. This information will not only help you to better understand your target consumer, but also the ideal retail location(s) for your product. Lastly, you can ask open ended questions that can help you identify what consumers like and dislike most about your product, and/or how they would use it. Again, this information can be used to strengthen your marketing.
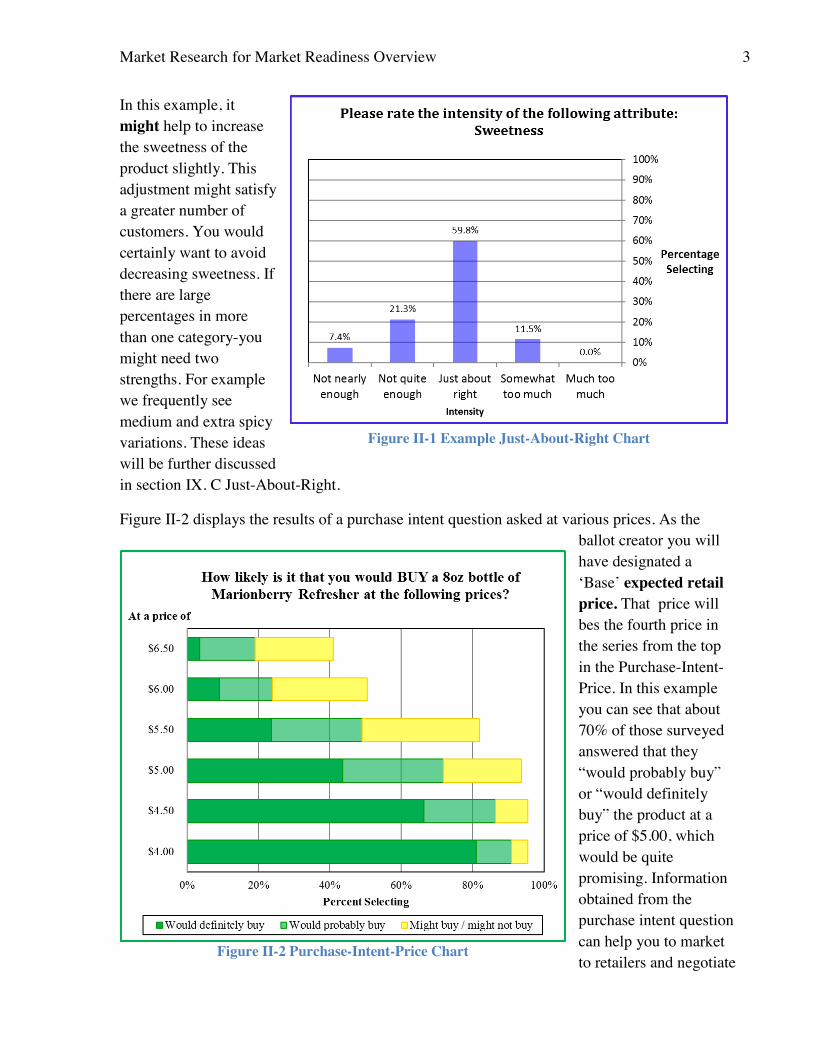
Some examples of what the report contains are shown in the next two pages. Figure II-1 displays the results of a Just-About-Right question. This question will help you check to see if your recipe is ready and indicate how you should make changes (if necessary). As a rule of thumb, when over 65% of respondents feel that a product attribute is just-about-right, you can leave the product as it is. If the just-about-right finding is less than 65%, and the sum of the not--enough categories are 10% more or less than the sum for the too-much categories the product attribute may need to be adjusted in the direction of the lower sum. However, if those in disagreement are well balanced in both directions the product probably doesn’t need to be changed.
Market Research for Market Readiness Overview 3
In this example, it might help to increase the sweetness of the product slightly. This adjustment might satisfy a greater number of customers. You would certainly want to avoid decreasing sweetness. If there are large percentages in more than one category-you might need two strengths. For example we frequently see medium and extra spicy variations. These ideas will be further discussed in section IX. C Just-About-Right.
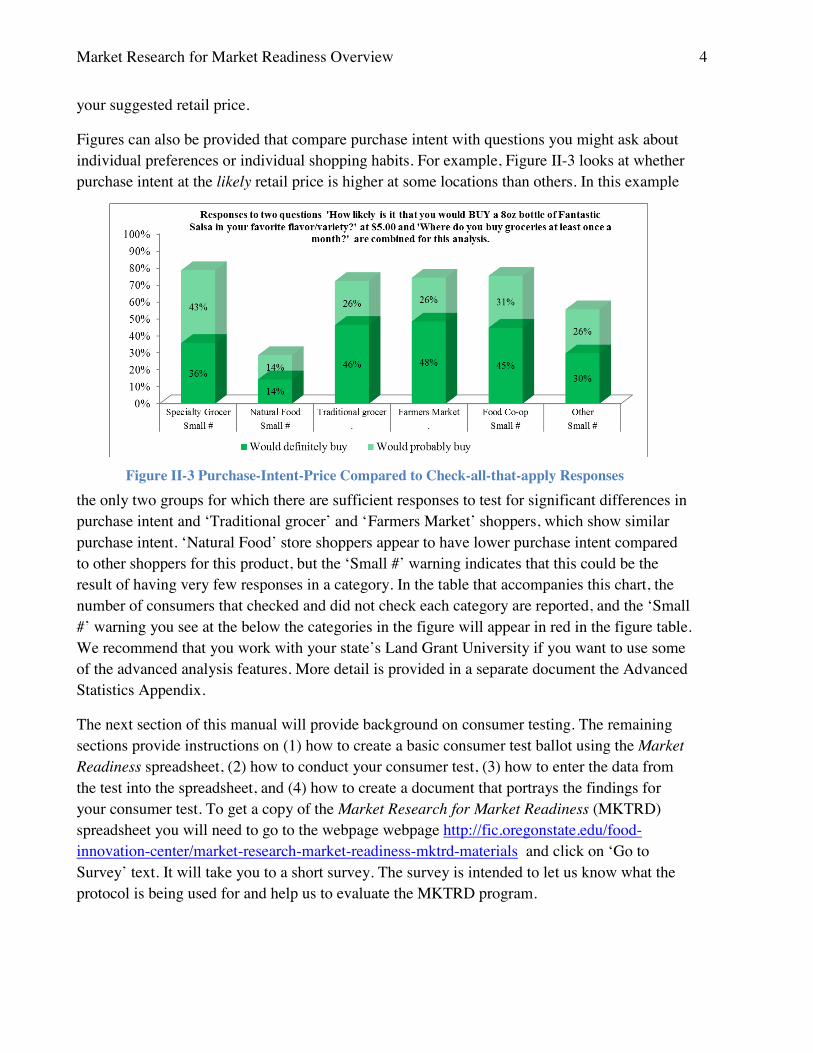
Figure II-2 displays the results of a purchase intent question asked at various prices. As the ballot creator you will have designated a ‘Base’ expected retail price. That price will bes the fourth price in the series from the top in the Purchase-Intent-Price. In this example you can see that about 70% of those surveyed answered that they “would probably buy” or “would definitely buy” the product at a price of $5.00, which would be quite promising. Information obtained from the purchase intent question can help you to market to retailers and negotiate
Figure II-1 Example Just-About-Right Chart
Figure II-2 Purchase-Intent-Price Chart
Market Research for Market Readiness Overview 4
your suggested retail price.
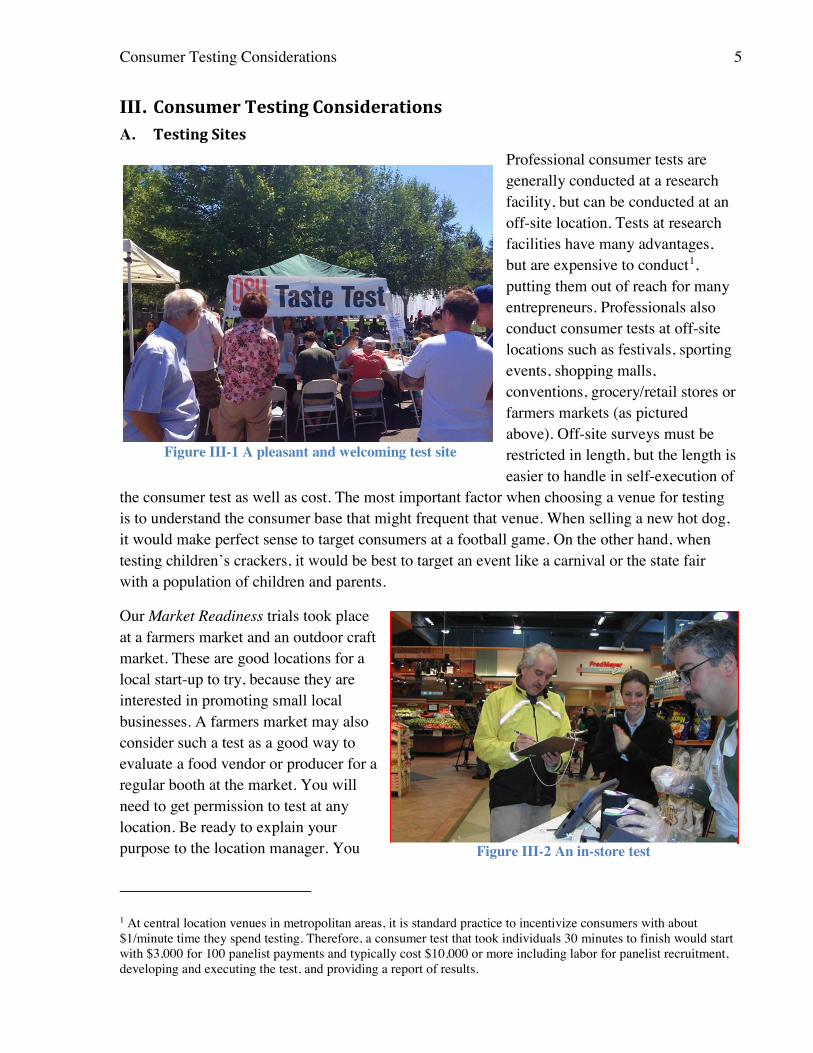
Figures can also be provided that compare purchase intent with questions you might ask about individual preferences or individual shopping habits. For example, Figure II-3 looks at whether purchase intent at the likely retail price is higher at some locations than others. In this example
the only two groups for which there are sufficient responses to test for significant differences in purchase intent and ‘Traditional grocer’ and ‘ Farmers Market’ shoppers, which show similar purchase intent. ‘Natural Food’ store shoppers appear to have lower purchase intent compared to other shoppers for this product, but the ‘Small #’ warning indicates that this could be the result of having very few responses in a category. In the table that accompanies this chart, the number of consumers that checked and did not check each category are reported, and the ‘Small #’ warning you see at the below the categories in the figure will appear in red in the figure table. We recommend that you work with your state’s Land Grant University if you want to use some of the advanced analysis features. More detail is provided in a separate document the Advanced Statistics Appendix.
The next section of this manual will provide background on consumer testing. The remaining sections provide instructions on (1) how to create a basic consumer test ballot using the Market Readiness spreadsheet, (2) how to conduct your consumer test, (3) how to enter the data from the test into the spreadsheet, and (4) how to create a document that portrays the findings for your consumer test. To get a copy of the Market Research for Market Readiness (MKTRD) spreadsheet you will need to go to the webpage webpage http://fic.oregonstate.edu/food-innovation-center/market-research-market-readiness-mktrd-materials and click on ‘Go to Survey’ text. It will take you to a short survey. The survey is intended to let us know what the protocol is being used for and help us to evaluate the MKTRD program.
Figure II-3 Purchase-Intent-Price Compared to Check-all-that-apply Responses
Consumer Testing Considerations 5
III. Consumer Testing Considerations A. Testing Sites
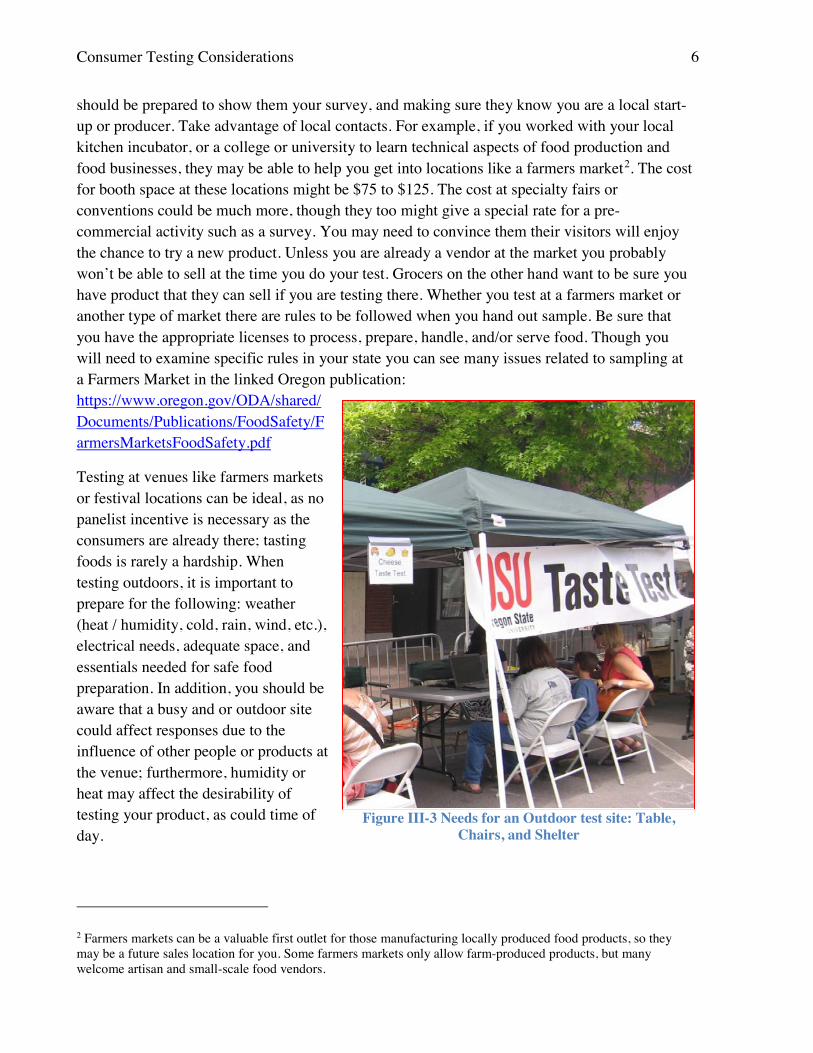
Professional consumer tests are generally conducted at a research facility, but can be conducted at an off-site location. Tests at research facilities have many advantages, but are expensive to conduct1, putting them out of reach for many entrepreneurs. Professionals also conduct consumer tests at off-site locations such as festivals, sporting events, shopping malls, conventions, grocery/retail stores or farmers markets (as pictured above). Off-site surveys must be restricted in length, but the length is easier to handle in self-execution of
the consumer test as well as cost. The most important factor when choosing a venue for testing is to understand the consumer base that might frequent that venue. When selling a new hot dog, it would make perfect sense to target consumers at a football game. On the other hand, when testing children’s crackers, it would be best to target an event like a carnival or the state fair with a population of children and parents.
Our Market Readiness trials took place at a farmers market and an outdoor craft market. These are good locations for a local start-up to try, because they are interested in promoting small local businesses. A farmers market may also consider such a test as a good way to evaluate a food vendor or producer for a regular booth at the market. You will need to get permission to test at any location. Be ready to explain your purpose to the location manager. You
1 At central location venues in metropolitan areas, it is standard practice to incentivize consumers with about $1/minute time they spend testing. Therefore, a consumer test that took individuals 30 minutes to finish would start with $3,000 for 100 panelist payments and typically cost $10,000 or more including labor for panelist recruitment, developing and executing the test, and providing a report of results.
Figure III-2 An in-store test
Figure III-1 A pleasant and welcoming test site
Consumer Testing Considerations 6
should be prepared to show them your survey, and making sure they know you are a local start-up or producer. Take advantage of local contacts. For example, if you worked with your local kitchen incubator, or a college or university to learn technical aspects of food production and food businesses, they may be able to help you get into locations like a farmers market2. The cost for booth space at these locations might be $75 to $125. The cost at specialty fairs or conventions could be much more, though they too might give a special rate for a pre-commercial activity such as a survey. You may need to convince them their visitors will enjoy the chance to try a new product. Unless you are already a vendor at the market you probably won’t be able to sell at the time you do your test. Grocers on the other hand want to be sure you have product that they can sell if you are testing there. Whether you test at a farmers market or another type of market there are rules to be followed when you hand out sample. Be sure that you have the appropriate licenses to process, prepare, handle, and/or serve food. Though you will need to examine specific rules in your state you can see many issues related to sampling at a Farmers Market in the linked Oregon publication: https://www.oregon.gov/ODA/shared/Documents/Publications/FoodSafety/FarmersMarketsFoodSafety.pdf
Testing at venues like farmers markets or festival locations can be ideal, as no panelist incentive is necessary as the consumers are already there; tasting foods is rarely a hardship. When testing outdoors, it is important to prepare for the following: weather (heat / humidity, cold, rain, wind, etc.), electrical needs, adequate space, and essentials needed for safe food preparation. In addition, you should be aware that a busy and or outdoor site could affect responses due to the influence of other people or products at the venue; furthermore, humidity or heat may affect the desirability of testing your product, as could time of day.
2 Farmers markets can be a valuable first outlet for those manufacturing locally produced food products, so they may be a future sales location for you. Some farmers markets only allow farm-produced products, but many welcome artisan and small-scale food vendors.
Figure III-3 Needs for an Outdoor test site: Table, Chairs, and Shelter
Consumer Testing Considerations 7
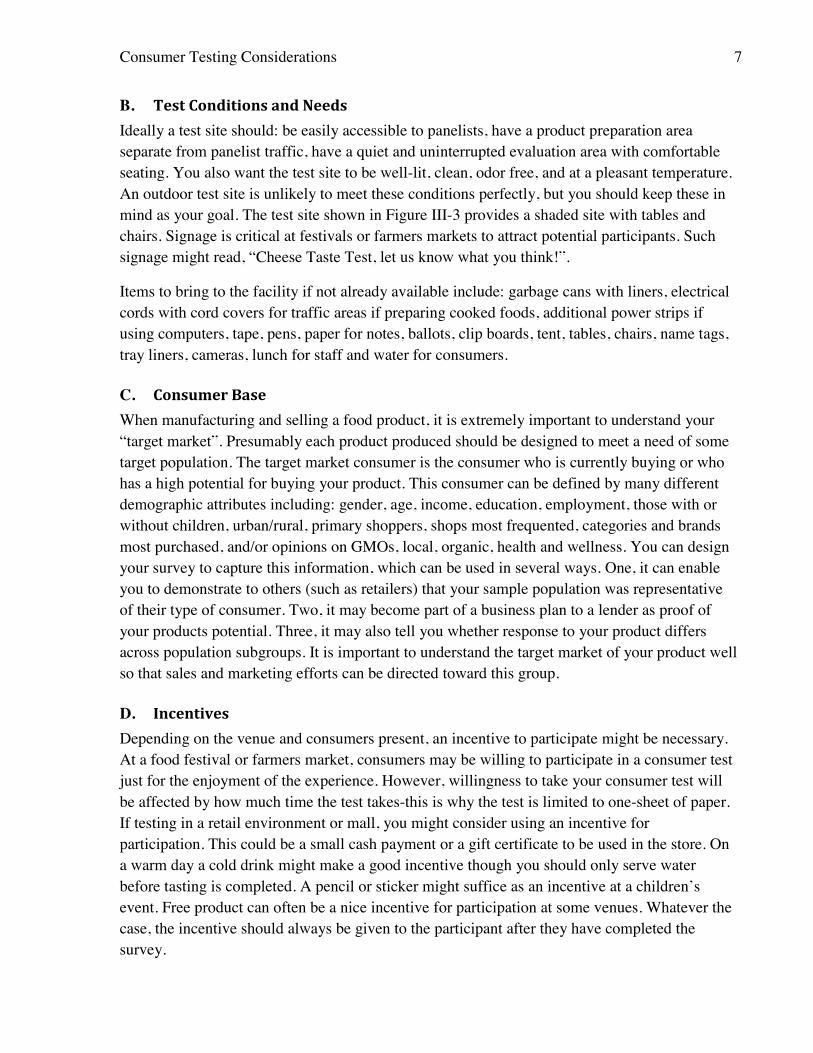
B. Test Conditions and Needs Ideally a test site should: be easily accessible to panelists, have a product preparation area separate from panelist traffic, have a quiet and uninterrupted evaluation area with comfortable seating. You also want the test site to be well-lit, clean, odor free, and at a pleasant temperature. An outdoor test site is unlikely to meet these conditions perfectly, but you should keep these in mind as your goal. The test site shown in Figure III-3 provides a shaded site with tables and chairs. Signage is critical at festivals or farmers markets to attract potential participants. Such signage might read, “Cheese Taste Test, let us know what you think!”.
Items to bring to the facility if not already available include: garbage cans with liners, electrical cords with cord covers for traffic areas if preparing cooked foods, additional power strips if using computers, tape, pens, paper for notes, ballots, clip boards, tent, tables, chairs, name tags, tray liners, cameras, lunch for staff and water for consumers.
C. Consumer Base When manufacturing and selling a food product, it is extremely important to understand your “target market”. Presumably each product produced should be designed to meet a need of some target population. The target market consumer is the consumer who is currently buying or who has a high potential for buying your product. This consumer can be defined by many different demographic attributes including: gender, age, income, education, employment, those with or without children, urban/rural, primary shoppers, shops most frequented, categories and brands most purchased, and/or opinions on GMOs, local, organic, health and wellness. You can design your survey to capture this information, which can be used in several ways. One, it can enable you to demonstrate to others (such as retailers) that your sample population was representative of their type of consumer. Two, it may become part of a business plan to a lender as proof of your products potential. Three, it may also tell you whether response to your product differs across population subgroups. It is important to understand the target market of your product well so that sales and marketing efforts can be directed toward this group.
D. Incentives Depending on the venue and consumers present, an incentive to participate might be necessary. At a food festival or farmers market, consumers may be willing to participate in a consumer test just for the enjoyment of the experience. However, willingness to take your consumer test will be affected by how much time the test takes-this is why the test is limited to one-sheet of paper. If testing in a retail environment or mall, you might consider using an incentive for participation. This could be a small cash payment or a gift certificate to be used in the store. On a warm day a cold drink might make a good incentive though you should only serve water before tasting is completed. A pencil or sticker might suffice as an incentive at a children’s event. Free product can often be a nice incentive for participation at some venues. Whatever the case, the incentive should always be given to the participant after they have completed the survey.
Consumer Testing Considerations 8
E. Participants must be Informed Your consumer testers (panelists) must be informed. All panelists must be able to find out about the ingredients in your product whether it is on information sheet you provide or on a sample package. It is especially critical to let consumers know when the product is spicy, hot, or may contain allergens. Tasters must be able to read a list of your ingredients for allergens that may affect them. You should take the same care that any food seller/manufacturer would. For example, food manufacturers warn consumers when their product was made in a facility that processes nuts, because it is a common allergen. In the same way many restaurants have a special red pepper icon for hot/spicy dishes. Be very careful to warn about spicy dishes, as some people have a much lower tolerance than others for hot/spicy foods.
F. Formal Consent Formal consent for testing may be required if a university extension program is involved in your consumer test. Universities are required to get consent when they collect data from individuals for research studies. This may or may not apply in your particular case, and the research use of such data will be based on the agreement you make with your testing partner. When needed the research leader will provide you with a document that explains what the consumers are consenting to for research purposes. Your taste testers are given the consent information sheet to look at before beginning the survey. This document is a generally a one-page sheet that is laminated for the food test. When used, the top of your ballot will begin with this statement and consent box:
In the settings planned for Market Readiness surveys no identifying personal information will be collected on the survey so a signed consent form will not be required.
G. Participant Screening When consumers are pre-recruited to come to a central location for testing, they must qualify through a pre-screening procedure before being invited to participate. But, when testing at some other off-site venue such as a farmers’ market or grocery store, it is not possible to pre-screen participants, so it must be done in real time. You may simply encourage those you would most like to take the test by providing information of interest to that group, and by deliberately inviting those that seem to be the best fit. Because it is important to recruit as many potential participants as possible, one must take care not to lose too many potential consumers by this screening activity.
Pre-screening at off-site venues can be done verbally. Understanding if the participant is available, able and willing is essential. Your test staff members should be prepared to provide consumers with information about what to expect, how long the test will last (generally given as a range of minutes), and about any compensation. You may provide this information in a sign,
SURVEY CONSENT: I have read the consent form and agree to take the survey. � (check box)
Consumer Testing Considerations 9
but your staff should be ready to respond to questions. Next, if circumstances permit you may want to ask a few key questions about the participant’s interest in the product category. Clearly, you don’t want this to discourage participants, but you may want to really encourage those that meet the criteria. If the product is ideal for children, seeking out parents with children in the appropriate age group is desirable. If your product has a target audience of those who do not consume gluten you will want to recruit members of that group, though not exclusively, and include questions on the ballot to identify them. This data can then be segmented to understand if target market users are rating the product differently from those who may be less likely to purchase the product.
H. Number of Consumers Though it is helpful to have large numbers3 of consumers test your product, users of the Market Readiness test are not major companies that can afford professional testing. You may only have a small sample of consumers and/or you may be limited to a single location for testing. Don’t despair, you can still learn a lot from a test of only 100 consumers in one location. One of our beta testers received valuable information with less than 80 consumers. If you are limited to one location and one day, collect all the surveys you can as 100 is a minimum target not a maximum. Some of our Market Readiness Beta testers have collected more than 200 samples in one day and tested two different varieties of their product on slightly different sample ballots.
I. Do you plan to test Multiple Flavors? When running a consumer test with more than one flavor, it is important to be certain the two products are easily perceived as different by the consumer. A reformulation or multiple prototypes might seem very different to you, but indistinguishable to the consumer. The Market Readiness test is not designed for examining whether consumers can perceive a difference between samples. If there is any question as to the perceived differences, acceptance testing should not be run. Consult with a professional sensory scientist for potential difference testing. However, if you have a product for which you want to test different flavors there are ways to adjust your ballot to test up to three flavors. Go to Appendix 1 - Multiple Flavors to learn how to test multiple flavors using MKTRD.
J. Sensory Focus on Ballot There are many sensory attributes that could be tested as part of the ballot. Because there will be limited time with each consumer, the producer must be thoughtful about which attributes are most important and will lead to the best insights. Some of the most common attributes include appearance (overall liking of appearance, color, size, shape, surface texture, clarity, carbonation), aroma (liking and intensity), overall liking of product, consistency and texture (overall liking of, hard vs. soft, smooth vs. rough, grainy vs. smooth, crunchy vs. soggy), flavor (liking and intensity), sweetness (liking and intensity), salt level (liking and intensity) or spice
3 When screening a new concept, a large company will probably test about 500 consumers in several regions this t
The Workbook 10
(liking and intensity, chemical feelings). Some things to consider when composing a sensory ballot questionnaire are to be very specific, brief, non-leading, and clear. Most of the questions have been designed for you. But open-ended questions that you design should be simple questions such as, “Please explain what you like and dislike about this product”. The ballot designed for MKRTD incorporates standard sensory questions. Use of the standard question style allows comparability to results from the broader food industry, and will make it easier for you to share the findings with others.
The sensory and the market questions will be discussed further in the Ballot Creation Instructions (Section V) and Evaluating Results (Section IV).
IV. The Workbook As discussed earlier many of the Market Research for Market Readiness tasks have been simplified by use of an Excel workbook. Before explaining the workbook, we want to present some terminology. When we discuss the survey we are referring to the time spent with consumers gathering information. The ballot, or questionnaire, is the document on which the test questions are asked and on which consumers (who will sometimes be referred to as panelists) record their responses. The workbook referred to is an Excel file with many worksheets (each worksheet can be found by clicking on its tab in the workbook). Two of the worksheets in the workbook create the ballot (Ballot Templates); there is a DATA worksheet that is used for entering the consumer responses and many other worksheets that set up the report and display the results of the survey in tables and figures.
Note that this manual is not intended to teach you how to work with an Excel workbook; the instructions assume that you have experience with computerized spreadsheet programs. You will need to know, or learn, how to move around in a workbook and worksheet, save and copy your workbook, enter information into a worksheet, and print material from a workbook. The manual and workbook contain information on how to change View and Print settings in the worksheets that may be needed. There are also instructions on how to print a PDF report from your workbook that will put all of the post-survey analysis into one document.
The workbook creates a questionnaire from information you enter into the two “Ballot Template page” worksheets, and this information is also utilized to set up a fully labeled worksheet in which to enter the “DATA”. Once the survey data is entered, tables and figures that display the survey results are created automatically. You will simply need to print out the report which will contain figures and tables for each individual question asked, as well as several figures that compare whether consumers from certain demographics (age, gender) or preferences (organic, gluten-free) differ in their willingness to buy your product.
The following sections of the manual go through each of these steps: ballot creation, data entry, and interpretation of results.
Ballot Creation Instructions, Ballot Template Page (1), Survey Consent 11
V. Ballot Creation Instructions A. Overview An automated process for creating the ballot has been created in the Excel workbook. There are two worksheets for ballot creation, one for each page of the ballot. You will need to fill in the red outlined cells on the left side of the worksheets labeled “Ballot Template page (1)” and “Ballot Template page (2)” then, based on what you entered in those red-outlined cells, the first and second page of the ballot will be created. You must fill in cells with solid red lines, but cells with dashed red-lines are optional. Hints in these two spreadsheet pages are in italic font. Additional hints will appear if you hover your cursor over the cell it is providing advice about.
The ballot has been designed to fit on two sides of an 8.5x11” sheet of paper. The ballot was designed based upon our experiences with consumers in the types of settings you are most likely to use for your survey. A longer ballot could discourage participants who think it will take too long.
Most of the questions are pretty easy to understand and alter, but you need to consider what information you need from the panelists, we will introduce this as we go through the possibilities. The first page of the ballot includes: one Purchase-Intent-Concept question, three Liking rating questions, four or five Just-about-Right (JAR) questions, and one Open-Ended question. The back page of the ballot includes: one Purchase-Intent-Price series (P-I-P) question, one How-Many question, two Check-All-That-Apply (C-A) questions, and four multiple-choice (M-C,choose only one answer) questions.
Several of the questions on the ballot can be replaced as long as you maintain their open-ended, check-all-that-apply, or multiple-choice formats. These will be explained on the following pages as each question type is discussed. Most of the questions are based on classic consumer testing, which allows your results to be compared to results from other tests. Comparability could be important if you are going to present the results to buyers, investors, lenders, or others that may help you in your business.
In the following pages each part of the survey ballot is discussed in the order that they will appear in the ballot.
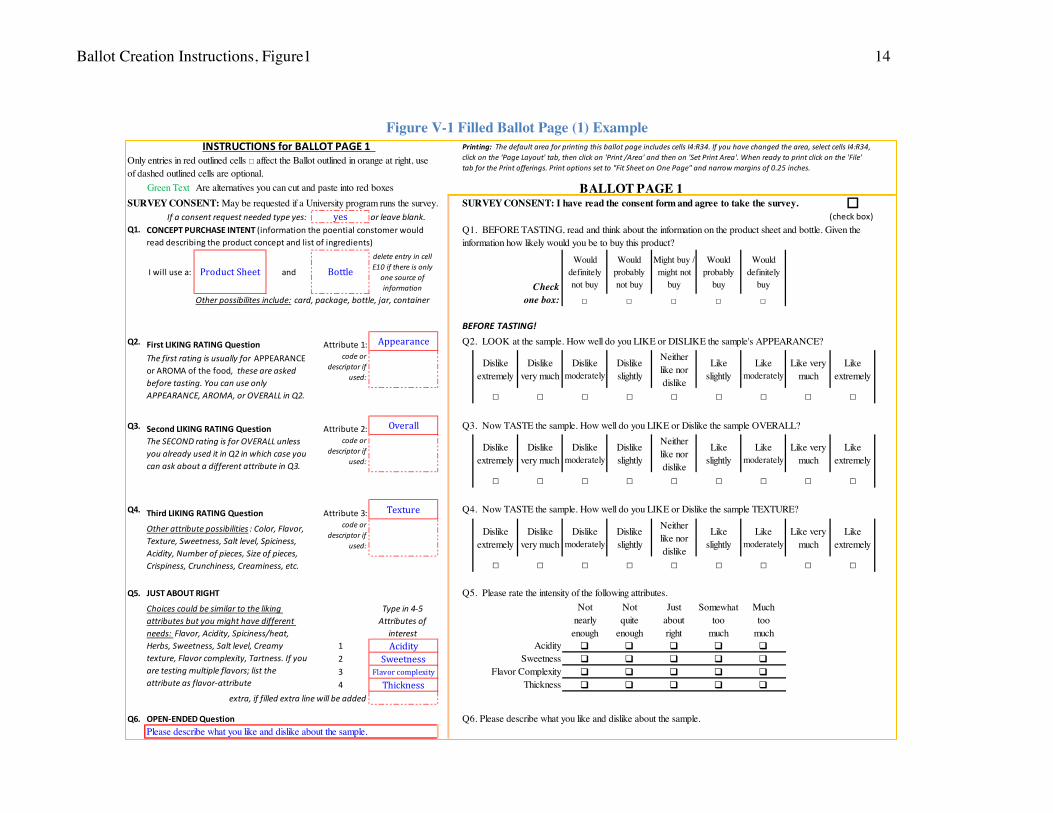
B. Ballot Template Page (1) This section explains how to create the first page of your ballot in the Excel workbook from top to bottom. The worksheet is shown in Figure V-1.
i. Survey Consent Consent may be requested if a University program assists with the survey or its analysis. If running the test independently, you will not include a survey consent. Type a yes into the cell only if needed, leave blank if not. If there is not a yes in the cell, the Survey Consent line will
disappear from the ballot. If a consent request needed type yes: yes
Ballot Creation Instructions, Ballot Template Page (1), Concept Question 12
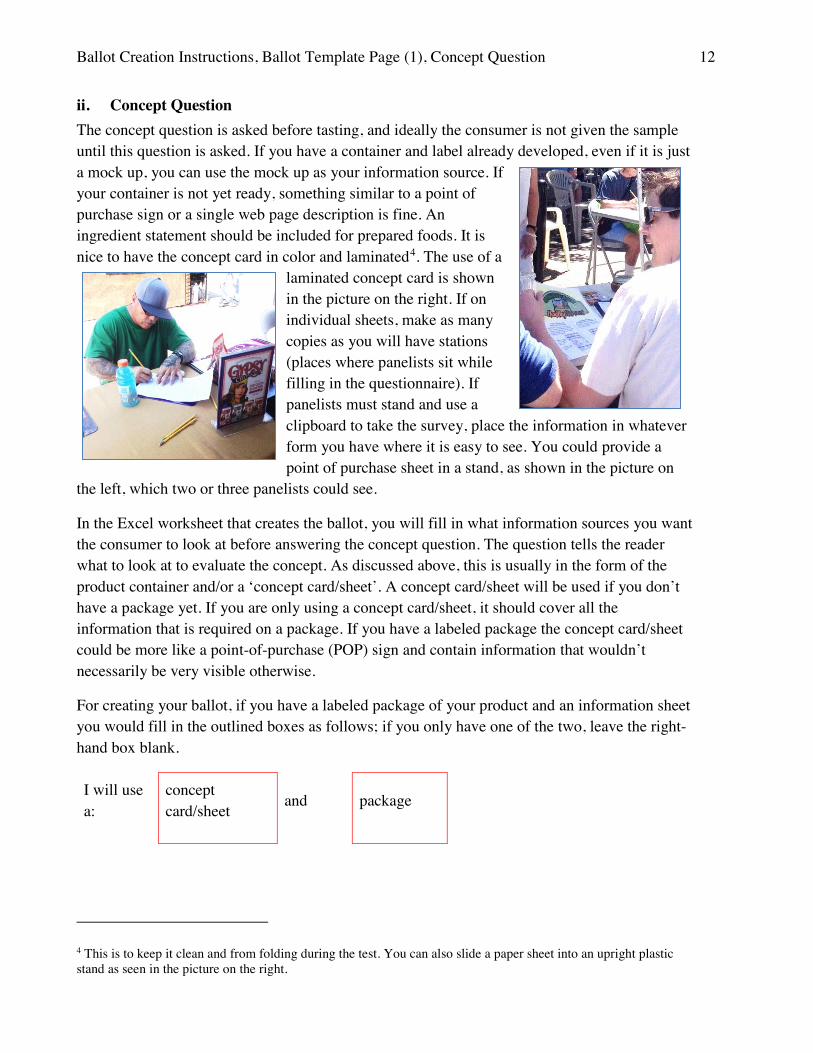
ii. Concept Question The concept question is asked before tasting, and ideally the consumer is not given the sample until this question is asked. If you have a container and label already developed, even if it is just a mock up, you can use the mock up as your information source. If your container is not yet ready, something similar to a point of purchase sign or a single web page description is fine. An ingredient statement should be included for prepared foods. It is nice to have the concept card in color and laminated4. The use of a
laminated concept card is shown in the picture on the right. If on individual sheets, make as many copies as you will have stations (places where panelists sit while filling in the questionnaire). If panelists must stand and use a clipboard to take the survey, place the information in whatever form you have where it is easy to see. You could provide a point of purchase sheet in a stand, as shown in the picture on
the left, which two or three panelists could see.
In the Excel worksheet that creates the ballot, you will fill in what information sources you want the consumer to look at before answering the concept question. The question tells the reader what to look at to evaluate the concept. As discussed above, this is usually in the form of the product container and/or a ‘concept card/sheet’. A concept card/sheet will be used if you don’t have a package yet. If you are only using a concept card/sheet, it should cover all the information that is required on a package. If you have a labeled package the concept card/sheet could be more like a point-of-purchase (POP) sign and contain information that wouldn’t necessarily be very visible otherwise.
For creating your ballot, if you have a labeled package of your product and an information sheet you would fill in the outlined boxes as follows; if you only have one of the two, leave the right-hand box blank.
I will use a:
concept card/sheet and package
4 This is to keep it clean and from folding during the test. You can also slide a paper sheet into an upright plastic stand as seen in the picture on the right.
Ballot Creation Instructions, Ballot Template Page (1), Three Liking Rating Questions 13
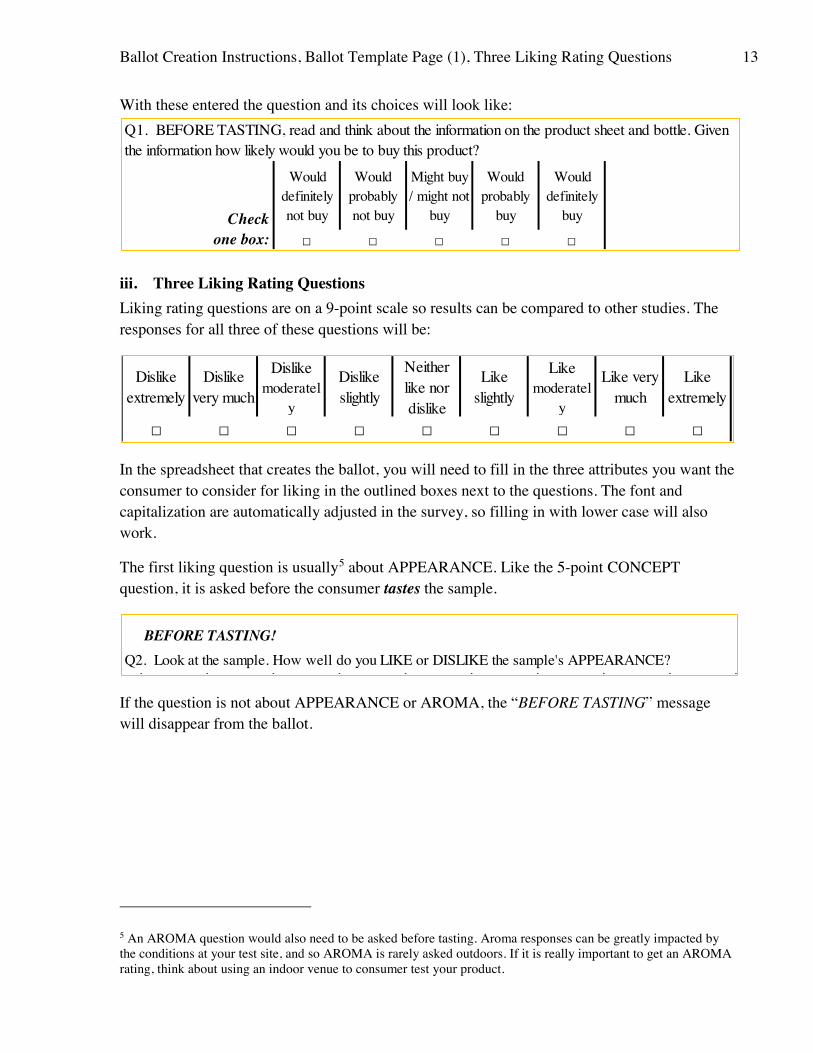
With these entered the question and its choices will look like:
iii. Three Liking Rating Questions Liking rating questions are on a 9-point scale so results can be compared to other studies. The responses for all three of these questions will be:
In the spreadsheet that creates the ballot, you will need to fill in the three attributes you want the consumer to consider for liking in the outlined boxes next to the questions. The font and capitalization are automatically adjusted in the survey, so filling in with lower case will also work.
The first liking question is usually5 about APPEARANCE. Like the 5-point CONCEPT question, it is asked before the consumer tastes the sample.
If the question is not about APPEARANCE or AROMA, the “BEFORE TASTING” message will disappear from the ballot.
5 An AROMA question would also need to be asked before tasting. Aroma responses can be greatly impacted by the conditions at your test site, and so AROMA is rarely asked outdoors. If it is really important to get an AROMA rating, think about using an indoor venue to consumer test your product.
Would definitely not buy
Would probably not buy
Might buy / might not
buy
Would probably
buy
Would definitely
buy
□ □ □ □ □
Q1. BEFORE TASTING, read and think about the information on the product sheet and bottle. Given the information how likely would you be to buy this product?
Check one box:
Dislike extremely
Dislike very much
Dislike moderatel
y
Dislike slightly
Neither like nor dislike
Like slightly
Like moderatel
y
Like very much
Like extremely
□ □ □ □ □ □ □ □ □
BEFORE TASTING!Q2. Look at the sample. How well do you LIKE or DISLIKE the sample's APPEARANCE?
Ballot Creation Instructions, Figure1 14
Figure V-1 Filled Ballot Page (1) Example INSTRUCTIONS for BALLOT PAGE 1
Green Text Are alternatives you can cut and paste into red boxes BALLOT PAGE 1SURVEY CONSENT: May be requested if a University program runs the survey. SURVEY CONSENT: I have read the consent form and agree to take the survey. �
If a consent request needed type yes: yes or leave blank. Q1.
I will use a: Product Sheet and Bottle
delete entry in cell E10 if there is only
one source of information
Would definitely not buy
Would probably not buy
Might buy / might not
buy
Would probably
buy
Would definitely
buyOther possibilites include: card, package, bottle, jar, container □ □ □ □ □
BEFORE TASTING!
Q2. First LIKING RATING Question Attribute 1:Appearance
code or descriptor if
used:
Dislike extremely
Dislike very much
Dislike moderately
Dislike slightly
Neither like nor dislike
Like slightly
Like moderately
Like very much
Like extremely
□ □ □ □ □ □ □ □ □
Q3. Second LIKING RATING Question Attribute 2:Overall
code or descriptor if
used:
Dislike extremely
Dislike very much
Dislike moderately
Dislike slightly
Neither like nor dislike
Like slightly
Like moderately
Like very much
Like extremely
□ □ □ □ □ □ □ □ □
Q4. Third LIKING RATING Question Attribute 3:Texture
code or descriptor if
used:
Dislike extremely
Dislike very much
Dislike moderately
Dislike slightly
Neither like nor dislike
Like slightly
Like moderately
Like very much
Like extremely
□ □ □ □ □ □ □ □ □
Q5. JUST ABOUT RIGHT Q5. Please rate the intensity of the following attributes.Type in 4-5
Attributes of interest
Not nearly
enough
Not quite
enough
Just about right
Somewhat too
much
Much too
much1 Acidity � � � � �2 Sweetness � � � � �3 Flavor complexity � � � � �4 Thickness � � � � �
extra, if filled extra line will be added
Q6. OPEN-ENDED Question Q6. Please describe what you like and dislike about the sample.Please describe what you like and dislike about the sample.
(check box)
Q1. BEFORE TASTING, read and think about the information on the product sheet and bottle. Given the information how likely would you be to buy this product?
The first rating is usually for APPEARANCE
or AROMA of the food, these are asked before tasting. You can use only APPEARANCE, AROMA, or OVERALL in Q2.
Choices could be similar to the liking attributes but you might have different needs: Flavor, Acidity, Spiciness/heat, Herbs, Sweetness, Salt level, Creamy texture, Flavor complexity, Tartness. If you are testing multiple flavors; list the attribute as flavor-attribute
Check one box:
CONCEPT PURCHASE INTENT (information the poential constomer would
read describing the product concept and list of ingredients)
AciditySweetness
Flavor ComplexityThickness
Other attribute possibilities : Color, Flavor, Texture, Sweetness, Salt level, Spiciness, Acidity, Number of pieces, Size of pieces, Crispiness, Crunchiness, Creaminess, etc.
Only entries in red outlined cells □ affect the Ballot outlined in orange at right, use of dashed outlined cells are optional.
The SECOND rating is for OVERALL unless you already used it in Q2 in which case you can ask about a different attribute in Q3.
Q3. Now TASTE the sample. How well do you LIKE or Dislike the sample OVERALL?
Q2. LOOK at the sample. How well do you LIKE or DISLIKE the sample's APPEARANCE?
Q4. Now TASTE the sample. How well do you LIKE or Dislike the sample TEXTURE?
Printing: The default area for printing this ballot page includes cells I4:R34. If you have changed the area, select cells I4:R34, click on the 'Page Layout' tab, then click on 'Print /Area' and then on 'Set Print Area'. When ready to print click on the 'File' tab for the Print offerings. Print options set to "Fit Sheet on One Page" and narrow margins of 0.25 inches.
Ballot Creation Instructions, Ballot Template Page (1) 15
Attribute 3: TEXTURE
Attribute 1:Appearance
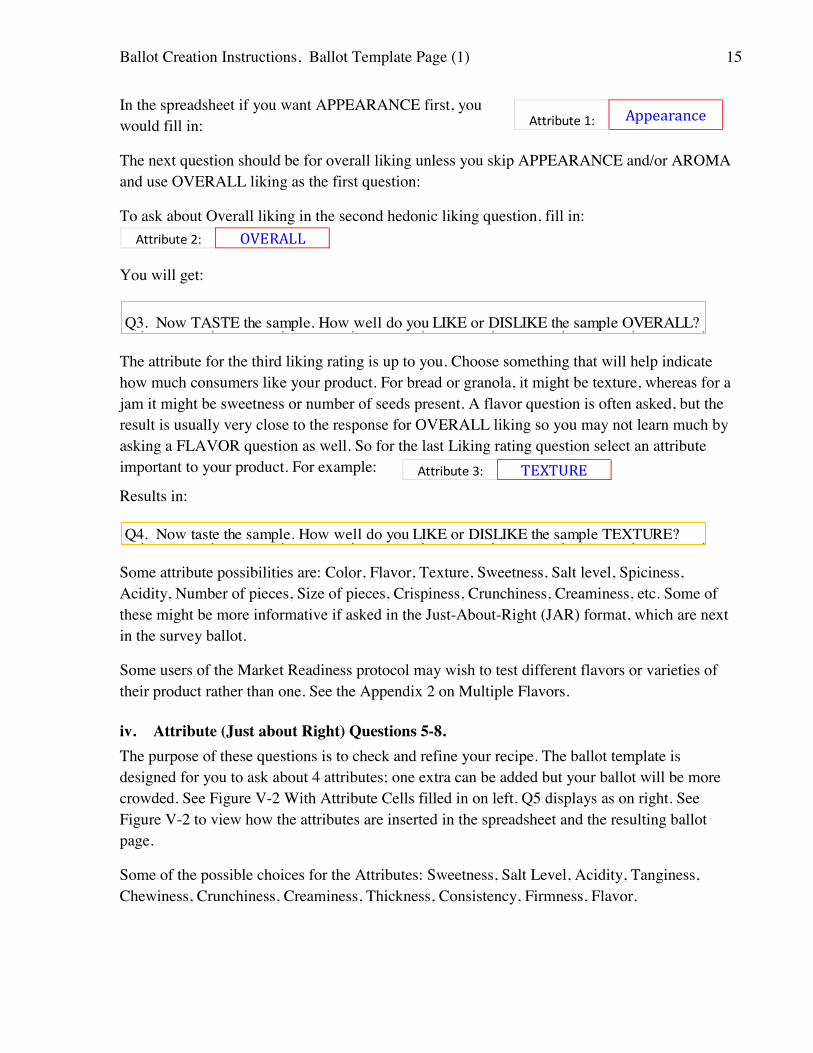
In the spreadsheet if you want APPEARANCE first, you would fill in:
The next question should be for overall liking unless you skip APPEARANCE and/or AROMA and use OVERALL liking as the first question:
To ask about Overall liking in the second hedonic liking question, fill in:
You will get:
The attribute for the third liking rating is up to you. Choose something that will help indicate how much consumers like your product. For bread or granola, it might be texture, whereas for a jam it might be sweetness or number of seeds present. A flavor question is often asked, but the result is usually very close to the response for OVERALL liking so you may not learn much by asking a FLAVOR question as well. So for the last Liking rating question select an attribute important to your product. For example:
Results in:
Some attribute possibilities are: Color, Flavor, Texture, Sweetness, Salt level, Spiciness, Acidity, Number of pieces, Size of pieces, Crispiness, Crunchiness, Creaminess, etc. Some of these might be more informative if asked in the Just-About-Right (JAR) format, which are next in the survey ballot.
Some users of the Market Readiness protocol may wish to test different flavors or varieties of their product rather than one. See the Appendix 2 on Multiple Flavors.
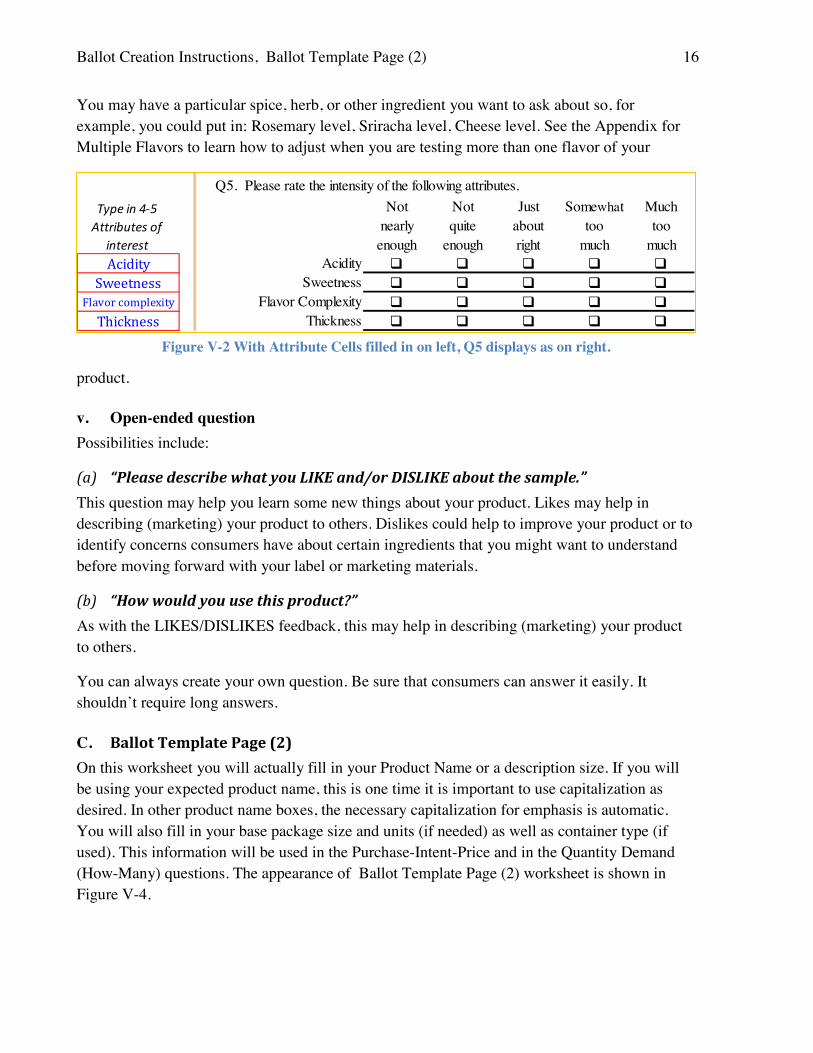
iv. Attribute (Just about Right) Questions 5-8. The purpose of these questions is to check and refine your recipe. The ballot template is designed for you to ask about 4 attributes; one extra can be added but your ballot will be more crowded. See Figure V-2 With Attribute Cells filled in on left, Q5 displays as on right. See Figure V-2 to view how the attributes are inserted in the spreadsheet and the resulting ballot page.
Some of the possible choices for the Attributes: Sweetness, Salt Level, Acidity, Tanginess, Chewiness, Crunchiness, Creaminess, Thickness, Consistency, Firmness, Flavor.
Attribute 2: OVERALL
Q3. Now TASTE the sample. How well do you LIKE or DISLIKE the sample OVERALL?
Q4. Now taste the sample. How well do you LIKE or DISLIKE the sample TEXTURE?
Ballot Creation Instructions, Ballot Template Page (2) 16
You may have a particular spice, herb, or other ingredient you want to ask about so, for example, you could put in: Rosemary level, Sriracha level, Cheese level. See the Appendix for Multiple Flavors to learn how to adjust when you are testing more than one flavor of your
product.
v. Open-ended question Possibilities include:
(a) “Please describe what you LIKE and/or DISLIKE about the sample.” This question may help you learn some new things about your product. Likes may help in describing (marketing) your product to others. Dislikes could help to improve your product or to identify concerns consumers have about certain ingredients that you might want to understand before moving forward with your label or marketing materials.
(b) “How would you use this product?” As with the LIKES/DISLIKES feedback, this may help in describing (marketing) your product to others.
You can always create your own question. Be sure that consumers can answer it easily. It shouldn’t require long answers.
C. Ballot Template Page (2) On this worksheet you will actually fill in your Product Name or a description size. If you will be using your expected product name, this is one time it is important to use capitalization as desired. In other product name boxes, the necessary capitalization for emphasis is automatic. You will also fill in your base package size and units (if needed) as well as container type (if used). This information will be used in the Purchase-Intent-Price and in the Quantity Demand (How-Many) questions. The appearance of Ballot Template Page (2) worksheet is shown in Figure V-4.
Q5. Please rate the intensity of the following attributes.Type in 4-5
Attributes of interest
Not nearly enough
Not quite
enough
Just about right
Somewhat too
much
Much too
muchAcidity � � � � �
Sweetness � � � � �Flavor complexity � � � � �
Thickness � � � � �
SweetnessFlavor Complexity
Thickness
Acidity
Figure V-2 With Attribute Cells filled in on left, Q5 displays as on right.
Ballot Creation Instructions, Ballot Template Page (2) 17
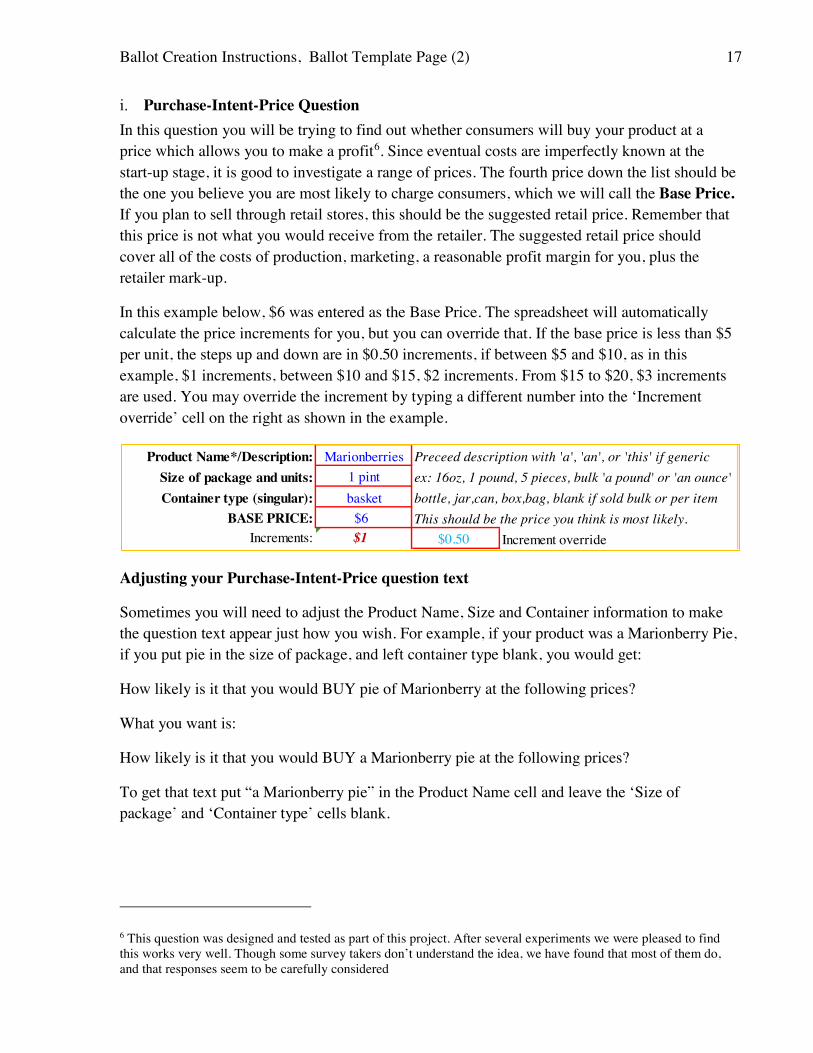
Purchase-Intent-Price Question In this question you will be trying to find out whether consumers will buy your product at a price which allows you to make a profit6. Since eventual costs are imperfectly known at the start-up stage, it is good to investigate a range of prices. The fourth price down the list should be the one you believe you are most likely to charge consumers, which we will call the Base Price. If you plan to sell through retail stores, this should be the suggested retail price. Remember that this price is not what you would receive from the retailer. The suggested retail price should cover all of the costs of production, marketing, a reasonable profit margin for you, plus the retailer mark-up.
In this example below, $6 was entered as the Base Price. The spreadsheet will automatically calculate the price increments for you, but you can override that. If the base price is less than $5 per unit, the steps up and down are in $0.50 increments, if between $5 and $10, as in this example, $1 increments, between $10 and $15, $2 increments. From $15 to $20, $3 increments are used. You may override the increment by typing a different number into the ‘Increment override’ cell on the right as shown in the example.
Adjusting your Purchase-Intent-Price question text
Sometimes you will need to adjust the Product Name, Size and Container information to make the question text appear just how you wish. For example, if your product was a Marionberry Pie, if you put pie in the size of package, and left container type blank, you would get:
How likely is it that you would BUY pie of Marionberry at the following prices?
What you want is:
How likely is it that you would BUY a Marionberry pie at the following prices?
To get that text put “a Marionberry pie” in the Product Name cell and leave the ‘Size of package’ and ‘Container type’ cells blank.
6 This question was designed and tested as part of this project. After several experiments we were pleased to find this works very well. Though some survey takers don’t understand the idea, we have found that most of them do, and that responses seem to be carefully considered
Product Name*/Description: Marionberries Preceed description with 'a', 'an', or 'this' if generic Size of package and units: 1 pint ex: 16oz, 1 pound, 5 pieces, bulk 'a pound' or 'an ounce'Container type (singular): basket bottle, jar,can, box,bag, blank if sold bulk or per item
BASE PRICE: $6 This should be the price you think is most likely. Increments: $1 $0.50 Increment override
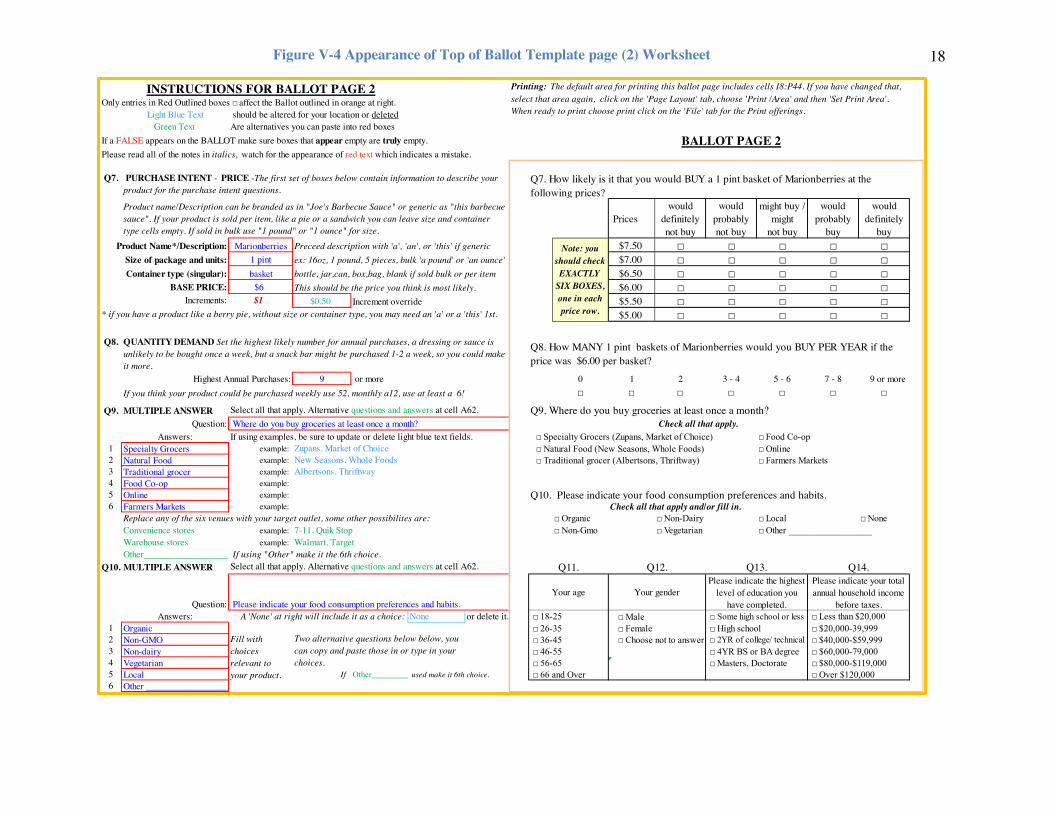
Ballot Creation Instructions, Ballot Template Page (2) 18
INSTRUCTIONS FOR BALLOT PAGE 2Only entries in Red Outlined boxes □ affect the Ballot outlined in orange at right.
Light Blue Text should be altered for your location or deletedGreen Text Are alternatives you can paste into red boxes
If a FALSE appears on the BALLOT make sure boxes that appear empty are truly empty. BALLOT PAGE 2Please read all of the notes in italics, watch for the appearance of red text which indicates a mistake.
Q7.
Priceswould
definitely not buy
would probably not buy
might buy / might
not buy
would probably
buy
would definitely
buyProduct Name*/Description: Marionberries Preceed description with 'a', 'an', or 'this' if generic 3 $7.50 □ □ □ □ □
Size of package and units: 1 pint ex: 16oz, 1 pound, 5 pieces, bulk 'a pound' or 'an ounce' 2 $7.00 □ □ □ □ □Container type (singular): basket bottle, jar,can, box,bag, blank if sold bulk or per item 1 $6.50 □ □ □ □ □
BASE PRICE: $6 This should be the price you think is most likely. 0 $6.00 □ □ □ □ □ Increments: $1 $0.50 Increment override -1 $5.50 □ □ □ □ □
-2 $5.00 □ □ □ □ □
Q8.
Highest Annual Purchases: 9 or more 0 1 2 3 - 4 5 - 6 7 - 8 9 or more If you think your product could be purchased weekly use 52, monthly a12, use at least a 6! □ □ □ □ □ □ □
Q9. MULTIPLE ANSWER Select all that apply. Alternative questions and answers at cell A62. Q9. Where do you buy groceries at least once a month?Question: Check all that apply.
Answers: If using examples, be sure to update or delete light blue text fields. □ Specialty Grocers (Zupans, Market of Choice) □ Food Co-op1 Specialty Grocers example: □ Natural Food (New Seasons, Whole Foods) □ Online2 Natural Food example: □ Traditional grocer (Albertsons, Thriftway) □ Farmers Markets3 Traditional grocer example: 4 Food Co-op example: 5 Online example: Q10. Please indicate your food consumption preferences and habits. 6 Farmers Markets example: Check all that apply and/or fill in.
Replace any of the six venues with your target outlet, some other possibilites are: □ Organic □ Non-Dairy □ Local □ NoneConvenience stores example: 7-11, Quik Stop □ Non-Gmo □ Vegetarian □ Other __________________Warehouse stores example: Walmart, TargetOther___________________ If using "Other" make it the 6th choice.
Q10. MULTIPLE ANSWER Select all that apply. Alternative questions and answers at cell A62.
Question:Answers: A 'None' at right will include it as a choice: None or delete it.
1 Organic2 Non-GMO3 Non-dairy4 Vegetarian5 Local If Other_________ used make it 6th choice.6 Other __________________
□ $60,000-79,000
Q7. How likely is it that you would BUY a 1 pint basket of Marionberries at the following prices?
Q8. How MANY 1 pint baskets of Marionberries would you BUY PER YEAR if the price was $6.00 per basket?
□ $80,000-$119,000 □ Over $120,000
□ 18-25
Zupans, Market of ChoiceNew Seasons, Whole FoodsAlbertsons, Thriftway
* if you have a product like a berry pie, without size or container type, you may need an 'a' or a 'this' 1st.
Printing: The default area for printing this ballot page includes cells I8:P44. If you have changed that, select that area again, click on the 'Page Layout' tab, choose 'Print /Area' and then 'Set Print Area'. When ready to print choose print click on the 'File' tab for the Print offerings.
Q14.
□ $20,000-39,999
Please indicate your total annual household income
before taxes. □ Less than $20,000
□ $40,000-$59,999
Q11.
Your age
□ Female
Q13.
□ Choose not to answer
Please indicate the highest level of education you
have completed. □ Some high school or less □ High school □ 2YR of college/ technical □ 4YR BS or BA degree □ Masters, Doctorate
□ Male
Your gender
Q12.
Please indicate your food consumption preferences and habits.
Fill with choices relevant to your product.
Two alternative questions below below, you can copy and paste those in or type in your choices.
PURCHASE INTENT - PRICE -The first set of boxes below contain information to describe your product for the purchase intent questions.
Where do you buy groceries at least once a month?
Product name/Description can be branded as in "Joe's Barbecue Sauce" or generic as "this barbecue sauce". If your product is sold per item, like a pie or a sandwich you can leave size and container type cells empty. If sold in bulk use "1 pound" or "1 ounce" for size.
QUANTITY DEMAND Set the highest likely number for annual purchases, a dressing or sauce is unlikely to be bought once a week, but a snack bar might be purchased 1-2 a week, so you could make it more.
Note: you should check EXACTLY
SIX BOXES, one in each price row.
□ 26-35 □ 36-45 □ 46-55 □ 56-65 □ 66 and Over
Figure V-4 Appearance of Top of Ballot Template page (2) Worksheet
Ballot Creation Instructions, Ballot Template Page (2) 19
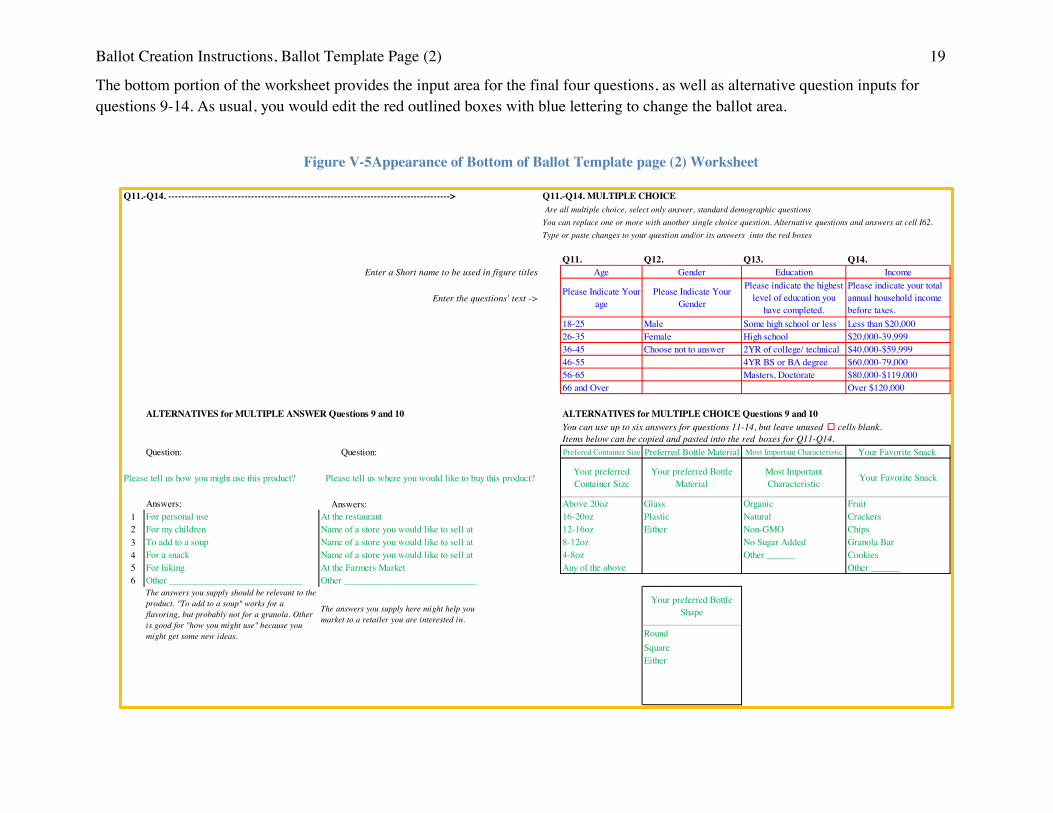
The bottom portion of the worksheet provides the input area for the final four questions, as well as alternative question inputs for questions 9-14. As usual, you would edit the red outlined boxes with blue lettering to change the ballot area.
Q11.-Q14. -------------------------------------------------------------------------------------> Q11.-Q14. MULTIPLE CHOICE Are all multiple choice, select only answer, standard demographic questionsYou can replace one or more with another single choice question. Alternative questions and answers at cell I62.Type or paste changes to your question and/or its answers into the red boxes
Q11. Q12. Q13. Q14.Enter a Short name to be used in figure titles
Enter the questions' text ->
ALTERNATIVES for MULTIPLE ANSWER Questions 9 and 10 ALTERNATIVES for MULTIPLE CHOICE Questions 9 and 10You can use up to six answers for questions 11-14, but leave unused � cells blank.Items below can be copied and pasted into the red boxes for Q11-Q14.
Question: Question:
Please tell us how you might use this product? Please tell us where you would like to buy this product?
Answers: Answers:1 For personal use At the restaurant2 For my children Name of a store you would like to sell at 3 To add to a soup Name of a store you would like to sell at 4 For a snack Name of a store you would like to sell at 5 For hiking At the Farmers Market6 Other ____________________________ Other ____________________________
Choose not to answer
Your preferred Bottle Shape
RoundSquareEither
Your preferred Bottle Material
GlassPlasticEither
Please Indicate Your Gender
MaleFemale
Your preferred Container Size
Above 20oz16-20oz12-16oz8-12oz4-8ozAny of the above
Please indicate the highest level of education you
have completed.Some high school or lessHigh school
$80,000-$119,000Over $120,00066 and Over
56-6546-5536-4526-3518-25
Please Indicate Your age
Please indicate your total annual household income before taxes.Less than $20,000$20,000-39,999$40,000-$59,999$60,000-79,000
2YR of college/ technical4YR BS or BA degreeMasters, Doctorate
The answers you supply should be relevant to the product. "To add to a soup" works for a flavoring, but probably not for a granola. Other is good for "how you might use" because you might get some new ideas.
The answers you supply here might help you market to a retailer you are interested in.
Age Gender Education Income
Prefered Container Size Preferred Bottle Material Most Important Characteristic Your Favorite Snack
ChipsGranola BarCookiesOther ______
OrganicNaturalNon-GMONo Sugar AddedOther ______
Your Favorite Snack
FruitCrackers
Most Important Characteristic
Figure V-5Appearance of Bottom of Ballot Template page (2) Worksheet
Ballot Creation Instructions 20
Demonstration Container or Portion
For both the Purchase-Intent-Price and the following Quantity Demand/How-Many question, if you don’t have a package to show the participants during your test, it is a good idea to have an example container or portion size example to demonstrate the portion size you are referring to in the two questions.
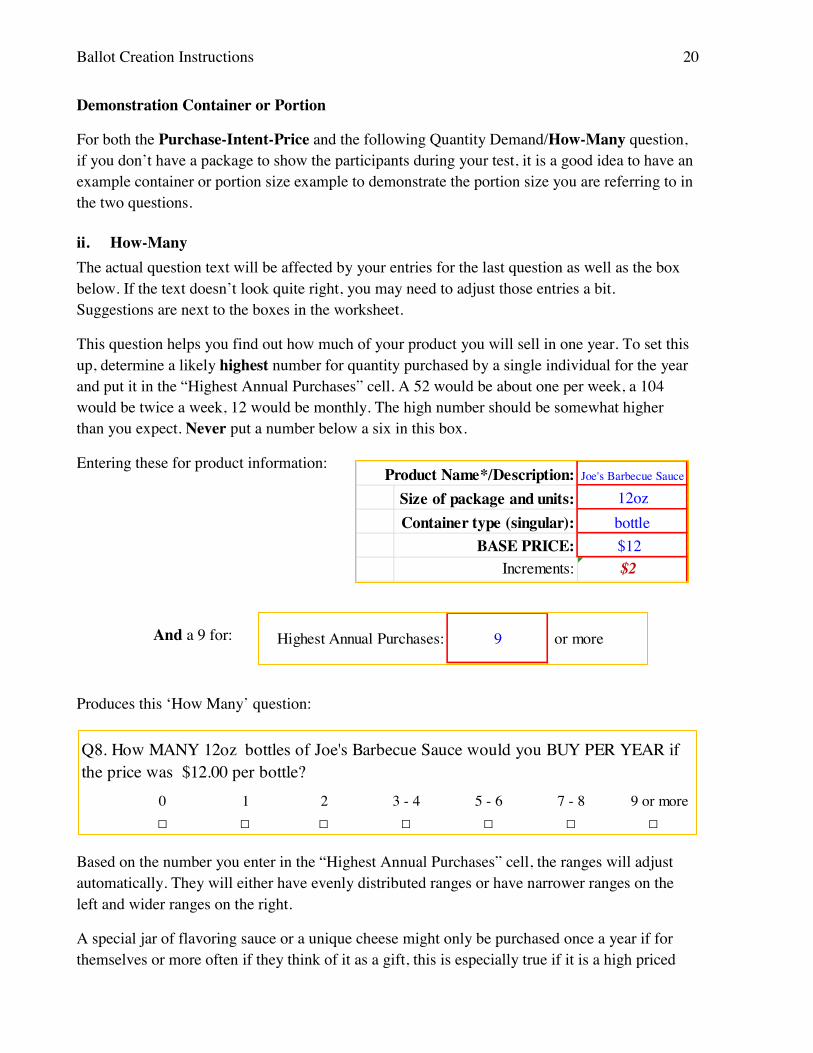
ii. How-Many The actual question text will be affected by your entries for the last question as well as the box below. If the text doesn’t look quite right, you may need to adjust those entries a bit. Suggestions are next to the boxes in the worksheet.
This question helps you find out how much of your product you will sell in one year. To set this up, determine a likely highest number for quantity purchased by a single individual for the year and put it in the “Highest Annual Purchases” cell. A 52 would be about one per week, a 104 would be twice a week, 12 would be monthly. The high number should be somewhat higher than you expect. Never put a number below a six in this box.
Entering these for product information:
And a 9 for:
Produces this ‘How Many’ question:
Based on the number you enter in the “Highest Annual Purchases” cell, the ranges will adjust automatically. They will either have evenly distributed ranges or have narrower ranges on the left and wider ranges on the right.
A special jar of flavoring sauce or a unique cheese might only be purchased once a year if for themselves or more often if they think of it as a gift, this is especially true if it is a high priced
0 1 2 3 - 4 5 - 6 7 - 8 9 or more □ □ □ □ □ □ □
Q8. How MANY 12oz bottles of Joe's Barbecue Sauce would you BUY PER YEAR if the price was $12.00 per bottle?
Product Name*/Description: Joe's Barbecue Sauce
Size of package and units: 12ozContainer type (singular): bottle
BASE PRICE: $12 Increments: $2
Highest Annual Purchases: 9 or more
Ballot Creation Instructions 21
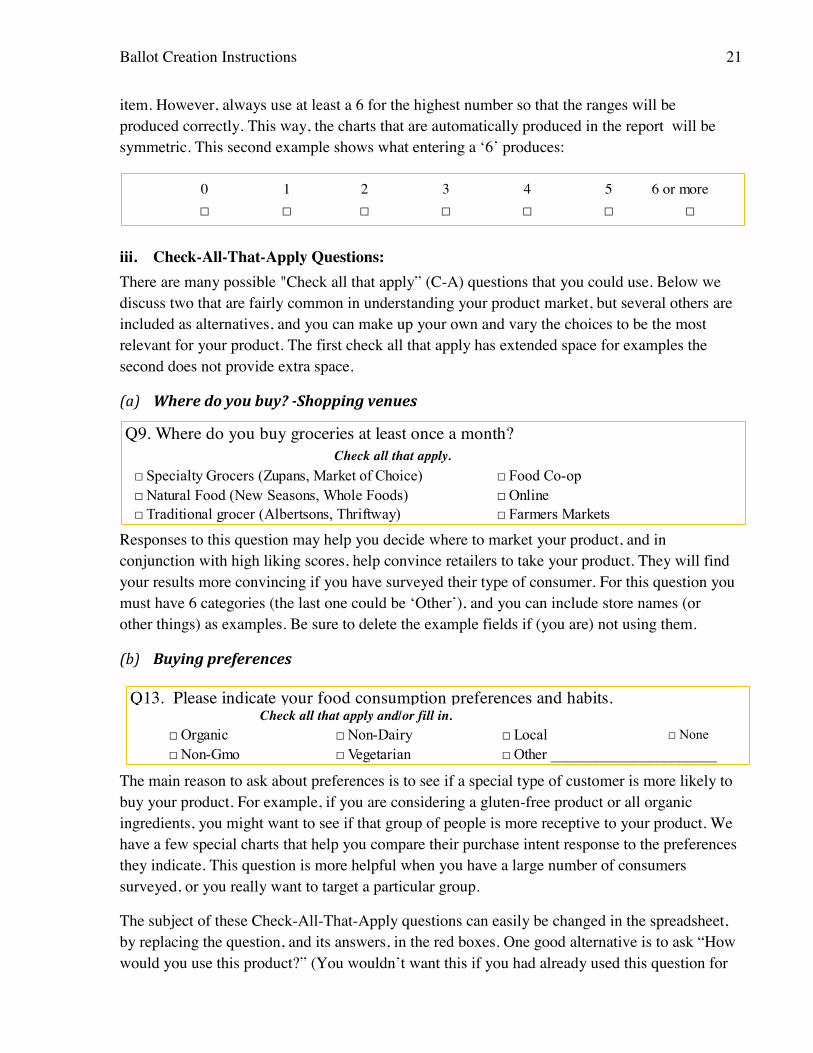
item. However, always use at least a 6 for the highest number so that the ranges will be produced correctly. This way, the charts that are automatically produced in the report will be symmetric. This second example shows what entering a ‘6’ produces:
iii. Check-All-That-Apply Questions: There are many possible "Check all that apply” (C-A) questions that you could use. Below we discuss two that are fairly common in understanding your product market, but several others are included as alternatives, and you can make up your own and vary the choices to be the most relevant for your product. The first check all that apply has extended space for examples the second does not provide extra space.
(a) Where do you buy? -Shopping venues
Responses to this question may help you decide where to market your product, and in conjunction with high liking scores, help convince retailers to take your product. They will find your results more convincing if you have surveyed their type of consumer. For this question you must have 6 categories (the last one could be ‘Other’), and you can include store names (or other things) as examples. Be sure to delete the example fields if (you are) not using them.
(b) Buying preferences
The main reason to ask about preferences is to see if a special type of customer is more likely to buy your product. For example, if you are considering a gluten-free product or all organic ingredients, you might want to see if that group of people is more receptive to your product. We have a few special charts that help you compare their purchase intent response to the preferences they indicate. This question is more helpful when you have a large number of consumers surveyed, or you really want to target a particular group.
The subject of these Check-All-That-Apply questions can easily be changed in the spreadsheet, by replacing the question, and its answers, in the red boxes. One good alternative is to ask “How would you use this product?” (You wouldn’t want this if you had already used this question for
0 1 2 3 4 5 6 or more □ □ □ □ □ □ □
Q9. Where do you buy groceries at least once a month? Check all that apply.
□ Specialty Grocers (Zupans, Market of Choice) □ Food Co-op□ Natural Food (New Seasons, Whole Foods) □ Online□ Traditional grocer (Albertsons, Thriftway) □ Farmers Markets
Q13. Please indicate your food consumption preferences and habits. Check all that apply and/or fill in.
□ Organic □ Non-Dairy □ Local □ None□ Non-Gmo □ Vegetarian □ Other ______________________
Ballot Creation Instructions 22
the open-ended question on the front page of the ballot). Substitute answer suggestions could be “For Parties”, “For personal use”, “For my children”, or how they would use it “on ice cream”, “as a meat sauce”, “As a gift”, “For a snack”, “For hiking”. Choose possibilities you think are relevant, but be sure to include an ‘Other _______” choice with that particular question. The answers may improve your product description for marketing. Another question alternative is “Please tell us where you would like to buy this product”. Substitute answers include the names of stores you would like to sell at, including perhaps the Farmers Market, specialty stores, etc. Also be sure to include an ‘Other _______” choice with this question. You might learn something useful.
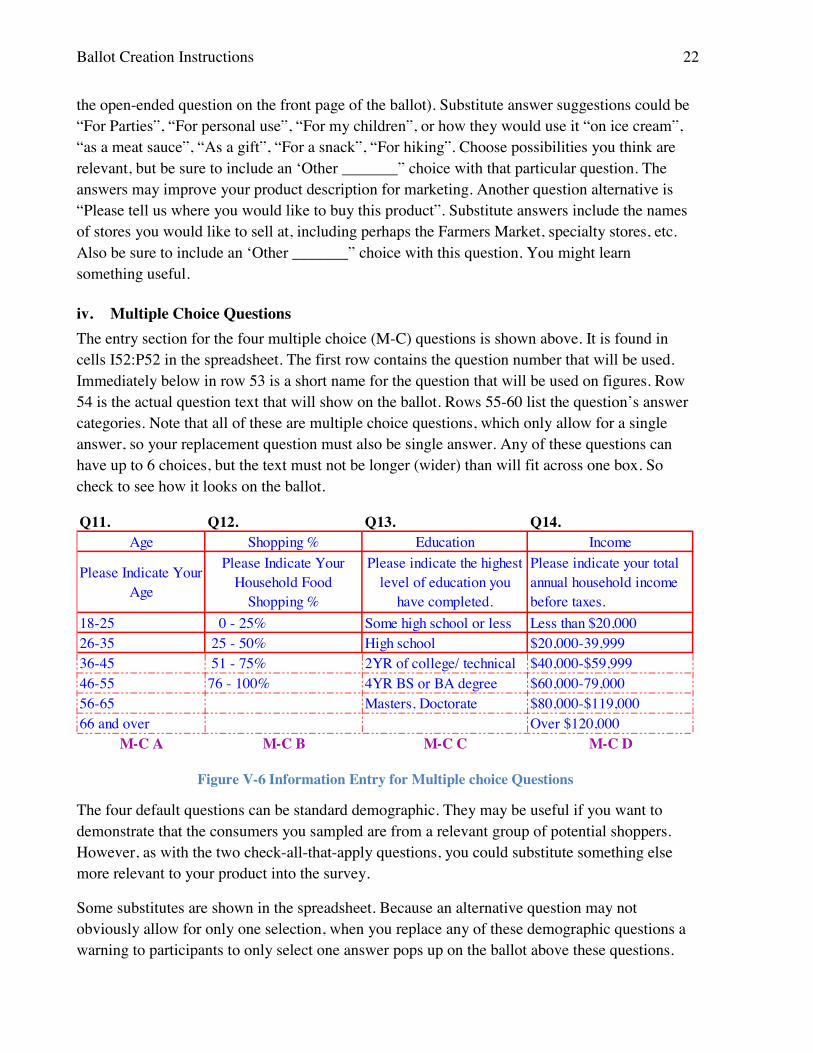
iv. Multiple Choice Questions The entry section for the four multiple choice (M-C) questions is shown above. It is found in cells I52:P52 in the spreadsheet. The first row contains the question number that will be used. Immediately below in row 53 is a short name for the question that will be used on figures. Row 54 is the actual question text that will show on the ballot. Rows 55-60 list the question’s answer categories. Note that all of these are multiple choice questions, which only allow for a single answer, so your replacement question must also be single answer. Any of these questions can have up to 6 choices, but the text must not be longer (wider) than will fit across one box. So check to see how it looks on the ballot.
Figure V-6 Information Entry for Multiple choice Questions
The four default questions can be standard demographic. They may be useful if you want to demonstrate that the consumers you sampled are from a relevant group of potential shoppers. However, as with the two check-all-that-apply questions, you could substitute something else more relevant to your product into the survey.
Some substitutes are shown in the spreadsheet. Because an alternative question may not obviously allow for only one selection, when you replace any of these demographic questions a warning to participants to only select one answer pops up on the ballot above these questions.
Q11. Q12. Q13. Q14.
51 - 75% 2YR of college/ technical76 - 100% 4YR BS or BA degree
Masters, Doctorate
M-C A M-C B M-C C M-C D
Age Shopping % Education Income
$80,000-$119,000Over $120,00066 and over
56-6546-5536-4526-3518-25
Please Indicate Your Age
Please indicate your total annual household income before taxes.Less than $20,000$20,000-39,999$40,000-$59,999$60,000-79,000
Please Indicate Your Household Food
Shopping % 0 - 25% 25 - 50%
Please indicate the highest level of education you
have completed.Some high school or lessHigh school
Test Day 23
The alternatives shown are mostly about packaging, but you may have other needs, and you can change the questions as needed as long as the answers are still “choose one answer” only.
VI. Ballot Completion Check List Once you have altered the survey to fit your specifications, review how it looks in a printed copy. The print settings in the workbook for Ballot Template page (1) and Ballot Template page (2) are set to just print the area with survey questions. Print both pages out while in their respective worksheets. Take a careful look, does it ask what you want, and does it make sense? You should have a few people take the survey with your product sample to verify that it is working. If they are confused about a question, you may want to the change the wording.
Make sure that all the questions are consistent. If you have inadvertently erased something or typed something in the wrong area, you should correct it now. In the purchase intent with price do the price increments make sense for your product? You can change the increments by using the override cell. Consider how you will use the information from the Check all that apply and multiple choice questions, you may decide that you want to ask for different information.
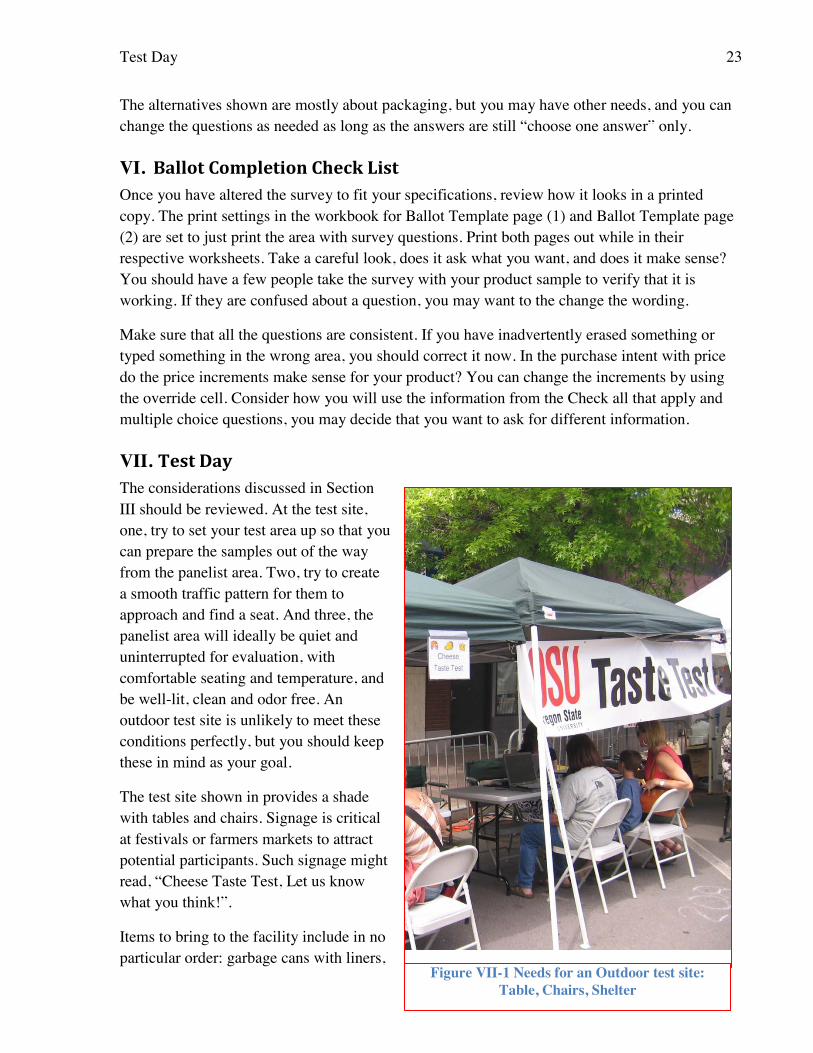
VII. Test Day The considerations discussed in Section III should be reviewed. At the test site, one, try to set your test area up so that you can prepare the samples out of the way from the panelist area. Two, try to create a smooth traffic pattern for them to approach and find a seat. And three, the panelist area will ideally be quiet and uninterrupted for evaluation, with comfortable seating and temperature, and be well-lit, clean and odor free. An outdoor test site is unlikely to meet these conditions perfectly, but you should keep these in mind as your goal.
The test site shown in provides a shade with tables and chairs. Signage is critical at festivals or farmers markets to attract potential participants. Such signage might read, “Cheese Taste Test, Let us know what you think!”.
Items to bring to the facility include in no particular order: garbage cans with liners,
Figure VII-1 Needs for an Outdoor test site: Table, Chairs, Shelter
Test Day 24
tape, pens, paper for notes, ballots, clip boards, tent, tables, chairs, name tags, tray liners, cameras, lunch for staff and water for consumers. And of course enough copies of the ballot, and multiple copies of the ingredient list must be available. As appropriate you want example containers, or portion size representation, that represent what your priced product amount would be.
If preparing cooked foods, or computers, you will need electrical cords with cord covers for traffic areas. Bring additional power strips if using computers.
A. Product Preparation and Serving All products should be prepared in the same fashion so that any variation in product scores is due to consumer preference and not product preparation. The consumer should evaluate the product as it was meant to be consumed. If product preparation is difficult and/or temperature sensitive, such as with French fries, the venue must be well vetted to ensure successful preparation and presentation. Again, factors to consider include electrical needs, weather (if serving outside), temperature and space. When you are testing multiple flavors it is even more important that each product served should look and weigh the same as appropriate. Any variation should not be accidental. Sample preparation training is important; have your helpers recite the procedure back to you. You should label your different sample trays to be sure server gets it right even when busy.
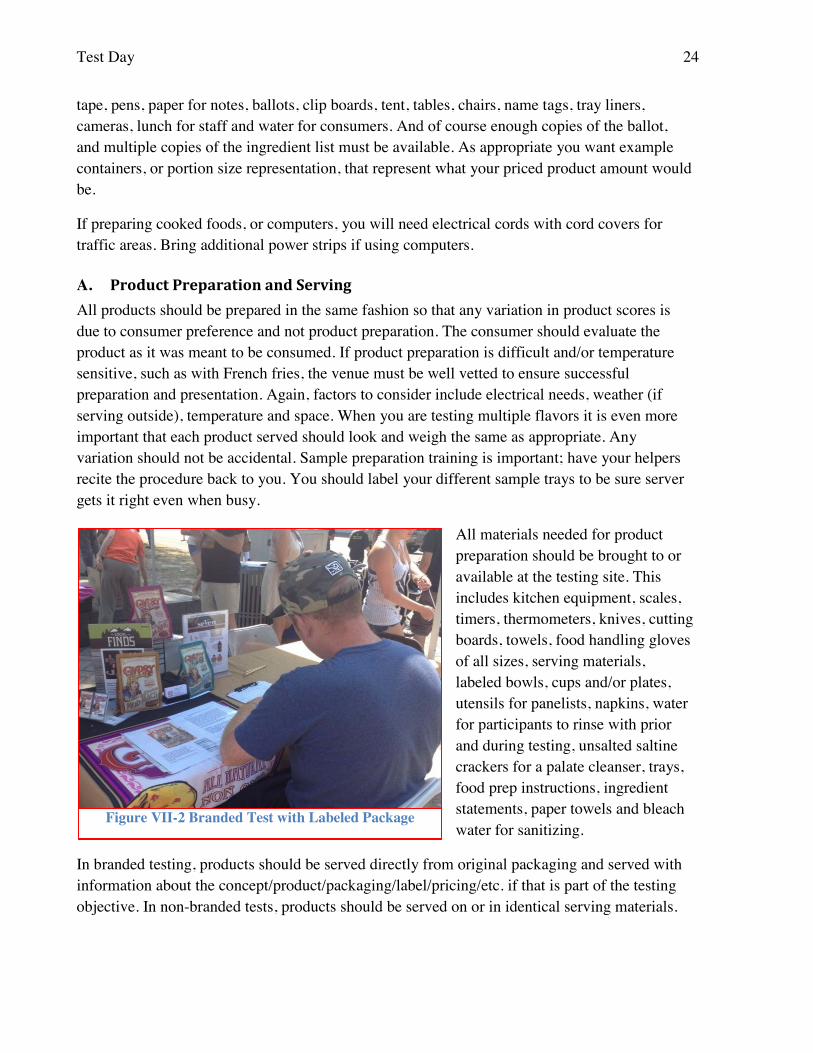
All materials needed for product preparation should be brought to or available at the testing site. This includes kitchen equipment, scales, timers, thermometers, knives, cutting boards, towels, food handling gloves of all sizes, serving materials, labeled bowls, cups and/or plates, utensils for panelists, napkins, water for participants to rinse with prior and during testing, unsalted saltine crackers for a palate cleanser, trays, food prep instructions, ingredient statements, paper towels and bleach water for sanitizing.
In branded testing, products should be served directly from original packaging and served with information about the concept/product/packaging/label/pricing/etc. if that is part of the testing objective. In non-branded tests, products should be served on or in identical serving materials.
Figure VII-2 Branded Test with Labeled Package
Test Day 25
B. Product The amount of product served should be considered carefully. The product should be well represented so that the consumer can see a representative sample visually and also have enough product to taste to get through the entire questionnaire. A two-ounce portion is a good guideline; however, it may be necessary to serve more or less depending on the product. You could need to have at least 2-4 bites to answer all of the product questions. Product cost is another factor to consider.
It is very important that each sample should appear identical in appearance: size, shape and color if possible. Remember, that some products may require a holding time before being served, so you should plan to keep them warm and prevent loss of crispness, and keep products sufficiently cool to prevent loss of quality. Timing the serve will be important.
C. Multiple Samples In a Market Readiness test you will generally be testing one product. However, with creative use of your ballot you could test variations of your product, such as different flavors. You can test up to three flavors, but later questions on price will refer to their favorite. If you wish to test multiple flavors of your product read the Multiple Sample appendix.
D. Test Management You and your team need to be welcoming and friendly as you invite panelists to take the survey. this will keep them with you and attract additional panelists. When a consumer accepts your invitation to take the survey, you can direct them to a seat or advise them to choose any open seat. As they take their seat give them any information they need to know. If there is a consent box to check, show them the consent information the researcher has provided and say a few words about why consent is needed.
Then, point out the concept information you have provided to answer the first question which “should be answered before tasting. Ideally, you will present the samples just after they answer the concept question. Try to keep an eye on your panelist’s progress through the ballot, both to be sure they aren’t confused by anything and to be sure they saw that there were two sides to the ballot. You might point out the two sides of the ballot as they sit down.
Don’t hover over the participants, they should not feel like you are looking at their answers. Don’t look at the answers when they finish. Very definitely don’t use this as the time to mount a sales pitch; you need their reaction to the product and what they might see on the concept statement (if using one). It is fine to talk to participants who ask questions after they are done with the survey, but take them aside and don’t distract the people filling out the ballot. You can explain that you are taking them aside to be sure to allow the current panelists to give you their reaction to the materials they are seeing not your additional information.
Entering Survey Results into the DATA Worksheet 26
What to do when things slow down? Send helpers out to show samples and welcome them in. Have one of your helpers sit down and make it look like they are taking the test – this makes newcomers and passersby feel comfortable about coming in.
Don’t talk around the panelists taking the survey. Talking about your preferences or letting other participants discuss theirs is bad for testing. All discussion should be carefully controlled and you should train your helpers in how to react to questions.
You and your team should be prepared to answer questions and help. In addition, people should know what to expect, how long it will take, and if compensation will be given. You may need to screen for sensory acuity, or help the participant mark their answers on the ballot. We have had testers with poor vision have the questions read, and others who had the questions translated. Providing a friendly environment creates a nice atmosphere during the test. Sometimes someone comes with a young child and wants to know if they can take the test too. It may be best to suggest that the adult fills out the survey because a child won’t be able to answer all of the questions. However, the child can get their own sample and help answer the sensory questions.
Panelists finishing too fast probably didn’t turn the survey over to the back page! You could ask if they answered the questions on the back page, and if you take a quick peek at the back page be sure to let them know that is why you are checking-adding some sort of comment that some people have missed the back. Take care that participants don’t think you are reading the answers. You need their honest evaluation, and they should not think you are going to read what they wrote and identify who wrote it If you are sure they finished you can let them know they can deposit the ballot in the ballot box or that you can do so for them-do so immediately. If any survey takers are watching they will see that you are not looking at their answers.
VIII. Entering Survey Results into the DATA Worksheet This document contains a sample survey, partial printouts of the spreadsheet in which the survey data is entered, and results examined. Once you fill out the intake survey you will get (or can access) the workbook that allows you to create your own survey and which also populates/labels the DATA worksheet in which you enter the data after your consumer test. The rest of the workbook produces the charts and figures that report the results from the consumer test.
You may need help with the DATA entry step. If so, the Oregon State University Food Innovation Center will provide this service, for a small fee. Other universities, extension centers, and or development organizations or departments may be willing to undertake this service for you locally.
In the rest of the workbook, all the charts and figures will be automatically filled in from what you entered on the Ballot Template page (1), Ballot Template page (2), and DATA worksheets.
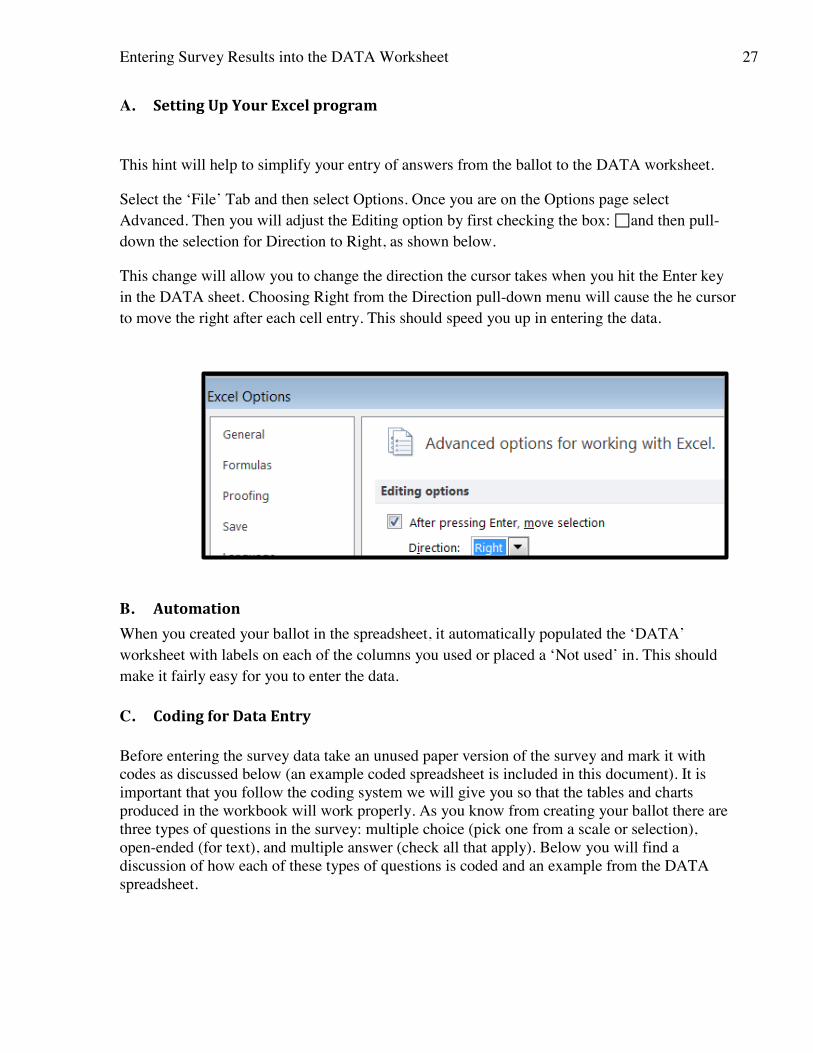
Entering Survey Results into the DATA Worksheet 27
A. Setting Up Your Excel program
This hint will help to simplify your entry of answers from the ballot to the DATA worksheet.
Select the ‘File’ Tab and then select Options. Once you are on the Options page select Advanced. Then you will adjust the Editing option by first checking the box: � and then pull-down the selection for Direction to Right, as shown below.
This change will allow you to change the direction the cursor takes when you hit the Enter key in the DATA sheet. Choosing Right from the Direction pull-down menu will cause the he cursor to move the right after each cell entry. This should speed you up in entering the data.
B. Automation When you created your ballot in the spreadsheet, it automatically populated the ‘DATA’ worksheet with labels on each of the columns you used or placed a ‘Not used’ in. This should make it fairly easy for you to enter the data.
C. Coding for Data Entry
Before entering the survey data take an unused paper version of the survey and mark it with codes as discussed below (an example coded spreadsheet is included in this document). It is important that you follow the coding system we will give you so that the tables and charts produced in the workbook will work properly. As you know from creating your ballot there are three types of questions in the survey: multiple choice (pick one from a scale or selection), open-ended (for text), and multiple answer (check all that apply). Below you will find a discussion of how each of these types of questions is coded and an example from the DATA spreadsheet.
Entering Survey Results into the DATA Worksheet 28
Multiple Choice (Scale Questions)
Q1, Q5, Q7, Q8, Q11-Q14 are all coded as scales. The first four of these are answered from left to right: a 1 is entered if the consumer chose the first choice on the left, 2 for the next and so on. For five-point scale purchase intent questions (Q1 and Q7) and Just-about-Right questions, there are 5 choices so the last choice on the far right would be coded with a 5. For example, with purchase intent, when the data is entered, 1 represents ‘would definitely not buy’; 2 represents ‘would probably not buy’; 3 represents ‘might buy/ might not buy’; 4 represents ‘would probably buy’; 5 represents ‘would definitely buy’. The graphics and tables produced to display your data are based on this coding, so it is important to use it.
(a) Liking ratings Q2 details
Entry for nine-point scale questions used for the Liking ratings, follow the same sequence. 1 is coded for ‘dislike extremely’; a 2 for ‘dislike very much’; a 3 for ‘dislike moderately’; a 4 for ‘dislike slightly’; a 5 for ‘neither like nor dislike’; a 6 for ‘like slightly’; a 7 for ‘like moderately;’ an 8 for ‘like very much’; a 9 for ‘like extremely’. There will be one column in the DATA worksheet for each Liking Rating.
If you do a multiple sample test and randomized the presentation order of samples by using multiple versions of your ballot, you will need to be very careful with data entry. Make sure to match the code description on the ballot to the correct column in the DATA sheet because it won’t be the same order for all ballots. The order in the DATA sheet will be based on the current version in the Ballot Page (2) spreadsheet.
(b) Just-About-Right Q3 details
The Just-About-Right Question responses should also be coded from 1 on the left to 5 on the right. There will be one column in the DATA worksheet for each Just-About-Right Rating.
(c) Open-Ended Questions- Q6 instructions
For Open-Ended text questions we recommend recording the entire text, separated by commas for different phrases. This way you will have it so that you may interpret it later. You should definitely instruct anyone entering the data to type it all in, they may not know what you will find interesting so you should keep it all. The program will put all of these into one or more sheets as needed for you to examine.
(d) Purchase-Intent-Price Question - Q7 special instructions
This question is also a multiple choice five-point scale purchase intent question like Q1, but it is asked at six prices so there will be six columns in the DATA worksheet for this question; one column for each of the prices.
This question is difficult for some people to answer so if they clearly misunderstood, you can leave all of the answers blank. Misunderstanding would be suspected if someone checked a higher purchase intent category for a higher price than for a lower price.
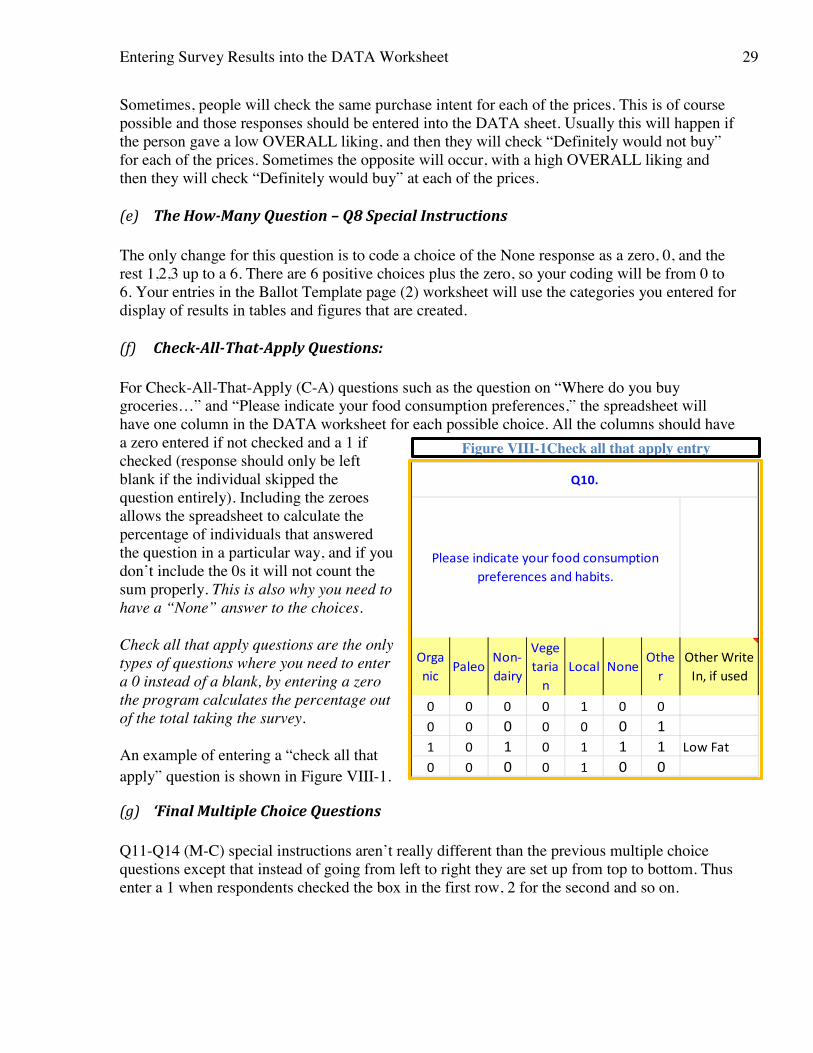
Entering Survey Results into the DATA Worksheet 29
Sometimes, people will check the same purchase intent for each of the prices. This is of course possible and those responses should be entered into the DATA sheet. Usually this will happen if the person gave a low OVERALL liking, and then they will check “Definitely would not buy” for each of the prices. Sometimes the opposite will occur, with a high OVERALL liking and then they will check “Definitely would buy” at each of the prices.
(e) The How-Many Question – Q8 Special Instructions
The only change for this question is to code a choice of the None response as a zero, 0, and the rest 1,2,3 up to a 6. There are 6 positive choices plus the zero, so your coding will be from 0 to 6. Your entries in the Ballot Template page (2) worksheet will use the categories you entered for display of results in tables and figures that are created.
(f) Check-All-That-Apply Questions:
For Check-All-That-Apply (C-A) questions such as the question on “Where do you buy groceries…” and “Please indicate your food consumption preferences,” the spreadsheet will have one column in the DATA worksheet for each possible choice. All the columns should have a zero entered if not checked and a 1 if checked (response should only be left blank if the individual skipped the question entirely). Including the zeroes allows the spreadsheet to calculate the percentage of individuals that answered the question in a particular way, and if you don’t include the 0s it will not count the sum properly. This is also why you need to have a “None” answer to the choices.
Check all that apply questions are the only types of questions where you need to enter a 0 instead of a blank, by entering a zero the program calculates the percentage out of the total taking the survey.
An example of entering a “check all that apply” question is shown in Figure VIII-1.
(g) ‘Final Multiple Choice Questions
Q11-Q14 (M-C) special instructions aren’t really different than the previous multiple choice questions except that instead of going from left to right they are set up from top to bottom. Thus enter a 1 when respondents checked the box in the first row, 2 for the second and so on.
Orga
nicPaleo
Non-
dairy
Vege
taria
n
Local NoneOthe
r
Other Write
In, if used
0 0 0 0 1 0 0
0 0 0 0 0 0 1
1 0 1 0 1 1 1 Low Fat
0 0 0 0 1 0 0
Q10.
Please indicate your food consumption
preferences and habits.
Figure VIII-1Check all that apply entry
Evaluating Results 30
IX. Evaluating Results
Each question asked on the survey is displayed on a separate tab of the spreadsheet as both a table and a figure. While the meaning will be fairly obvious we will discuss each type of question below.
While you can look at each worksheet in the workbook to examine your results, it will be easier to create a PDF, and look at the results in that form. To get the whole report at once instead of printing one worksheet at a time go to the File Tab and select the first drop down under Settings. From the drop down choose ‘Print Entire Workbook’. This will print all selected "Print areas" in each of the worksheets. It will only print the top parts of the Data Sheet. By printing as a PDF or to a file you can be sure it is printing the way it was intended and you can delete pages that you don't want, before printing on paper. You will probably want to send your report as a PDF at some point anyway.
A. Purchase-Intent-Concept (P-I-C) Responses to this question can vary greatly. If your product is unusual, those tested are likely to be uncertain and respond more conservatively, if your product has well-liked known flavors and ingredients you will be starting from a higher base. Some of your label details may resonate well with the consumers you test. Made in New York will usually work better in New York than in Boston or Texas! Responses to this question will need to be compared to the responses to other questions to get the most out of it.
B. Liking Ratings (9-PT-Scale) As discussed earlier, this question allows answers from ‘dislike extremely’ to ‘like extremely’. Generally, a well-received product will have a score with a mean above 7.0. The most important of these is the Overall Liking question, which will give you a good sense of how well your product is liked over all attributes. If your product rates poorly in overall liking, you are likely to rate poorly on the purchase-intent-price question. However, if your purchase-intent-concept is well liked prior to tasting it is possible that your product can be improved with attention to the Just-About-Right and more specific liking ratings and open-ended likes and dislikes responses.
C. Just-About-Right A product’s sensory attribute is considered at an ‘Acceptable’ level if at least 65% of the population selected the middle category, Just-about-right. If the product has not met the 65% threshold for acceptance, then the product should be considered for reformulation on this attribute. If there is a difference of more than 10% between the sum of scores on the left (not-nearly-enough plus not-quite-enough) and the sum of scores on the right (somewhat-too-much plus much-too-much), the product is considered unbalanced. As the imbalance increases past 15-20% a reformulation will be more and more important. On the other hand, if the current product has a just-about-right score of over 65%, and there is another response category with
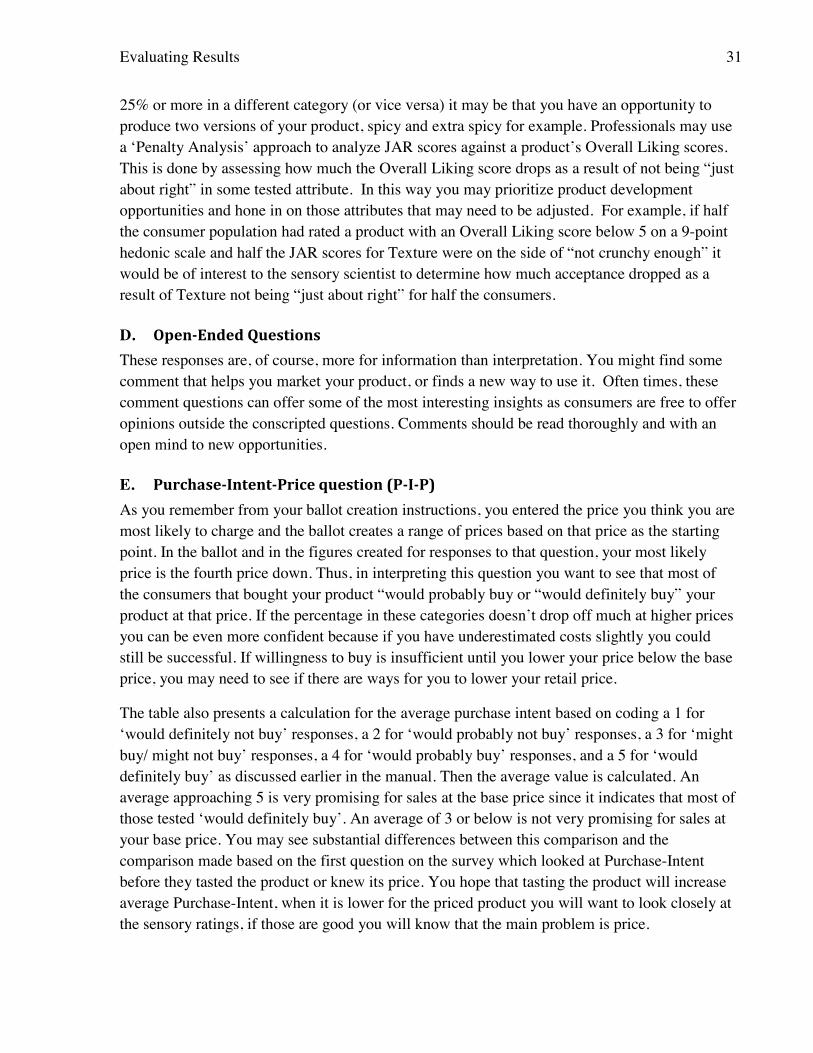
Evaluating Results 31
25% or more in a different category (or vice versa) it may be that you have an opportunity to produce two versions of your product, spicy and extra spicy for example. Professionals may use a ‘Penalty Analysis’ approach to analyze JAR scores against a product’s Overall Liking scores. This is done by assessing how much the Overall Liking score drops as a result of not being “just about right” in some tested attribute. In this way you may prioritize product development opportunities and hone in on those attributes that may need to be adjusted. For example, if half the consumer population had rated a product with an Overall Liking score below 5 on a 9-point hedonic scale and half the JAR scores for Texture were on the side of “not crunchy enough” it would be of interest to the sensory scientist to determine how much acceptance dropped as a result of Texture not being “just about right” for half the consumers.
D. Open-Ended Questions These responses are, of course, more for information than interpretation. You might find some comment that helps you market your product, or finds a new way to use it. Often times, these comment questions can offer some of the most interesting insights as consumers are free to offer opinions outside the conscripted questions. Comments should be read thoroughly and with an open mind to new opportunities.
E. Purchase-Intent-Price question (P-I-P) As you remember from your ballot creation instructions, you entered the price you think you are most likely to charge and the ballot creates a range of prices based on that price as the starting point. In the ballot and in the figures created for responses to that question, your most likely price is the fourth price down. Thus, in interpreting this question you want to see that most of the consumers that bought your product “would probably buy or “would definitely buy” your product at that price. If the percentage in these categories doesn’t drop off much at higher prices you can be even more confident because if you have underestimated costs slightly you could still be successful. If willingness to buy is insufficient until you lower your price below the base price, you may need to see if there are ways for you to lower your retail price.
The table also presents a calculation for the average purchase intent based on coding a 1 for ‘would definitely not buy’ responses, a 2 for ‘would probably not buy’ responses, a 3 for ‘might buy/ might not buy’ responses, a 4 for ‘would probably buy’ responses, and a 5 for ‘would definitely buy’ as discussed earlier in the manual. Then the average value is calculated. An average approaching 5 is very promising for sales at the base price since it indicates that most of those tested ‘would definitely buy’. An average of 3 or below is not very promising for sales at your base price. You may see substantial differences between this comparison and the comparison made based on the first question on the survey which looked at Purchase-Intent before they tasted the product or knew its price. You hope that tasting the product will increase average Purchase-Intent, when it is lower for the priced product you will want to look closely at the sensory ratings, if those are good you will know that the main problem is price.
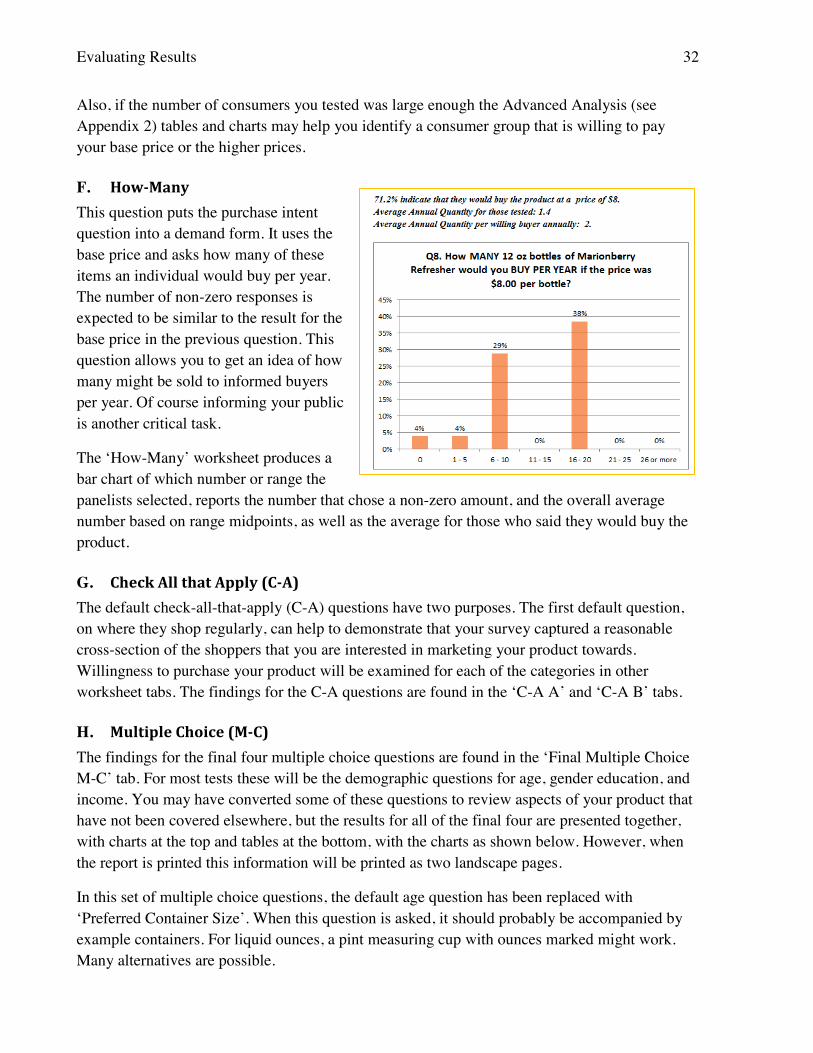
Evaluating Results 32
Also, if the number of consumers you tested was large enough the Advanced Analysis (see Appendix 2) tables and charts may help you identify a consumer group that is willing to pay your base price or the higher prices.
F. How-Many This question puts the purchase intent question into a demand form. It uses the base price and asks how many of these items an individual would buy per year. The number of non-zero responses is expected to be similar to the result for the base price in the previous question. This question allows you to get an idea of how many might be sold to informed buyers per year. Of course informing your public is another critical task.
The ‘How-Many’ worksheet produces a bar chart of which number or range the panelists selected, reports the number that chose a non-zero amount, and the overall average number based on range midpoints, as well as the average for those who said they would buy the product.
G. Check All that Apply (C-A) The default check-all-that-apply (C-A) questions have two purposes. The first default question, on where they shop regularly, can help to demonstrate that your survey captured a reasonable cross-section of the shoppers that you are interested in marketing your product towards. Willingness to purchase your product will be examined for each of the categories in other worksheet tabs. The findings for the C-A questions are found in the ‘C-A A’ and ‘C-A B’ tabs.
H. Multiple Choice (M-C) The findings for the final four multiple choice questions are found in the ‘Final Multiple Choice M-C’ tab. For most tests these will be the demographic questions for age, gender education, and income. You may have converted some of these questions to review aspects of your product that have not been covered elsewhere, but the results for all of the final four are presented together, with charts at the top and tables at the bottom, with the charts as shown below. However, when the report is printed this information will be printed as two landscape pages.
In this set of multiple choice questions, the default age question has been replaced with ‘Preferred Container Size’. When this question is asked, it should probably be accompanied by example containers. For liquid ounces, a pint measuring cup with ounces marked might work. Many alternatives are possible.
Evaluating Results 33
Figure IX-1 Figures for ‘Final Multiple Choice M-C’ tab
Final Remarks and Considerations 34
X. Final Remarks and Considerations What are the advantages and disadvantages of a Self-Executed versus Professional Consumer Test?
A. Money Versus Time With self-execution the dollar outlay to test product is mostly in paying for your helpers’ time as needed and the cost of the product you use for sampling. You may also pay a fee to set-up a booth at a farmers market or other venue. In comparison, a professional test executed at a testing center would cost thousands of dollars.
Because you are self-executing the test, your personal time used is not insignificant. Creating a ballot, arranging for a venue and your helpers, and producing the product will add up. The survey day is likely to be a full day, and someone will have to enter the data.
While cost is greatly reduced, you do give up several things that a professional test would provide. When you don’t pay panelists you will need to have a shorter test and thus a reduction in information that you can gather. Also the demographic distribution will be limited by the venue, and you won’t be able to do much, if any, screening of those that test your product.
B. Third Party Testing One of the potentially important losses of self-execution is the 3rd party, unbiased nature of the information gathered in a professional test. This is mostly important if you wish to validate the information gathered in the consumer test. Distributors and retailers may not trust the results completely if they are self-gathered. The same problem may exist if you are trying to convince a bank or investor to provide funds for development. A professional survey provides third party results, which may be more readily accepted by retailers or investors.
C. Third Party ‘Light’ There may be a way around this problem. The solution lies in working with either your test venue’s management, University Extension, and/or another business development agency that works with food producers. If your test venue is a farmers market their management may be willing to help as well.
The basic idea is that the survey ballots would be collected in a sealed box, so that the ‘vendor/entrepreneur’ doesn’t get to look at the survey results during or after the consumer test, then a 3rd party could tabulate the data into the workbook and produce the report. The idea is to create a chain of privacy.
How would this work? Using a farmers market (FM) location as an example there would be 4 Tasks to obtain a 3rd party ‘light’ validation. A small amount of assistance could be provided by FM staff. More assistance would be needed from a tabulator at a university extension program
Computerized Surveys 35
or local food organization. There are 4 tasks you need to arrange in advance; these are listed in the box.
A 3rd party validation may not be necessary for you. If you are at a stage when you are primarily interested in the sensory information, or plan to self-finance and only sell at farmers markets until you establish your business, the third party aspect may not be relevant. Also, those you are marketing your concept to may be perfectly willing to accept your self-executed consumer test without the third party approach.
XI. Computerized Surveys The primary reason for developing the MKTRD as paper survey is that we expect the surveys to be self-executed with several individuals taking the survey simultaneously and that the users will not have several laptops or tablets available to them to run the survey. Smartphones are a bit too small for a food test which captures this information. If you are working with an organization that can provide several tablets for the test (see next section), there is a computerized version being developed.
Tasks for the 3rd party monitor.
Task A-OBSERVE: At the beginning of the market or just before, the FM Manager or other FM staff would drop by the test booth and make sure the prepared ballot box was taped down to ensure ballot privacy.
Task B-COLLECT: At the end of the market the FM Manager would receive the sealed box they observed at the beginning of the market along with a pre-addressed and pre-paid US Mail or FedEx box. They could put the surveys in that mailing box or have the vendor do it under supervision.
Task C - SHIP: The FM manager or an assistant would drop the survey in the mail for shipment to the survey reporter (for example University extension) who will create the “3rd party report.”
Tasks for the 3rd party reporter.
Task D - REPORTING AND VERIFICATION: An official survey report should explain this process and verify the information about the individuals (e.g. the FM manager) involved. Preparing this report will take some time and effort for the data entry and the verification that this test took place and that they collected and shipped the ballots. You should expect to pay a fee for the data entry and report production. A minimum cost might be $75, a maximum $150. This will include a base price for setting up the report and verifying and then a charge per ballot entered.
Funding 36
XII. For Extension, Outreach and other Non-profit Professionals Assisting Start-ups
We welcome your use of the protocol with your clients, but would like them to request the workbook directly for our records. We would be even more pleased to have you report back with your experience. Please note that there are some advanced analysis worksheets not included in the current version of the Excel workbook. These will be more helpful to those with greater statistical experience, and with larger sample sizes.
Also if you wish to work with start-ups and can provide several tablet or other computers for a test, please let us know. There is a computerized version being developed.
Please contact us for additional information.
XIII. Contacts, Feedback, and Other Information Contact [email protected] for ballot creation, spreadsheet and reporting questions. Use the Subject: Market Readiness Question.
We would love to get your feedback about what you did with your survey, and how you used the information you gathered. Just send an e-mail to the contact above. Use the Subject: Market Readiness Feedback.
XIV. Acknowledgements Special thanks to Sarah Masoni for recruiting and working with several of the Beta and Alpha testers of the protocol, and to several FIC student employees and interns who helped with testing and reviewing sections of the manual and workbook. Thanks also to DeDe Long, Applied Economics GRA, for early efforts on the workbook, and Jason BeroldingenMiller, an undergraduate student assistant who led the work on the instructional videos and the intake survey.
Thanks also to our key reviewers, Jason Ball, Culinary Chef, Food Innovation Center, Dawn Thilmany, Professor, Colorado State University, Kynda Curtis, Utah State University. We thank Aimee Hasenbeck, Sensory Program, Food Innovation Center for additional clarifications incorporated in Manual Version 1.1.
XV. Funding Oregon State University funds for this project were matched with Federal funds under the Federal-State Marketing Improvement Program of the Agricultural Marketing Service, U.S. Department of Agriculture.
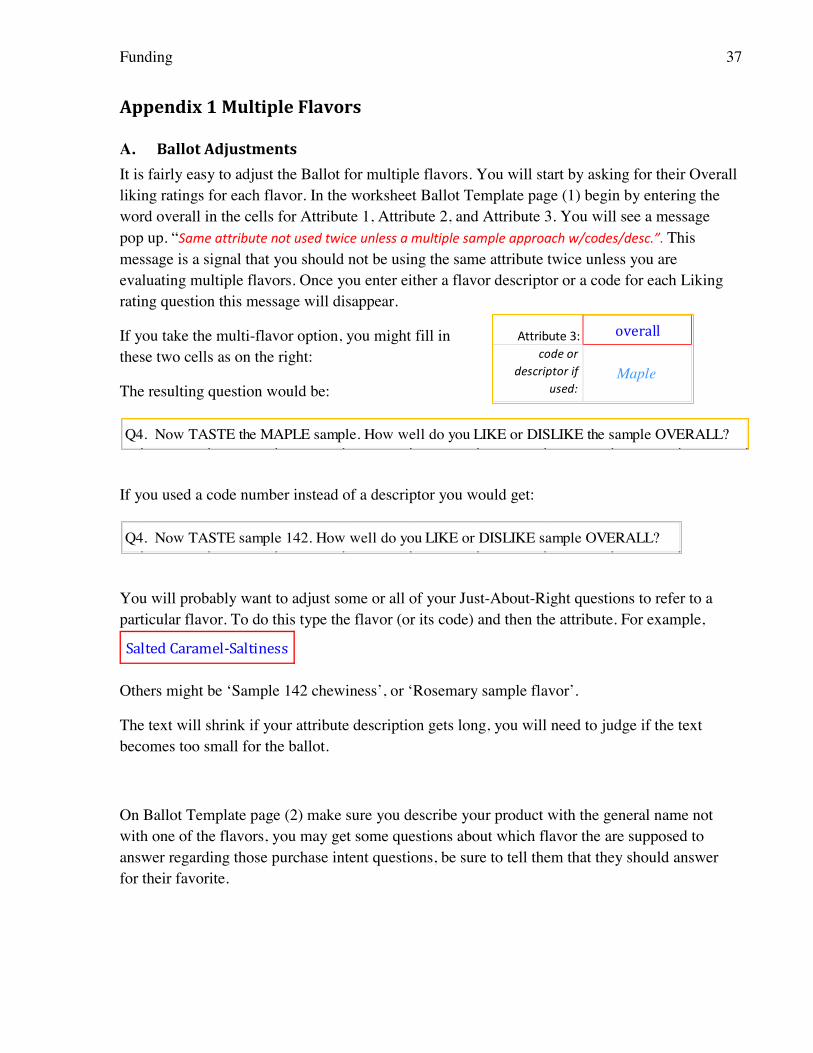
Funding 37
Attribute 3:overall
code or descriptor if
used:Maple
Appendix 1 Multiple Flavors
A. Ballot Adjustments It is fairly easy to adjust the Ballot for multiple flavors. You will start by asking for their Overall liking ratings for each flavor. In the worksheet Ballot Template page (1) begin by entering the word overall in the cells for Attribute 1, Attribute 2, and Attribute 3. You will see a message pop up. “Same attribute not used twice unless a multiple sample approach w/codes/desc.”. This message is a signal that you should not be using the same attribute twice unless you are evaluating multiple flavors. Once you enter either a flavor descriptor or a code for each Liking rating question this message will disappear.
If you take the multi-flavor option, you might fill in these two cells as on the right:
The resulting question would be:
If you used a code number instead of a descriptor you would get:
You will probably want to adjust some or all of your Just-About-Right questions to refer to a particular flavor. To do this type the flavor (or its code) and then the attribute. For example,
Others might be ‘Sample 142 chewiness’, or ‘Rosemary sample flavor’.
The text will shrink if your attribute description gets long, you will need to judge if the text becomes too small for the ballot.
On Ballot Template page (2) make sure you describe your product with the general name not with one of the flavors, you may get some questions about which flavor the are supposed to answer regarding those purchase intent questions, be sure to tell them that they should answer for their favorite.
Salted Caramel-Saltiness
Q4. Now TASTE the MAPLE sample. How well do you LIKE or DISLIKE the sample OVERALL?
Q4. Now TASTE sample 142. How well do you LIKE or DISLIKE sample OVERALL?
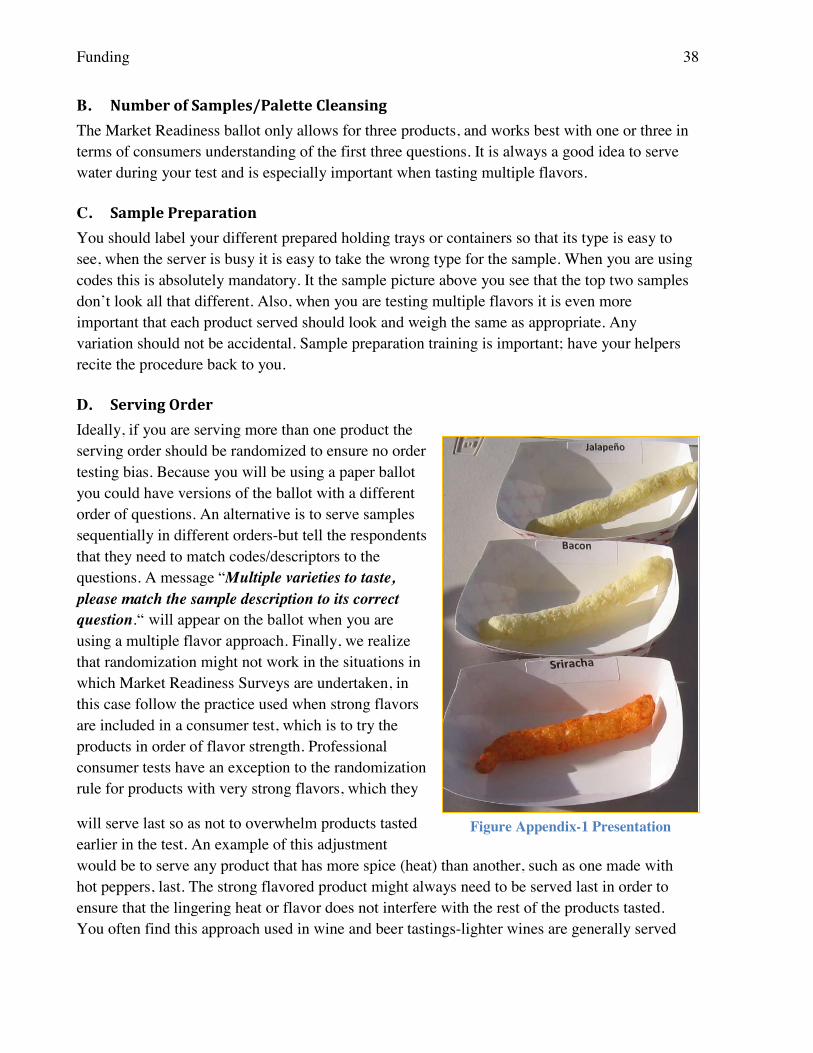
Funding 38
B. Number of Samples/Palette Cleansing The Market Readiness ballot only allows for three products, and works best with one or three in terms of consumers understanding of the first three questions. It is always a good idea to serve water during your test and is especially important when tasting multiple flavors.
C. Sample Preparation You should label your different prepared holding trays or containers so that its type is easy to see, when the server is busy it is easy to take the wrong type for the sample. When you are using codes this is absolutely mandatory. It the sample picture above you see that the top two samples don’t look all that different. Also, when you are testing multiple flavors it is even more important that each product served should look and weigh the same as appropriate. Any variation should not be accidental. Sample preparation training is important; have your helpers recite the procedure back to you.
D. Serving Order Ideally, if you are serving more than one product the serving order should be randomized to ensure no order testing bias. Because you will be using a paper ballot you could have versions of the ballot with a different order of questions. An alternative is to serve samples sequentially in different orders-but tell the respondents that they need to match codes/descriptors to the questions. A message “Multiple varieties to taste, please match the sample description to its correct question. “ will appear on the ballot when you are using a multiple flavor approach. Finally, we realize that randomization might not work in the situations in which Market Readiness Surveys are undertaken, in this case follow the practice used when strong flavors are included in a consumer test, which is to try the products in order of flavor strength. Professional consumer tests have an exception to the randomization rule for products with very strong flavors, which they
will serve last so as not to overwhelm products tasted earlier in the test. An example of this adjustment would be to serve any product that has more spice (heat) than another, such as one made with hot peppers, last. The strong flavored product might always need to be served last in order to ensure that the lingering heat or flavor does not interfere with the rest of the products tasted. You often find this approach used in wine and beer tastings-lighter wines are generally served
Figure Appendix-1 Presentation
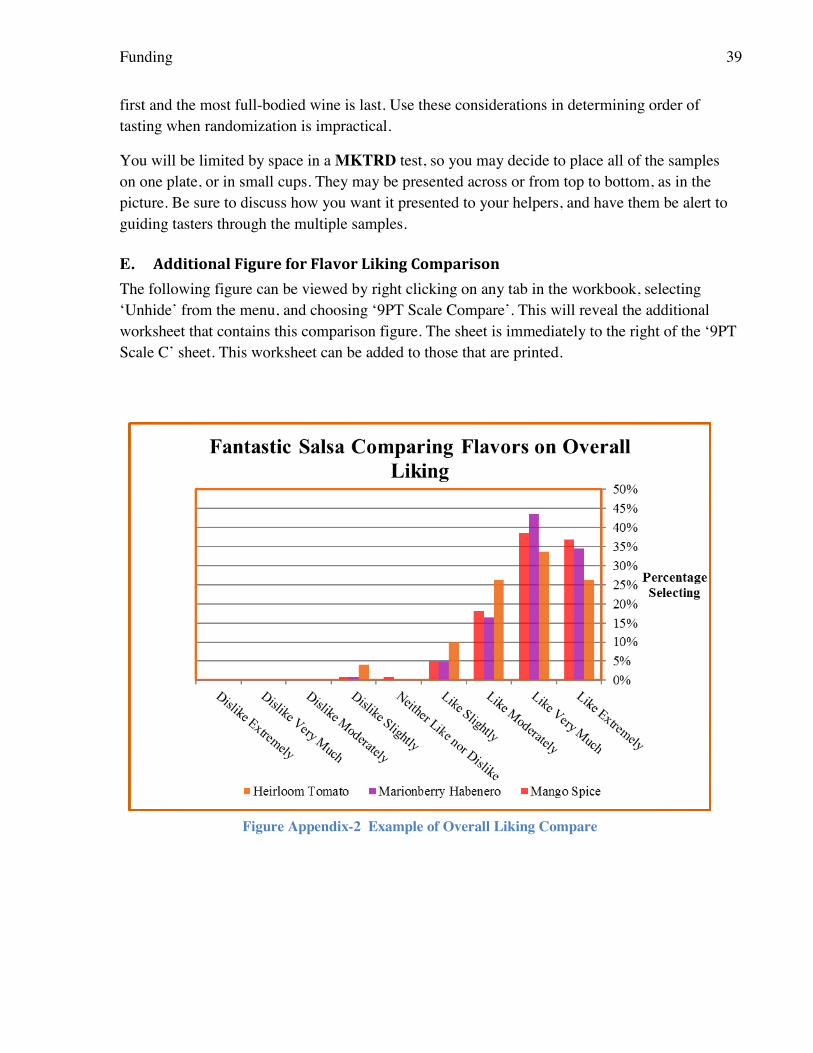
Funding 39
first and the most full-bodied wine is last. Use these considerations in determining order of tasting when randomization is impractical.
You will be limited by space in a MKTRD test, so you may decide to place all of the samples on one plate, or in small cups. They may be presented across or from top to bottom, as in the picture. Be sure to discuss how you want it presented to your helpers, and have them be alert to guiding tasters through the multiple samples.
E. Additional Figure for Flavor Liking Comparison The following figure can be viewed by right clicking on any tab in the workbook, selecting ‘Unhide’ from the menu, and choosing ‘9PT Scale Compare’. This will reveal the additional worksheet that contains this comparison figure. The sheet is immediately to the right of the ‘9PT Scale C’ sheet. This worksheet can be added to those that are printed.
Figure Appendix-2 Example of Overall Liking Compare