market report & forecast - colliersparrish.com · commercial real estate industry. records are...
TRANSCRIPT

Market Report & Forecast2014-2015 Colliers International
San Jose/Silicon Valley

ii COLLIERS INTERNATIONAL | FEBRUARY 2015
TABLE OF CONTENTSCOLLIERS INTERNATIONAL
2014 - 2015 SILICON VALLEY MARKET REPORT & FORECAST
TRUST HONESTY INTEGRITY RESPECT FAMILY GENEROSITY PROFESSIONALISM
Colliers International - Introduction 1
The 2014 Year in Review 2
Observations & Forecasts 4
Office Market 8
Research & Development Market 12
Industrial Market 16
Warehouse Market 20
Retail Market 24
Investment Market 26
Silicon Valley Market Statistics 28
Brokerage Profiles 36
Contributors
Editor and Chief Contributor: Jeff Fredericks, siorExecutive Managing Director
Contributing Writers:Jennifer Vaux - Regional Research ManagerColliers Retail Services GroupColliers Investment Services Group
Research: Colliers Research Services Group
Design and Production: Colliers Graphic Services Group
About the Newslet terThis newsletter represents the one hundredth in a series published by Colliers International. The information basis for this newsletter is the Parrish Absorption Tracking System (PATS) from which the absorption-related statistics are developed and derived. PATS maintains monthly statistics within Silicon Valley for 14 cities, 31 geographical areas and 4 commercial/industrial building types.
If you desire more data in order to analyze sub-markets not specified in this newsletter, please submit your request through your Colliers International sales representative at 408 282 3800 or write to Colliers International at 450 West Santa Clara Street, San Jose, California 95113. In addition you may send your e-mail inquiry to [email protected]. We look forward to supporting your specific needs.

1COLLIERS INTERNATIONAL | FEBRUARY 2015
There are a couple of things that can be said about Jim Harbaugh’s mantra of “Who’s got it better than us?” The first thing is that these words speak not only to the San Francisco 49ers, but to the entire Bay Area region, and everything we have to be thankful for living and working in this amazing place. The second thing is, it doesn’t last forever.
While Harbaugh is off to greener pastures and the 49ers are shaking off the effects of a disappointing year, the Bay Area continues on a technology roll, and as a result, nobody has it better than Silicon Valley’s commercial real estate industry.
Records are being set across the Valley: unprecedented levels of absorption, historic low vacancy rates, and mega-deals with jaw-dropping numbers. Google’s lease of more than 1.9 million square feet of Jay Paul’s Moffett Place is said to be the largest office lease in the nation-ever. The Silicon Valley Business Journal reported that the sale of a partial interest in Menlo Park’s Sand Hill Commons, a 12-acre complex on Sand Hill Road, fetched $1,800 per square foot, quite possibly a new national sales record. As for Colliers International, December 2014 was our partnership’s best month ever. Boom!
When will the music stop? Well, the fact is, nobody knows. Consensus sentiment suggests that 2015 is a safe bet for another bang-up year. At the same time, the heated climate has everyone a little nervous. After all, the dot.com crash isn’t exactly ancient history yet. Try to find your answer in a Google search and the results vary from “unprecedented risk” to “no, no way, nope,” to “what bubble?”
Whenever it ends, we know that just like the Jim Harbaugh era, it won’t last forever. The best we can do for now is keep one eye on the ball, and the other eye downfield. Along the way, we need to enjoy the ride and focus on providing the most timely information and doing the best job possible for our clients. We hope that Colliers International’s Trends2015 program will help guide you along the way.
Let’s lace ‘em up and do it again!
SILICON VALLEY S IX TEENTH A NN UA L
COMMERCIAL REAL ESTATETRENDS2015 CONFERENCE
LEAD SPONSOR
ADDITIONAL SPONSORS
COLLIERS INTERNATIONAL 2014 - 2015 SILICON VALLEY MARKET REPORT & FORECAST
Who’s Got It Better Than Us?
Jeff Fredericks, siorExecutive Managing Director
Environmental & Engineering Services

2 COLLIERS INTERNATIONAL | FEBRUARY 2015
2014 YEAR IN REVIEWCOLLIERS INTERNATIONAL 2014 - 2015 SILICON VALLEY
MARKET REPORT & FORECAST
• Demolition of 2.6 million square feet of R&D space begins to make way for the largest private construction project in the Silicon Valley, Apple Campus 2.
• The US Senate confirms Janet Yellen as the new chair of the Federal Reserve; Yellen is the first woman to hold this post.
• After a data breach due to hackers, the number of people with their personal information stolen from Target stores tops 70 million
• Reports are leaked that the National Security Agency collects data from hundreds of millions of text messages each day.
• For the first time in its 54-year history, the State Water Project announces a zero water allocation for the state of California, providing no water to urban residents or farmers this year amid a record-setting drought.
• For the first time in the history of digital currency, two Las Vegas casinos begin to accept Bitcoin.
January
• Facebook enters into an agreement to buy the Mountain View-based mobile messaging service WhatsApp for $19 billion in cash and stock.
• Comcast is set to acquire Time Warner Cable in a $69.8 billion buyout.
• Microsoft internally appoints Satya Nadella to be its next CEO and appoints John W. Thompson as chairman.
• Sony announces plans to sell its PC unit and split its TV division into a separate subsidiary as part of its restructuring program.
• The opening ceremony is held for the 2014 Winter Olympics in Sochi, Russia.
• Coca-Cola buys a 10 percent stake in Green Mountain Coffee Roasters for $1.25 billion.
February
• Russia OKs military force in Ukraine. President Obama warns that the United States will stand with the international community in affirming that there will be costs for any military intervention.
• Toyota is ordered to pay $1.2 billion to settle charges that it lied to United States safety investigators and the public about deadly accelerator defects.
• Microsoft founder Bill Gates regains the top spot as the world’s richest person, according to Forbes magazine’s annual ranking of global billionaires.
• Radio Shack announces the closure of up to 1,100 stores.
• Staples Inc. plans to close 225 store locations and cut $500 million from its budget, citing low sales and internet competition.
• Malaysia Airlines loses contact with a Boeing 777-200ER passenger plane carrying 239 people from Kuala Lumpur to Beijing, China.
March
• Microsoft closes on an acquisition of Nokia’s devices business for $7.2 billion.
• Bank of America agrees to pay $727 million to customers as restitution for deceptive marketing practices and unfair billing.
• A woman is arrested after she throws a shoe at the head of former United States Secretary of State Hillary Clinton as she was giving a speech in Las Vegas, Nevada.
• $1.8 billion in fines are imposed on S.A.C. Capital Advisors by the United States for insider trading violations.
• Microsoft officially turns out the lights on Windows XP after 12 years of support.
April
• Google pays $250 million ($625/sf) for Deutsche Bank’s redevelopment site at 700 Middlefield in Mountain View.
• Ericsson preleases 412,000 square feet at Irvine Company’s speculative Santa Clara Square office project.
• AT&T acquires DirecTV for a reported $67.1 billion
• Nest Labs announces plans to recall 440,000 smoke alarms to fix a problem that could cause the alarms to not go off immediately after detecting smoke.
• Office Depot says it will close at least 400 of its U.S. stores.
• eBay forces its users to change their passwords after a database containing encrypted user passwords and other non-financial data is compromised by a cyber-attack.
May
• Panattoni Development Co. purchases 16 acres of undeveloped land in South San Jose where it plans to build a speculative warehouse project of about 300,000 square feet.
• Medtronic buys Covidien for $46.8 billion.
• Swift Partners purchases downtown San Jose’s Community Towers, totaling 326,749 square feet, from CIBC for a reported $40 million.
• American multinational food corporation Tyson Foods agrees to buy Hillshire Brands for $7.7 billion.
• WhatsApp preleases 78,000 square feet in downtown Mountain View at 250 Bryant.
• Tesla Motors announces it will allow competitors to use its patents without paying royalties.
• Oracle Corporation buys MICROS Systems in a $5.3 billion deal.
June

3COLLIERS INTERNATIONAL | FEBRUARY 2015
2014 YEAR IN REVIEW COLLIERS INTERNATIONAL 2014 - 2015 SILICON VALLEY MARKET REPORT & FORECAST
• Rockwood Capital purchases the 268,450 square-foot Mountain View Corporate Center from RREEF for a reported $154 million
• Facebook’s stock triples since going public last July, hitting $74.17, and is named the best performing stock on the S&P 500
• Discount store chain Dollar Tree reaches an $8.5 billion deal to buy out rival Family Dollar
• A feel-good phenomenon of dumping cold water over our heads known as the Ice Bucket Challenge raises some $220 million to promote awareness of Lou Gehrig’s disease.
• Google spends $98.1 million on nine buildings in Mountain View from Boston Properties, expanding its Mountain View Empire.
• The long-vacant phase II of River Park Two Towers claims its first tenant after completing construction in 2010. Intacct agrees to a long term lease for three full floors totaling nearly 60,000 square feet.
July
• The San Jose Earthquakes play the first-ever game at the new Levi’s Stadium against the Seattle Sounders in a Major League Soccer match.
• A 6.0-magnitude quake strikes just six miles southwest of Napa, the strongest earthquake in 25 years to hit northern California.
• EMC2 Corporation renews their 300,000 square-foot lease on Mission College Blvd with landlord Sobrato Development Company.
• CM Stratplan sells its 158,332 square-foot San Jose Airport asset to 2025 Gateway Properties for a reported $27.5 million.
• Goldman Sachs agrees to buy back $3.15 billion in low quality mortgage bonds that it dumped on Fannie Mae and Freddie Mac preceding the financial crisis of 2007–08
• Oscar-winning American comedic actor Robin Williams is found dead at age 63.
August
• Alibaba Group Holding files a record initial public offering at $22 billion, and the shares soar 38% after its debut.
• Media giant News Corp. announces plans to buy Move Inc., a real estate-listing service which runs Realtor.com, for a reported $950 million.
• After adding 248,000 jobs, the U.S. unemployment rate falls to 5.9 percent, the lowest level since July 2008.
• Apple unveils the iPhone 6, Apple Pay and their newest “wearable” device, the Apple Watch.
• CVS Pharmacy announces it will change its name to “CVS Health” and cease marketing tobacco products
• Microsoft agrees to buy Swedish company Mojang, the makers of Minecraft, for $2.5 billion
September
• Google signs a lease deal with developer Jay Paul for all of Moffett Place, a 1.9 million square-foot office campus currently under construction, reportedly the largest single office transaction signed in California and the nation, ever.
• Campbell’s Pruneyard sells in a long anticipated deal. Ellis Partners picks up the 27-acre mixed-use site for a reported $280 million.
• Hewlett-Packard and eBay Inc. both make announcements that they will divide their iconic Silicon Valley companies into two. eBay will spin off its PayPal division while HP will divide into a PC-printer business and a hardware-software services business.
• In only the second World Series matchup of wildcard teams, the San Francisco Giants beat the Royals in game 7, to win their third World Series Championship in five years.
• The Federal Reserve announces plans to end quantitative easing six years after they began the bond buying program.
October
• Google signs a lease agreement with NASA to lease Moffett Field. Google will pay a total of $1.16 billion in rent to the government over 60 years, according to a NASA press release.
• Legacy Partners and Federal Realty move forward with plans for their respective office projects in San Jose. Legacy began moving dirt at Legacy 101, while construction crews were at Federal’s Lot 11 project on Santana Row before the end of the year.
• Sand Hill Properties purchases Cupertino’s Vallco Shopping Mall for $316 million with plans to tear down the mall and redevelop the site.
• One World Trade Center officially opens, replacing its predecessor 13 years after the September 11 attacks.
• The Republican Party retains control of the United States House of Representatives and regains control of the United States Senate during the November elections.
November
• Hudson Pacific purchases Equity Office’s Silicon Valley portfolio for $3.5 billion; the deal will finalize in the spring of 2015.
• ServiceNow leases Sobrato’s Lawson Lane project in Santa Clara, a project that stood vacant since its completion in 2012.
• Hunter/Storm LLC begins early site work on the first phase of its long-awaited Coleman Highline project, as the developer comes to an agreement with the city of San Jose to purchase the 23-acre site next to the new San Jose Earthquakes soccer stadium.
• Wall Street sees its worst week in three years as oil prices continue to collapse. The Dow Jones Industrial Average sheds 315 points, or 1.8%, to 17,280.
December

4 COLLIERS INTERNATIONAL | FEBRUARY 2015
Developments in the world economy in 2014 were something of a mixed bag, and overall 2014 was not a stellar year. The global economy grew only modestly, at around 3%, which is well below the pre-crisis annual average of 7%. The world’s second and third largest economies–China and Japan respectively–had disappointing years, and that was a chief contributor to the modest results.
On this side of the Pacific however, the news was better. The U.S. economy began 2014 with a slow start but ended on a high note. Looking back, 2014 will be remembered for the best hiring stretch the nation has experienced since the late 1990s boom for record auto sales and for the swift plunge in gasoline prices.
Here in the Silicon Valley, 2014 proved to be a robust year for the local economy. The Silicon Valley economy continues to lead the nation in matters of growth, income, innovation, and venture capital investments. Silicon Valley is still the largest technology hub in the nation and the anchor for the Bay Area. Technology firms in Santa Clara County employ more than 270,000 people, according to data released by the Milken Institute.
Consumer confidence continued to grow stronger in 2014. Impressed with an improving economy, American consumers are feeling more confident. The Conference Board said that its sentiment index climbed to 92.6 in December from 72.0 one year ago, exceeding expectations. This comes as no surprise since consumers had plenty to feel confident about in 2014. We saw the biggest employment gain in eight years, the continued rebound in housing, and record stock values that are boosting household wealth.
Gross domestic product, the broadest measure of goods and services produced across the economy, seemed to have a roller coaster year in 2014. During the first three months of the year, the economy grew at a seasonally-adjusted annual rate of 0.1%. This marked the second-worst quarterly performance since the recession ended in mid-2009, and a reduction of 2.9% from the final quarter of 2013. Fast
forward to the third quarter and the U.S. economy grew at a 5.0% clip, its quickest pace in 11 years and the strongest sign yet that growth has decisively shifted into higher gear.
The era of quantitative easing came to an end during 2014 as the Federal Reserve Board announced in October the decision to end the giant bond-buying stimulus program that had been in place for nearly six years. Since November 2008, the Federal Reserve has gone through three rounds of quantitative easing to help stimulate the economy. In a statement issued by the Federal Reserve commission about the decision, the Committee cites an “improvement in the outlook for the labor market since the inception of its current asset purchase program,” and “sufficient underlying strength in the broader economy to support ongoing progress toward maximum employment in a context of price stability.”
13.97% 12.74% 11.70%
9.30%
0.00%
5.00%
10.00%
15.00%
2011 2012 2013 2014
(10)
(5)
-‐
5
10
15
20
25
30
2010 2011 2012 2013 2014
Square Feet in Millions
Gross Absorp=on Net Absorp=on
Silicon Valley AvailabilityAll Product Types
Silicon Valley AbsorptionAll Product Types
The Economy
OBSERVATIONS AND FORECAST OBSERVATIONS AND FORECAST
COLLIERS INTERNATIONAL2014 - 2015 SILICON VALLEY | MARKET REPORT & FORECAST
OBSERVATIONS & FORECAST
5COLLIERS INTERNATIONAL | FEBRUARY 2015
It is still unclear to some analysts whether monetary policy caused the U.S. to strengthen, or whether the U.S. grew in spite of non-traditional monetary policy. Nonetheless, U.S. stocks have benefited from a better economy (lower unemployment, zero bound interest rates, consistent corporate earnings, etc.). In essence, the Federal Reserve assured the market that it would not let financial institutions fail, not allow a large scale recession, and would provide zero bound interest rates for a very long time. In total, these policies allowed corporate balance sheet restructuring, while companies got leaner by cutting costs and simultaneously using liquidity and low rates to buy back stocks.
The U.S. national debt hit $18 trillion for the first time in November 2014, greater than the economic output of the entire country. House Speaker John Boehner said Congress must take steps to pare back “a national debt that has Americans stealing from their children and grandchildren, robbing them of benefits that they will never see, and leaving them with burdens that will be nearly impossible to repay.” The national debt has soared nearly 70% since 2008, when it stood at just over $10.6 trillion.
Economists are expecting that U.S. consumer prices will increase in 2014; however, inflation is estimated to remain below the Federal Reserve’s target of 2.0%. The Fed downgraded its forecast in light of recent oil prices plummeting. They expect inflation to fall somewhere between 1.0-1.6% in 2015, and 1.7-2.0% in 2016. Policy makers also boosted their forecast for economic growth in 2015, estimating as much as 2.4% growth over the next year.
Today California has the largest budget surplus of any state in the nation, a projected $3.0 billion in 2014-15. According to the Legislative Analyst’s Office, it will grow to about $10.0 billion by 2017-18. This is a sign of significant progress for the once debt-ridden state. Alongside a healthier balance sheet, Californians voted to pass Proposition 2 on the November ballot, a measure that requires the
state to use extra revenues for rainy-day funding and to pay down liabilities.
The national unemployment rate fell to 5.6% in December, and the number of Americans working has finally surpassed its pre-recession high. This marks the first time that the unemployment rate has fallen below the 6% mark since July 2008. This is much lower than the Federal Reserve forecast for the year, yet many analysts warn that the unemployment rate is irrelevant because it doesn’t count those who have stopped looking for work or those who are still underemployed. Nevertheless, the economy added more than 252,000 jobs in December, which is higher than the monthly average of 224,000 jobs per month over the prior twelve-month period. 2014 posted the best year of hiring since 1999, adding more than 2.95 million jobs in the U.S.
In November, California recorded its lowest jobless rate since the early months of the Great Recession according to numbers released by the Employment Development Department. The unemployment rate in California fell to 7.2%, down from the recession-era high of 12.4% in February 2010. According to the Bureau of Labor Statistics, the state unemployment rate is 0.6% higher than the national average.
California added more than 344,000 new jobs during 2014, and nearly 30,000 of those were right here in Santa Clara County, according to figures released by the Bureau of Labor Statistics. In Santa Clara County, the number of jobless stood at 5.1% of the labor force in November, down from 6.2% one year earlier. According to data released by the California Employment Development Department, more than 18% of the job growth seen across the Bay Area in 2014 was within the high-tech sector.
The median income of a Silicon Valley household reached more than $94,000 according to data released by Joint Venture Silicon Valley.
At $94,572, the region’s median household income dwarfs the California Statewide $61,320 median, and the nationwide $53,291 median. In addition to above-average wages, the proportion of households in the Silicon Valley bringing in more than $150,000 per year has now reached more than 29%.
With the strengthening of economic conditions over the year, U.S. consumers seemingly racked up debt at the slowest pace in years. Total outstanding consumer credit, reflecting Americans’ debt outside of real-estate loans, expanded at 4.9%, the smallest monthly increase since November 2013. The slower rate signaled modest growth in both credit-card debt and in non-revolving credit such as auto and student loans.
Home sales nationally are estimated to continue their upward trajectory over the next two years; however, the pace of growth will cool to the 4.0-6.0% range, a rate more in line with income growth. Home sales in California are forecasted to rise by double-digit percentages in 2015, according to a report released by the California Association of Realtors.
According to the U.S. Census Bureau, permits issued for new homes in November 2014 were at a seasonally-adjusted annual rate of 1.0 million, down 0.2% from the previous year. Existing home sales were at a season-ally-adjusted annualized rate of 4.93 million in November, up 2.1% compared to 2013. The national median existing-home price for all housing types in November was $205,300, which is 5.0% above November 2013. This marks the 33rd consecutive month of year-over-year price gains.
Here in the Silicon Valley, many markets have already surpassed their 2007 peaks. The average home sales price in Santa Clara County rose by 11.4% year over year to $849,975 in 2014. The National Association of Realtors estimates that we will continue to see growth in the residential
OBSERVATIONS AND FORECAST
The U.S. national debt hit $18
trillion for the first time in
November 2014, greater than
the economic output of the
entire country. House Speaker
John Boehner said Congress
must take steps to pare back
“a national debt that has
Americans stealing from their
children and grandchildren,
robbing them of benefits
that they will never see, and
leaving them with burdens
that will be nearly impossible
to repay.”

6 COLLIERS INTERNATIONAL | FEBRUARY 2015
OBSERVATIONS AND FORECASTCOLLIERS INTERNATIONAL
2014 - 2015 SILICON VALLEY MARKET REPORT & FORECAST
market in 2015. Prices will continue to increase, but at a slower rate than witnessed in 2014.
Aggressive bond-buying by the Federal Reserve pushed the average rate on a 30-year mortgage near and below 4.0% for nearly all of 2012 and 2013. Coming into 2014, many analysts predicted rates to rise as high as the mid-5% range by the end of the year. Yet the average rate for a conventional 30-year, fixed rate mortgage stood at 3.9% towards the end of December, indicating that predictions were not on target. Again, going into 2015, the Mortgage Bankers’ Association predicts that mortgage interest rates will rise to 5% by the end of 2015.
2014 has been a year to remember in the U.S. IPO market. The U.S. led the world in number of deals, in capital raised, and in cross-border activity. Closing the year with 275 deals, this marks the highest number of listings since 2000, when 406 companies went public, and represents a 23% increase over 2013. The $85.3 billion raised in 2014 is 11% less than the $96.9 billion peak in 2000 and a 55% increase over the previous year. In what turned out to be the biggest IPO in history, Alibaba Group Holding Ltd. set a new bar for IPOs with its $22 billion U.S. listing in September. With Alibaba’s proceeds, the U.S. market saw more money raised by IPOs than in any year since the peak of the dot-com bubble in 2000, according to Dealogic.
Venture capitalists invested $48.3 billion in the U.S. during 2014, more than a 60% increase from total dollars invested during 2013. Software companies captured¬ 59% of total VC funding in 2014, totaling $19.8 billion in 1,799 deals. According to the MoneyTree report by PricewaterhouseCoopers, dollars invested in internet-specific companies and software companies reached the highest level since 2000. The Silicon Valley claimed nearly half of the total VC funding in the U.S. during 2014, totaling $23.4 billion invested during the year, nearly twice the $12.6 billion invested during 2013 according to the MoneyTree report. The
total number of deals in the Silicon Valley also increased by 7.4% to reach a total of 1,409 deals in 2014. The number of deals in the Silicon Valley made up 32.3% of the total U.S. deals during the year.
The U.S. stock market, as measured by the S&P 500, closed the year with a gain of 11.39%, and 13.68% percent when reinvested dividends are included. It was the third consecutive year that the market benchmark has risen by more than 10.0%. The Dow Jones Industrial Average closed up 7.5% for 2014, while the Nasdaq composite index ended up 13.4% at the close of the year.
Optimism among small- and mid-sized businesses have reached levels last seen during the pre-recession years of the early 2000s, and all indicators are pointing to continued growth. The Silicon Valley has measured sustainable growth over the past year and is expected to continue to measure gains in the coming years–both economic and in number of jobs. However the issues of transportation and housing affordability have lingered over this Valley for many years. Coupled with a tight job market
where tech employers struggle to find qualified workers, these challenges will continue to be major obstacles to new growth.
The Commercial Real Estate MarketSilicon Valley is in a groove. What does this mean as we peer into our 2015 crystal ball? First, it means that Colliers is in a groove of its own after hitting the mark on most of our predictions for 2014. It also means that our 2015 forecast is going to look something like 2014 actuals. Finally, the passage of time alone means that we are getting closer to the end of a cycle that has been especially good for Silicon Valley. Fortunately, our brokers are not seeing signals that the current cycle will come to an end in 2015, so Colliers’ forecast is decidedly optimistic once again, in spite of increasing whispers of a bubble.
With such a rosy outlook, the next question to ponder is whether the trend lines are flat or accelerating? Certainly, pricing continues to trend upward, and Colliers expects further growth in 2015. Despite an increase in gross absorption, net absorption was down in 2014-
Silicon Valley is in a
groove. What does this
mean as we peer into
our 2015 crystal ball?
First, it means that
Colliers is in a groove
of its own after hitting
the mark on most of
our predictions for 2014.
It also means that our
2015 forecast is going
to look something like
2014 actuals. Finally,
the passage of time
alone means that we
are getting closer to the
end of a cycle that has
been especially good for
Silicon Valley.
OBSERVATIONS AND FORECAST
0.0%
10.0%
20.0%
30.0%
40.0%
50.0%
60.0%
70.0%
1988 1989
1990 1991
1992 1993
1994 1995
1996 1997
1998 1999
2000 2001
2002 2003
2004 2005
2006 2007
2008 2009
2010 2011
2012 2013
2014
Office and R&D Absorption as a Percentage of Total
R&D Building Base as % of Total Building Base
R&D Gross Absorption as a % of Total Gross Absorption
Office Gross Absorption as a % of Total Gross Absorption
Office and R&D Absorption as a Percentage of Total

7COLLIERS INTERNATIONAL | FEBRUARY 2015
OBSERVATIONS AND FORECASTCOLLIERS INTERNATIONAL 2014 - 2015 SILICON VALLEY MARKET REPORT & FORECAST
but still higher than any prior year dating to 2006. This groove is expected to extend through 2015. With that said, a few market dynamics are at play that will impact the numbers in 2015: First, after bottoming-out in 2013, the trend of pre-existing space coming to market nudged upward in 2014. Second, warehouse space is going to get a boost from 761,173 square feet of leased, new construction that will be absorbed in 2015. Finally, nearly 3.90 million square feet of office absorption will be recorded in 2015 from projects currently under construction for users–a big jump from the 1.73-million square feet that was teed-up coming into 2014.
Colliers’ aggressive 2014 forecast was predicated upon sustained leasing momentum, coupled with more new construction to satisfy that demand, and a pipeline of pre-existing space coming to market that had dropped to a 25-year low. We only missed hitting the target dead-center because that last dynamic took a bigger bounce off bottom than we anticipated. So even though gross absorption exceeded forecast, net absorption fell short of the 6.0 million-square-foot occupancy gain that Colliers categorized as “optimistic, yet achievable.”
Gross absorption should be able to reach beyond the 24.0-million square foot threshold again in 2015, thanks in large part to the sustained demand for the 8.9 million square feet of new product under construction. With 4.66 million square feet—or more than 60%— of that new construction already slated for occupancy in 2015, could our 6.0 million-square-foot net absorption forecast come to fruition a year later than expected? As good as 2015 looks, we’d probably have to temper our enthusiasm and rate that likelihood this time around as “improbable, yet possible.”
The office market will carry the load again in 2015. In fact, it is not out of the realm of possibility for office gross absorption to tip the scales north of 10.0 million square feet for the first time in history. Consider that to be Colliers’ bold prediction for 2015. For it to happen, the Valley need only generate 6.1 million square feet of demand over and above the 3.9 million square feet of office space that is already slated for
absorption and occupancy in projects currently under construction. Net absorption is also positioned for a great year and should rise to 3.5 million square feet if the pipeline of pre-improved space coming to market is consistent with 2014 levels.
R&D product is clearly the ugly stepchild to office product in Silicon Valley, but in this market that’s still good enough to get asked to the dance. This is seen in absorption numbers that are decent on the gross side, though wanting on the net side. This increas-ingly-obsolete product type represents 66.8% of the total office/R&D building base, and ownerships are spending capital to upgrade these facilities to meet the demands of today’s office users. At the same time, other users are moving out of these types of properties into newer, office developments, thereby increasing available supply. Expect R&D gross absorption to be in the 8.5-9.0 million-square-foot range in 2015, with net absorption topping out at around 1.0 million square feet.
Silicon Valley’s industrial demand continues to outstrip its limited supply. Without any new stock coming on line to meet that demand, the lack of inventory will continue to suppress both net and gross absorption in the coming year. In addition, off-market, owner-user deals have been picked through and will be more difficult to find in 2015. It’s a shell game in this sector, with some businesses moving out of buildings, while others ramp up and seek new homes. Look for another 3.0 million square foot gross absorption year, with net absorption below 500,000 square feet.
Build a couple of new projects for the first time in 20 years, and suddenly the warehouse market is the hot ticket. Colliers accurately forecasted that The Crossings, Overton Moore’s 690,841 square foot warehouse development in Fremont, would be leased upon completion. That absorption will be recorded in 2015, and should be enough to lift warehouse gross absorption to 3.5 million square feet. With such high-profile users as Apple and Pivot Interiors filling that demand, other new projects will be quick to follow, slated for 2016 completion. For 2015, we should see warehouse occupancy grow by at least 750,000 square feet.
10
15
20
25
30
35
40
45
2001 2002 2003 2004 2005 2006 2007 2008 2009 2010 2011 2012 2013 2014 Squa
re F
eet i
n M
illio
ns
Improved Added Gross Absorption
Silicon Valley All Products -‐ Improved Added vs. Gross Absorp;on
Silicon Valley All Product
Date
Available VacantDirect
Available Occupied
DirectAvailableSublease
TotalCurrentAvailable
VacancyRate
AvailabilityRate
AvailableUnder
Construction
Current and Pending
Availability
4Q 2014 22,918,415 3,719,544 3,488,121 30,126,080 7.66% 9.30% 1,921,301 32,047,381
3Q 2014 25,363,101 4,630,087 3,490,145 33,483,333 8.51% 10.42% 1,954,582 35,437,915
2Q 2014 25,820,045 5,368,295 3,952,440 35,140,780 8.86% 10.98% 1,312,933 36,453,713
1Q 2014 27,437,276 5,037,843 4,370,694 36,845,813 9.41% 11.51% 1,239,813 38,085,626
4Q 2013 27,900,744 4,635,186 4,209,791 36,745,721 9.75% 11.70% 752,031 37,497,752
3Q 2013 29,124,514 5,329,017 4,209,307 38,662,838 9.96% 12.32% 859,193 39,522,031
2Q 2013 30,031,917 5,251,025 4,257,735 39,540,677 10.20% 12.56% 600,679 39,853,256
1Q 2013 31,958,000 4,559,513 4,274,208 40,791,721 10.89% 12.98% 885,909 41,677,630
Silicon Valley All ProductImproved Added vs. Gross Absorption
Absorption Breakdown - Silicon Valley1Q 2013 2Q 2013 3Q 2013 4Q 2013 1Q 2014 2Q 2014 3Q 2014 4Q 2014
Building Inventory: 314,305,284 314,770,785 313,929,125 314,126,923 320,025,204 320,095,084 321,229,922 324,073,802
Availability: 40,791,721 39,540,677 38,662,838 36,745,721 36,845,813 35,140,780 33,483,333 30,126,080
Absorption:
Gross 4,949,496 6,104,063 5,160,134 5,446,379 4,876,730 6,953,335 5,564,979 7,135,558
Net 1,310,059 2,670,060 1,175,579 564,359 -124,133 1,458,404 676,083 1,985,095
Effective Net 585,788 2,419,761 1,913,883 1,877,429 282,383 3,179,892 1,973,577 3,679,688
Completed
Construction: 318,000 1,055,719 481,576 639,727 465,283 246,000 345,802 692,937
# of Avails by Size
< 10K SF 2006 1844 1726 1666 1510 1377 1325 1218
10K to 29K SF 503 465 439 422 420 417 404 397
30K to 59 K SF 193 184 182 170 164 154 157 144
60K to 99K SF 122 126 126 123 124 119 112 92
100K SF + 45 44 44 47 53 50 45 40

8 COLLIERS INTERNATIONAL | FEBRUARY 2015
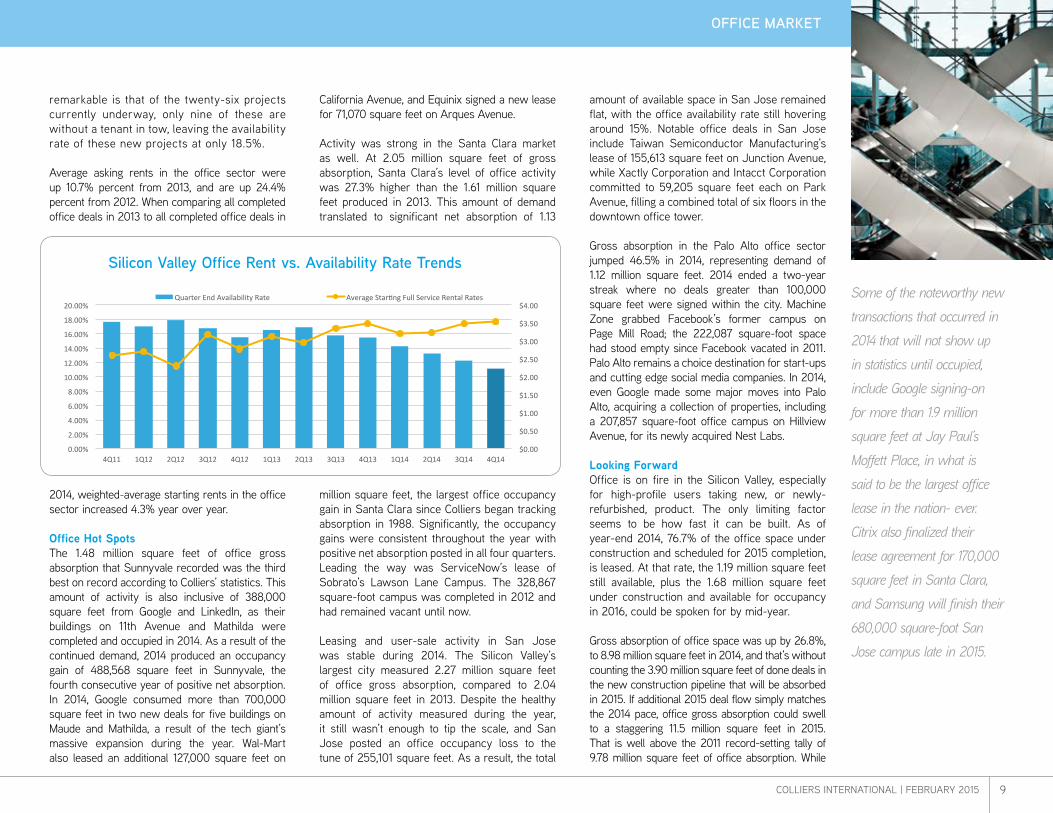
During 2014, office activity was strong in the Silicon Valley, registering a total of 8.97 million square feet of gross absorption. Year over year, office activity was up 26.7% from 2013. Total demand for office space in the Silicon Valley during 2014 was right on par with Colliers’ expectations and is the second largest amount of annual gross absorption recorded since Colliers began tracking absorption in 1988–trailing only the 9.78 million square feet of office gross absorption posted in 2011.
After three consecutive years of positive net absorption, the office sector extended its streak to four years with an occupancy gain totaling 2.02 million square feet. The Silicon Valley office market has now seen an occupancy gain totaling more than 7.4 million square feet since 2011. The amount of net absorption recorded in 2014 was slightly lower than Colliers’ forecasted 3.0 million-square-foot increase, but nonetheless is evidence of another good year for the office market. With more than a 2.0 million-square-foot occupancy gain, the Silicon Valley office market produced stellar results in 2014.
The office sector’s availability rate fell 442 basis points during 2014, closing the year at 11.1% overall. This dip in the office availability rate is in line with Colliers’ expectations and the sentiment of our brokers who find competition for quality space increasing with the tightening of the market. The last time the office availability rate was lower was during the first quarter of 2001, when it stood at 8.9%.
In 2014, the level of pre-improved office, “rollover” space that came onto the market measured 6.95 million square feet. This is a significant increase from the 4.88 million square feet measured the year prior. This increase in recycled supply indicates a slight shift as tenants held on to less space than in recent years. Regardless, the increased demand in the market indicates that even as tenants are moving out of space, they are increasing their footprint and not only remaining, but growing right here in Silicon Valley.
Construction and preleasing activity in the office sector remained strong in 2014. Another encouraging indicator for the office market is the preleasing activity ascribed to buildings either currently under construction or part of build-to-suit agreements. This has been a consistent trend in the Silicon Valley’s office market and we expect to see the impact of these transactions continue to occur throughout 2015 and 2016. During 2014, Colliers recorded 1.3 million square feet of office absorption that was due to users occupying build-to-suits and other new construction, for deals that were inked in earlier years, primarily 2013.
Colliers is now tracking more than 8.0 million square feet of commercial construction throughout the Silicon Valley, with even more slated to break ground in early 2015. Even more
Office GrooveSilicon Valley Availability Office Product
Silicon Valley AbsorptionOffice Product
17.66% 15.49% 15.49%
11.15%
0
2
4
6
8
10
12
2011 2012 2013 2014
Square Feet in Millions
(2)
-‐
2
4
6
8
10
12
2010 2011 2012 2013 2014
Square Feet in Millions
Gross Absorp>on Net Absorp>on
OFFICE MARKETOFFICE MARKET
OFFICECOLLIERS INTERNATIONAL
2014 - 2015 SILICON VALLEY | MARKET REPORT & FORECAST
9COLLIERS INTERNATIONAL | FEBRUARY 2015
remarkable is that of the twenty-six projects currently underway, only nine of these are without a tenant in tow, leaving the availability rate of these new projects at only 18.5%.
Average asking rents in the office sector were up 10.7% percent from 2013, and are up 24.4% percent from 2012. When comparing all completed office deals in 2013 to all completed office deals in
2014, weighted-average starting rents in the office sector increased 4.3% year over year.
Office Hot SpotsThe 1.48 million square feet of office gross absorption that Sunnyvale recorded was the third best on record according to Colliers’ statistics. This amount of activity is also inclusive of 388,000 square feet from Google and LinkedIn, as their buildings on 11th Avenue and Mathilda were completed and occupied in 2014. As a result of the continued demand, 2014 produced an occupancy gain of 488,568 square feet in Sunnyvale, the fourth consecutive year of positive net absorption. In 2014, Google consumed more than 700,000 square feet in two new deals for five buildings on Maude and Mathilda, a result of the tech giant’s massive expansion during the year. Wal-Mart also leased an additional 127,000 square feet on
California Avenue, and Equinix signed a new lease for 71,070 square feet on Arques Avenue. Activity was strong in the Santa Clara market as well. At 2.05 million square feet of gross absorption, Santa Clara’s level of office activity was 27.3% higher than the 1.61 million square feet produced in 2013. This amount of demand translated to significant net absorption of 1.13
million square feet, the largest office occupancy gain in Santa Clara since Colliers began tracking absorption in 1988. Significantly, the occupancy gains were consistent throughout the year with positive net absorption posted in all four quarters. Leading the way was ServiceNow’s lease of Sobrato’s Lawson Lane Campus. The 328,867 square-foot campus was completed in 2012 and had remained vacant until now.
Leasing and user-sale activity in San Jose was stable during 2014. The Silicon Valley’s largest city measured 2.27 million square feet of office gross absorption, compared to 2.04 million square feet in 2013. Despite the healthy amount of activity measured during the year, it still wasn’t enough to tip the scale, and San Jose posted an office occupancy loss to the tune of 255,101 square feet. As a result, the total
amount of available space in San Jose remained flat, with the office availability rate still hovering around 15%. Notable office deals in San Jose include Taiwan Semiconductor Manufacturing’s lease of 155,613 square feet on Junction Avenue, while Xactly Corporation and Intacct Corporation committed to 59,205 square feet each on Park Avenue, filling a combined total of six floors in the downtown office tower.
Gross absorption in the Palo Alto office sector jumped 46.5% in 2014, representing demand of 1.12 million square feet. 2014 ended a two-year streak where no deals greater than 100,000 square feet were signed within the city. Machine Zone grabbed Facebook’s former campus on Page Mill Road; the 222,087 square-foot space had stood empty since Facebook vacated in 2011. Palo Alto remains a choice destination for start-ups and cutting edge social media companies. In 2014, even Google made some major moves into Palo Alto, acquiring a collection of properties, including a 207,857 square-foot office campus on Hillview Avenue, for its newly acquired Nest Labs.
Looking ForwardOffice is on fire in the Silicon Valley, especially for high-profile users taking new, or newly-refurbished, product. The only limiting factor seems to be how fast it can be built. As of year-end 2014, 76.7% of the office space under construction and scheduled for 2015 completion, is leased. At that rate, the 1.19 million square feet still available, plus the 1.68 million square feet under construction and available for occupancy in 2016, could be spoken for by mid-year.
Gross absorption of office space was up by 26.8%, to 8.98 million square feet in 2014, and that’s without counting the 3.90 million square feet of done deals in the new construction pipeline that will be absorbed in 2015. If additional 2015 deal flow simply matches the 2014 pace, office gross absorption could swell to a staggering 11.5 million square feet in 2015. That is well above the 2011 record-setting tally of 9.78 million square feet of office absorption. While
Some of the noteworthy new
transactions that occurred in
2014 that will not show up
in statistics until occupied,
include Google signing-on
for more than 1.9 million
square feet at Jay Paul’s
Moffett Place, in what is
said to be the largest office
lease in the nation- ever.
Citrix also finalized their
lease agreement for 170,000
square feet in Santa Clara,
and Samsung will finish their
680,000 square-foot San
Jose campus late in 2015.
Silicon Valley Office Rent vs. Availability Rate Trends
$0.00
$0.50
$1.00
$1.50
$2.00
$2.50
$3.00
$3.50
$4.00
0.00%
2.00%
4.00%
6.00%
8.00%
10.00%
12.00%
14.00%
16.00%
18.00%
20.00%
4Q11 1Q12 2Q12 3Q12 4Q12 1Q13 2Q13 3Q13 4Q13 1Q14 2Q14 3Q14 4Q14
Silicon Valley Office Rent vs. Availability Rate Trend Quarter End Availability Rate Average StarFng Full Service Rental Rates
OFFICE MARKET

10 COLLIERS INTERNATIONAL | FEBRUARY 2015
Selected Cities Historical Availability Rate Trends - Office
it is tempting to throw out a forecast for 11.5 million square feet of office absorption in 2015, that number might be a stretch for a couple of reasons.
The current office availability rate is 11.1%, compared to 24.7% coming into 2011. The office vacancy rate is an even-tighter 8.7%. Though an 11.1% availability rate is enough to offer choices, finding the right space in the right market will be much harder in 2015. In addition, the average asking rate for available office space at the end of 2010 was $2.58 per square foot, full service. Today, the average asking rate across the Valley is $3.52 per square foot. While that may not scare away the likes of Apple or Google, other users may choose to renew existing leases at more favorable rates. And while speaking of Apple and Google, can their insatiable appetite for space continue at the same pace we witnessed in 2013-2014?
While 11.5 million square feet of office absorption might be a stretch, one factor supporting an eight-figure gross absorption year is that leasing activity is growing in some key, smaller-size ranges. There were 35 office deals absorbed in 2014 between 20,000-40,000 square feet, nearly double the 18 deals recorded in 2013. The delta grows further, to 55 deals in 2014 compared to 28 in 2013, when counting all office deals between 20,000-80,000 square feet. Even if it’s not enough to push gross absorption to 11.5 million square feet, this data points to growing demand from a broader base of users. For these reasons combined, we are tempering our office gross absorption forecast to a still-sizzling 10.5 million square feet.
Net absorption is always more difficult to forecast, as it also takes into consideration how much existing space is vacated during the year, which is sometimes unpredictable. The 6.96 million square feet vacated in 2014 is not alarming, but it was a hefty increase
from the 4.86 million square feet vacated in 2013. The increase was not so much a result of businesses consolidating, closing, or exiting the Valley, but rather a byproduct of a healthy market where vacancies are created by users that are moving in order to expand or upgrade. This increased pipeline of new vacancies will play a supporting role in preventing office net absorption from setting any records, but 3.5 million square feet is certainly within reach, and that is the office occupancy gain that Colliers is targeting for 2015. In spite of all the new construction adding to the office building base, this will still be enough to lower the office availability rate below 10% for the first time since 2001.
Rents continue to be driven up in the office sector, with the flight to quality still prevailing in spite of those increases. Average asking rents have escalated by more than 10% in each of the last two years, and another 10% bump is likely in 2015.
OFFICE LEASING & SALES ACTIVITY
SELECTED COLLIERS INTERNATIONAL TRANSACTIONS - 2014
PROPERTY ADDRESS SQUARE FEET LANDLORD/SELLER TENANT/BUYER TYPE
2215-2225 Lawson Lane, Santa Clara 328,867 Sobrato Development ServiceNow Lease
4440 El Camino Real, Los Altos 96,562 Travelers Insurance Linkedin, Inc Lease
675 East Middlefield Road, Mountain View 58,584 Zynga Symantec Sublease
2953 Bunker Hill Lane, Santa Clara 57,511 Bayland Corporation Inphi Corporation Renewal/Expansion
160 West Santa Clara Street, San Jose 52,259 DiNapoli Capital Partners ThreatMetrix, Inc. Renewal/Expansion
150 Almaden Boulevard, San Jose 36,772 Equus Capital Partners, LTD. Heritage Commerce Corporation Renewal
Gross absorption of office
space was up by 26.8%,
to 8.98 million square
feet in 2014, and that’s
without counting the
3.90 million square feet
of done deals in the new
construction pipeline that
will be absorbed in 2015.
If additional 2015 deal
flow simply matches the
2014 pace, office gross
absorption could swell to
a staggering 11.5 million
square feet in 2015.
OFFICE MARKET OFFICE MARKET
15.19%
18.73%
19.67%
19.49%
0% 5% 10% 15% 20% 25%
2014
2013
2012
2011
San Jose
15.26%
21.12%
18.64%
23.28%
0% 5% 10% 15% 20% 25%
2014
2013
2012
2011
Santa Clara
6.08%
14.61%
13.24%
9.65%
0% 5% 10% 15% 20%
2014
2013
2012
2011
Palo Alto
1.40%
2.12%
1.84%
3.91%
0% 2% 4% 6%
2014
2013
2012
2011
Cuper1no
7.40%
10.19%
8.36%
17.54%
0% 10% 20%
2014
2013
2012
2011
Sunnyvale
COLLIERS INTERNATIONAL 2014 - 2015 SILICON VALLEY
MARKET REPORT & FORECAST

11COLLIERS INTERNATIONAL | FEBRUARY 2015
OFFICE MARKET

12 COLLIERS INTERNATIONAL | FEBRUARY 2015
The Silicon Valley R&D sector continued to move forward in 2014. R&D demand increased 6.4% when compared to the levels measured in 2013, and closed the year with a solid 9.59 million square feet of gross absorption. This is now the third straight year that the R&D sector has recorded just below 10 million square feet of activity on an annual basis. R&D demand inches closer with each passing year to its pre-recession norm of more than 10 million square feet per annum. Totals recorded in 2014 were expected and spot-on with Colliers’ forecast of 9.0 million square feet for the year.
Total occupancy gain was of notable size in 2014; the R&D sector recorded its fourth straight year of more than one million square feet of positive net absorption, weighing in at 1.18 million square feet. This is, however, a 38.1% decrease from the occupancy gain recorded in 2013, and a 31.4% decrease from 2012. The R&D occupancy gain measured in 2014 was also weighted decidedly towards the end of the year, as going into the fourth quarter net absorption was measuring negative 30,497 for the first three quarters combined.
On the supply side, the pipeline of pre-improved R&D space that came on the market in 2014 increased, putting to bed a four-year streak of declining “rollover” space. The 8.4 million square feet that found its way back to the market in 2014 is an 18.3% increase from 2013. However, this increase can in part be attributed to the large amount of newly renovated space that came on line after shell improvements were completed during the year. This space, although vacant while under renovation, is not considered in vacancy statistics until the renovation is complete and it is shell-ready for tenant improvements.
With decent demand and a subdued pipeline of pre-improved space coming to market, the R&D availability rate continued to decline steadily in 2014. Total available R&D space dropped 18% in 2014, settling at a 10.9% overall availability rate at the close of the year. This translates to 16.5 million
square feet of available space in the Silicon Valley’s R&D market, the lowest total since the second quarter of 2001.
The weighted-average asking rent for R&D space in the final quarter of 2014 was $1.49 per square foot NNN, up 9.4% from the same period the prior year and 14.4% from the same period in 2012. This increase is in line with Colliers’ expectations of a 5-10% increase year over year. Additionally, the weighted-average starting rent for R&D deals done in 2014 increased 4.7% from the 2013 weighted-average start rate of $1.48 per square foot NNN, to $1.55 per square foot. This, too, is in line with Colliers, forecast for the year.
R&D Hot SpotsSan Jose is home to nearly one-third of the Silicon Valley’s R&D building base, and accounted for 31.9% of the total activity in 2014. The 3.06 million square
Silicon Valley Availability R&D Product
15.28% 13.67% 13.00%
10.95%
0
5
10
15
20
25
30
2011 2012 2013 2014
Square Feet in Millions
Silicon Valley AbsorptionR&D Product
(5)
(3)
-‐
3
5
8
10
13
15
2010 2011 2012 2013 2014
Square Feet in Millions
Gross Absorp>on Net Absorp>on
R&D Revival
R&D MARKETR&D MARKET
R&D MARKETCOLLIERS INTERNATIONAL
2014 - 2015 SILICON VALLEY | MARKET REPORT & FORECAST

13COLLIERS INTERNATIONAL | FEBRUARY 2015
feet of leasing and user-sale activity in 2014 was a 34.4% increase from the 2013 total of 2.28 million square feet. As a result of this renewed activity, San Jose posted an R&D occupancy gain of 875,748 square feet in 2014, accounting for 74% of the total occupancy gain in the Silicon Valley R&D market during the year. Notable transactions in San Jose included Vanderbend Manufacturing’s lease of 207,006 square feet on Orchard Parkway; Spansion signed on for 124,592 square feet on Ridder Park Drive, and Jabil Circuits expanded into an additional 102,114 square-foot space on San Ignacio Avenue.
Sunnyvale posted modest results in 2014. R&D gross absorption picked up by nearly 12% in Sunnyvale from 1.05 million square feet in 2013 to 1.17 million square feet in 2014. This ends a three-year streak of declining R&D activity in Sunnyvale. Still, Sunnyvale generated an occupancy loss measuring 94,199 square feet for the year. Total available R&D space in Sunnyvale is hovering around the 1.89 million-square-foot mark, and the city’s R&D availability rate remained below 10% for the third consecutive year. Average asking rates in Sunnyvale have increased 8.3% since 2013 and 19.8% since 2012, to rest at $2.10 per square foot, NNN. This is the first time since December 2001 that average R&D asking rates have surpassed the two-dollar mark.
Fremont recorded a strong amount of user activity during 2014 with 2.1 million square feet of R&D gross absorption. This is an 22.8% increase from activity measured during 2013, and higher than its 10-year average of 1.6 million square feet of annual activity. Something of note was that in 2014, no deals greater than 100,000 square feet were recorded in Fremont’s R&D market. This now marks the second year in a row which Fremont has failed to snag a six-figure square footage deal in the R&D or office sector. Mentor Graphics purchased a 94,439 square-foot building on
Bayside Parkway, and Compass Components leased 68,600 square feet on Warm Springs Boulevard, to highlight the year.
Activity was mild during 2014 for R&D space in Mountain View, owing primarily to the lack of available inventory. Posting 737,570 square feet of R&D gross absorption, this is a 30.4% decrease from the prior-year total. Despite the decrease in overall activity, it was enough to lead the way for an occupancy gain of 87,091 square feet. Triniti Corporation leased 67,000 square feet on Ravendale Drive, and Tango signed on for 53,361 square feet on Ellis Street. Total available R&D space in Mountain View is only 318,942 square feet; this amount of space translates to a 2.3% availability rate, and is the lowest level of available space in Mountain View since December 2000.
Looking ForwardSince 2005, Silicon Valley’s R&D building base has dropped from a peak of 160.4 million square feet, to 151.5 million square feet. Most of this is due to demolition or redevelopment of obsolete facilities. Occasionally, Colliers re-categorizes existing R&D buildings to office, but most of the existing R&D building base
does not have the parking, or other physical characteristics to merit such recategorization. Still, according to a Colliers survey done at this time last year, we estimate that 80% of the space we call R&D is being used in an office capacity. The fact is Silicon Valley would be better served if half of the existing R&D building base was immediately converted to office.
What does this mean when looking at the R&D data and forecasting forward? It means that conflicting forces are at work that both push and pull on deal activity in this sector. The bulk of the demand from technology users is clearly for office space, and that product type continues to receive the lion’s share of attention–frequently from users coming out of R&D buildings. On the other hand, existing R&D product, especially when upgraded, offers a suitable and affordable alternative, especially for growing companies in a vibrant economy. The end result is that the overall absorption figures are good, but not nearly what they were in times past, and not always consistent or predictable.
R&D activity increased by 6.4% in 2014, but space that was vacated during the year
The bulk of the demand
from technology users is
clearly for office space, and
that product type continues
to receive the lion’s share of
attention–frequently from users
coming out of R&D buildings.
On the other hand, existing
R&D product, especially when
upgraded, offers a suitable and
affordable alternative, especially
for growing companies in a
vibrant economy.
Silicon Valley R&D Rent vs. Availability Rate Trends
$0.00
$0.20
$0.40
$0.60
$0.80
$1.00
$1.20
$1.40
$1.60
$1.80
0.00%
2.00%
4.00%
6.00%
8.00%
10.00%
12.00%
14.00%
16.00%
18.00%
4Q11 1Q12 2Q12 3Q12 4Q12 1Q13 2Q13 3Q13 4Q13 1Q14 2Q14 3Q14 4Q14
Silicon Valley R&D Rent vs. Availability Rate Trend Quarter End Availability Rate Average StarEng NNN Rental Rates
R&D MARKET

14 COLLIERS INTERNATIONAL | FEBRUARY 2015
also increased, by 18.4%. In some part, more space came available because ownerships had acquired, and were spending time, upgrading older, vacant buildings. The investment is paying off, but it is competitive and frequently a shell game of tenant movement from one R&D building to another. Net absorption was 11.4% of the gross absorption tally in the R&D sector, while it was 22.5% of gross absorption in the office sector. This dynamic is likely to continue in 2015, meaning that it will take a very strong year of R&D leasing to offset movement out of R&D product by others.
Gross absorption of R&D space exceeded 1.89 million square feet in all four quarters of 2014, and has consistently been above that figure
since the second quarter of 2009. Activity has been more than 2.8 million square feet in three of the last eight quarters. The average activity level per quarter in 2014 was nearly 2.4 million square feet, which establishes a reasonable benchmark when looking ahead to 2015. The longer trend does not suggest sustained upward movement. R&D activity is about the same as it was in 2012, and well behind the 12.4 million square feet recorded in 2011. We expect to see a continuation of up-and-down quarters in this sector, with total activity above 9.0 million square feet in 2015.
As mentioned earlier, the pipeline of space being vacated in this sector is on the rise, as users shift out of older R&D buildings and
into renovated R&D product or newer office buildings. Although net absorption was positive in 2014, most of that occurred in Q4, and two of the year’s four quarters produced an R&D occupancy loss. This same push and pull is likely to occur in 2015, and net absorption is expected to top out at around 1.0 million square feet. Anticipate a year-end availability rate in this sector of approximately 10.5%.
The average asking rent for available R&D space has been increasing at a fairly consistent pace, and Colliers anticipates that pace will continue. Rents are likely to move upward by 5% in 2015, to an average asking rate of approximately $1.55 per square foot.
R&D LEASING & SALES ACTIVITY
SELECTED COLLIERS INTERNATIONAL TRANSACTIONS - 2014
PROPERTY ADDRESS SQUARE FEET LANDLORD/SELLER TENANT/BUYER TYPE
4209 Technology Drive, Fremont 129,883 Inland American Hewlett-Packard Renewal
680 & 840 West California Avenue, Sunnyvale 127,262 Sunnyvale Business Park LLC Wal-Mart Stores, Inc. Lease
2861 Scott Boulevard, Santa Clara 109,552 Rockpoint Group & Presidio Investments Roche Molecular Systems Inc. Lease
892-888 Ross Drive, Sunnyvale 95,557 Hines Interests, LP Proofpoint, Inc. Renewal/Expansion
3003 Bunker Hill Lane, Santa Clara 73,145 TMG Partners Jasper Technologies Lease
400 Kato Terrace, Fremont 51,289 IndCor Properties Aehr Test Systems Renewal
R&D MARKETCOLLIERS INTERNATIONAL
2014 - 2015 SILICON VALLEY MARKET REPORT & FORECAST
Selected Cities Historical Availability Rate Trends - R&D
15.76%
16.65%
15.62%
18.42%
10% 15% 20%
2014
2013
2012
2011
San Jose
8.14%
9.23%
8.84%
12.68%
0% 2% 4% 6% 8% 10% 12% 14%
2014
2013
2012
2011
Sunnyvale
12.70%
12.71%
14.14%
14.53%
9% 12% 15%
2014
2013
2012
2011
Santa Clara
18.46%
24.25%
24.35%
23.56%
0% 5% 10% 15% 20% 25% 30%
2014
2013
2012
2011
Fremont
2.33%
5.02%
8.30%
5.84%
0% 2% 4% 6% 8% 10%
2014
2013
2012
2011
Mountain View
Gross absorption of R&D
space exceeded 1.89
million square feet in all
four quarters of 2014,
and has consistently been
above that figure since the
second quarter of 2009.
Activity has been above
2.8 million square feet
in three of the last eight
quarters. The average
activity level per quarter
in 2014 was nearly 2.4
million square feet, which
establishes a reasonable
benchmark when looking
ahead to 2015.

15COLLIERS INTERNATIONAL | FEBRUARY 2015
R&D MARKET

16 COLLIERS INTERNATIONAL | FEBRUARY 2015
Silicon Valley’s industrial sector was seemingly stable throughout 2014. Activity was up slightly from 2013. Measuring an 8.0% increase, the Silicon Valley tallied 3.19 million square feet of gross absorption during 2014. This was a return to surpassing the 3.0 million-square-foot threshold, after gross absorption had dropped to 2.9 million square feet in 2013. Industrial gross absorption has now exceeded 3.0 million square feet in five out of the last six years.
The industrial availability rate has hovered in the 5.0% range since late 2013 and continued to do so throughout 2014. With total available industrial space in the Silicon Valley not surpassing 3.8 million square feet for more than two years, this significantly limits the options for tenants. As the industrial numbers fell flat during 2014–especially on the net absorption side of the equation–it was due in a large part to the lack of desirable space on the market. When quality space did become available, it didn’t sit for long.
By year-end, the industrial sector recorded only 77,746 square feet of positive net absorption, a whopping 89.5% decrease from the occupancy gain of 746,165 square feet in 2013. Weighing heavily in those results and in the results going forward, is the fact that the available inventory has become so impacted that it is nearly impossible to effect any significant occupancy gain without new development, and there is no new development to speak of in this product category. As a result, in three of the four quarters this year, industrial net absorption was slightly in the red. It was only during the third quarter that the industrial market measured a gain, to the tune of 237,628 square feet, and that was enough to generate positive net absorption for the year.
The amount of pre-improved industrial space added to available supply totaled 3.1 million square feet in 2014. This is a 40.6% increase from the record-low pipeline of pre-improved space that came available during 2013. In spite of the large percentage increase, that is not a large amount
of rollover when looking at this product segment historically. In all likelihood, it is also not a trend that is expected to continue or grow in 2015.
The industrial market is so impacted that it plays havoc on rental-rate averaging. The small amount of inventory means that the market set for analysis is small; inferior quality, lower-rent space tends to dominate the available set, and those spaces languish on the market for a longer period of time, further exerting downward pressure on averages. When the occasional higher-quality, higher-rent space comes on the market, it leases quickly and is not a part of the data set for long, if at all. As a result, the numbers suggest that average asking rents remained relatively flat in this product category in 2014. But when examining specific multi-tenant properties, some of those asking rates increased by 10-20% during 2014. When
Silicon Valley Availability Industrial Product
Silicon Valley AbsorptionIndustrial Product
8.47% 7.70%
5.76% 5.23%
0
1
2
3
4
5
6
2011 2012 2013 2014
Square Feet in Millions
(1)
-‐
1
2
3
4
5
2010 2011 2012 2013 2014
Square Feet in Millions
Gross Absorp=on Net Absorp=on
INDUSTRIAL MARKETINDUSTRIAL MARKET
Industrial Logjam
INDUSTRIALCOLLIERS INTERNATIONAL
2014 - 2015 SILICON VALLEY | MARKET REPORT & FORECAST

17COLLIERS INTERNATIONAL | FEBRUARY 2015
comparing average start rents for deals closed, weighted-average start rents were up by 11.3% in 2014, from $0.62 per square foot to $0.69 per square foot, NNN. Suffice it to say, rents were up in the industrial category during 2014, by 10% or more, depending on the submarket.
Industrial Hot SpotsThe 1.21 million square feet of industrial gross absorption San Jose produced in 2014 was within 1.0% of the activity level recorded in 2013. San Jose ended the year with 202,438 square feet more industrial space on the market than at the beginning of the year. That slight increase resulted in a 94 basis-point increase in San Jose’s industrial availability rate during the year, to a still-low, 5.4%, up from 4.4% from the year before. Notable deals in San Jose during 2014 included the County of Santa Clara’s lease of 73,876 square feet on Senter Road, and Don van Nortwick’s owner-user purchase of a 58,510 square-foot building on Olinder Court.
Santa Clara’s industrial sector struggled to produce the results that the city has been accustomed to in previous years. At the close of 2014, Santa Clara had only generated 460,357 square feet of industrial gross absorption. However, as noted before, the low level of activity can be attributed to the lack of space
available. The 2.9% availability rate in Santa Clara is the lowest recorded since mid-2000. The two largest new deals in Santa Clara during 2014 were user sales: Corporate Sign Systems purchased a 31,320 square-foot building on De La Cruz Boulevard, and Good Foods, LLC purchased 23,295 square feet on Norman Avenue.
After making strides to recover from the Solyndra fallout during 2013, Fremont finished with another strong year in 2014, recording 806,844 square feet of industrial gross absorption. Net absorption was also considerable, contributing an occupancy gain of 429,920 square feet. Fremont’s industrial availability fell by 19.2% during 2014, closing the year at an 8.5% availability rate. A significant portion of the occupancy gain measured during the year was due to the completion of Thermo Fisher’s new 275,000 square-foot facility on Fremont Boulevard, adding significantly to the
city’s industrial occupancy. Another noteworthy transaction was South Bay Solutions’ lease of 59,000 square feet on Centralmont Place.
Making small but worthy contributions to the activity levels in the Silicon Valley’s industrial sector during 2014 were Morgan Hill and
Gilroy. The Valley’s southernmost cities posted occupancy gains of 22,251 and 46,644 square feet respectively, marking the third straight year that both submarkets have posted positive occupancy gains. Year over year, the industrial availability rate in Morgan Hill has fallen from 3.7% in 2013, to 2.2% at the end of 2014. Likewise, Gilroy’s industrial sector measured a decrease in its availability rate, from 9.6% to 5.5% over the course of 2014.
Looking ForwardLooking at the broader industrial picture in Silicon Valley, the warehouse product category is grabbing all the headlines with several successful new developments. Meanwhile, demand for industrial/manufacturing space remains consistent, albeit limited due to extremely tight market conditions. If there is a trend worth noting in Silicon Valley’s industrial sector, it might be that it is time to figure out how to build some new product. Certainly land prices make this a difficult, if not impossible proposition. But like we are witnessing in the warehouse sector, if you can pencil it out and build it, they will come.
With an availability rate of 5.2%, the industrial market is as tight as a drum. Brokers are picking up the phone and calling owners of off-market buildings, just to find out if those owners might consider a sale to a future owner-user or investor. Sales prices and lease rates are reaching unprecedented highs. The lack of alternative supply often means that existing users are unable or unwilling to relocate, even if they require more space or desire a new location for any other reason. In spite of prevailing market conditions that are very strong, all of these signs point to a flat year for both net and gross absorption in 2015. This is almost entirely owing to the lack of available inventory.
The amount of industrial space available today is nearly identical to the amount that was
Silicon Valley Industrial Rent vs. Availability Rate Trends
$0.40
$0.47
$0.54
$0.61
$0.68
$0.75
$0.82
0%
2%
4%
6%
8%
10%
12%
4Q11 1Q12 2Q12 3Q12 4Q12 1Q13 2Q13 3Q13 4Q13 1Q14 2Q14 3Q14 4Q14
Silicon Valley Industrial Rent vs. Availability Rate Trend Quarter End Availability Rate Average StarFng NNN Rental Rates
INDUSTRIAL MARKET
With an availability rate of
5.2%, the industrial market
is as tight as a drum.
Brokers are picking up the
phone and calling owners
of off-market buildings, just
to find out if those owners
might consider a sale to
a future owner-user or
investor. Sales prices and
lease rates are reaching
unprecedented highs. The
lack of alternative supply
often means that existing
users are unable or
unwilling to relocate, even
if they require more space
or desire a new location for
any other reason.

18 COLLIERS INTERNATIONAL | FEBRUARY 2015
available one year ago. This suggests to us that gross absorption is likely to be similar as well, since demand is a relative constant. When you break down available supply into various size categories, not much has changed either. There are only 13 industrial spaces available in all of Silicon Valley greater than 40,000 square feet. Last year at this time, there were 10 such vacant industrial spaces available. This means that most of the absorption will once again have to come from an accumulation of small deals. Contributing to our conservative 2015 forecast, 2014 included a 275,000 square foot build-to-suit, and no such animal exists in the new year.
All signs point to 3.0 million square feet of industrial gross absorption in 2015, and that will be a stretch. It is a stretch because the pipeline of industrial space being vacated in 2015 might
not be as much as 2014, when 3.12 million square feet was vacated during the year. Compare that to 2013, when only 2.22 million square feet was vacated. With 3.0 million square feet of demand, and only 2.22 million feet of added supply to help meet that demand, the industrial availability rate drops below 4.0%. In this product category, that’s really scraping the bottom of the barrel if you are a tenant looking for space.
Colliers is forecasting a flat net absorption year for industrial space. In reality, whether absorption is positive or negative may hinge on when deals close and when other spaces come available. Either way, with no new development to fuel occupancy gains, and a relatively small base of available stock, there will be a reshuffling of cards in the deck, and at the end of the year there will be a little less industrial space available
than now. At the most, look for 500,000 square feet of net absorption, which would lower the industrial availability rate to 4.4%.
Much of the available industrial space is increasingly older, more poorly located, or in worse condition than available inventory one year ago. Colliers’ data shows that asking rents over the last year have remained flat, but that is an apples-to-rotten-apples comparison. Higher-rent, higher-quality industrial spaces are not available long enough to always figure into monthly statistics. When examining specific industrial business parks and comparing their asking rates from one year ago to today, we discover that those rents have increased by more than 10%, and that is our expectation for 2015 as well.
INDUSTRIAL LEASING & SALES ACTIVITY
SELECTED COLLIERS INTERNATIONAL TRANSACTIONS - 2014
PROPERTY ADDRESS SQUARE FEET LANDLORD/SELLER TENANT/BUYER TYPE
140 San Pedro Avenue, Morgan Hill 88,351 Johns Family Trust Airtronics Lease
48133 Warm Springs Boulevard, Fremont 68,000 IndCor Properties Compass Components Lease
37399 Centralmont Place, Fremont 59,000 Galgon Trust South Bay Solutions Lease
785 Walsh Avenue, Santa Clara 40,000 Barnhart Construction Co. Redwood Electric Lease
1855-1885 Norman Avenue, Santa Clara 23,295 Jeff Miller Good Foods, LLC User Sale
2240 Paragon Drive, San Jose 20,710 Alred Investments LLC West Coast Cranes Lease
INDUSTRIAL MARKETCOLLIERS INTERNATIONAL
2014 - 2015 SILICON VALLEY MARKET REPORT & FORECAST
When you break down
available supply into various
size categories, not much
has changed either. There
are only 13 industrial spaces
available in all of Silicon
Valley greater than 40,000
square feet. Last year at this
time, there were 10 such
vacant industrial spaces
available. This means that
most of the absorption will
once again have to come
from an accumulation of
small deals.
Selected Cities Historical Availability Rate Trends - Industrial
5.37%
4.40%
5.64%
7.98%
0% 2% 4% 6% 8% 10%
2014
2013
2012
2011
San Jose
2.96%
2.94%
4.20%
5.97%
0% 2% 4% 6% 8%
2014
2013
2012
2011
Santa Clara
8.51%
11.19%
16.30%
7.04%
0% 3% 6% 9% 12% 15% 18%
2014
2013
2012
2011
Fremont
3.01%
6.70%
6.63%
15.58%
0% 3% 6% 9% 12% 15%
2014
2013
2012
2011
Sunnyvale
0.91%
2.49%
4.03%
3.89%
0% 2% 4% 6%
2014
2013
2012
2011
Mountain View

19COLLIERS INTERNATIONAL | FEBRUARY 2015
INDUSTRIAL MARKET

20 COLLIERS INTERNATIONAL | FEBRUARY 2015
WAREHOUSE MARKET
The Silicon Valley warehouse market recorded another strong year in 2014. With robust demand totaling 2.76 million square feet of gross absorption, this is the highest level of warehouse activity recorded since 2006, and is in line with Colliers’ 2.5 million square foot forecast for the year.
After ending a five-year streak of negative net absorption in 2013, the warehouse market attained its second straight year of positive net absorption in 2014. The total occupancy gain in the warehouse sector measured 711,671 square feet during 2014 and is a welcome victory for Silicon Valley’s warehouse sector. Available warehouse space decreased by 38.3% during 2014 to finish the year at 2.06 million square feet available throughout the Silicon Valley. This is the lowest amount of available space measured since the fourth quarter of 2000. The overall availability rate now sits at 5.5% in the warehouse sector, the first time that the availability rate has dipped below 6.0% since 2006.
Also contributing to the warehouse sector’s positive year was the low level of pre-improved, or rollover space, that came onto the market. In 2014, 2.05 million square feet of rollover space was vacated, a slight increase from the year before, but not enough to satisfy the appetite of warehouse demand from both traditional and non-traditional users.
Speaking of available supply, 2014 was a year to remember in the warehouse sector for another reason. For the first time in nearly 20 years, developers reinvested in Silicon Valley’s warehouse base by breaking ground on new construction. A decision that was questioned by some as risky, turned out to be a solid bet for those who took the plunge. Each project that started construction during the year, snagged tenants well before the project’s completion date. Most notable however, are the three deals signed at Overton Moore’s speculative warehouse project in Fremont, on the I-880 Corridor. Only seven months after starting construction, Living Spaces, Apple, and Pivot Interiors
all inked long-term leases totaling a combined 587,877 square feet, representing 85.1% of the entire speculative development. However, the effect of these transactions will not be seen in absorption until the project is completed in early 2015.
The increase in activity did bring about an increase in warehouse rents. Comparing deals done in the fourth quarter of 2013 to the same quarter of 2014, weighted-average start rents were up 20.4% year over year. Average asking rates also experienced an increase during 2014, ending the year 16.5% higher than at the end of 2013, at $0.64 per square-foot, NNN.
Warehouse Hot SpotsFor the second year in a row, San Jose contributed the largest increase in warehouse occupancy during the year. 2013 had put to bed a five-year streak of
Silicon Valley Availability Warehouse Product
Silicon Valley AbsorptionWarehouse Product
10.75% 11.83%
8.75%
5.54%
0
1
2
3
4
5
2011 2012 2013 2014
Square Feet in Millions
(1)
(1)
-‐
1
1
2
2
3
3
2010 2011 2012 2013 2014
Square Feet in Millions
Gross Absorp<on Net Absorp<on
WAREHOUSE MARKET
Warehouse Builds It
COLLIERS INTERNATIONAL2014 - 2015 SILICON VALLEY | MARKET REPORT & FORECAST
WAREHOUSE
21COLLIERS INTERNATIONAL | FEBRUARY 2015
WAREHOUSE MARKET
occupancy loss for San Jose that had dated back to 2008. Now, San Jose seems to have turned the corner, recording another year of occupancy gain to the tune of 250,545 square feet. Total gross absorption in San Jose’s warehouse sector measured 920,000 square feet in 2014. San Jose also claimed one of the year’s warehouse deals greater than 100,000 square feet. Eagle Recycling leased 120,000 square feet on Alma Street, while Federal Express leased 72,987 square feet of warehouse space on Junction Court.
Fremont posted a warehouse occupancy gain of 119,487 square feet. Although this was down slightly from the occupancy gain during 2013, it was the third year in a row that Fremont has posted positive net absorption. Gross absorption increased during 2014, measuring 663,277 square feet for the year. Fremont was also home to the largest new warehouse deal during 2014, and two deals in excess of 100,000 square feet. Synnex Corporation leased 177,041 square feet on Auto Mall Parkway during the third quarter, and Quanta Computer leased 125,501 square feet on Industrial Boulevard.
Milpitas reclaimed its place in the warehouse market during 2014, accounting for a total occupancy gain of 304,666 square feet–nearly twice the 155,488 square feet recorded in 2013. Gross absorption was also up year over year in Milpitas. Colliers recorded 559,740 square feet of user activity in 2014, up 37.9% from 2013 and 65.3% from 2012. Notable warehouse deals in Milpitas include DGA Services’ lease of 142,783 square feet, and Consolidated Electric Distributors signing on for 82,105 square feet, both on Montague Expressway.
Santa Clara contributed to the overall occupancy gain in the Silicon Valley warehouse market as well, tallying 27,949 square feet of positive net absorption. However small, the occupancy gain in Santa Clara is a result of increased activity during the year. Gross absorption measured
200,589 square feet, up 80.4% from 2013. Contributing to the occupancy gain in Santa Clara’s warehouse market, U-Haul purchased a 119,808 square-foot building on Laurelwood Avenue, and Paris Baguette Bakery leased 35,000 square feet on Thomas Road.
Looking ForwardWhen Overton Moore announced the development of 690,841 square feet of new, speculative warehouse space, it raised a few eyebrows. Our forecast was that it would be leased before it was finished, and that panned out. Others followed in
Overton Moore’s footsteps. Panattoni broke ground on a 173,296 square foot warehouse building, also in Fremont, and JFC International leased that building and plans to take occupancy in the second quarter. Most recently, Westcore announced that it will lease 300,000 square feet of warehouse space to Tesla Motors in a speculative development on Kato Road that is just getting started as our report went to press.
Fremont is the beneficiary of these three warehouse developments, and 865,137 square
feet of gross absorption will be realized in 2015, with Tesla’s absorption stretching to 2016. However, these new developments, while needed, do not necessarily portend a new wave of warehouse development coming to Silicon Valley. Few properties are available that pencil out for warehouse development, and even fewer in the core areas of Silicon Valley. Colliers’ Silicon Valley reporting extends only to Fremont in the East Bay, so other new warehouse developments to the north are not included in this geographic report and forecast.
Setting aside these new deals that will be absorbed in 2015, 2014 was a good year regardless. The 2.76 million square feet of warehouse gross absorption was the most since 2006. Six deals were recorded above 100,000 square feet, versus three in 2013. Although there is a similar amount of warehouse space available today as there was coming into 2014, there are fewer large blocks. Currently, there are nine warehouse spaces available that can accommodate a 60,000-square-foot requirement, compared
When Overton Moore
announced the
development of 690,841
square feet of new,
speculative warehouse
space, it raised a few
eyebrows. Our forecast
was that it would be leased
before it was finished,
and that panned out.
Others followed in Overton
Moore’s footsteps. Panattoni
broke ground on a 173,296
square foot warehouse
building, also in Fremont,
and JFC International
leased that building and
plans to take occupancy in
the second quarter.
Silicon Valley Warehouse Rent vs. Availability Rate Trends
$0.00
$0.10
$0.20
$0.30
$0.40
$0.50
$0.60
$0.70
0%
2%
4%
6%
8%
10%
12%
14%
4Q11 1Q12 2Q12 3Q12 4Q12 1Q13 2Q13 3Q13 4Q13 1Q14 2Q14 3Q14 4Q14
Silicon Valley Warehouse Rent vs. Availability Rate Trend Total Direct Available Avg. StarGng Rate:

22 COLLIERS INTERNATIONAL | FEBRUARY 2015
WAREHOUSE MARKETCOLLIERS INTERNATIONAL
2014 - 2015 SILICON VALLEY MARKET REPORT & FORECAST
Currently, there are
nine warehouse spaces
available that can
accommodate a 60,000-
square-foot requirement,
compared to sixteen that
were available at this
time last year. Likewise,
only two existing spaces
are available above
100,000 square feet,
versus seven availabilities
one year ago. This lack of
available supply in larger
blocks will be a limiting
factor as it relates to
absorption in 2015.
to sixteen that were available at this time last year. Likewise, only two existing spaces are available above 100,000 square feet, versus seven availabilities one year ago. This lack of available supply in larger blocks will be a limiting factor as it relates to absorption in 2015.
Without the 761,173 square feet of warehouse absorption already penciled-in for 2015 (or 864,092 square feet counting the remaining available space at The Crossings), we would anticipate gross absorption for 2015 topping out at 2.5 million square feet. Lack of available space alternatives could lower that estimate to 2.0 million square feet. Adding the absorption coming from the Overton-Moore and Panattoni projects, Colliers expects warehouse gross
absorption to extend beyond 3.0 million square feet, to perhaps 3.3 million square feet, which would be the most since 2005.
As best Colliers can determine, only 81,587 square feet will be vacated by Apple, Pivot Interiors, Living Spaces, and JFC International, when they move into completed projects in 2015. What that means is that these deals alone will generate warehouse net absorption in excess of 530,000 square feet–not a bad way to jump start the year. Beyond that, the warehouse sector faces the same obstacles as the industrial sector, in that the current availability rate is only 5.5%. To complicate matters further, there are very few large spaces left on the market. For that reason, Colliers is
not anticipating a great deal of net absorption beyond the aforementioned 530,000 square feet. Look for 750,000 to 1.0 million square feet of net absorption of warehouse space, which would be enough to lower the warehouse availability rate to approximately 4.5%.
The average asking rent for warehouse space has increased $0.10 per square foot over the last two years, or about 9.3% per year. With all of the new space soon to be leased, and given the hodge-podge of remaining space available, the resulting data is likely to show a flattening of average asking rents, with an annualized increase approaching 5% overall. But new projects coming out of the ground are likely to push the bar higher.
WAREHOUSE LEASING & SALES ACTIVITY
SELECTED COLLIERS INTERNATIONAL TRANSACTIONS - 2014
PROPERTY ADDRESS SQUARE FEET LANDLORD/SELLER TENANT/BUYER TYPE
925-935 McLaughlin Avenue, San Jose 194,536 Morgan Stanley Real Estate Legacy Transportation Services Renewal
5555 Auto Mall Parkway, Fremont 177,041 Lifestyles Furniture Rentals Synnex Corporation Lease
500 Luchessa Avenue, Gilroy 164,021 Jeff Barnes, Lee Evans, Myron Zimmerman Epic Wines User Sale
1065 Montague Expressway, Milpitas 142,783 Fleming Business Park, LLC DGA Services Lease
45101-45169 Industrial Drive, Fremont 125,501 PS Business Parks Quanta Computer, Inc. Lease
205 East Alma Street, San Jose 120,000 Rock Tenn Eagle Recycling Sublease
Selected Cities Historical Availability Rate Trends - Warehouse
5.34%
8.72%
11.17%
9.44%
0% 2% 4% 6% 8% 10% 12%
2014
2013
2012
2011
San Jose
3.22%
6.44%
12.39%
15.44%
0% 5% 10% 15% 20%
2014
2013
2012
2011
Fremont
5.46%
11.51%
18.98%
13.29%
0% 5% 10% 15% 20%
2014
2013
2012
2011
Milpitas
8.35%
6.33%
5.98%
13.06%
0% 3% 6% 9% 12% 15%
2014
2013
2012
2011
Santa Clara
7.65%
15.49%
15.86%
7.19%
0% 3% 6% 9% 12% 15% 18%
2014
2013
2012
2011
Gilroy

23COLLIERS INTERNATIONAL | FEBRUARY 2015

24 COLLIERS INTERNATIONAL | FEBRUARY 2015
RETAIL MARKET
As predicted in the 2013 Colliers Retail Services market report, the good times for Silicon Valley retail real estate kept rolling in 2014. Regional macroeconomic conditions were robust, with broad employment growth, strong consumer confidence, and surging demand for retail real estate. These are happy days indeed for shopping-center owners and tenants with mature operating platforms; but is there a tipping point on the horizon when too much of a good thing becomes a problem?
Job growth in the Bay Area and Silicon Valley regions were white hot, with the job market “on fire” in 2014. In November alone, the region added 23,000 jobs, with 8,600 in Santa Clara County, according to an analysis of the EDD jobs report by Beacon Economics. The higher-wage-paying tech industry has been the primary job generator in Silicon Valley, but many other industries have been contributing to the overall recovery throughout the year. Residential values, for both purchase and rent, have continued to climb, reflecting market supply that has to yet to keep up with demand. The sustained regional prosperity of the Bay Area has finally led to the re-emergence of “mom and pop” family businesses that are competing with corporate tenants for scarce retail space.
According to the ICSC (International Council of Shopping Centers), 2014 was a breakout year for retail sales. Nationally, the year got off to a slow start with abnormal winter weather that kept shoppers home, but steadily improved in the spring and thereafter, with monthly sales increases on average of 5.5%. Additionally, ICSC reported that 2014 holiday shopping sales exceeded the exceptional 2013 holiday season by 4%. The increase in consumer purchases covered a broad range of retail categories, which ICSC highlighted as being indicative of healthy discretionary spending. Furthermore, the spending was very even throughout the season, avoiding the typical last-minute shopping rush. Consumers also had a little extra jingle in the pocket, with the drop in gas prices leaving the average American with $60 more per week to spend.
The post-Great Recession recovery years have been typically characterized as “uneven,” as retailers flocked to prime trade areas while periphery and infill trade areas languished. The market saw solid recovery in 2013, and then in 2014, the Valley went from recovery to growth mode as “mom and pop” small businesses once again returned to the broader market. Emboldened by market optimism and sources of capital, new and expanding retailers and service providers opened shop in long-vacant spaces. Additionally, many small businesses along main thoroughfares were forced to relocate their businesses to make way for high-density mixed-use residential or office projects. Mixed-use retail will become more common as main transit corridors transition to high-density mixed-use residential to accommodate the Valley’s future population growth.
The overall vacancy rate for Silicon Valley retail is under 5.0%, with vacancy in major retail hubs and trade areas less than 3.0%. As such, average rental rates in the Valley have increased by 25-50% from 2013, with an average per-square-foot rental rate ranging between $3.75-$4.25. Rates for top-tier trade areas and Class A newer construction are pushing the upper-$5.00 to low-$6.00 range. Vacancy rates in tertiary trade areas and Class B strip retail properties have decreased by approximately 33%. Consequently, the average rental rates range between $2.50-$3.25 per square foot.
Hunter-Storm’s Target/Safeway-anchored, Village Oaks Shopping Center at Cottle Road in South San Jose, broke ground in 2013 and opened in the third quarter of 2014, as did Alex Byer’s Target/Sprouts-anchored, Santa Clara Town Center on El Camino Real. Cupertino’s first Safeway opened at The Sobrato Organization’s newly-redeveloped Homestead Square, with co-anchor Stein Mart to open in early 2015. Three other major projects broke ground in 2014: Hunter-Storm’s Bass Pro-anchored Almaden Ranch; Peter Pau’s Cupertino Town Center at the entrance to the new Apple corporate campus on Stevens Creek Boulevard; and Irvine’s Santa
Retail Resurgence
RETAIL MARKET
COLLIERS INTERNATIONAL2014 - 2015 SILICON VALLEY | MARKET REPORT & FORECAST
RETAIL

25COLLIERS INTERNATIONAL | FEBRUARY 2015
RETAIL MARKET
Clara Square–a Whole Foods-anchored project in Santa Clara.
The emergence of Downtown San Jose and the San Pedro Square Market area should be noted as well, as one of San Jose’s newest, most vibrant neighborhood destinations, and a model for the live/work lifestyle. Residential towers built during the recession are occupied, with another 1,500 units of new and planned construction. The Centerra and One Market projects, with 659 combined units, will come on line in 2015 with about 15,000 square feet of ground floor retail space. In addition, Silvery Towers (612 units) and San Pedro Post Tower (182 units) are fully entitled with anticipated construction starting in late 2015.
The past three years have been marked by the grocery, burger, bakery, sandwich, and pizza “wars” with multiple tenants in each category competing for the same spaces. In general, food tenants have and still dominate the shop-tenant landscape, a dilemma for landlords as parking requirements limit the allowable square footage for food tenants. However, 2014 saw a return of soft- and hard-goods retailers to the market, including Marshall’s, ULTA Cosmetics, Ross Stores, Sports Basement, Party City, Sketchers, Off Broadway
Shoes, Stein Mart, Lumber Liquidators, and La-Z-Boy Furniture, who all opened new stores. Fitness concepts, large and small, such as City Sport, The Orange Theory, and Soulcycle, stayed active with new units. Specialty pet care and personal care retailers like Kay Jewelers, Pet Food Express, and Massage Envy, also were active in the marketplace. Medical tenants were also active and sought out retail locations.
The office supply segment contracted in 2014, with Office Depot, Office Max, and Staples all closing or downsizing stores. These vacancies were quickly absorbed by the aforementioned expanding stores. In general, the market was very efficient in absorbing any junior anchor and box space that came available. Notable Transactions:
• The sale of The Pruneyard in Campbell from Equity Office Properties to Ellis Partners, for an estimate $290 million.
• The sale of the Downey Center in Los Gatos from Trammell Crow Family to Donohue Schriber for an estimated $32.2 million.
• The sale of the San Antonio Center in Mountain View from San Antonio Associates to Federal Realty, at an undisclosed price.
• The ground lease of the Winchester
Theater complex to Federal Realty for future expansion of Santana Row.
• The sale of Vallco Mall to Peter Pau/Sand Hill Development, for an estimated $320 million.
• The sale of Safeway’s development arm, PDC, to Terramar Centers, for an estimated $830 million.
Since the publication of its first report in 2007, Colliers Retail Services Group has taken pride in its accurate forecasting of Silicon Valley’s retail real estate trends. So, what does the crystal ball look like for 2015? Barring any repercussions in global markets due to a variety of disruptors, the Silicon Valley and national economy will continue to thrive and will be strong enough to weather falling oil prices, stagnant international economies, and a possible interest rate increase. There will continue to be strong demand for retail space. However, there is a limit to how high rents can move before retailers hit the tipping point. There is a strong threat to continuing rental-rate increases, as skyrocketing occupancy costs (rent, expenses and property taxes), living wage, city-mandated minimum wages, and health care costs, impact bottom-line profits for retailers. The most vulnerable sector has also been the highest-flying–restaurants particularly impacted by the higher cost of labor.
RETAIL LEASING & SALES ACTIVITY
SELECTED COLLIERS INTERNATIONAL TRANSACTIONS - 2014
PROPERTY ADDRESS SQUARE FEET LANDLORD/SELLER TENANT/BUYER TYPE
20580 Homestead Road, Cupertino 31,449 The Sobrato Organization Stein Mart, Inc. Lease
1010-1040 North Rengstorff Avenue, Mountain View 23,684 Rengstorff Center GP / The Nicholson Group Ross Stores Lease
20580 Homestead Road, Cupertino 12,682 The Sobrato Organization ULTA Salon, Cosmetics & Fragrance Inc. Lease
2124 West El Camino Real, Mountain View 9,086 El Camino Village, Inc. Performance, Inc. Renewal
210 East Main Street, Los Gatos 8,617 Hotel Los Gatos Dio Deka Renewal
Mowry Boulevard and Paseo Padre, Fremont 3,770 Robson Homes Andre-Boudin Bakeries, Inc. Lease
Barring any repercussions in global markets due to a variety of disruptors, the Silicon Valley and national economy will continue to thrive and will be strong enough to weather falling oil prices, stagnant international economies, and a possible interest rate increase. There will continue to be strong demand for retail space. However, there is a limit to how high rents can move before retailers hit the tipping point.

26 COLLIERS INTERNATIONAL | FEBRUARY 2015
INVESTMENT MARKET
While deal volume in 2014 remained flat at a healthy $5.4B in total transactions, investors were more willing to “pay up” for Silicon Valley real estate. Average sale prices in Silicon Valley across the office, R&D, and industrial sectors soared to all-time highs as low interest rates coupled with formidable leasing activity had investors competing to place capital in Silicon Valley assets.
For some of the Valley’s main players, the increased values were an opportunity to take some chips off the table. By way of example, Blackstone’s Equity Office, who entered 2014 as one of Silicon Valley’s largest property owners, unloaded several high-profile assets throughout the year, including the Pruneyard, 10 Almaden, Pacific Shores, and Mission Towers. They also entered into contract to sell the controlling stake of their remaining Equity Office portfolio, though this transaction is expected to close in 2015.
Core markets throughout the Bay Area experienced very strong demand and investors required lower returns for such assets. This further fueled the previous year’s trend of opportunistic investors exiting stabilized assets throughout Silicon Valley. As the number of available properties diminished, opportunistic buyers turned to assets in secondary markets such as North San Jose, Downtown San Jose, Milpitas, and Fremont in order to find new opportunities.
The strong macro-economic story in the Silicon Valley has fueled historically-strong leasing activity. The low interest rate environment has driven cap
rates down, and the significant amount of institutional and private capital flowing into the Silicon Valley has created immense competition for winning deals. As a result, the average price per foot for the three aforementioned categories during 2014 eclipsed $267, representing an 11% increase from 2013 prices, and a 47% increase over 2012 prices.
Cap RatesAverage capitalization rates fell to 5.8%, sixty basis points below 2013 levels, and a sharp decrease from the 8.1% average initial return investors commanded at the cycle peak in 2010. Core buyers remained active and were willing to accept these lower returns which still produce higher yields when compared to other financial instruments. Furthermore, certain markets saw rapid growth of owner-users, such as Google and Apple, taking significant portions of entire submarkets and paying substantially higher prices than developers could afford. Owner-users in these markets diminished building supply and thereby contributed to driving overall values up.
INVESTMENT MARKETINVESTMENT MARKET
2014: Real Estate Values Soar as Investors Flock to Silicon Valley Real Estate
$0 $1 $2 $3 $4 $5 $6 $7 $8 $9
2007 2008 2009 2010 2011 2012 2013 2014 Bill
ions
of D
olla
rs
Transaction Volume
COLLIERS INTERNATIONAL2014 - 2015 SILICON VALLEY | MARKET REPORT & FORECAST
INVESTMENT
$100 $115 $130 $145 $160 $175 $190 $205 $220 $235 $250 $265 $280
2007 2008 2009 2010 2011 2012 2013 2014 Pric
e pe
r Squ
are
Foot
Average Price Per Foot
4.0% 4.5% 5.0% 5.5% 6.0% 6.5% 7.0% 7.5% 8.0% 8.5%
2007 2008 2009 2010 2011 2012 2013 2014
Average Cap Rate

27COLLIERS INTERNATIONAL | FEBRUARY 2015
INVESTMENT MARKET
Blackstone’s Equity Office,
who entered 2014 as one
of Silicon Valley’s largest
property owners, unloaded
several high-profile assets
throughout the year,
including the Pruneyard,
10 Almaden, Pacific Shores
and Mission Towers. They
also entered into contract
to sell the controlling stake
of their remaining Equity
Office portfolio, though this
transaction is expected to
close in 2015.
Looking Forward
Deal VolumeColliers International predicts investment sales deal volume will keep its robust pace in 2015 as value-add investors continue to harvest profits from acquisitions made early in the cycle and institutional capital, primarily looking for stabilized assets, will continue to acquire deals with strong cash flow in strong locations.
Cap RatesFueled by strong leasing fundamentals, low interest rates, and a high level of demand for cash flow, an unprecedented appetite for Silicon Valley real estate assets drove cap rates down in 2014. Given the strength of technology companies within the Silicon Valley, and the relative strength of the commercial real estate market in relation to the balance of the United States, expect this trend to continue in 2015. Although the Federal Reserve started the ‘tapering’ process in Q4 2013, we do not expect interest rates to increase in a way that would drive cap rates higher in the near future. With near-historically-low interest rates continuing into 2015, expect cap rates to hover around 5.5% for core assets and single-tenant assets backed by stable income from long-term leases.
Price Per Square FootDriven by relatively cheap debt, strong market fundamentals and leases backed by technology firms with strong financials, low cap rates will continue to drive price-per-square-foot numbers higher in the Silicon Valley. 2014 saw many record-breaking rent numbers. As availability continues to decrease, we expect rental values to continue to rise. With higher rents and the asset’s corresponding increased net operating incomes, investors will still be able to earn their desired returns, while paying record-high prices on a per-square-foot basis.
Debt Market2015 is a great year to be a real estate borrower. Banks, life insurance and CMBS lenders have ample capital to deploy and interest rates continue to be at historic lows. While modest interest rate hikes may occur by mid-2015, today’s 10-year fixed-rate commercial real estate loans are priced in the low-to mid-3% interest rate range for conservative real estate loans and high-3% interest rate range for full leverage loans. CMBS loan issuance is expected to increase by 25% from 2014. Given the sheer number of CMBS lenders (40+) in the market, lenders are becoming more aggressive in underwriting loan proceeds and extending up to 10 years-interest only. Long term real estate investors looking to hedge against rising interest rates can lock in 15-to 30 year fixed- rate loans in the sub-4% interest rate. Collier’s Mortgage Team can arrange financing for you take advantage of these historically low interest rates.
INVESTMENT SALES ACTIVITY
SELECTED COLLIERS INTERNATIONAL TRANSACTIONS - 2014
PROPERTY ADDRESS SQUARE FEET SELLER BUYER TYPE
611-697 River Oaks Parkway, San Jose 262,357 Eagle Ridge Partners SFF Montague Oaks, LLC R&D/Office
1200-1300 Memorex Drive, Santa Clara 215,424 PNC Mac 2001 1200 Partners LLC Industrial
888-894 Ross Drive & 209 Java Drive, Sunnyvale 173,922 Hines Corporate Properties CBRE Global Investors R&D/Office
44358-44388 Old Warm Springs Boulevard, Fremont 171,360 Inland American Warehouse Properties, Inc Industrial
1265 & 1272 Borregas Avenue, Sunnyvale 163,374 Rockpoint Fund III Acquisitions, LLC Swift Realty Partners R&D/Office
201-219 Moffett Park Drive, Sunnyvale 152,844 Applied Micro Circuits Corp. RW9 REIT Acquisition R&D/Office
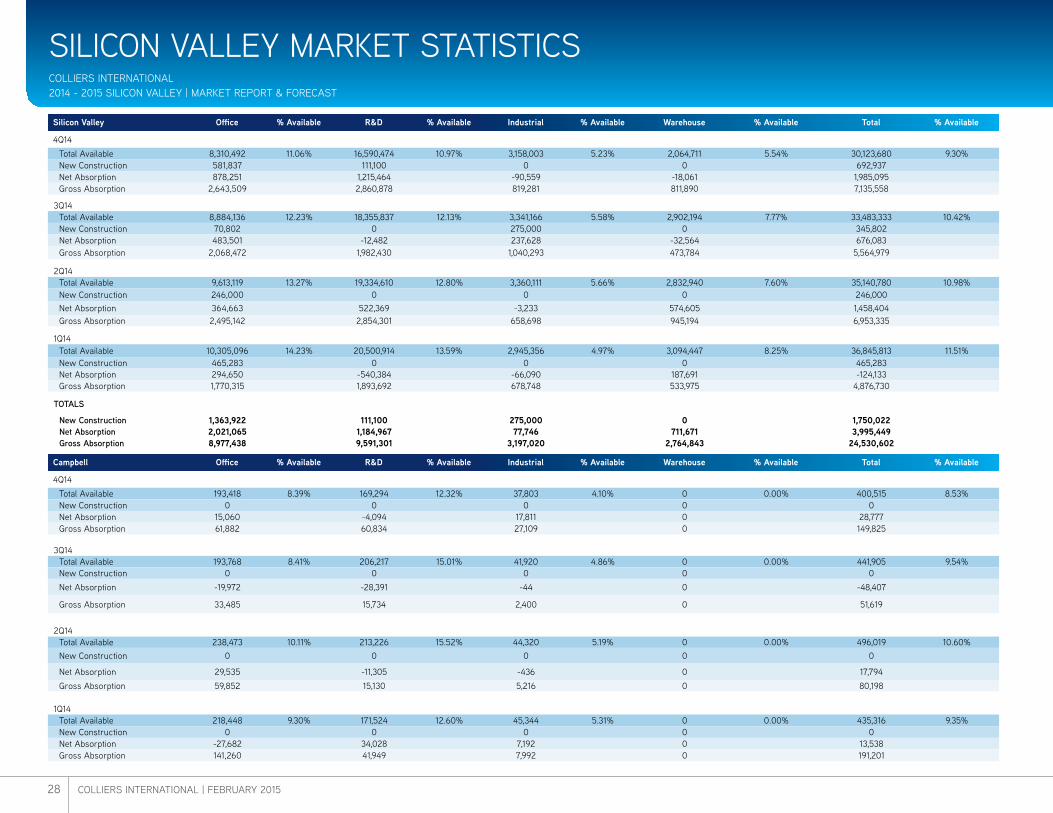
28 COLLIERS INTERNATIONAL | FEBRUARY 2015
SILICON VALLEY MARKET STATISTICSCOLLIERS INTERNATIONAL2014 - 2015 SILICON VALLEY | MARKET REPORT & FORECAST
Silicon Valley Office % Available R&D % Available Industrial % Available Warehouse % Available Total % Available
4Q14 Total Available 8,310,492 11.06% 16,590,474 10.97% 3,158,003 5.23% 2,064,711 5.54% 30,123,680 9.30% New Construction 581,837 111,100 0 0 692,937 Net Absorption 878,251 1,215,464 -90,559 -18,061 1,985,095 Gross Absorption 2,643,509 2,860,878 819,281 811,890 7,135,558
3Q14 Total Available 8,884,136 12.23% 18,355,837 12.13% 3,341,166 5.58% 2,902,194 7.77% 33,483,333 10.42% New Construction 70,802 0 275,000 0 345,802 Net Absorption 483,501 -12,482 237,628 -32,564 676,083 Gross Absorption 2,068,472 1,982,430 1,040,293 473,784 5,564,979
2Q14 Total Available 9,613,119 13.27% 19,334,610 12.80% 3,360,111 5.66% 2,832,940 7.60% 35,140,780 10.98% New Construction 246,000 0 0 0 246,000 Net Absorption 364,663 522,369 -3,233 574,605 1,458,404 Gross Absorption 2,495,142 2,854,301 658,698 945,194 6,953,335
1Q14 Total Available 10,305,096 14.23% 20,500,914 13.59% 2,945,356 4.97% 3,094,447 8.25% 36,845,813 11.51% New Construction 465,283 0 0 0 465,283 Net Absorption 294,650 -540,384 -66,090 187,691 -124,133 Gross Absorption 1,770,315 1,893,692 678,748 533,975 4,876,730
TOTALS
New Construction 1,363,922 111,100 275,000 0 1,750,022 Net Absorption 2,021,065 1,184,967 77,746 711,671 3,995,449 Gross Absorption 8,977,438 9,591,301 3,197,020 2,764,843 24,530,602
Campbell Office % Available R&D % Available Industrial % Available Warehouse % Available Total % Available
4Q14 Total Available 193,418 8.39% 169,294 12.32% 37,803 4.10% 0 0.00% 400,515 8.53% New Construction 0 0 0 0 0 Net Absorption 15,060 -4,094 17,811 0 28,777 Gross Absorption 61,882 60,834 27,109 0 149,825
3Q14 Total Available 193,768 8.41% 206,217 15.01% 41,920 4.86% 0 0.00% 441,905 9.54% New Construction 0 0 0 0 0 Net Absorption -19,972 -28,391 -44 0 -48,407
Gross Absorption 33,485 15,734 2,400 0 51,619
2Q14 Total Available 238,473 10.11% 213,226 15.52% 44,320 5.19% 0 0.00% 496,019 10.60% New Construction 0 0 0 0 0
Net Absorption 29,535 -11,305 -436 0 17,794 Gross Absorption 59,852 15,130 5,216 0 80,198
1Q14 Total Available 218,448 9.30% 171,524 12.60% 45,344 5.31% 0 0.00% 435,316 9.35% New Construction 0 0 0 0 0 Net Absorption -27,682 34,028 7,192 0 13,538 Gross Absorption 141,260 41,949 7,992 0 191,201

29COLLIERS INTERNATIONAL | FEBRUARY 2015
SILICON VALLEY MARKET STATISTICSCOLLIERS INTERNATIONAL
2014 - 2015 SILICON VALLEY | MARKET REPORT & FORECAST
Cupertino Office % Available R&D % Available Industrial % Available Warehouse % Available Total % Available
4Q14 Total Available 50,011 1.40% 0 0.00% 0 0.00% 0 0.00% 50,011 0.78% New Construction 0 0 0 0 0 Net Absorption 5,091 2,400 0 0 7,491 Gross Absorption 35,032 2,400 0 0 37,432
3Q14 Total Available 53,491 1.52% 2,400 0.08% 0 0.00% 0 0.00% 55,891 0.88% New Construction 0 0 0 0 0 Net Absorption -8,791 -2,400 0 0 -11,191 Gross Absorption 141,577 0 0 0 141,577
2Q14 Total Available 162,209 4.59% 0 0.00% 0 0.00% 0 0.00% 162,209 2.50% New Construction 0 0 0 0 0 Net Absorption 22,707 2,932 0 0 25,639 Gross Absorption 79,694 2,932 0 0 82,626
1Q14 Total Available 177,667 5.03% 2,932 0.10% 0 0.00% 0 0.00% 180,599 2.79% New Construction 0 0 0 0 0 Net Absorption -13,195 3,622 0 0 -9,573 Gross Absorption 31,975 22,209 0 0 54,184
Fremont Office % Available R&D % Available Industrial % Available Warehouse % Available Total % Available
4Q14 Total Available 296,660 15.60% 3,569,739 18.46% 823,327 8.51% 216,796 3.22% 4,906,522 13.03% New Construction 0 0 0 0 0 Net Absorption -975 432,757 41,109 29,472 502,363 Gross Absorption 15,394 917,531 138,550 209,072 1,280,547
3Q14 Total Available 298,830 14.80% 4,334,865 22.67% 1,000,862 10.40% 416,868 6.06% 6,051,425 16.08% New Construction 0 0 275,000 0 275,000 Net Absorption -12,151 235,614 349,740 0 573,203 Gross Absorption 28,454 441,640 477,121 177,041 1,124,256
2Q14 Total Available 276,042 13.32% 4,472,770 23.41% 1,000,711 10.74% 449,575 6.59% 6,199,098 16.61% New Construction 0 0 0 0 0 Net Absorption -4,256 -150,306 -34,880 100,875 -88,567 Gross Absorption 34,395 208,266 55,178 230,904 528,743
1Q14 Total Available 277,009 13.37% 4,404,905 23.11% 941,336 10.10% 545,247 7.99% 6,168,497 16.55% New Construction 0 0 0 0 0 Net Absorption 10,404 -250,876 73,951 -10,860 -177,381 Gross Absorption 32,063 521,730 135,995 46,260 736,048

30 COLLIERS INTERNATIONAL | FEBRUARY 2015
SILICON VALLEY MARKET STATISTICSCOLLIERS INTERNATIONAL2014 - 2015 SILICON VALLEY | MARKET REPORT & FORECAST
Gilroy Office % Available R&D % Available Industrial % Available Warehouse % Available Total % Available
4Q14 Total Available 40,519 13.33% 99,149 26.65% 83,977 5.46% 255,660 7.65% 479,305 8.63% New Construction 0 0 0 0 0 Net Absorption 0 0 40,049 29,642 69,691 Gross Absorption 1,319 13,608 51,049 193,663 259,639
3Q14 Total Available 40,519 13.33% 99,149 26.65% 112,516 7.36% 449,323 13.24% 701,507 12.53% New Construction 0 0 0 0 0 Net Absorption 0 0 16,156 0 16,156
Gross Absorption 0 0 16,156 0 16,156
2Q14 Total Available 40,519 13.33% 76,000 21.78% 128,672 8.42% 449,323 13.24% 694,514 12.46% New Construction 0 0 0 0 0
Net Absorption 0 0 -26,161 0 -26,161 Gross Absorption 0 0 7,400 0 7,400
1Q14
Total Available 40,519 13.30% 76,000 20.59% 111,711 7.33% 499,323 14.12% 727,553 12.69%
New Construction 0 0 0 0 0 Net Absorption -1,512 0 16,600 0 15,088 Gross Absorption 1,029 0 17,800 7,782 26,611
Los Altos Office % Available R&D % Available Industrial % Available Warehouse % Available Total % Available
4Q14 Total Available 81,450 7.21% 0 0.00% 0 0.00% 0 0.00% 81,450 7.21% New Construction 0 0 0 0 0 Net Absorption -13,273 0 0 0 -13,273 Gross Absorption 121,513 0 0 0 121,513
3Q14 Total Available 62,607 5.58% 0 0.00% 0 0.00% 0 0.00% 62,607 5.58% New Construction 0 0 0 0 0 Net Absorption -4,678 0 0 0 -4,678
Gross Absorption 25,291 0 0 0 25,291
2Q14 Total Available 59,644 5.72% 0 0.00% 0 0.00% 0 0.00% 59,644 5.72% New Construction 0 0 0 0 0
Net Absorption 15,346 0 0 0 15,346 Gross Absorption 43,701 0 0 0 43,701
1Q14
Total Available 50,448 4.85% 0 0.00% 0 0.00% 0 0.00% 50,448 4.85%
New Construction 0 0 0 0 0 Net Absorption 16,898 0 0 0 16,898 Gross Absorption 52,147 0 0 0 52,147

31COLLIERS INTERNATIONAL | FEBRUARY 2015
SILICON VALLEY MARKET STATISTICSCOLLIERS INTERNATIONAL
2014 - 2015 SILICON VALLEY | MARKET REPORT & FORECAST
Los Gatos Office % Available R&D % Available Industrial % Available Warehouse % Available Total % Available
4Q14 Total Available 48,303 3.73% 14,470 4.29% 0 0.00% 0 0.00% 62,773 3.73% New Construction 0 0 0 0 0 Net Absorption 10,299 29,127 0 0 39,426 Gross Absorption 14,694 29,127 0 0 43,821
3Q14 Total Available 54,388 4.41% 29,127 8.63% 0 0.00% 0 0.00% 83,515 5.15% New Construction 0 0 0 0 0 Net Absorption 2,054 0 0 0 2,054
Gross Absorption 40,573 5,820 0 0 46,393
2Q14 Total Available 75,023 6.12% 29,127 8.79% 0 0.00% 0 0.00% 104,150 6.47% New Construction 0 0 0 0 0
Net Absorption 12,632 -29,127 1,500 0 -14,995 Gross Absorption 59,407 0 1,500 0 60,907
1Q14
Total Available 109,166 8.93% 0 0.00% 1,500 4.25% 0 0.00% 110,666 6.89%
New Construction 0 0 0 0 0 Net Absorption -25,457 0 0 0 -25,457 Gross Absorption 19,305 0 0 0 19,305
Milpitas Office % Available R&D % Available Industrial % Available Warehouse % Available Total % Available
4Q14 Total Available 174,349 14.77% 1,386,379 10.25% 252,460 8.19% 249,724 5.46% 2,062,912 9.22% New Construction 0 0 0 0 0 Net Absorption 21,831 49,751 30,694 -2,000 100,276 Gross Absorption 23,831 166,539 97,276 74,165 361,811
3Q14 Total Available 203,978 18.35% 1,466,296 10.81% 264,391 8.57% 347,132 7.59% 2,281,797 10.22% New Construction 0 0 0 0 0 Net Absorption -30,728 -131,742 -85,806 0 -248,276
Gross Absorption 11,698 152,664 25,983 65,013 255,358
2Q14 Total Available 202,871 18.25% 1,656,221 12.24% 250,598 8.46% 319,925 7.00% 2,429,615 10.96% New Construction 0 0 0 0 0
Net Absorption 38,998 28,280 3,685 234,700 305,663 Gross Absorption 59,301 161,737 38,029 283,430 542,497
1Q14
Total Available 241,869 21.76% 1,739,083 12.85% 216,383 7.24% 473,198 10.15% 2,670,533 11.98%
New Construction 0 0 0 0 0 Net Absorption 8,682 87,929 -35,809 71,966 132,768 Gross Absorption 10,400 187,795 18,594 137,132 353,921

32 COLLIERS INTERNATIONAL | FEBRUARY 2015
SILICON VALLEY MARKET STATISTICSCOLLIERS INTERNATIONAL2014 - 2015 SILICON VALLEY | MARKET REPORT & FORECAST
Morgan Hill Office % Available R&D % Available Industrial % Available Warehouse % Available Total % Available
4Q14 Total Available 148,027 19.67% 74,896 2.71% 48,741 2.18% 20,754 4.30% 292,418 4.69% New Construction 0 0 0 0 0 Net Absorption 4,194 12,259 22,444 28,680 67,577 Gross Absorption 4,480 69,786 23,500 28,680 126,446
3Q14 Total Available 152,221 20.23% 117,280 4.26% 66,145 2.96% 49,434 10.24% 385,080 6.19% New Construction 0 0 0 0 0 Net Absorption 55,575 70,731 10,553 0 136,859
Gross Absorption 61,473 132,856 131,687 0 326,016
2Q14 Total Available 207,796 27.62% 191,827 7.06% 80,298 3.60% 49,434 10.24% 529,355 8.56% New Construction 0 0 0 0 0
Net Absorption -499 -25,347 -12,165 0 -38,011 Gross Absorption 2,247 6,328 11,485 0 20,060
1Q14
Total Available 207,297 27.55% 157,152 5.96% 64,533 2.94% 49,434 10.24% 478,416 7.89%
New Construction 0 0 0 0 0 Net Absorption -11,764 8,503 1,419 0 -1,842 Gross Absorption 0 20,747 12,550 0 33,297
Mountain View Office % Available R&D % Available Industrial % Available Warehouse % Available Total % Available
4Q14 Total Available 203,701 4.61% 318,942 2.33% 14,914 0.91% 0 0.00% 537,557 2.72% New Construction 175,902 0 0 0 175,902 Net Absorption 116,770 -40,284 9,691 0 86,177 Gross Absorption 285,453 68,242 9,691 0 363,386
3Q14 Total Available 184,455 4.37% 336,498 2.47% 71,273 4.38% 0 0.00% 592,226 3.04% New Construction 70,802 0 0 0 70,802 Net Absorption 118,308 19,298 12,905 0 150,511
Gross Absorption 197,314 140,897 25,130 0 363,341
2Q14 Total Available 244,070 6.14% 430,758 3.16% 90,069 5.54% 0 0.00% 764,897 3.98% New Construction 0 0 0 0 0
Net Absorption 63,699 190,574 2,720 0 256,993 Gross Absorption 149,910 380,766 6,880 0 537,556
1Q14
Total Available 261,032 6.32% 670,797 4.92% 45,364 2.79% 0 0.00% 977,193 5.04%
New Construction 0 0 0 0 0 Net Absorption -113,038 -82,497 3,146 0 -192,389 Gross Absorption 150,691 147,665 20,900 0 319,256

33COLLIERS INTERNATIONAL | FEBRUARY 2015
SILICON VALLEY MARKET STATISTICSCOLLIERS INTERNATIONAL
2014 - 2015 SILICON VALLEY | MARKET REPORT & FORECAST
Palo Alto Office % Available R&D % Available Industrial % Available Warehouse % Available Total % Available
4Q14 Total Available 595,211 6.08% 114,215 0.85% 167,044 14.29% 6,629 1.76% 883,099 3.58% New Construction 17,150 111,100 0 0 128,250 Net Absorption 90,074 105,408 -35,575 -6,629 153,278 Gross Absorption 265,574 111,100 0 0 376,674
3Q14 Total Available 672,671 6.88% 98,342 0.74% 131,469 11.86% 0 0.00% 902,482 3.68% New Construction 0 0 0 0 0 Net Absorption 176,079 21,083 -12,200 0 184,962
Gross Absorption 357,526 62,852 0 0 420,378
2Q14 Total Available 787,774 8.05% 147,600 1.11% 131,101 11.82% 0 0.00% 1,066,475 4.35% New Construction 58,000 0 0 0 58,000
Net Absorption 105,534 44,473 -5,000 0 145,007 Gross Absorption 230,182 249,962 0 0 480,144
1Q14
Total Available 812,543 8.38% 213,860 1.61% 109,000 9.83% 0 0.00% 1,135,403 4.65%
New Construction 0 0 0 0 0 Net Absorption 1,644 -16,365 -2,832 0 -17,553 Gross Absorption 273,699 19,909 14,000 27,443 335,051
San Jose Office % Available R&D % Available Industrial % Available Warehouse % Available Total % Available
4Q14 Total Available 3,945,513 15.19% 6,457,659 15.76% 1,207,765 5.37% 892,211 5.34% 12,503,148 11.78% New Construction 0 0 0 0 0 Net Absorption -115,508 621,111 -272,605 -101,036 131,962 Gross Absorption 472,228 867,109 248,862 186,486 1,774,685
3Q14 Total Available 3,994,265 15.57% 6,891,841 16.86% 970,266 4.35% 1,203,650 7.24% 13,060,022 12.38% New Construction 0 0 0 0 0 Net Absorption 123,352 231,244 50,031 36,371 440,998
Gross Absorption 857,773 692,711 253,722 177,385 1,981,591
2Q14 Total Available 4,389,896 17.15% 7,264,608 17.89% 1,009,142 4.54% 1,206,331 7.25% 13,869,977 13.20% New Construction 0 0 0 0 0
Net Absorption -239,609 364,059 52,487 188,830 365,767 Gross Absorption 544,363 922,060 397,612 294,252 2,158,287
1Q14
Total Available 4,585,486 17.94% 7,761,766 19.07% 810,882 3.66% 1,107,593 6.66% 14,265,727 13.58%
New Construction 0 0 0 0 0 Net Absorption -23,336 -340,666 -32,351 126,380 -269,973 Gross Absorption 404,476 585,388 312,672 261,877 1,564,413

34 COLLIERS INTERNATIONAL | FEBRUARY 2015
SILICON VALLEY MARKET STATISTICSCOLLIERS INTERNATIONAL2014 - 2015 SILICON VALLEY | MARKET REPORT & FORECAST
Santa Clara Office % Available R&D % Available Industrial % Available Warehouse % Available Total % Available
4Q14 Total Available 1,794,574 15.26% 2,492,260 12.70% 338,769 2.96% 266,684 8.35% 4,892,287 10.63% New Construction 0 0 0 0 0 Net Absorption 348,911 36,535 12,474 -38,256 359,664 Gross Absorption 552,340 207,085 166,430 0 925,855
3Q14 Total Available 2,165,565 19.64% 2,790,214 14.07% 431,260 3.78% 208,188 6.57% 5,595,227 12.31% New Construction 0 0 0 0 0 Net Absorption 78,140 -296,074 -63,096 -5,800 -286,830 Gross Absorption 269,318 227,785 94,521 10,500 602,124
2Q14 Total Available 2,210,289 19.95% 2,873,055 14.49% 430,590 3.78% 193,888 6.10% 5,707,822 12.55% New Construction 188,000 0 0 0 188,000 Net Absorption 326,880 98,928 4,604 71,800 502,212 Gross Absorption 706,556 431,686 91,428 136,608 1,366,278
1Q14 Total Available 2,521,130 23.15% 2,979,888 15.03% 394,089 3.46% 255,188 8.02% 6,150,295 13.58% New Construction 465,283 0 0 0 465,283 Net Absorption 384,148 -42,006 -97,755 205 244,592 Gross Absorption 519,129 104,099 107,978 53,481 784,687
Sunnyvale Office % Available R&D % Available Industrial % Available Warehouse % Available Total % Available
4Q14 Total Available 732,334 6.99% 1,893,471 8.20% 183,203 3.01% 156,253 8.86% 2,965,261 7.16% New Construction 388,785 0 0 0 388,785 Net Absorption 396,625 -29,506 43,349 42,066 452,534 Gross Absorption 784,163 347,517 56,814 119,824 1,308,318
3Q14 Total Available 693,889 7.41% 1,964,471 8.43% 244,364 4.01% 227,599 12.91% 3,130,323 7.72% New Construction 0 0 0 0 0 Net Absorption 5,840 -131,845 -40,611 -63,135 -229,751 Gross Absorption 41,501 109,471 13,573 43,845 208,390
2Q14 Total Available 712,466 7.61% 1,979,418 8.48% 194,610 3.21% 164,464 9.61% 3,050,958 7.54% New Construction 0 0 0 0 0 Net Absorption -2,755 9,208 10,413 -21,600 -4,734 Gross Absorption 524,839 475,434 43,970 0 1,044,243
1Q14 Total Available 799,984 8.44% 2,323,007 10.00% 205,214 3.38% 164,464 9.61% 3,492,669 8.63% New Construction 0 0 0 0 0 Net Absorption 88,858 57,944 349 0 147,151 Gross Absorption 134,141 242,201 30,267 0 406,609

35COLLIERS INTERNATIONAL | FEBRUARY 2015

36 COLLIERS INTERNATIONAL | FEBRUARY 2015
BROKERAGE PROFILESCOLLIERS INTERNATIONAL2014 - 2015 SILICON VALLEY | MARKET REPORT & FORECAST
SAN JOSE James R. Abarta +1 925 227 6228 [email protected]
Diane Armstrong +1 408 282 3848 [email protected]
Matt Arya +1 408 282 3835 [email protected]
Jim Beeger +1 408 282 3942 [email protected]
Terry Bell, sior +1 408 282 3923 [email protected]
Howard Berry +1 408 282 3809 [email protected]
David Buchholz +1 408 282 3843 [email protected]
Mike Burke +1 408 282 4003 [email protected]
Samuel E. Burnett +1 408 978 1916 [email protected]
Dion Campisi, sior +1 408 282 3875 [email protected]
Jim Castignani +1 408 282 3893 [email protected]
John Colyar +1 408 282 3949 [email protected]
Duffy D’Angelo, sior +1 408 282 3950 [email protected]
Scott Daugherty +1 408 282 3830 [email protected]
Brent Dressen +1 408 282 3979 [email protected]
Tom de Jong +1 408 282 3829 [email protected]
Paige DeSmet +1 408 282 3918 [email protected]
Emerson DiNapoli +1 408 282 3841 [email protected]
Joe Elliott, sior +1 408 282 3922 [email protected]
David N. Evans +1 408 282 3825 [email protected]
Craig L. Fordyce, sior, ccim +1 408 282 3911 [email protected]
Greg Galasso, sior +1 408 282 3816 [email protected]
Stephen J. Gibson, sior +1 408 282 3890 [email protected]
Mark Giovanzana +1 408 282 3861 [email protected]
Nick Goddard +1 408 282 3858 [email protected]
Jay Gomez +1 408 282 3989 [email protected]
Susan Gregory, sior +1 408 282 3940 [email protected]
Joan S. Haynes +1 408 282 3920 [email protected]
Terry Healy +1 408 282 3826 [email protected]
H. L. (Bing) Heckman +1 408 282 3805 [email protected]
Jere Hench +1 408 282 3832 [email protected]
Edward M. Hofer, sior +1 408 282 3819 [email protected]
Steve Hunt +1 408 282 3846 [email protected]
Michael R. Johnson, sior +1 408 282 3852 [email protected]
James Kaye +1 408 282 3810 [email protected]
John Kovaleski +1 408 282 3844 [email protected]
Mark R. Kuiper +1 408 282 3850 [email protected]
Carla Lindorff, mba +1 408 282 3908 [email protected]
John Machado, jd, mba +1 408 282 3862 [email protected]
Kristen Macken, sior +1 408 282 3878 [email protected]
Brian Mason +1 408 282 3959 [email protected]
John McMahon +1 408 282 3944 [email protected]
Paul McManus +1 408 282 3963 [email protected]
David C. Mein +1 408 282 3828 [email protected]
Marne Michaels +1 408 282 3838 [email protected]
Mike Miller +1 408 282 3842 [email protected]
Shane Minnis, leed, ap +1 408 282 3901 [email protected]
Martin A. Morici, sior +1 408 282 3921 [email protected]
Kevin Moul +1 408 282 3873 [email protected]
Tom Nelson +1 408 282 3960 [email protected]
Jeffry S. Nochimson, sior +1 408 282 3941 [email protected]
Dharmesh Patel +1 408 282 3990 [email protected]
Kyle Portal +1 408 383 3954 [email protected]
M. Steven Prehm +1 408 282 3936 [email protected]
George Quinn +1 408 282 3912 [email protected]
Justin Reilly +1 408 282 3929 [email protected]
Donald H. Reimann, sior +1 408 282 3888 [email protected]
Jeffrey L. Rogers +1 408 282 3919 [email protected]
Michael L. Rosendin, sior, ccim +1 408 282 3900 [email protected]
Ryan Rosendin +1 408 282 3902 [email protected]
Cynthia Rotwein +1 408 282 3856 [email protected]
Robert Rowland +1 408 282 3880 [email protected]
Katherine Roxborough, leed, ap +1 408 282 3939 [email protected]
David R. Sandlin, sior +1 408 282 3988 [email protected]
David V. Schmidt, sior +1 408 282 3814 [email protected]
Bob Shepherd +1 408 282 3855 [email protected]
John Serex +1 408 282 3803 [email protected]
Ryan Slater +1 408 282 3812 [email protected]
Hitoshi Takahashi +1 408 282 3933 [email protected]
Brett Taylor +1 408 282 3889 [email protected]
Sean Toomey +1 408 282 3864 [email protected]
Kenneth D. Tsukahara +1 408 282 3934 [email protected]
Chris Twardus +1 408 282 3836 [email protected]
Gregg von Thaden +1 408 282 3915 [email protected]
André R. Walewski +1 408 282 3837 [email protected]
Mary Wimmer +1 408 282 3913 [email protected]
Mark P. Zamudio, ccim +1 408 282 3822 [email protected]
Steve Zamudio, ccim +1 408 282 3824 [email protected]
Romy Zeid +1 408 282 3818 [email protected]
GILROY Jeffrey A. Barnes +1 408 842 7000 [email protected]
Mark Sanchez +1 408 842 7000 [email protected]
Matt van Keulen +1 408 842 7000 [email protected] REDWOOD CITY Philip Arnautou, Jr., CPA +1 650 486 2213 [email protected]
Mike Cobb +1 650 486 2251 [email protected]
JP Custodio +1 650 486 2218 [email protected]
Mike Davis +1 650 486 2219 [email protected]
Steve Divney +1 650 638 4331 [email protected]
Michael Draeger +1 650 486 2221 [email protected]
Stephanie Elkins +1 650 486 2272 [email protected]
Gabe Essner +1 650 486 2217 [email protected]
David Gray, ifma, r.e.c. +1 650 486 2262 [email protected]
John McLellan +1 650 486 2223 [email protected]
Douglas Marks, mba +1 650 486 2222 [email protected]
Gary Nichols +1 650 486 2250 [email protected]
Tom Schmidt, ccim +1 650 486 2226 [email protected]
Robert Schwartz +1 650 486 2286 [email protected]
Aaron Susman +1 650 486 2214 [email protected]
Craig Walsh +1 650 486 2230 [email protected]
Brett Weber +1 650 486 2233 [email protected]
Luke Wilson +1 650 486 2212 [email protected]
Ryan Young +1 650 486 2229 [email protected]
Grant Zamudio +1 650 486 2231 [email protected]
Appraisal & Property Tax Division Donn H. Byrne, Jr., mai, mrics, asa +1 408 282 3853 [email protected]
Joel C. Yungen +1 408 282 3854 [email protected]
Executive Managing Director San Jose/Silicon Valley Jeff S. Fredericks, sior +1 408 282 3801 [email protected]
Managing Partner Peninsula Rick Knauf +1 650 486 2244 [email protected]

37COLLIERS INTERNATIONAL | FEBRUARY 2015

38 COLLIERS INTERNATIONAL | FEBRUARY 2015
General TermsAvailability: Vacant or occupied space that is offered for lease, sublease or sale (to an owner-occupant).
Build-to-Suit: A developable parcel that an owner will improve to suit the needs of a particular tenant. Construction does not begin until a tenant has committed to the property.
Building Base: Total square footage developed. Colliers tracks office buildings from 3,000 square feet, R&D from 5,000 square feet, industrial buildings from 7,500 square feet, and warehouse buildings from 10,000 square feet.
CBD: Central Business District, generally the downtown area of a major city.
Completed Construction: Construction which is completed during the period.
Direct Space: Space available through a landlord/owner.
Effective Net Absorption: Effective net absorption is a Colliers measurement of the net change in available space during a given period of time after adjustments for space taken off the market. Effective net absorption utilizes the same formula to measure change of occupancy as net absorption except that it treats any newly available space, whether available direct or for sublease, as if it is coming onto the market vacant.
Gross Absorption: The total square footage sold (to owner/occupants) or leased during a given time period.
Net Absorption: The net change in occupied space during a given period of time.
PSF: Per square foot.
PSF/MO: Per square foot per month.
SF: Square foot or square feet.
Silicon Valley: Colliers International defines Silicon Valley as all of Santa Clara County plus Fremont, for the purposes of its market reports.
Speculative Construction: Construction that will commence without any prior commitment from a tenant.
Sublease Space: Space available through a sublessor to a third party.
T.I.s: Tenant Improvements are a dollar amount offered by the lessor generally for the construction or modification of the premises.
Total Available: The sum of available direct and available sublease space.
Vacancy: Percentage of vacant inventory available including both vacant direct, and vacant sublease space.
Product ClassificationClass “A” Office: Modern, steel-framed low, mid or high-rise structures used exclusively for office tenants.
Class “B” Office: Wood and steel mix framed low to mid-rise structures and older brick or concrete structures used predominately for office.
Industrial/Light Industrial: Buildings with drive-in and/or dock-high truck capabilities, clear heights of less than 20 feet and parking ratios of 2.0/1,000 or less.
Research and Development (R&D): One to three story structures with extensive glass, heavy office buildout and 3.5/1,000 parking ratio. Buildings may include high-end production facilities, laboratory space and grade level truck doors.
Warehouse/Distribution: Buildings with a minimum 20-foot clear height, dock-high truck loading and parking ratios of 2.0/1,000 or less.
Rental TermsCAM: Common area maintenance charge. Generally used in Industrial Gross and NNN leases where the tenant pays a share of the costs associated with the maintenance of the common areas.
Full Service: Rental type generally used in office product where the landlord’s rental rate contains all costs associated with occupying the premises inclusive of taxes, insurance, maintenance, janitorial, and utilities.
Industrial Gross: Rental type generally used in industrial product where the landlord’s rental rate contains all costs associated with occupying the premises inclusive of taxes, insurance, and maintenance.
Rental Rates: All rental rates for office space are calculated on a Full Service basis unless otherwise noted. All rental rates for R&D, industrial and warehouse space are calculated on a NNN basis unless otherwise noted.
Triple Net (NNN): Rental type where the tenant pays rent to the landlord and additionally assumes all costs regarding the operation, taxes and maintenance of the premises and building.
UNDERSTANDING ABSORPTION
Colliers uses several measurements to track market conditions and deal flow. While related, the formulas to arrive at these measurements differ. Using the results from 2013, here is how Colliers measures change in availability and net absorption.
Change in Availability: This measurement is simply the difference between the amounts of space available at the end of one period to the next. The table below shows that total available space was reduced by 3.27 million square feet in 2013. Note that “change in availability” includes adjustments for space that is “taken off the market”. Space “taken off the market” is not a factor in net absorption measurements.
Total Available End of 2013 36,745,721Plus: Vacant & Occupied Space that came available in 2014 15,415,062 Plus: New Shell added in 2014 1,750,0222013 Available + Newly Available in 2014 53,103,239Less: 2014 Gross Absorption 24,530,602Less: 2014 Adjustments/Taken off the Market 3,474,744Total Available end of 2014 32,047,381
Net Absorption: Net absorption measures the change in occupied space from one period to the next. In this measurement, it is important to distinguish that a building may be “available”, but not vacant (often the case in a sublease situation, for example). Therefore, occupancy is not reduced (negative net absorption) until the space is vacated, and sometimes that does not happen until the space is leased, creating a net absorption “wash” for the deal and for that particular period. Vacant Space that came available 2014 4,490,539Previously available space vacated in 2014 16,044,6142014 Total Vacant Added Occupancy Loss 20,535,153 2014 Gross Absorption 24,530,6022014 Net Absorption (Change in Occupancy) 3,995,449
GENERAL TERMSCOLLIERS INTERNATIONAL2014 - 2015 SILICON VALLEY | MARKET REPORT & FORECAST

39COLLIERS INTERNATIONAL | FEBRUARY 2015

40 COLLIERS INTERNATIONAL | FEBRUARY 2015
COLLIERS BAY AREA LOCATIONSCOLLIERS INTERNATIONAL2014 - 2015 SILICON VALLEY | MARKET REPORT & FORECAST
MANTECA
STOCKTON
SALIDA
CERES
99
99
99
33
88
23
132
120120
108
219TRACY
LIVERMORE
PLEASANTON
FREMONT
NEWARK
UNION CITY
HAYWARD
PALOALTO
MTN.VIEW
REDWOODCITY
SANMATEO FOSTER CITY
DUBLIN
SAN RAMON
DANVILLE
WALNUTCREEK
CONCORDMARTINEZ
RICHMOND
BERKELEY
OAKLAND
SAN LEANDRO
PITTSBURG ANTIOCH
BRENTWOOD
SANJOSE
MILPITAS
SUNNYVALESANTACLARA
GILROYSANTA CRUZ
MORGAN HILL
LOS GATOS
FAIRFIELD
SANTAROSA
NAPA
VALLEJO
BENICIA
AMERICANCANYON
VACAVILLE
SACRAMENTO
980
580
680
280
680
680
680
780
580
580
580
580
205
880
80
80
80
280
280
4
4
4
12
12
12
29
29
29
4
92
84
84
84
17
85
237
87
1
1
24
13
121
110
121
101
101
101
101
CAMPBELL
101
5
5
1
1
1
37
5
505
SANFRANCISCO
SAN JOSE/SILICON VALLEY450 West Santa Clara StreetSan Jose, CA 95113+1 408 282 3800
GILROY/SOUTH COUNTY8070 Santa Teresa BoulevardSuite 220Gilroy, CA 95020+1 408 842 7000
SAN FRANCISCO PENINSULA203 Redwood Shores ParkwaySuite 125Redwood City, CA 94065+1 650 486 2200
SAN FRANCISCO 50 California StreetSuite 1900San Francisco, CA 94111+1 415 788 3100
OAKLAND/EAST BAY1999 Harrison StreetSuite 1750Oakland, CA 94612+1 510 986 6770
PLEASANTON/EAST BAY3825 Hopyard RoadSuite 195Pleasanton, CA 94588+1 925 463 2300
FAIRFIELD/NORTH BAY360 Campus Lane, Suite 101Fairfield, CA 94534+1 707 863 0188
WALNUT CREEK/EAST BAY1850 Mt. Diablo BoulevardSuite 200Walnut Creek, CA 94596+1 925 279 0120
STOCKTON/CENTRAL VALLEY3439 Brookside RoadSuite 108 Stockton, CA 95219+1 209 475 5100
SACRAMENTO301 University AvenueSuite 100 Sacramento, CA 95825+1 916 929 5999
880680 237
880680280
58080380
9807805
237
262
8587
84
82
4
12
1
24 152 99
17 92
50 242
9
101
Colliers International is a global leader in real estate services with more than 13,500 professionals operating out of 482 offices in 62 countries. Colliers provides a full range of services to real estate users, owners and investors worldwide including: global corporate solutions; sales and lease brokerage; property and asset management; project management; hotel investment sales and consulting; property valuation and appraisal services; mortgage banking and insightful research. Colliers has 10 offices in Northern California and Nevada.
Colliers Offices Worldwide

41COLLIERS INTERNATIONAL | FEBRUARY 2015
Colliers Offices Worldwide
Other MembershipsMountain View Chamber of Commerce
San Mateo Chamber of CommerceSan Carlos Chamber of Commerce
Redwood City Chamber of CommerceGilroy Chamber of Commerce
Sons of SicilySilicon Valley Capital Club
Asia America MultiTechnology Association (AAMA)Argus Seld Storage Sales Network
Rotary InternationalKiwanis International
China Silicon ValleyAsian Business Association
Bay Area Mortgage AssociationAmerican Society of Appraisers
Royal Institute of Chartered Surveyers
Individual Memberships
COLLIERS OFFICES & INDIVIDUAL MEMBERSHIPSCOLLIERS INTERNATIONAL
2014 - 2015 SILICON VALLEY | MARKET REPORT & FORECAST
UNITED STATESAlabamaBirmingtonHuntsvilleArizonaGreater PhoenixPhoenix-ScottsdaleArkansasBentonvilleLittle RockCaliforniaBakersfieldCarlsbadFairfieldFresnoGilroyLos Angeles County Brentwood City of Industry Commerce Downtown LA Encino Island Empire Orange County Torrance ValenciaOakland/East BayPleasantonRedwood City/Palo AltoRosevilleSacramentoSan DiegoSan FranciscoSan Jose/Silicon ValleyStocktonWalnut CreekColoradoDenverConnecticutHartfordNew HavenStamfordDelawareWilmingtonDistrict of ColumbiaWashington DCFloridaFort LauderdaleFort MyersJacksonvilleMiamiOrlando
South FloridaTampa BayWest Palm BeachGeorgiaAtlantaSavannahHawaiiHonoluluMauiIdahoBoise - NampaIllinoisChicagoRosemontIndianaIndianapolisKansasLawrenceMarylandBethesdaGreater BaltimoreMassachusettsBostonMichiganAnn ArborDetroitHollandGrand RapidsKalamazooWest MichiganMinnesotaMinneapolisMissouriKansas CitySt. LouisNebraskaLincolnOmahaNevadaLas VegasRenoNew HampshireManchesterPortsmouthNew JerseyMount LaurelParsippanyPrincetonNew MexicoAlbuquerqueNew YorkLong IslandNew York CityNorth Carolina
CharlotteDurhamRaleighOhioCincinnatiClevelandColumbusOregonPortlandPennsylvaniaAllentownConshohockenHarrisburgPhiladelphiaPittsburghSouth CarolinaCharlestonColumbiaGreenvilleTennesseeMemphisNashvilleTexasAustinDallas/Fort WorthHoustonMidlandSugarlandVirginiaNorfolkRichmondTyson CornerWashingtonBellevueSeattleWisconsinFox ValleyMadisonMilwaukee
CANADAAlbertaCalgaryEdmontonGreater TorontoBritish ColumbiaKelownaVancouverVictoriaManitobaWinnipegNew BrunswickMonctonNova Scotia
HalifaxOntarioGreater Toronto London OntarioOttawaWaterlooQuebecMontrealSaskatchewanReginaSaskatoon
LATIN AMERICAArgentinaBuenos AiresBrazilFortalezaReciteRio de JaneiroSao PauloChileSantiagoColumbiaBarranquillaBogotaMedellin CaliCosta RicaSan JoseMexicoCiudad De MexicoGuadalajaraJuarezMonterreyPueblaQueretaroTijuanaRepublic of PanamaPanama CityPeruLima
EUROPE, MIDDLE EAST & AFRICAAlbaniaTiranaAustriaViennaBelarusMinskBelgiumAntwerpDiegemBulgaria
SofiaCroatiaZagrebCzech RepublicPragueDenmarkAalborgAarhusCopenhagenFrederiksbergOdenseVejleEstoniaTallinnFinlandHelsinkiFranceLyonParisToulouseGermanyBerlinDusseldorfFrankfurtMunichStuttgartGreeceAthensHungaryBudapestIrelandDublinIsraelTel AvivItalyMilanRomeLatviaRigaLithuaniaVilniusMontenegroPodgoricaMoroccoNetherlandsAmsterdamEindhovenRotterdamNorwayOsloPolandKatowiceKrakowPozanan
SzczecinWarsawWrocławPortugalLisbonPortoRomaniaBucharestRussiaMoscowSt. PetersburgSaudi ArabiaJeddahRiyadhSerbiaNew BelgradeNisSlovakiaBratislavaSouth AfricaCape TownJohannesburgSpainMadridSwedenGoteborgStockholmSwitzerlandGenevaZurichTurkeyIstanbulUkraineKyivUnited Arab EmiratesAbu DhabiCairo - EgyptDubaiUnited KingdomBelfastBirminghamBristolEdinburghGlasgowLeedsLiverpoolLondon CityLondon West EndManchesterUxbridge
ASIA PACIFICAustralia
AdelaideBallartBrisbaneCairnsCanberraDarwinGeelongGold CoastMelbourne CBD East WestNewcastlePerthSunshine CoastSydney CBD North South Southwest WestToowoombaTownsvilleWollongongMainland ChinaBeijingChengduGuangzhouHangzhounNanjingShanghaiShenzhenTianjinWuhanShenyangHong KongHong Kong Wanchai KowloonIndiaBengaluruChennaiGurgaonKolkataMumbaiNew DelhiPuneIndonesiaJakartaJapanOsakaTokyoNew ZealandAshburton
Auckland CBDChristchurchDunedinHamiltonHawkes BayNelsonNorth ShorePalmerston NorthQueenstown-LakeSouth AucklandTaurangaWellingtonPakistanIslamabadKarachiLahorePhilippinesCebu CityManilaSingaporeSingaporeSouth KoreaSeoulTaiwanVietnamHanoiHo Chi Minh

R E G I O N A L O F F I C E S
San Jose/Silicon Valley450 West Santa Clara StreetSan Jose, CA 95113+1 408 282 3800
Gilroy/South County8070 Santa Teresa Boulevard, Suite 220Gilroy, CA 95020+1 408 842 7000
San Francisco Peninsula203 Redwood Shores Parkway, Suite 125Redwood City, CA 94065+1 650 486 2200
San Francisco50 California Street, Suite 1900San Francisco, CA 94111+1 415 788 3100
Oakland/East Bay1999 Harrison Street, Suite 1750Oakland, CA 94612+1 510 986 6770
Pleasanton/East Bay3825 Hopyard Road, Suite 195Pleasanton, CA 94588+1 925 463 2300
Fairfield/North Bay360 Campus Lane, Suite 101Fairfield, CA 94534+1 707 863 0188
Walnut Creek/East Bay1850 Mt. Diablo Boulevard, Suite 200Walnut Creek, CA 94596+1 925 279 0120
Stockton/Central Valley3439 Brookside Road, Suite 108 Stockton, CA 95219+1 209 475 5100
Sacramento301 University Avenue, Suite 100 Sacramento, CA 95825+1 916 929 5999
Colliers International is a global leader in real estate services with more than 13,500 professionals operating out of 482 offices in 62 countries. Colliers provides a full range of services to real estate users, owners and investors worldwide including: global corporate solutions; sales and lease brokerage; property and asset management; project management; hotel investment sales and consulting; property valuation and appraisal services; mortgage banking and insightful research. Colliers has 10 offices in Northern California and Nevada. CA License No. 00490878