market potential for credit insurance
TRANSCRIPT

1
MARKET POTENTIAL FOR CREDIT INSURANCE
NOVEMBER 14, 2003
i NDICUS ANALYTICS B - 17 GREATER KAILASH ENCLAVE 2
New Delhi 110048, India HTTP://WWW.INDICUS.NET, [email protected], (91-11) 29222838/63

2
Chapter 1
Introduction and Summary
Background • Credit to households one of the fastest growing segments of the financial sector. • Households comprise:
– Individuals – Proprietorships – Partnerships – HUFs
– Cooperatives and religious organizations Household Credit • Household credit market has been growing rapidly through the eighties and nineties and
is expected to continue. This is due to:
– Demographics: high proportion of population among younger age groups in the country
– Fast expanding consumption opportunities in the post-1991 reform period • Banks have always been the key credit provider to households in the formal sector and
will continue to be so as is the case internationally • Household credit has been growing at about …. percent through the nineties and this
expected to continue through the next decade • Growth has been, and is expected to be, similar for bank loans as well as other types of
loans
Changes in Financial Liabilities of Household Sector
0
5,000
10,000
15,000
20,000
25,000
30,000
35,000
40,000
1970-71 1975-76 1980-81 1985-86 1990-91 1995-96 2000-01
Rs. 10 Mill
Total Loans Bank Loans

3
This study • Focuses on Credit to individuals
– Personal loans for consumption purposes
– Proprietorships, partnerships etc., for commercial purposes • Provided by organized sector both for personal and commercial purposes • It includes any formal loans whose repayment is affected by the health/life conditions of
the key borrowing individual • Kinds of loans included in the study
– Personal loans for durables, housing, others such as education – Professionals, self-employed, owners of small and tiny industries, agriculturists, etc.
Key Objectives of the study
– To identify insights into market characteristics that enables Max New York Life (MNYL) to satisfy credit-life insurance requirements
– Size of the accessible credit insurance industry – Characteristics of various segments of the credit industry
– What industry professionals believe
– What are the consumers ‘openness’ levels towards credit-life insurance The Market Size
– The credit-market size considered includes:
– Providers of personal credit – Providers of credit for commercial purposes
– The ‘accessible’ market includes lenders that are not currently allied to major insurance firm
Providers of Personal Credit
– Commercial banks: include different kinds of Banks, large and small, public and private, Indian and foreign
– Public Sector: includes State Bank of India and its associate banks as well as other nationalized banks
– Private sector (Indian): This includes the newly set-up HDFC Bank and ICICI bank as well as many older private sector banks. The larger private sector banks are associated with insurance firms, and therefore cannot be considered to be ‘accessible’. However many private banks are still not affiliated with any insurance firm.
– Private sector (Foreign): Some foreign banks are quite large and associated with a high degree of dynamism in providing personal loans such as Citibank. However many others are predominantly oriented towards financing commercial and trade requirements
– Regional Rural Banks: are typically small banks that have a high degree of rural reach. They are also un-affiliated with insurance firms.

4
� Credit Card loans: are provided by all types of banks, however the credit card lending is not-reported separately but as a part of overall ‘personal loans’. This study therefore has not been able to include them as a separate entity.
– Non Banking Finance Companies (NBFCs)
– Non-Housing NBFCs: These financial institutions grew rapidly through the nineties, however due to competition from the banking sector their growth has slowed down. It is expected that they will not be important players in the future. However, many automobile companies have their own NBFCs and these may continue to have some importance in the future. Most NBFCs are unaffiliated with insurance firms, though a few are.
– Housing finance companies: A few HFCs have been quite strong and are growing rapidly such as HDFC. However, few smaller ones are likely to survive the competition from Banks. The smaller HFCs are also unaffiliated though the larger ones such as HDFC are.
– Corporate loans to employees: Large public sector firms as well as a few [private sector non-financial firms are large providers of loans to their employees. Most such companies are unaffiliated with insurance firms.
Providers of Credit for Commercial Purposes
– Commercial banks
– Public Sector – Private sector (Indian) – Private sector (Foreign) – Regional Rural Banks � Kisan Credit Cards: Kisan credit cards are designed to enable easy credit to farmers
from Scheduled Commercial Banks. However these loans are categorized as direct agriculture loans and have not been separately dealt with.
– Credit Societies/ Cooperatives: Cooperative, credit societies, self help groups, have been important players; however they are typically poorly managed and subject to stringent regulatory oversight. Though they are predominantly un-affiliated with insurance firms, partnering with these institutions will be a long-term process, as they are not known for their flexibility.
– State finance and other development corporations: Many state organizations provide credit for ‘development’ or ‘socially desirable’ purposes. These include to disadvantaged sections, small-scale industries, etc. These organizations are also not known for their flexibility or dynamism. If current trends continue, they will soon become insignificant players. However many are reported to be changing and may be open to partnering. However, it is reported that single-person-dependent loans are not a high share of their total outstanding.
Purposes of Credit
– Housing: Housing loans are a rapidly expanding segment and are likely to remain so for the foreseeable future.
– Automobiles, Education, Health and other personal: These are not reported individually and it is not possible to disentangle the various components of the ‘other personal loans’.

5
There is significant flexibility related to duration of loans. Typically however for health and other consumption purposes loans tend to be for about 2 years, for automobiles for two to five years, and for education from five to 20 years. All are secured loans.
– Commercial: Almost all commercial loans are secured loans and could be highly short term to 5 to 20 years. Generally commercial loans to individuals have a good repayment history.
Commercial Bank Loans for Housing, Durables, & Other: Characteristics – Public Sector: Well spread across country
– Private sector (Indian): Dynamic, expanding rapidly
– Private sector (Foreign): Concentrating on metros and ‘premium’ customers
– Regional Rural Banks: large rural spread but many are poorly run Average Account Size of All Personal Loans
Amt/Acc (Rs) 2001
Consumer Durables
Housing Rest of Personal All Personal
Public Sector Foreign Banks RRBs Private Indian Total
Housing Finance Institutions: Characteristics
– Both SCBs and HFCs
– SCBs also considered previously
– Many not affiliated with insurance companies
– But could potentially offer own credit-life products
– Possibility of alliance is open – Cost of providing credit-life products/service of critical importance
Non Banking Finance Corporations (non-housing): Characteristics
– Have suffered loss in market share from Banks in the past
– RRBs the most aggressive players in this segment
– Banks report durable and auto loans under ‘Durables’ and ‘Rest of Personal’ categories
– Not possible to disentangle market size cleanly
Calculating Market Size
– Use 2001 as base year as data are provisional or estimates for later years
– First estimate total possible market for credit-life
– But some of this is inaccessible
– Then estimate all ‘accessible’ market size
Problem in estimating market size
– Non availability of categorization of purpose from many sources
– Non uniformity in categorization of purpose from many sources
– Only broad numbers available for some (eg. RRBs)

6
– Inter FI lending: Possibility of double counting – Focus more on identification of accessible markets
– Estimations at a single point in time as well as relevant break-ups of sub-components have been conducted taking into consideration the above factors
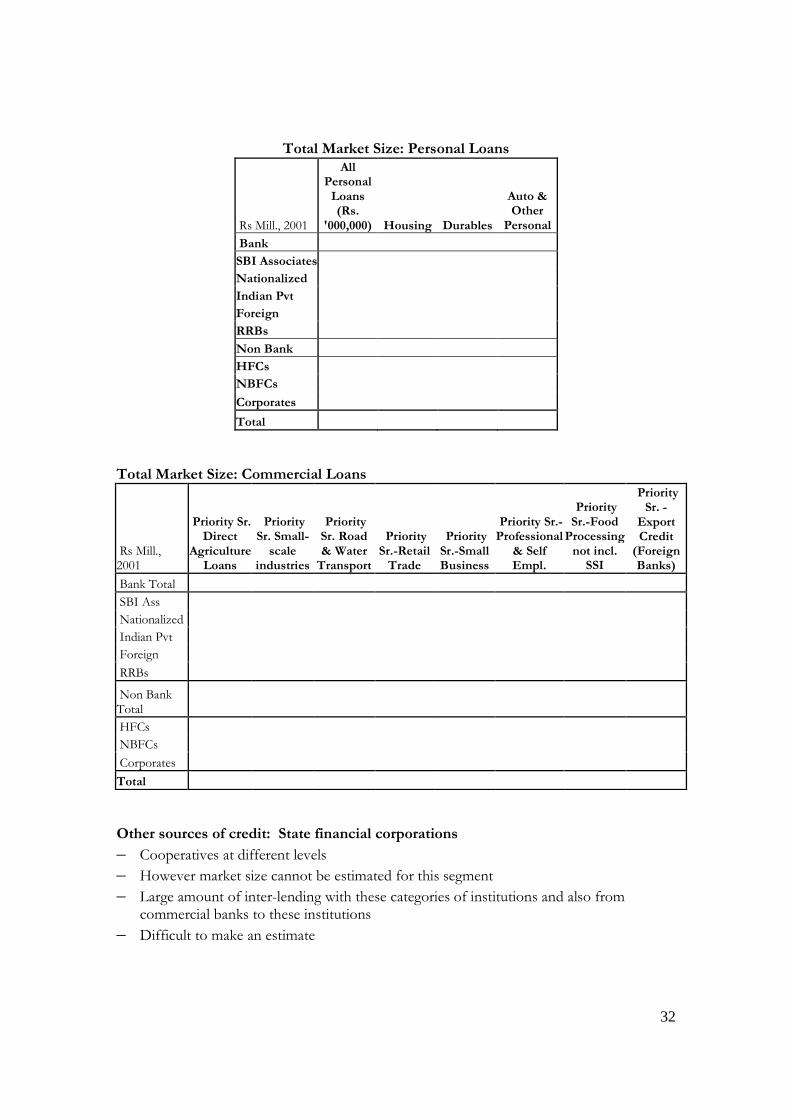
Total Market Size: Personal Loans
Rs Mill., 2001
All Personal Loans (Rs.
'000,000) Housing Durables
Auto & Other
Personal
Bank
SBI Associates
Nationalized
Indian Pvt
Foreign
RRBs
Non Bank
HFCs
NBFCs
Corporates
Total
Total Market Size: Commercial Loans
Rs Mill., 2001
Priority Sr. Direct
Agriculture Loans
Priority Sr. Small-scale
industries
Priority Sr. Road & Water Transport
Priority Sr.-Retail Trade
Priority Sr.-Small Business
Priority Sr.-Professional
& Self Empl.
Priority Sr.-Food Processing not incl. SSI
Priority Sr. -
Export Credit (Foreign Banks)
Bank Total
SBI Ass
Nationalized
Indian Pvt
Foreign
RRBs
Non Bank Total
HFCs
NBFCs
Corporates
Total
Other sources of credit • Include
o State financial corporations
7
o Cooperatives at different levels • However market size cannot be estimated for this segment • Large amount of lending within these categories of institutions and also from
commercial banks to these institutions combined with poor reporting
– Receive loans from SCBs and others under ‘Agriculture’ or ‘Priority’ head
– Highly regulated
– Most have personnel with low financial skill-base
– Highly structured operations
– Many are re-appraising role in changing economy
– Almost all loans backed by tangible assets in the case of SFCs and also for many cooperative loans
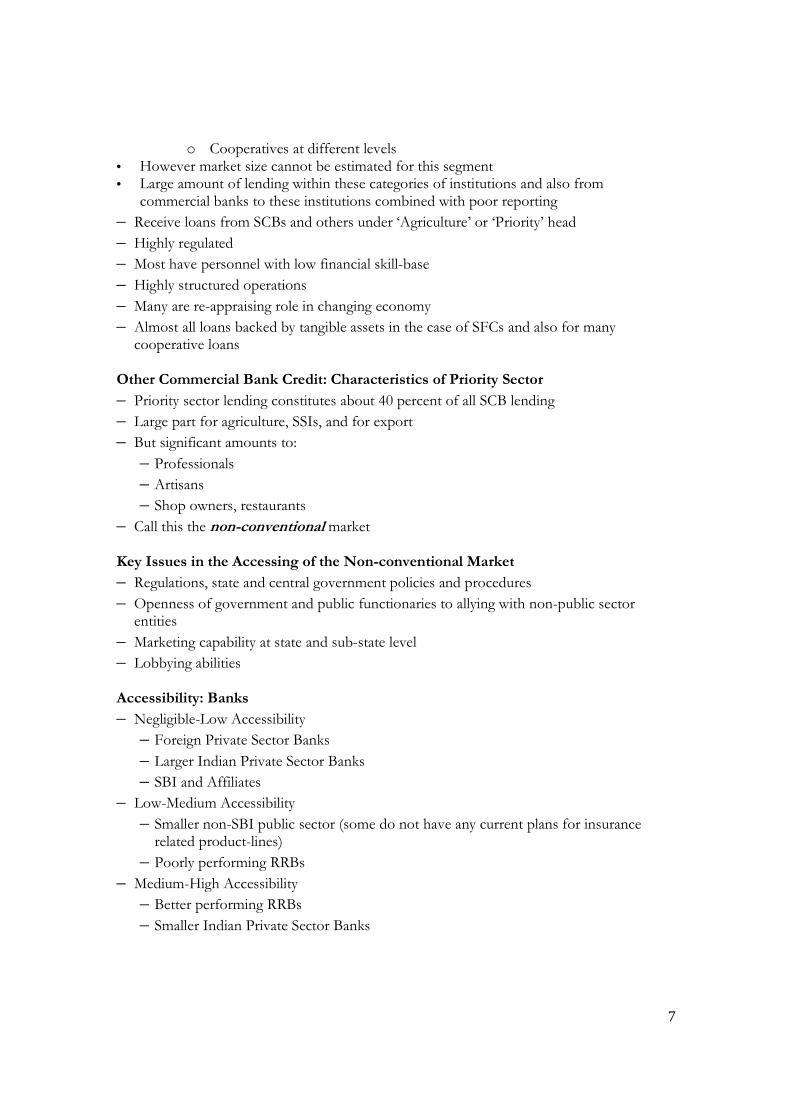
Other Commercial Bank Credit: Characteristics of Priority Sector
– Priority sector lending constitutes about 40 percent of all SCB lending
– Large part for agriculture, SSIs, and for export – But significant amounts to:
– Professionals – Artisans
– Shop owners, restaurants
– Call this the non-conventional market
Key Issues in the Accessing of the Non-conventional Market
– Regulations, state and central government policies and procedures
– Openness of government and public functionaries to allying with non-public sector entities
– Marketing capability at state and sub-state level
– Lobbying abilities Accessibility: Banks
– Negligible-Low Accessibility
– Foreign Private Sector Banks – Larger Indian Private Sector Banks – SBI and Affiliates
– Low-Medium Accessibility
– Smaller non-SBI public sector (some do not have any current plans for insurance related product-lines)
– Poorly performing RRBs
– Medium-High Accessibility
– Better performing RRBs
– Smaller Indian Private Sector Banks
8
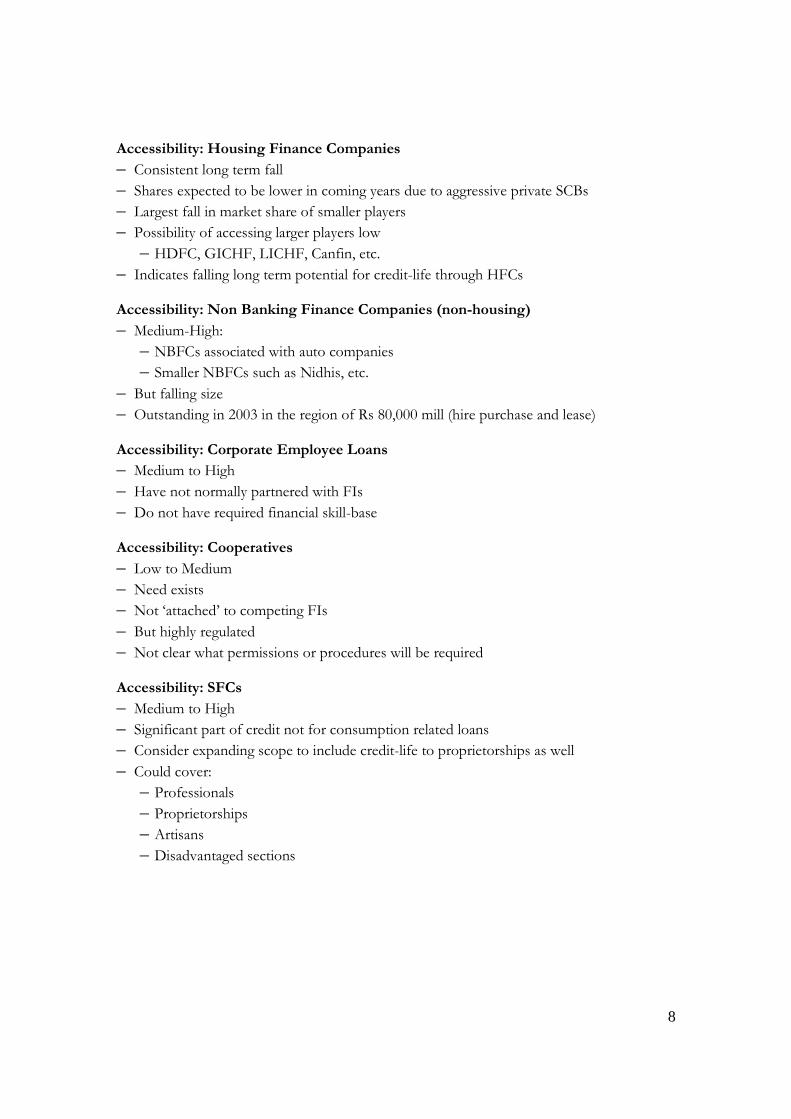
Accessibility: Housing Finance Companies
– Consistent long term fall
– Shares expected to be lower in coming years due to aggressive private SCBs
– Largest fall in market share of smaller players
– Possibility of accessing larger players low
– HDFC, GICHF, LICHF, Canfin, etc.
– Indicates falling long term potential for credit-life through HFCs Accessibility: Non Banking Finance Companies (non-housing)
– Medium-High:
– NBFCs associated with auto companies
– Smaller NBFCs such as Nidhis, etc.
– But falling size – Outstanding in 2003 in the region of Rs 80,000 mill (hire purchase and lease) Accessibility: Corporate Employee Loans
– Medium to High
– Have not normally partnered with FIs
– Do not have required financial skill-base
Accessibility: Cooperatives
– Low to Medium
– Need exists
– Not ‘attached’ to competing FIs
– But highly regulated – Not clear what permissions or procedures will be required Accessibility: SFCs
– Medium to High
– Significant part of credit not for consumption related loans
– Consider expanding scope to include credit-life to proprietorships as well
– Could cover:
– Professionals – Proprietorships – Artisans
– Disadvantaged sections

9
Accessible Market: Personal Loans
Rs Mill. 2001 Housing Durables
Auto & Other
Personal All Personal
Loans
Banks
SBI Ass
Nationalized
Indian Pvt
Foreign
RRBs
Non Bank
HFCs
NBFCs
Corporates
Total
Accessible Market: Relevant Commercial Loans from Priority Sector Advances
Rs Mill. 2001
Priority Sr. Direct
Agriculture Loans
Priority Sr. Small-scale
industries
Priority Sr. Road & Water Transport
Priority Sr.-Retail Trade
Priority Sr.-Small Business
Priority Sr.-Professional
& Self Empl.
Priority Sr.-Food Processing not incl. SSI
Priority Sr. -
Export Credit (Foreign Banks)
Total (Relevant Priority Sector)
Banks
SBI Ass
Nationalized
Indian Pvt
Foreign
RRBs
Non Bank
HFCs
NBFCs
Corporates
Total

10
Total Accessible Market: Banks, corporate, NBFCs etc.
Rs Mill. 2001
All Personal Loans (Rs. '000,000)
Total (Relevant Priority Sector) Total
Banks
SBI Ass
Nationalized
Indian Pvt
Foreign
RRBs
Non Bank
HFCs
NBFCs
Corporates
Total
Total Accessible Market Size
– Total accessible market size of about Rs 1,555 Billion as of 2001
– Market has been growing at about 20% in early 2000s but is expected to grow by about 15% annually this decade
– Conservative estimates as this does not include those by SFCs, cooperatives etc.
– Avoid possibilities of double counting Characteristics of borrowers: SEC • Socio-Economic Classification (SEC A, B, C, D & E): SEC A indicates better incomes as
well as potential income than that for SEC B and so on. SEC categorization is based on a combination of education and occupation characteristics. Overall we find that
– Inclination to borrow is somewhat evenly divided between different SEC segments
– However typical size of loans varies
– The openness to credit-life insurance is not dependent upon SEC status of a person.
– However those in lower SECs had great difficulty in understanding the concept of SEC
– Financial institution representatives informally reported larger defaults and ‘fraudulent’ activity among lower SECs
Overall, it appears that SEC categorization should not form the basis of any credit-life marketing strategy Characteristics of borrowings: Geographic
– The southern region accounts for a large part of the total credit – Western and northern regions next in importance
– Eastern region least importance

11
– If economic growth is an indication, the importance of the western half of India is only going to increase.
– The western half includes the area starting from Punjab, Haryana, Delhi, Rajasthan, Gujarat, Maharashtra, Karnataka, Kerala and also Tamil Nadu and Andhra Pradesh.
The following two maps show the share of each state in India’s total (i) relevant priority sector credit and (ii) personal loans, by commercial banks. Darker shades in each represent a higher share. Note that despite lower populations the southern states top among all states in the share of total loans in both categories.

12
Inclinations of the consumers
– Surety and not investment/tax saving are of critical factor in insurance decisions of most – this also reflects need for credit-insurance
– Consumers are not necessary loyal to brands/past relationships – they are most concerned with price, range of options, and then with quality of services.
– Formal sources of information are of least importance – friends, family, colleagues tend to be the most preferred sources of information
Views towards credit-life insurance
– Consumers are on the whole positive about the idea of credit-life insurance
– Different types of consumers – across age, socio-economic profile, asset ownership, as well as family structure, all show relatively high levels of appreciation for the concept

13
– However premiums will be of critical importance
– The results suggest that one time premiums and large amounts not preferred – some preference for including credit-life insurance within the regular repayment structure
Cost of credit life
– Seven in ten consumers are open to purchasing credit life at a very low premium of Rs 20 for a Rs 1000 repayment (2 percent of the repayment).
– However this falls to three in ten if premium at 2% is continued but repayment amount is increased to Rs 10,000.
– When the premium amount is kept the same at Rs 5000 but the extra percentage paid for credit life is changed from 0.5 to 6% (Rs 25 to Rs 300) we find only a small fall in the preference for credit-life
– This implies that the rupee amounts will play a critical role in consumer acceptability
– That is, larger premiums could be charged as long as they are broken into small amounts Consumer characteristics and credit-life
– SEC profile: Higher SECs are more likely to prefer credit life insurance
– Asset Profile: The economically better off are somewhat more likely to purchase credit-life insurance
– Family type: Family type does not appear to play an important role in consumer preferences
– Household size: Those in larger households are somewhat less likely top prefer credit-life insurance.
Characteristics of Credit
– Average amounts: Vary considerably across types of consumer, institution, segment, etc.
– Time-profile: Time profile varies, but does not necessarily play a role directly in the attractiveness of credit-life services. The key determinant is the amount of the premium paid. Moreover, money illusion appears to play a role. That is, consumers do not prefer larger amounts (one time payments).
– NPAs: Most FI representatives were unaware of what percentage of their NPAs in their institution were due to death of the borrower.
– Expected growth: We expect a 15 percent annual growth in the different xomponents fo credit. This is also in line with what industry professionals feel. However some even expect growth to be in the range of 20 to 25 percent annually in the coming decade.
In informal discussions with both consumers as well as financial institution representatives we could not identify any of the above as a significant enough factor for basing a marketing strategy on. This was as Lenders views
– Senior and middle managers were all positive to the idea of credit-life insurance
– All believed that their institutions could potentially partner with other institutions

14
– However no one could categorically commit to the same – they considered this to be a decision that only the senior managers collectively could take
– For government entities partnering with an MNC might be an issue
– Believed that the key potential advantages were:
– Reduction of their risk profile
– Reduction in risk for consumer
– Did not think that their profits would be a key criteria for partnering
– However, a share of the credit-life premiums might smoothen decisions
– Lenders preferred the following types of loans the most for credit insurance services:
– Long-term loans especially greater than three years
– Short-term loans of large amounts
– (However consumers do not necessarily have such preferences)
– Some respondents were also in favor of compulsory coverage
– Emphasized importance of simple documentation for such a service
– Some preference for adding credit-life policies to new products not existing products as it may lead to confusion
Summary
• This is a large enough accessible market for a non-affiliated insurance firm • Accessing the bulk of the market would involve interacting with both the private and
public sector • However scales can best be achieved if public sector financial institutions are accessed. • The southern part of India is the largest market • Consumers suffer from ‘illusion’ and are more likely to be agreeable to pay high
premiums if it is broken into smaller parts • Though the better off consumers will be more willing to purchase credit-life, significant
shares of the less well off will be interested • Financial institutions will generally be open to the idea of partnering with other
institutions • But some concerns may be there in some public sector entities about partnering with
MNCs • Moreover death does not appear to be an important contributor to NPAs in the
perception of financial institution respondents. This may make it difficult to ally with them without some other incentive to partnering institution.
• Consumers would be more open to it as they are highly family oriented • The key marketing challenge is therefore less related to design of credit-life products and
more towards the creation of alliances with different types of lenders.

15
Chapter 2
Views of Financial Institutions’ Personnel
1. Background The idea behind involving Personnel from Financial Institutions was to get insights on: • Familiarity with credit life insurance • Personal views on credit life insurance • Their institution’s views on allying with insurance firms for such products • Appropriateness of institution’s openness level – whether the market is ‘ready’ • Perceived advantages and hindrances in offering such products Such an exercise is aimed at providing insights into the possibility of offering credit-life insurance through different types of financial institutions. The persons interviewed included Senior Managers/Managers from various types of Financial Institutions - Nationalised Banks, Cooperative Banks, Regional Rural Banks etc. The interviews were conducted in 2 states- Delhi and Madhya Pradesh. Representatives of the following classes of financial institutions were interviewed • Public Sector Bank (PSB) • Regional Rural Bank • Cooperative Bank • Housing Finance Bank • NBFC • Direct Sales Agent A set of questions was identified; respondents were then queried by way of a structured questionnaire (refer appendix 1). A prior appointment was fixed with representatives of financial institutions and an interviewer personally visited the offices to get responses to the questionnaire. In most cases a single question had to be verbally asked in different ways to gain an insightful enough answer (most respondents had a proclivity for single sentence responses).

16
2. Synopsis The brief summary of the responses is presented here. Most respondents were aware of the concept of credit-life insurance. However many were not aware of the details and also how it worked. They tended to be quite positively inclined to including credit-life as an add-on to their credit. For this purpose they were open to allying/partnering with other organizations. They also felt that their very senior management (which ultimately would take the partnering decision) would be open to alliances.
2.1 The loan procedure This question was aimed at understanding the criteria deployed by banks to assess the borrowers. All banks/ lending agencies have their own system of evaluation. The common criteria that emerge are: • Educational Qualifications • For Salaried class- Current salary, profile, status • For Business-Business reputation, Assets, Turnover • Credit repayment record • Family background • Minimum income level • Property- Whether house is rented or owned • Location of residence Most respondents sited at least 4 out of these as indispensable factors in assessing borrowers. Of these credit repayment record, family background (as also reflected in location of residence), salaries and occupation were the most critical. When pressed, it was difficult for respondents to clearly rank various factors in order of importance. 2.2 Risk factors All financial institutions take a risk when they lend, as there are always chances of non-repayment of loans. The questions were aimed at identifying risk factors encountered by a financial institution while lending and the precautions taken to mitigate these factors. None of the respondents were aware of the percentage distribution of NPAs due to various possible causes/risk factors. They were queried about the following risk factors: • Health problems • This is an important factor but most have backups in forms of collaterals/ guarantees to
recover the loan

17
• Generally there are no medical check ups of potential borrowers • Death • As death cannot be predicted it poses an obvious threat, especially in cases where one
key man runs the business • To lessen the risk some institutions specify age groups for lending. That is, many do not
provide loans to those above 60 years of age. • Most ask for collaterals/ security to recover loans • Loss of Income/ employment • Most individuals repay loans from current income • To lessen this risk all institutions conduct thorough checkups of individual’s and their
family’s backgrounds (as listed in ‘Loan procedure’ above) • Some institutions prefer government employees and some are averse to government
employees • Loans are generally extended to professionals who are highly qualified or who have
guarantors to take care of the loan • Most have not had any experiences of fraud cases, however fraud remains a perceived
risk • Many are also averse to provide loans to police, lawyers and politicians as sometimes it is
difficult to recover from them
2.3 NPA due to death This question helped find whether the organization has NPA (Non Performing Assets) due to death. As credit life insurance means insuring the person’s debts after his death it is important to understand this factor. Key findings: • Financial Institutions (FIs) have NPA but believe that death is not an important cause. • Most have collaterals/ security to recover NPAs • Some do not extend loans to persons beyond a specified upper age limit
2.4 Product segment: This question aims to identify the kinds of credit (product segments) that the respondents felt should be covered under credit life insurance. :
• Products involving large loan amounts such as
• Housing loans • Car loans • Educational loans

18
2.5 Tenure This question identifies time spans for loan repayment that the respondents felt should be covered under credit life insurance.
• Most favor long-term loans • Any loan for more than 3 years should be covered, since after 3 years predictions about
ability to repay are difficult • Short-term loans of a large amount are also favored 2.6 Acceptability of credit life insurance in India The idea was to utilize their better-informed perception in assessing the prospects of credit life insurance in India. According to the respondents: • Credit life insurance will be accepted • Reason- it would lead to family security and ease of mind • However, awareness has to be spread • Amount or % of premium should be minimal • Some FIs even want it to be made a part of policy so that all persons have to take it 2.7 Channels for distribution This question was aimed at understanding the distribution channels set up by FIs for credit disbursement. The responses reveal: • The bigger FIs and some smaller ones have their own channels in form of branches –
for example Canara Bank, Corporation Bank etc. • Few small FIs - Cooperative banks, Regional Rural Banks etc. have some tie ups for
distribution • But own channels remain the most prevalent across different types of institutions 2.8 Willingness to pay premium This question was asked to gain insights into whether persons would pay premium for availing credit life insurance. Most answers are: • Yes they would pay • Awareness/education has to be spread • Premium amount should be minimal

19
2.9 Critical persons The idea behind this question was to find who are the decision makers in the institution who could be approached for taking a decision regarding introduction of credit life insurance. The responses are: • In most cases it is the senior management that takes decisions • Most respondents feel that senior management would accept it • However, all raised queries about cost to the consumer and also the structuring of the
alliance 2.10 Key benefits This question aimed at understanding what would be the key benefits for the institution if it accepts credit life insurance. Following are identified as key benefits: • Ease of ‘selling’ credit- all say that it will ease the process of selling credit as it would
reduce the consumers perceived risk • Lower risk of credit repayment - all agree that it will reduce the risk involved for both
the borrower as well as the lender • Other potential benefits such as the financial institution’s share of the premium were not
considered to be important 2.11 Key success factors This question aimed at identifying the key factors that would help in ensuring acceptance and success of credit life insurance in India. The key success factors are: • Cost- should be minimal • Ease of access- should be very easily accessible, minimum documentation, hassle free • Product design- should involve options to choose from • Integrability with your range of credit products- this is considered very important by
most as it will benefit both clients as well as lenders • Interest in attaching with existing products – most believe that credit life insurance
should not be tried with existing products, as it would lead to confusion. Should be tried with new products
20
Chapter 3
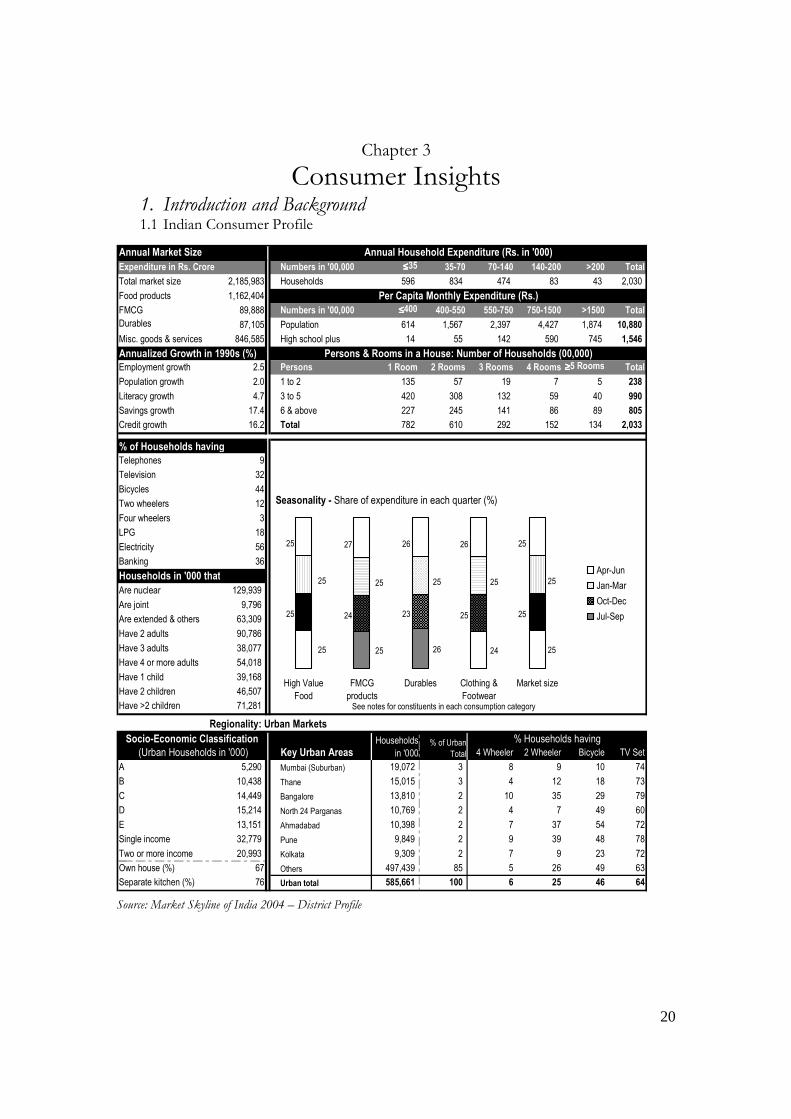
Consumer Insights 1. Introduction and Background 1.1 Indian Consumer Profile
1.2 1.3 1.4 1.5
Source: Market Skyline of India 2004 – District Profile Source: Market Skyline of India 2004 – District Profile
Annual Market Size
Numbers in '00,000 ≤≤≤≤35 35-70 70-140 140-200 >200 Total
Total market size 2,185,983 Households 596 834 474 83 43 2,030
Food products 1,162,404
FMCG 89,888 Numbers in '00,000 ≤≤≤≤400 400-550 550-750 750-1500 >1500 Total
Durables 87,105 Population 614 1,567 2,397 4,427 1,874 10,880
Misc. goods & services 846,585 High school plus 14 55 142 590 745 1,546
Annualized Growth in 1990s (%)
Employment growth 2.5 Persons 1 Room 2 Rooms 3 Rooms 4 Rooms ≥≥≥≥5 Rooms Total
Population growth 2.0 1 to 2 135 57 19 7 5 238
Literacy growth 4.7 3 to 5 420 308 132 59 40 990
Savings growth 17.4 6 & above 227 245 141 86 89 805
Credit growth 16.2 Total 782 610 292 152 134 2,033
% of Households having
Telephones 9
Television 32
Bicycles 44
Two wheelers 12
Four wheelers 3
LPG 18
Electricity 56
Banking 36
Households in '000 that
Are nuclear 129,939
Are joint 9,796
Are extended & others 63,309
Have 2 adults 90,786
Have 3 adults 38,077
Have 4 or more adults 54,018
Have 1 child 39,168
Have 2 children 46,507
Have >2 children 71,281 See notes for constituents in each consumption category
Regionality: Urban Markets
Key Urban Areas 4 Wheeler 2 Wheeler Bicycle TV Set
A 5,290 Mumbai (Suburban) 19,072 3 8 9 10 74
B 10,438 Thane 15,015 3 4 12 18 73
C 14,449 Bangalore 13,810 2 10 35 29 79
D 15,214 North 24 Parganas 10,769 2 4 7 49 60
E 13,151 Ahmadabad 10,398 2 7 37 54 72
Single income 32,779 Pune 9,849 2 9 39 48 78
Two or more income 20,993 Kolkata 9,309 2 7 9 23 72
Own house (%) 67 Others 497,439 85 5 26 49 63
Separate kitchen (%) 76 Urban total 585,661 100 6 25 46 64
Per Capita Monthly Expenditure (Rs.)
Persons & Rooms in a House: Number of Households (00,000)
Socio-Economic Classification Households
in '000% of Urban
Total
% Households having
(Urban Households in '000)
Annual Household Expenditure (Rs. in '000)
Expenditure in Rs. Crore
25 25 26 24 25
25 25 25 25 25
High Value
Food
FMCG
products
Durables Clothing &
Footwear
Market size
25 24 23 25 25
25 27 26 26 25
High Value
Food
FMCG
products
Durables Clothing &
Footwear
Market size
Seasonality - Share of expenditure in each quarter (%)
High Value
Food
FMCG
products
Durables Clothing &
Footwear
Market size
Apr-Jun
Jan-Mar
Oct-Dec
Jul-Sep

21
Table 1: Distribution of credit DISTRIBUTION OF CREDIT- MAJOR CITIES (New Delhi, Mumbai, Calcutta, Chennai, Pune,
Hyderabad, Bangalore)
SEC A SEC B SEC C SEC D SEC E Total
Housing
Durables
Personal
Residual
Total
Housing
Durables
Personal
Residual
Total Source: Estimates from NSSOs Large expenditure survey – 55th round
• Most credit is for ‘personal’ uses. This includes:
• Education • Consumption including marriages, festivals, ceremonies and health
requirements • Credit cards etc.
• Housing is the other key segment • The term ‘residual’ includes the unexplained part of total loans • There are few differences between different SEC groupings
Sample Size
• Total Respondents: 1660 • SEC classification
Table 2: Socio-economic classification
SEC Freq. Percent
A1
A2
B1
B2
C
Others
Total
• Most respondents belong to SEC A1, A2 and B1

22
• The sample captures a large share of young and middle aged persons
Table 3: Number of adults per family
Adults Freq. Percent
Missing
1
2
3
4
5
6
7
8
>8
Total
• Most respondents belong to families with 2 to 4 adult members
Figure 1: Age Distribution of Respondents
0
20
40
60
80
100
120
19 22 24 26 28 30 32 34 36 38 40 42 44 46 48 50 52 54 56 58 60 62 64 66 71
Freq.

23
Table 4: Type of family
Family type Freq. Percent
Joint
Extended
Nuclear
Other
Total
• Joint families are those that contain more than one married sibling sharing a single
kitchen • Extended households include those where parents share a kitchen with a married
child • Largest sample is of members of nuclear families • Extended families are the next large set
Table 5: Ownership of house
House type Freq. Percent
Self
Rented
Total
• Most respondents own the house they live in
Table 6: Ownership of vehicles
Automobile Freq. Percent
4 Wheeler
2 Wheeler
Bicycle
None
Total
• The sample captures the well off • Almost half of the respondents own a 4 wheeler • Two-wheelers are owned by a large share of the respondents

24
Table 7: Motivation
Work motivation Percent
Work for my family’s happiness/comfort
Work for self-satisfaction/comforts
Total
• Family’s comfort and happiness is the predominant motivation for the bulk of the
respondents
2. Borrowing and Insurance Behavior Table 8: Type of insurance
Type of insurance
Life insurance
Accident insurance
Health insurance
Fire insurance
Calamities insurance
No
Yes
Missing
Total
• Most families / individuals have life insurance • Half do not have health insurance • Most prefer to have accident insurance • Fire and calamities insurance is held by few
Table 9: Motives for insurance
Motive for investment
Investment Tax savings Surety Family Pressure
Very important
Important
Less Important
Not Important
Missing
Total
• More than three fourths consider surety to be the most insurance factor for
insurance • Investment and tax savings are also considered to be important but this preference is
not as strong

25
• Family pressure was considered by most to be unimportant
Table 10: Criteria for insurance
Criteria for choosing the creditor
Low interest rate
Customer friendliness of creditor
Range of credit
terms/options
Past relationship
Ease of access of creditors
office
Very important
Moderately Important
Important
Less Important
Not Important
Missing
Total
• Low interest rates are the most important determinants of loan-scheme for almost
four fifths of the respondents • Customer friendliness and range of credit are next in importance
Table 11: Sources of information
Source of information on loans
Very important
Moderately Important Important
Less Important
Not Important Missing
Total
Friends or family
Office colleagues and associates
Prospective creditor
Other specialists
Internet search
Magazines and books
Advertisement
Other (Specify)
• Relations, friends, office colleagues and associates are considered to be very
important sources of information by most respondents • Formal sources of information are not as important • However information from the creditor is next in importance • Media is not considered a very important source of information by most

26
3. Views on Credit Insurance
3.1 Policy Preference 1
Table 12: Preference for credit-life Sec 1020 with
credit-life is preferred to 1000 w/out credit life
3060 with credit-life is preferred to 3000 w/out credit life
5100 with credit-life is preferred to 5000 w/out credit life
7650 with credit-life is preferred to 7500 w/out credit life
10200 with credit-life is preferred to 10000 w/out
credit life
Total
• At minimal premiums credit-life insurance is preferred by more than 70 percent • Each of the options above imply a marginal credit life premium of 2% over the total
premium • Note the large fall in percentage preferring credit life as the basic amount increases • This suggests that large money amounts are not preferred • A large number of respondents were found to be in favor of credit life in this set of
queries • More importantly, amount matters much more than percentage; that is, consumers
may be willing to pay more as long as amount of extra premium paid is not large
Table 13: Preference for credit-life Sec 1020 with
credit-life is preferred to 1000 w/out credit life
3060 with credit-life is preferred to 3000 w/out credit life
5100 with credit-life is preferred to 5000 w/out credit life
7650 with credit-life is preferred to 7500 w/out credit life
10200 with credit-life is preferred to 10000 w/out
credit life
A1
A2
B1
B2
Others
Total
• Higher SECs are more likely to prefer credit-life • However even the lower SECs have some preference for the same

27
Table 14: Number of adults per family
Adults 1020 with
credit-life is preferred to 1000 w/out credit life
3060 with credit-life is preferred to 3000 w/out credit life
5100 with credit-life is preferred to 5000 w/out credit life
7650 with credit-life is preferred to 7500 w/out credit life
10200 with credit-life is preferred to
10000 w/out
credit life
Missing
1
2
3
4
5
6
7
8
Total
• Larger families lead to lesser need for insurance • This is because larger families tend to self-insure implicitly
Table 15: Type of family
Family type 1020 with credit-life is preferred to 1000 w/out credit life
3060 with credit-life is preferred to 3000 w/out credit life
5100 with credit-life is preferred to 5000 w/out credit life
7650 with credit-life is preferred to 7500 w/out credit life
10200 with credit-life is preferred to 10000 w/out
credit life
Joint
Extended
Nuclear
Other
Total
• Family type is less important than family size • Other factors such as automobile ownership or home ownership (proxies for
economic class) have no significant impact on credit-life insurance • Neither does age have a significant impact on proclivity towards credit-life except for
those above 60 years of age

28
Chapter 4
Market Size
Synopsis & Insights
Background
Different components of the formal credit market are studied in this section. These include: • Housing finance • Consumer durables finance • Automobile finance • Employee loans • Personal loans • Priority Sector lending by Banks • Loans by State Finance Corporations and Cooperatives Of these the last are not included in the calculation of overall market sizes due to significant lending between different financial institutions. There inclusion could lead to double counting. Market Size Market sizes have been calculated from information contained in various parts of this chapter. This has been done at a company/institution-level basis in the accompanying MS Excel spreadsheet. The Market Size includes
– The credit-market size considered includes:
– Providers of personal credit
– Providers of credit for commercial purposes
– The ‘accessible’ market includes lenders that are not currently allied to major insurance firm

29
Providers of Personal Credit
– Commercial banks: include different kinds of Banks, large and small, public and private, Indian and foreign
– Public Sector: includes State Bank of India and its associate banks as well as other nationalized banks
– Private sector (Indian): This includes the newly set-up HDFC Bank and ICICI bank as well as many older private sector banks. The larger private sector banks are associated with insurance firms, and therefore cannot be considered to be ‘accessible’. However many private banks are still not affiliated with any insurance firm.
– Private sector (Foreign): Some foreign banks are quite large and associated with a high degree of dynamism in providing personal loans such as Citibank. However many others are predominantly oriented towards financing commercial and trade requirements
– Regional Rural Banks: are typically small banks that have a high degree of rural reach. They are also un-affiliated with insurance firms.
– Credit Card loans: are provided by all types of banks, however the credit card lending is not-reported separately but as a part of overall ‘personal loans’. This study therefore has not been able to include them as a separate entity.
– Non Banking Finance Companies (NBFCs)
– Non-Housing NBFCs: These financial institutions grew rapidly through the nineties, however due to competition from the banking sector their growth has slowed down. It is expected that they will not be important players in the future. However, many automobile companies have their own NBFCs and these may continue to have some importance in the future. Most NBFCs are unaffiliated with insurance firms, though a few are.
– Housing finance companies: A few HFCs have been quite strong and are growing rapidly such as HDFC. However few smaller ones are likely to survive the competition from Banks. The smaller HFCs are also unaffiliated though the larger ones such as HDFC are.
– Corporate loans to employees: Large public sector firms as well as a few private sector non-financial firms are large providers of loans to their employees. Most such companies are unaffiliated with insurance firms.
Providers of Credit for Commercial Purposes
– Commercial banks
– Public Sector
– Private sector (Indian)
– Private sector (Foreign)
– Regional Rural Banks
– Kisan Credit Cards: Kisan credit cards are designed to enable easy credit to farmers from Scheduled Commercial Banks. However these loans are categorized as direct agriculture loans and have not been separately dealt with.

30
– Credit Societies/ Cooperatives: Cooperative, credit societies, self help groups, have been important players; however they are typically poorly managed and subject to stringent regulatory oversight. Though they are predominantly un-affiliated with insurance firms, partnering with these institutions will be a long-term process, as they are not known for their flexibility.
– State finance and other development corporations: Many state organizations provide credit for ‘development’ or ‘socially desirable’ purposes. These include to disadvantaged sections, small-scale industries, etc. These organizations are also not known for their flexibility or dynamism. If current trends continue, they will soon become insignificant players. However many are reported to be changing and may be open to partnering. However, it is reported that single-person-dependent loans are not a high share of their total outstanding.
Purposes of Credit
– Durables: Consumer durables
– Housing: Housing loans are a rapidly expanding segment and are likely to remain so for the foreseeable future.
– Automobiles, Education, Health and other personal: These are not reported individually and it is not possible to disentangle the various components of the ‘other personal loans’. There is significant flexibility related to duration of loans. Typically however for health and other consumption purposes loans tend to be for about 2 years, for automobiles for two to five years, and for education from five to 20 years. All are secured loans.
– Commercial: Almost all commercial loans are secured loans and could be highly short term to 5 to 20 years. Generally commercial loans to individuals have a good repayment history.
Commercial Bank Loans for Housing, Durables, & Other: Characteristics
– Public Sector: Well spread across country
– Private sector (Indian): Dynamic, expanding rapidly
– Private sector (Foreign): Concentrating on metros and ‘premium’ customers
– Regional Rural Banks: large rural spread but many are poorly run What SCBs lend for
– Durables: Includes consumer durables, PCs, etc
– Housing: Housing purchase, repair and construction
– Other Personal
– Credit Cards
– Automobiles
– Education, Health Etc.
– Not all SCBs follow exactly same categorization

31
Average Account Size of All Personal Loans Amt/Acc (Rs) 2001
Consumer Durables
Housing Rest of Personal All Personal
Public Sector Foreign Banks RRBs Private Indian Total
Housing Finance Institutions: Characteristics
– Both SCBs and HFCs
– SCBs also considered previously
– Many not affiliated with insurance companies
– But could potentially offer own credit-life products
– Possibility of alliance is open
– Cost of providing credit-life products/service of critical importance
– Non Banking Finance Corporations (non-housing): Characteristics
– Have suffered loss in market share from Banks in the past
– RRBs the most aggressive players in this segment
– Banks report durable and auto loans under ‘Durables’ and ‘Rest of Personal’ categories
– Not possible to disentangle market size cleanly
Calculating Market Size
– Use 2001 as base year as data are provisional or estimates for later years
– First estimate total possible market for credit-life
– But some of this is inaccessible
– Then estimate all ‘accessible’ market size Problem in estimating market size
– Non availability of categorization of purpose from many sources
– Non uniformity in categorization of purpose from many sources
– Only broad numbers available for some (eg. RRBs)
– Inter FI lending: Possibility of double counting
– Focus more on identification of accessible markets
– Estimations at a single point in time as well as relevant break-ups of sub-components have been conducted taking into consideration the above factors
32
Total Market Size: Personal Loans
Rs Mill., 2001
All Personal Loans (Rs.
'000,000) Housing Durables
Auto & Other
Personal
Bank
SBI Associates
Nationalized
Indian Pvt
Foreign
RRBs
Non Bank
HFCs
NBFCs
Corporates
Total
Total Market Size: Commercial Loans
Rs Mill., 2001
Priority Sr. Direct
Agriculture Loans
Priority Sr. Small-scale
industries
Priority Sr. Road & Water Transport
Priority Sr.-Retail Trade
Priority Sr.-Small Business
Priority Sr.-Professional
& Self Empl.
Priority Sr.-Food Processing not incl. SSI
Priority Sr. -
Export Credit (Foreign Banks)
Bank Total
SBI Ass
Nationalized
Indian Pvt
Foreign
RRBs
Non Bank Total
HFCs
NBFCs
Corporates
Total
Other sources of credit: State financial corporations
– Cooperatives at different levels
– However market size cannot be estimated for this segment
– Large amount of inter-lending with these categories of institutions and also from commercial banks to these institutions
– Difficult to make an estimate
33
Credit Societies/Cooperatives: Characteristics
– Receive loans from SCBs and others under ‘Agriculture’ or ‘Priority’ head
– Highly regulated
– Most have personnel with low financial skill-base
– Many not viable in the medium-long term
– Include
– The Primary Agricultural Co-operative Societies – District Central Co-operative Banks – State Co-operative Banks – Comparative Share of Co-operative Banks vis-a-vis SCBs
State -Level Finance Corporations: Characteristics
– State financial corporations
– Institutions oriented towards disadvantaged sections
– Development institutions such as tourism development
– Highly structured operations
– Many are re-appraising role in changing economy State -Level Finance Corporations: Provide credit to
– Companies
– Proprietorships and Partnerships
– Professionals
– Artisans
– Deprived sections
– Credit predominantly for ‘productive purposes’
– Also includes that for
– Automobiles – Housing
– Other assets: Shops, restaurants, cattle etc.
– Almost all loans backed by tangible assets Other Commercial Bank Credit: Characteristics of Priority Sector
– Priority sector lending constitutes about 40 percent of all SCB lending
– Large part for agriculture, SSIs, and for export
– But significant amounts to:
– Professionals
– Artisans
– Shop owners, restaurants

34
Key Issues in the Accessing of the Non-conventional Market
– Regulations, state and central government policies and procedures
– Openness of government and public functionaries to allying with non-public sector entities
– Marketing capability at state and sub-state level
– Lobbying abilities
Accessibility: Banks
– Negligible-Low Accessibility
– Foreign Private Sector Banks
– Larger Indian Private Sector Banks
– SBI and Affiliates
– Low-Medium Accessibility
– Smaller non-SBI public sector (some do not have any current plans for insurance related product-lines)
– Poorly performing RRBs
– Medium-High Accessibility
– Better performing RRBs
– Smaller Indian Private Sector Banks Accessibility: Housing Finance Companies
– Consistent long term fall
– Shares expected to be lower in coming years due to aggressive private SCBs
– Largest fall in market share of smaller players
– Possibility of accessing larger players low
– HDFC, GICHF, LICHF, Canfin, etc. – Indicates falling long term potential for credit-life through HFCs
Accessibility: Non Banking Finance Companies (non-housing)
– Medium-High
– NBFCs associated with auto companies – Smaller NBFCs such as Nidhis, etc. – But falling size
– Outstanding in 2003 in the region of Rs 80,000 mill (hire purchase and lease) Accessibility: Corporate Employee Loans
– Medium to High
– Have not normally partnered with FIs
– Do not have required financial skill-base

35
Accessibility: Cooperatives
– Low to Medium
– Need exists
– Not ‘attached’ to competing FIs
– But highly regulated
– Not clear what permissions or procedures will be required Accessibility: SFCs
– Medium to High
– Significant part of credit not for consumption related loans
– Consider expanding scope to include credit-life to proprietorships as well
– Could cover:
– Professionals
– Proprietorships
– Artisans
– Disadvantaged sections
Accessible Market: Personal Loans
Rs Mill. 2001 Housing Durables
Auto & Other
Personal All Personal
Loans
Banks
SBI Ass
Nationalized
Indian Pvt
Foreign
RRBs
Non Bank
HFCs
NBFCs
Corporates
Total

36
Accessible Market: Relevant Commercial Loans from Priority Sector Advances
Rs Mill. 2001
Priority Sr. Direct
Agriculture Loans
Priority Sr. Small-scale
industries
Priority Sr. Road & Water Transport
Priority Sr.-Retail Trade
Priority Sr.-Small Business
Priority Sr.-Professional
& Self Empl.
Priority Sr.-Food Processing not incl. SSI
Priority Sr. -
Export Credit (Foreign Banks)
Total (Relevant Priority Sector)
Banks
SBI Ass
Nationalized
Indian Pvt
Foreign
RRBs
Non Bank
HFCs
NBFCs
Corporates
Total
Total Accessible Market: Banks, corporate, NBFCs etc.
Rs Mill. 2001
All Personal Loans (Rs. '000,000)
Total (Relevant Priority Sector) Total
Banks
SBI Ass
Nationalized
Indian Pvt
Foreign
RRBs
Non Bank
HFCs
NBFCs
Corporates
Total
Total Accessible Market Size
– Total accessible market size of about Rs 1,555 Billion as of 2001
– Market has been growing at about 20% in early 2000s but is expected to grow by about 15% annually this decade
– Conservative estimates as this does not include those by SFCs, cooperatives etc.
– Avoid possibilities of double counting

37
I. Housing Finance
1. Data Description The Housing Finance (HF) industry in India has two major segments consisting of Scheduled Commercial Banks (SCBs) and specialized Housing Finance Companies (HFCs). While there is a significant amount of data available for the SCBs, the data on HFCs is limited. Two sources of data have been used for this analysis: (1) Reserve Bank of India and (2) Annual accounts of the major HFCs. (1) The RBI data coverage is in three parts for the years ending March 31st in 2000, 2001 and 2002.
(i) An occupational classification of bank credit gives a state-wise break-up of credit going to different sectors, by different types of scheduled commercial banks. The data is further broken up for each state, but for the purposes of this analysis we use a regional classification (See Appendix II).
(ii) The Scheduled Commercial Bank’s advances under Priority Sector (2000 and 2001) gives a statewise (regional) break-up of credit given by the banks either directly or indirectly. Indirect credit is typically through HFCs where the banks lend to HFCs against an earmarked portfolio of accounts.
(iii) State and Population Group wise Classification of Outstanding Credit of Small Borrowal Accounts of Scheduled Commercial Banks According to Occupation
The RBI data has a hierarchical structure; (ii) is a subset of (i) and (iii) is a sub-set of (ii). While for all market related analysis, we rely on data from (i), we also provide an analysis of data from (ii) and (iii) to give an idea of the characteristics of the different market segments. (2) Annual financial statements of 15 HFCs for 5 years 1998 – 2002. (3) CRIS INFAC Retail Finance Annual Review: January 2003. 2 Formal Credit In The Housing Finance Sector
2.1 Market Size Of The Housing Finance Sector
The HF industry has been growing at a healthy CAGR, estimated to be in the 25-30% range. While market size can be defined in many ways – annual sanction, annual disbursement of housing loans, outstanding credit for housing purposes, we define the market as the stock of outstanding loans to the housing sector. The size is estimated as follows: (Housing Loans O/S for HFCs – Bank Borrowings by HFCs) + SCB O/S Housing Loans

38
Table 1: Select Financials Of 15 Housing Finance Companies In India, 1998-2002 (Amount in Rs. bill.)
Select Financials for HFCs (from B/S)* 1998 1999 2000 2001 2002
Networth
Borrowings
Banks
Financial Institutions
Foreign
Bonds/Debentures
Fixed Deposits
Housing Loans
YOY Growth (%) Source: Financial Statements of HFCs (Prowess, CMIE)
* A list of the HFCs whose financials are reported here is given in Appendix 1
Table 2: Estimate Of Housing Finance Market Size, 2000-2002 (Amount in Rs. bill.)
Market Size Estimate 2000 2001 2002
HFC Housing Loans O/S A
Bank borrowing by HFCs B
Net Housing Loans by HFCs (A) - (B) = C
Housing Loans O/S for SCBs D
Market Size (C) + (D)
YOY Growth in Market Size (%)
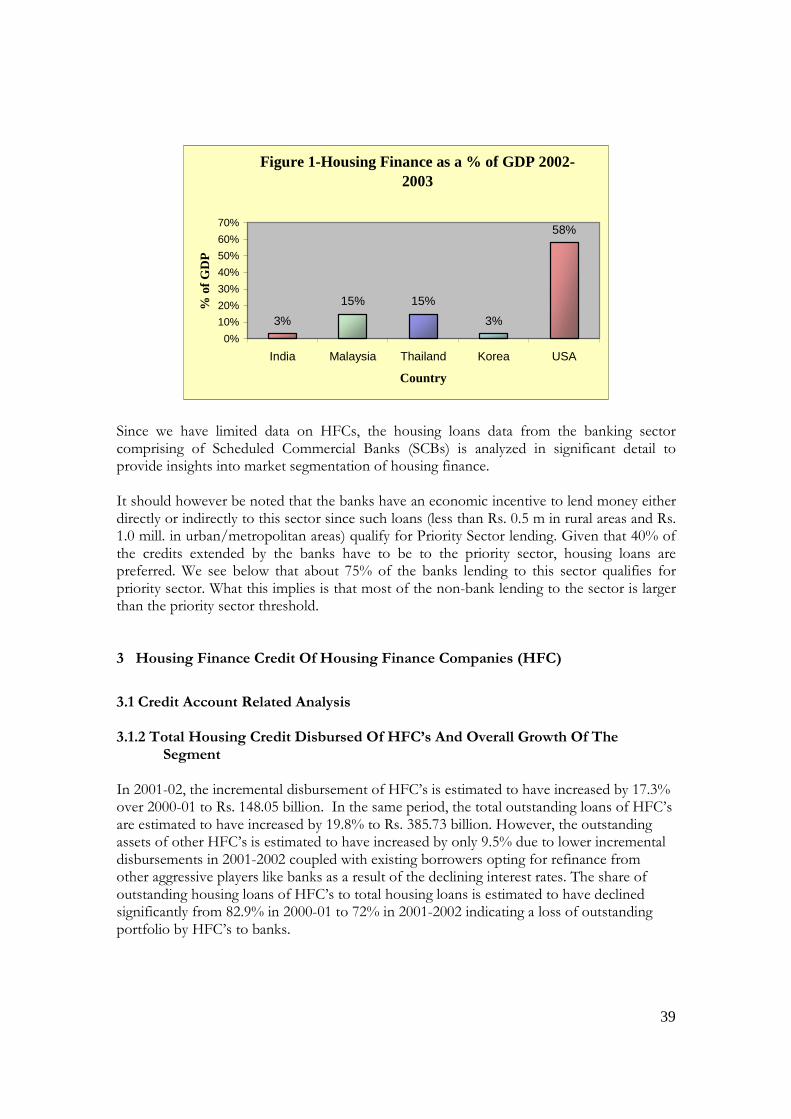
A market size of approximately Rs. 525 billion translates to about 3% of the country’s GDP, which is small in comparison to other countries (see Fig 1). It is useful to bear in mind that the housing finance market is comparatively young in India. According to CRISIL, the housing finance market enjoys a market share of 52% in the key retail finance market. In existence for over two decade, the buoyancy of the market is a recent phenomenon, in the last 3-4 years. The tax incentives for owner occupied homes under section 88 of the IT Act, combined with the reduction in the interest rates gave a fillip to the market in recent years. The size of the new mortgages sanctioned and the amounts disbursed have grown much faster than the housing loans outstanding, suggesting that a large proportion of the housing loans were refinanced due to the significant fall in the interest rates. For instance, during the financial year 2001 housing loans disbursement for HDFC was Rs. 58.03 billion while its loan outstanding rose by Rs. 31.5 billion. Also, for the financial year 2002, the corresponding figures were Rs. 76.17 billion and Rs. 39.83 billion respectively.
39
Figure 1-Housing Finance as a % of GDP 2002-2003
3%
15% 15%
3%
58%
0%
10%
20%
30%
40%
50%
60%
70%
India Malaysia Thailand Korea USA
Country
% o
f G
DP
Since we have limited data on HFCs, the housing loans data from the banking sector comprising of Scheduled Commercial Banks (SCBs) is analyzed in significant detail to provide insights into market segmentation of housing finance. It should however be noted that the banks have an economic incentive to lend money either directly or indirectly to this sector since such loans (less than Rs. 0.5 m in rural areas and Rs. 1.0 mill. in urban/metropolitan areas) qualify for Priority Sector lending. Given that 40% of the credits extended by the banks have to be to the priority sector, housing loans are preferred. We see below that about 75% of the banks lending to this sector qualifies for priority sector. What this implies is that most of the non-bank lending to the sector is larger than the priority sector threshold. 3 Housing Finance Credit Of Housing Finance Companies (HFC)
3.1 Credit Account Related Analysis 3.1.2 Total Housing Credit Disbursed Of HFC’s And Overall Growth Of The
Segment
In 2001-02, the incremental disbursement of HFC’s is estimated to have increased by 17.3% over 2000-01 to Rs. 148.05 billion. In the same period, the total outstanding loans of HFC’s are estimated to have increased by 19.8% to Rs. 385.73 billion. However, the outstanding assets of other HFC’s is estimated to have increased by only 9.5% due to lower incremental disbursements in 2001-2002 coupled with existing borrowers opting for refinance from other aggressive players like banks as a result of the declining interest rates. The share of outstanding housing loans of HFC’s to total housing loans is estimated to have declined significantly from 82.9% in 2000-01 to 72% in 2001-2002 indicating a loss of outstanding portfolio by HFC’s to banks.

40
3.1.2 Number And Average Size Of Accounts Financing from HFC’s are generally in the form of term loans. During the 1998-99 to 2001-02 period, the average size of the retail loan is estimated to have increased from Rs. 152,000 to Rs. 225,000, a CAGR of 18.9%. In 2001-02 the average loan size of HDFC was Rs. 357,500, an increase of 10.9% over the previous year 2000-01. The number of housing loans disbursed by HDFC increased by 18.3% to 213,000. The average loan size of LIC Housing Finance and Dewan Housing Finance was Rs. 313,500 and Rs. 224,400. Housing finance companies while sanctioning loans give higher credit to households having more than one earning member and sanctions loan amounts upto a maximum of 36 months of average household income. HFC’s finance loans upto a limit of 85% and in select construction projects upto 100% of the value of the house. 3.1.3 Average Tenure Most HFC’s offer housing loans for a period of 15-20 years. During the 1996-2002 periods, the tenure of loans available increased from 7-10 years to 20-30 years. However the average tenure of loan at origination ranges from 10-14 years, while the average duration of outstanding loans is 7-8 years. Interest rates for shorter tenure loans (below 5 years) are lower than longer tenure loans (15 years and above) by 75-175 basis points. 3.1.4 Average EMI During the 1995-1996 period, the EMI on housing loans is estimated to have declined by almost 50%. The EMI on a 20-year loan at 8.5% interest is Rs. 870 per and on a 7 year, loan at 18% interest is approximately Rs. 1590). 3.2 Analysis Of The Competitive Scenario Of The HFC Segment 3.2.1 Major Players In The HFC Segment There are approximately 350 HFC’s in India of which only 31 are approved and registered with the NHB for refinancing. The major players are:
• Housing Development Finance Corporation
• Life Insurance Company Housing Finance
• General Insurance Company Housing Finance
• Dewan Housing Finance Corporation Ltd.
• Canfin Homes Ltd.
3.2.2 Current Performance Of The HFC Players In 2001-02, the disbursements of HFC’s like HDFC, LIC Housing Finance and Canfin Homes increased by 31.3%, 25.5% and 28% respectively over 2000-01.

41
3.2.3 Credit Ratings Of The HFC’s Credit ratings of the major HFC’s are listed below. See Appendix IV for a detailed list of credit ratings for all HFC’s.
• Housing Development Finance Corporation-AAA (CRISIL)
• Life Insurance Company Housing Finance-AAA (CRISIL)
• General Insurance Company Housing Finance-AA (CARE)
• Dewan Housing Finance Corporation Ltd.-AA (CARE, Fitch)
• Canfin Homes Ltd.-A+ (CRISIL) 3.2.4 Non Performing Assets (NPA) of HFC The average gross NPA of the industry is estimated at 2-2.5% of the outstanding portfolio. However, it varies between 1-5%. In 2001-02, gross NPA of HDFC was .91% of the portfolio. The industry credit loss is determined at 20-40 basis points 3.2.5 Market Share Of The HFC’s Table 3: Incremental Disbursements Of The HFC’s In The Housing Finance Sector (Rs. bill.)
Particulars 1998-99 1999-00 2000-01 2001-02
HDFC LICHF
GICHF Dewan HF Canfin Homes
Other HFCs All HFCs
Source: CRIS INFAC Retail Finance Annual Review: January 2003
Table 4: Outstanding Loans Of HFC’s In The Housing Finance Sector
(Rs. bill.) Particulars 1998-99 1999-00 2000-01 2001-02
HDFC
LICHF
GICHF Dewan HF Canfin Homes
Other HFCs All HFCs Source: CRIS INFAC Retail Finance Annual Review: January 2003
In 2001-02, the aggregate market share of all HFC’s in aggregate retail disbursements declined by 9.1% to 59.2%. Most of the HFC’s have lost their market share to the banks. However, the largest loosing segment has been the small and medium sized HFC’s with a loss of 7.2% in market share. The market share of small and medium HFC’s declined from

42
25% in 2000-01 to 17.8% in 2001-02. Market share of HDFC declined from 31.4% in 2000-01 to 30.5% in 2001-02. 4. Commercial Banks In Housing Finance 4.1 Market Size And Growth Of Housing Finance From Banks, 2000-2002
Table 5: Total Outstanding Of Housing Loan By Scheduled Commercial Banks
Particulars 2000 2001 2002 Total Outstanding (Rs. bill.) Total Accounts Amount Per Account (Rs. mill.) Growth in O/s (Rs. bill.) Growth Rate in Total O/s (%)
Source: Reserve Bank of India data on State and Bank Group-wise Classification of Outstanding Credit of Scheduled Commercial Banks According to Occupation
4.2 Outstanding Housing Credit By Type Of Scheduled Commercial Banks Table 6: Outstanding Housing Credit And Market Share By Type Of SCBs - 2000-
2002
(Rs. mill. / (%)
Outstanding Loans/Market Share 2000 2001 2002
SBI & Associates
Nationalized banks
Other SCB
Foreign Banks
RRB
All SCB
Source: Reserve Bank of India data on State and Bank Group-wise Classification of outstanding Credit of Scheduled Commercial Banks According
• Table 6 shows that the nationalized banks along with State Bank of India and Associates (SBI) dominate 80% of the market for housing finance in India. Between 2000 and 2001, SBI has gained market share at the expense of the Nationalized banks

43
Figure 2-Bank Groupwise Housing Loan Outstanding Per Account
00.10.20.30.40.50.60.70.8
SB
I & A
ss
Nat
iona
lised
bank
s
For
eign
Ban
ks
RR
B
Oth
er S
CB
Bank Group
Am
ou
nt
O/s
per
Acc
ou
nt
(Rs
mn
) 2000
2001
2002
Source: Reserve Bank of India data on State and Bank Group-wise Classification of outstanding Credit of
Scheduled Commercial Banks According to Occupation
• The quantum of housing loan disbursed per account, is the highest for foreign banks as compared to other bank groups as shown in Figure 2 above although their market share has remained in the 6-8% bracket in the period 2000-2002.
Table 7: Region Wise Market Share Each Bank Type In Outstanding Housing Credit For 2002 (in %)
Region/Bank SBI & Associates
Nationalized Banks
Foreign Banks
RRB Other SCB
All Banks
Northern region North-eastern region Eastern region Central region Western region Southern region
All India Source: Reserve Bank of India data on State and Bank Group-wise Classification of outstanding Credit of Scheduled Commercial
Banks According to Occupation
Table 8: Bank Wise Market Share In Each Region For Outstanding Housing Credit, 2002 (in %)
Region/ Bank SBI & Associates
Nationalized Banks
Foreign Banks
RRB Other SCB
All Banks
Northern region North-eastern region Eastern region Central region Western region Southern region All India Source: Reserve Bank of India data on State and Bank Group-wise Classification of outstanding Credit of Scheduled Commercial Banks According to Occupation

44
Table 9: Bank-Wise Market Share In Each Population Group For Outstanding
Housing Credit-2002 (in %)
SBI & Nationalized Foreign RRB Other All SCB
Population Groups Associates Banks Banks SCB
Rural
Semi-Urban
Urban
Metropolitan
All India Source: Reserve Bank of India data on Population and Bank Group wise classification of outstanding credit of Scheduled Commercial Banks
According to Occupation
• Amongst all SCB, SBI & Associates and Nationalized Banks together have over 70% of Housing Loan market share across each of the population group sectors for the year 2002, as can be seen from Table 9.
Table 10: Population Group-Wise Market Share Of Each Bank Type In Outstanding Housing Loan Credit For 2002 (in %)
SBI & Nationalized Foreign RRB Other All SCB
Population Groups Associates Banks Banks SCB
Rural
Semi-Urban
Urban
Metropolitan
All India Source: Reserve Bank of India data on Population and Bank Group wise classification of outstanding credit of Scheduled Commercial Banks
According to Occupation
Table 11: Commercial Banks In Housing Finance – The Population Group
Perspective (Amount in Rs. mill.)
2000 2001 2002
Population group Amount O/s Amt per Acc. Amount O/s Amt per Acc. Amount O/s Amt per Acc.
Rural
Semi Urban
Urban
Metropolitan
All India Source: Reserve Bank of India data on Population and Bank Group wise classification of outstanding credit of Scheduled
Commercial Banks According to Occupation

45
• Referring to Table 11, we observe that the Urban and Metropolitan group of the population together occupied 70% of the Housing Loan Market for the year 2002. We also see that each of the population group has more than doubled its loan per housing account in 2002 on comparison with data from 2000. What could possibly have helped such a steep rise?
5. Formal Credit in Housing Finance Sector By Location
5.1 Region-Wise Housing Loans Outstanding Between 2000-2002
• Referring to Table 12, we observe that the western and southern region enjoyed a market share of 59%-61% during 2002.
Table 12: Region-Wise Housing Loans Outstanding And Amount Outstanding Per
Housing Loan By All SCB
(Rs. mill.)
Particulars 2000 2001 2002
Regions Of India No. Of Accounts
Amount O/s
Amt. per Acc.
No. Of Accounts
Amount O/s
Amt per Acc.
No. of Accounts
Amount O/s
Amt per Acc.
Northern region
North eastern region
Eastern region
Central region
Western Region
Southern region
All India
Source: Reserve Bank of India data on State and Bank Group-wise Classification of outstanding Credit of Scheduled Commercial Banks According to Occupation
• Amount disbursed per loan has increased significantly between 2000 and 2002 in almost all the regions as can be seen from Table 12. The western region has grown the maximum in 2002 to an amount of Rs0.23m per account as shown in Table 12. This is probably due to the high property prices in Bombay.
• The loans per account is the highest in the western and southern regions which matches the previous observation of the two regions dominating almost 60% of market share in the period 2000-2002. Although the market share of the southern region is higher, the loans per account are lower than that of the western region. This highlights the existence of high property prices in Bombay, which is likely to dominate the regions’ demand for housing loans.

46
5.3 ‘Big Players’ State Wise Analysis
Table 13: Cumulative Market Share Of Housing Credit Of 10 Top States In % States
Cumulative Share, O/s States’ Market Share
Maharashtra Tamil Nadu Karnataka Andhra Pradesh Kerala Uttar Pradesh West Bengal Delhi Rajasthan Gujarat All India
Source: Reserve Bank of India data on State and Bank Group-wise Classification of outstanding Credit of Scheduled Commercial Banks According to Occupation
6. Priority Sector Lending Of Housing Credit Table 14: All India Housing Loan Advances Under Priority Sector 2000 And 2001
(Amount in Rs. mill.)
2000
Direct Finance Indirect Finance Total
No. of Accounts Amount O/s No. of Accounts
Amount O/s No. of Accounts
Amount O/s
2001
Direct Finance Indirect Finance Total
No. of Accounts Amount O/s No. of Accounts
Amount O/s No. of Accounts
Amount O/s
Source: Reserve Bank of India “ Scheduled Commercial Bank’s Advances under Priority Sector”
• The housing loan advances under priority sector, which stood at Rs. 123.59 bill. in the year 2000, rose by 68.71% for the following year. The growth can be accredited firstly to the direct housing finance segment which rose from Rs. 55.26 bill. in 2000 by a high 89.25% in 2001 and secondly to the indirect housing finance segment, which saw it’s outstanding reach Rs.103.93 bill. in year 2001- a growth of 52.10% over it’s previous year account.
• The percentage contribution to the overall outstanding by the direct housing finance under priority sector jumped from 44.71% in 2000 to 50.15% in 2001.
*Refer to Appendix III for definition of Priority Sector Lending
47
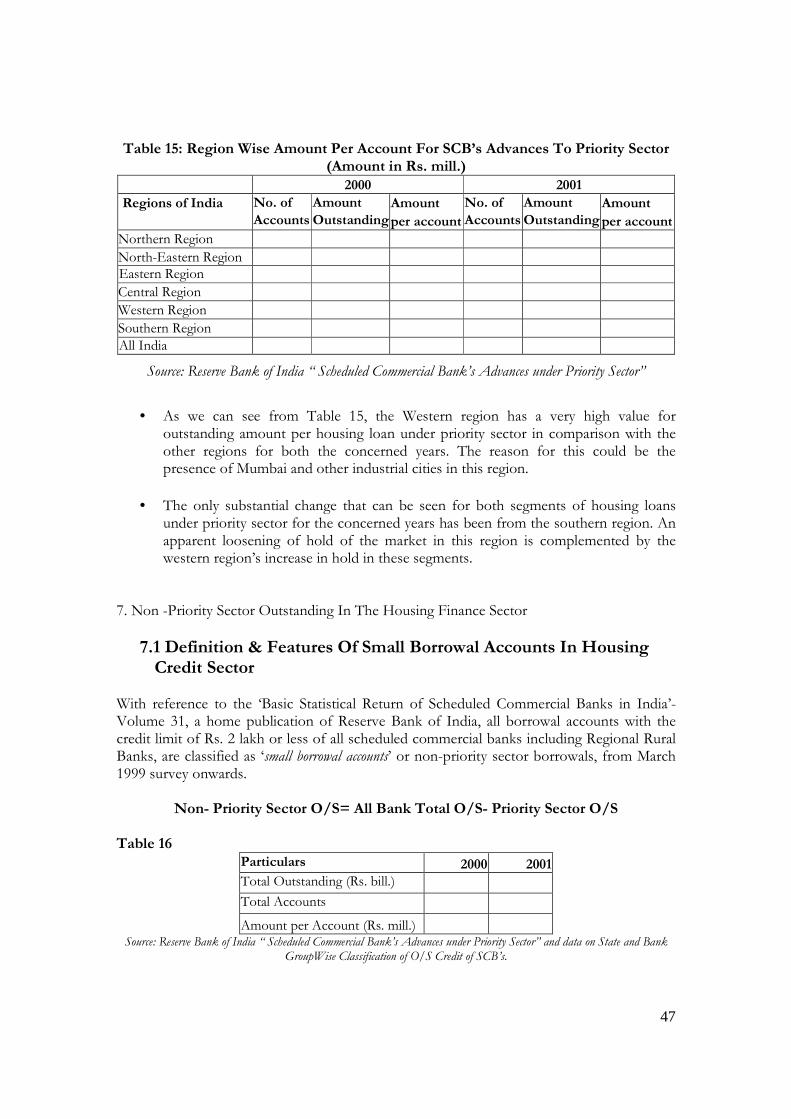
Table 15: Region Wise Amount Per Account For SCB’s Advances To Priority Sector (Amount in Rs. mill.)
2000 2001
Regions of India No. of Amount Amount No. of Amount Amount
Accounts Outstanding per account Accounts Outstanding per account
Northern Region
North-Eastern Region Eastern Region
Central Region
Western Region
Southern Region All India
Source: Reserve Bank of India “ Scheduled Commercial Bank’s Advances under Priority Sector”
• As we can see from Table 15, the Western region has a very high value for outstanding amount per housing loan under priority sector in comparison with the other regions for both the concerned years. The reason for this could be the presence of Mumbai and other industrial cities in this region.
• The only substantial change that can be seen for both segments of housing loans under priority sector for the concerned years has been from the southern region. An apparent loosening of hold of the market in this region is complemented by the western region’s increase in hold in these segments.
7. Non -Priority Sector Outstanding In The Housing Finance Sector
7.1 Definition & Features Of Small Borrowal Accounts In Housing Credit Sector
With reference to the ‘Basic Statistical Return of Scheduled Commercial Banks in India’- Volume 31, a home publication of Reserve Bank of India, all borrowal accounts with the credit limit of Rs. 2 lakh or less of all scheduled commercial banks including Regional Rural Banks, are classified as ‘small borrowal accounts’ or non-priority sector borrowals, from March 1999 survey onwards.
Non- Priority Sector O/S= All Bank Total O/S- Priority Sector O/S Table 16
Particulars 2000 2001
Total Outstanding (Rs. bill.) Total Accounts
Amount per Account (Rs. mill.) Source: Reserve Bank of India “ Scheduled Commercial Bank’s Advances under Priority Sector” and data on State and Bank
GroupWise Classification of O/S Credit of SCB’s.

48
II. Personal Loans 1. Data Description The personal loan (PL) segment of bank lending consists of loans given to individuals for unspecified purposes. This segment includes both “unsecured “ credit as well as credit “secured” against a variety of collateral- property, shares, other financial securities, etc. It is difficult to ascertain the purposes of these loans, but it is a growing segment of the consumer finance market. The only source of data used for this analysis is from the database of the Reserve Bank of India. The RBI data coverage is in three parts for the years ending March 31st in 2000, 2001 and 2002.
(i) An occupational classification of bank credit gives a state-wise break-up of credit going to different sectors, by different types of scheduled commercial banks. The data is further broken up for each state, but for the purposes of this analysis we use a regional classification.
(ii) Population group wise and Bank group wise classification of outstanding credit
of Scheduled Commercial Banks According to Occupation.
2. Commercial Banks In Personal Loan Segment 2.1 Market Size And Growth Of PL Credit From Banks, 2000-2002
Table 17: Total Outstanding In PL By Scheduled Commercial Banks
Particulars 2000 2001 2002
Total Outstanding (Rs. bill.)
Total Accounts
Amount per Account (Rs. mill.)
Growth in O/s (Rs. bill.)
Growth Rate in Total O/s (%) Source: Reserve Bank of India data on State and Bank Group Wise Classification of Outstanding Credit of Scheduled
Commercial Banks According to Occupation
• The PL sector has grown marginally by 1.465 between 2001-02 with corresponding growth in outstanding worth Rs. 20 billion approximately.

49
2.2 Outstanding PL Credit By Types Of Scheduled Commercial Banks, 2000-2002
Table 18: Outstanding Credit In PL Segment By Types Of SCB’s (2000-2002)
(Rs. mill.)
Outstanding Loans 2000 2001 2002
SBI &Associates
Nationalized Banks
Foreign Banks
RRB
Other SCB
All SCB Source: Reserve Bank of India data on State and Bank Group Wise Classification of Outstanding Credit of Scheduled
Commercial Banks According to Occupation
• Table 18 shows that for the period 2000-2002, there has been no significant shift in the market share of the different types of banks. About 65-70% of the personal loan market was dominated by SBI & Associates and nationalized banks.
Table 19: Region Wise Market Share Of Each Bank Type In Outstanding Credit For
Personal Loan 2002
(in %)
Region/Bank SBI &
Associates Nationalized
Banks Foreign Banks RRB
Other SCB
All Banks
Northern Region
North-Eastern Region
Eastern Region
Central Region
Western Region
Southern Region
All India
Source: Reserve Bank of India data on State and Bank Group Wise Classification of Outstanding Credit of Scheduled Commercial Banks According to Occupation
• The southern region accounts for the largest share of the personal loan market- accounting for close to 40% of all India borrowing.

50
Table 19: Bank Wise Market Share In Each Region For Outstanding Credit In PL For 2002
Region/Bank SBI &
Associates Nationalized
Banks Foreign Banks RRB
Other SCB All Banks
Northern Region
North-Eastern Region
Eastern Region
Central Region
Western Region
Southern Region
All India
Source: Reserve Bank of India data on State and Bank Group Wise Classification of Outstanding Credit of Scheduled Commercial Banks According to Occupation
Table 20: Bank-Wise Market Share In Each Population Group For Outstanding Credit In PL Credit For 2002
(in %)
Population SBI & Nationalized Foreign RRB Other All SCB
Groups Associates Banks Banks SCB
Rural
Semi-Urban
Urban
Metropolitan
All India
Source: Reserve Bank of India data on Population and Bank Group wise classification of outstanding credit of Scheduled Commercial Banks According to Occupation
• The public sector banks- SBI & Associates and the nationalized banks dominate the personal loan credit to all segments of the population groups. The only deviation is the role of the foreign banks in the metropolitan population group- with a 44% market share.
Table 21: Population Group-Wise Market Share Of Each Bank Type In Outstanding
In The PL Segment For 2002
(in %)
Population SBI & Nationalized Foreign RRB Other All SCB
Groups Associates Banks Banks SCB
Rural
Semi-Urban
Urban
Metropolitan
All India
Source: Reserve Bank of India data on Population and Bank Group wise classification of outstanding credit of Scheduled Commercial Banks According to Occupation

51
• Outstanding of SBI & Associates and Nationalized Banks are concentrated in the urban, semi-urban and metropolitan sectors. However, Foreign banks prefer lending to metropolitan segment whereas the Regional rural banks favour the rural sector.
3 Commercial Banks in Personal Loans – The Population Group Perspective 3.1 Analysis Of Population Group Wise Loans Outstanding Between 2000 – 2002 In Personal
Loan Segment
Table 22: Population Group-Wise Loans Outstanding By All SCB In The PL
Segment (Rs. in mill.)
Population Groups 2000 2001 2002
Rural
Semi-Urban
Urban
Metropolitan
All India
Source: Reserve Bank of India data on Population and Bank Group wise classification of outstanding credit of Scheduled Commercial Banks According to Occupation
• Each of the population group has shown heavy growth in terms of outstanding, which effectively has resulted in the PL market to grow from Rs. 303.24 bill. (2000) by approximately 50% to Rs. 458.39 bill. (2002), as seen in table 22.
Figure 3- Population Group Outstanding For Personal Loans in 2002
16%
20%
24%
40% Rural
Semi-Urban
Urban
Metropolitan
Source: Reserve Bank of India data on Population and Bank Group wise classification of outstanding credit
of Scheduled Commercial Banks According to Occupation
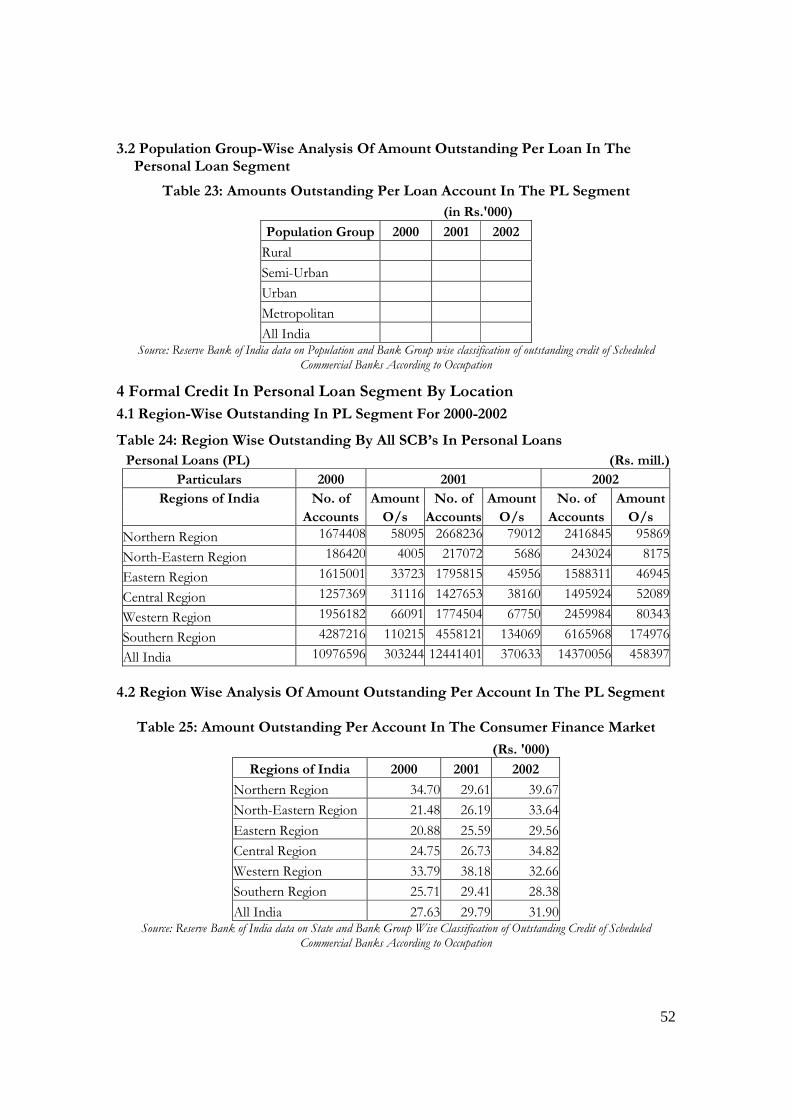
52
3.2 Population Group-Wise Analysis Of Amount Outstanding Per Loan In The Personal Loan Segment
Table 23: Amounts Outstanding Per Loan Account In The PL Segment
(in Rs.'000)
Population Group 2000 2001 2002
Rural
Semi-Urban
Urban
Metropolitan
All India Source: Reserve Bank of India data on Population and Bank Group wise classification of outstanding credit of Scheduled
Commercial Banks According to Occupation
4 Formal Credit In Personal Loan Segment By Location
4.1 Region-Wise Outstanding In PL Segment For 2000-2002
Table 24: Region Wise Outstanding By All SCB’s In Personal Loans
Personal Loans (PL) (Rs. mill.)
Particulars 2000 2001 2002
Regions of India No. of Amount No. of Amount No. of Amount
Accounts O/s Accounts O/s Accounts O/s
Northern Region 1674408 58095 2668236 79012 2416845 95869
North-Eastern Region 186420 4005 217072 5686 243024 8175
Eastern Region 1615001 33723 1795815 45956 1588311 46945
Central Region 1257369 31116 1427653 38160 1495924 52089
Western Region 1956182 66091 1774504 67750 2459984 80343
Southern Region 4287216 110215 4558121 134069 6165968 174976
All India 10976596 303244 12441401 370633 14370056 458397
4.2 Region Wise Analysis Of Amount Outstanding Per Account In The PL Segment
Table 25: Amount Outstanding Per Account In The Consumer Finance Market
(Rs. '000)
Regions of India 2000 2001 2002
Northern Region 34.70 29.61 39.67
North-Eastern Region 21.48 26.19 33.64
Eastern Region 20.88 25.59 29.56
Central Region 24.75 26.73 34.82
Western Region 33.79 38.18 32.66
Southern Region 25.71 29.41 28.38
All India 27.63 29.79 31.90 Source: Reserve Bank of India data on State and Bank Group Wise Classification of Outstanding Credit of Scheduled
Commercial Banks According to Occupation

53
• As seen in Table 25 above, the amount per loan has been almost constant across all regions for all concerned years under study, barring a few exceptions.
III. Education Loans 1. Data Description The Education Loan (EL) industry in India comprises of the Scheduled Commercial Banks (SCB’s) consisting of both Public and Private Sector Banks (See Appendix V). The Public Sector Banks (PSB’s) however, dominate loans disbursed in the education sector. While there is some data available for the SCB’s from 1998-2001, the data on other smaller private players is non-existent as they are new entrants. The source of data used for the analysis of this segment is taken from the database of The Reserve Bank of India. The RBI data coverage is further divided into two categories:
(1) Distribution of Advances of Public Sector Banks to Other Priority Sectors for the years 1998-2001 under the State Bank Group and the Nationalized Banks.
(2) The Scheduled Commercial Bank’s Advances under priority Sector (2000 and 2001)
gives a state-wise regional break-up of credit given by the banks.
2. Formal Credit To Education Loan Sector
2.1 Market Size Of Educational Sector The EL industry has been growing at an accelerated rate, estimated to be in the range of 60-70% since 2001 which indicates a “high potential” growing market with few organized players such as the PSB’s determining market forces. Competition from the private banks is very low which could explain interest rates being charged in the range of 11.75%-14%. Here we define market size as the stock of outstanding loans to the education sector. According to UNESCO (1994). % of Education Loans to GDP is only .56% in India as compared to 1.16% in the U.S.A., 1.98% in Canada, 2.53% in New Zealand and 1.5% in Australia. However, it is important to bear in mind that the EL sector is very new in India and has come into being in the last decade. The spurt in growth rate can also be attributed to a greater percentage of Indians opting for higher education, tax incentives announced under Sec 80E of the IT Act combined with the rising professional fee and paucity of funds available for higher education.

54
3. Commercial Banks In Education Loan Sector
3.1 Market Size And Growth Of Education Loans From Banks, 2000-2001
Table 26 –Total Outstanding Of Education Loans By Scheduled Commercial Banks
Particulars 2000 2001
Total Outstanding (Rs. bill.) 6.67 10.84Total Accounts 83146 116069Amount per Account (Rs. mill.) 0.08 0.09
Growth in O/s (Rs. bill.) 0 4.18Growth Rate in Total O/s (%) 0 62.67
Source: Reserve Bank of India’s data on Scheduled Commercial Banks’ Advances Under Priority Sector
• Such high rates are unlikely to continue-starting from a small base. On the other hand, the demand for such loan is growing as higher education gets privatized in the economy.
4 Education Loans Disbursed by Public Sector Banks
4.1 PSB Group Wise Analysis Of Education Loans Outstanding Between 1998-2001
Table 27– Outstanding Education Loans and Market Share of The Major PSB
Groups
(Rs. mill.) 1999 2000 2001
No. of Amount Amt/ No. of Amount Amt/ No. of Amount Amt/ Bank Groups
Acc. O/s Acc. Acc. O/s Acc. Acc. O/s Acc.
State Bank Group (A)
79,182 57.84%
1,273 28.30%
0.02 18,675 23.38%
1,410 25.97%
0.08 45,446 40.33%
3,690 35.89%
0.08
Nationalized Banks (B)
57,724 42.16%
3,225 71.70%
0.06 61,187 76.62%
4,020 74.03%
0.07 67,249 59.67%
6,590 64.11%
0.10
Public Sector Banks (A+B)
136,906 100%
4,498 100%
0.03 79,862 100%
5,430 100%
0.07 11,2695 100%
10,280 100%
0.09
Source: Reserve Bank of India’s data on Distribution of Advances of Public Sector Banks to ‘other priority sectors’ for the
years 1998-2001
• Amount per account is increasing for both the State Bank Group as well as for the Nationalized Banks. The average loan size is upwards of Rs. 90,000.
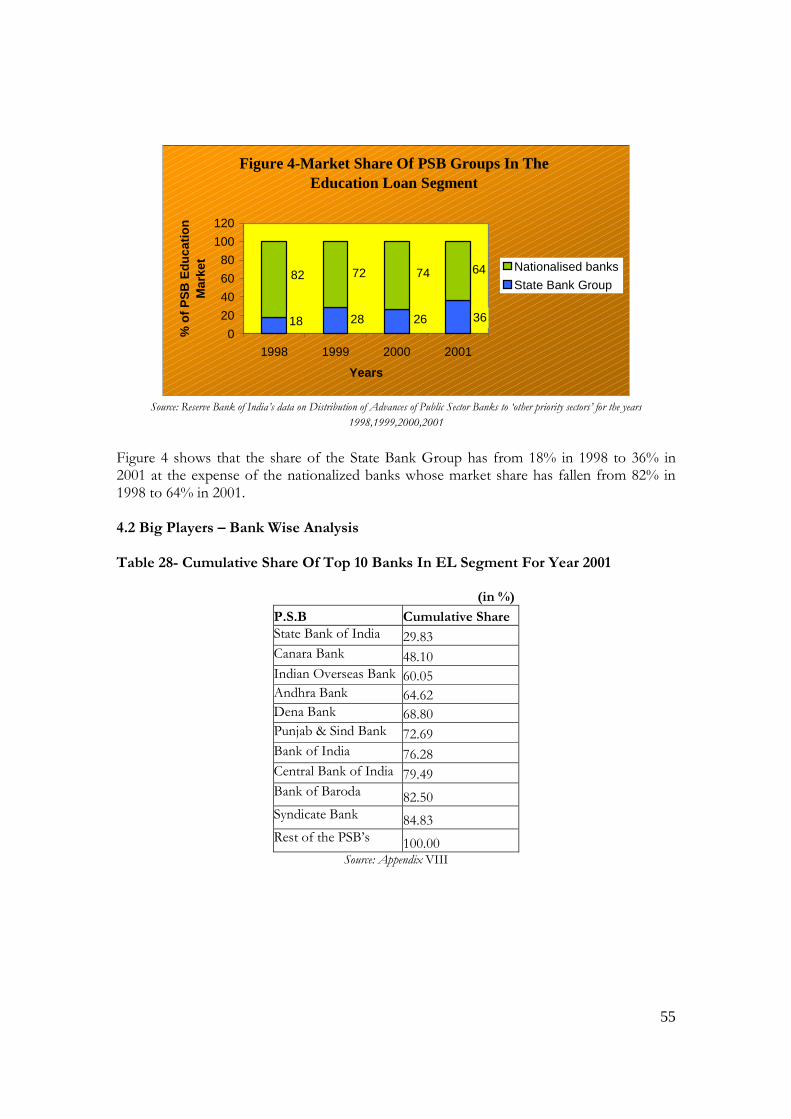
55
Figure 4-Market Share Of PSB Groups In The Education Loan Segment
18 28 26 36
82 72 74 64
0
20
40
60
80
100
120
1998 1999 2000 2001
Years
% o
f P
SB
Ed
uca
tio
n
Mar
ket
Nationalised banks
State Bank Group
Source: Reserve Bank of India’s data on Distribution of Advances of Public Sector Banks to ‘other priority sectors’ for the years
1998,1999,2000,2001
Figure 4 shows that the share of the State Bank Group has from 18% in 1998 to 36% in 2001 at the expense of the nationalized banks whose market share has fallen from 82% in 1998 to 64% in 2001. 4.2 Big Players – Bank Wise Analysis Table 28- Cumulative Share Of Top 10 Banks In EL Segment For Year 2001 (in %)
P.S.B Cumulative Share State Bank of India 29.83 Canara Bank 48.10 Indian Overseas Bank 60.05 Andhra Bank 64.62 Dena Bank 68.80 Punjab & Sind Bank 72.69 Bank of India 76.28 Central Bank of India 79.49 Bank of Baroda 82.50 Syndicate Bank 84.83 Rest of the PSB’s 100.00
Source: Appendix VIII

56
Figure 5 - Cumulative (%) O/s of Top 10 PSBs
29.83
18.27
11.954.57
4.1816.03
15.17
0%
10%
20%
30%
40%
50%
60%
70%
80%
90%
100%
PSBs
Cum
ulat
ive
O/s
(%
)
Rest of the Banks
Next 5
Dena Bank
Andhra Bank
Indian Overseas Bank
Canara Bank
State Bank of India
Source: Reserve Bank of India’s data on Distribution of Advances of Public Sector Banks to ‘other priority sectors’ for the years 1998-2001
Figure 5 indicates that 60.05% of the market share in the EL sector is dominated by three main players- State Bank of India, Canara Bank and Indian Overseas Bank. The State Bank Group alone accounts for almost 30% of the market share. 5. Region Wise Education Loan Outstanding 2000 - 2001
5.1 Region-wise analysis of EL Outstanding by SCB’s between 2000-2001
Table 29- Regional Education Loans Outstanding And Market Share By SCB’s Between 2000-2001
Particulars 2000 (Rs mill.) 2001(Rs mill.) Regions of India
No. of Acc.
Amount O/S
Amt per Acc.
No. of Acc.
Amount O/S
Amt per Acc.
North region 3,762 520 0.14 11,443 1,540 0.13
4.52% 7.80% 9.86% 14.21%
North-Eastern Region
150 10 0.07 750 20 0.03
0.18% 0.15% 0.65% 0.65%
Eastern Region 3,069 200 0.07 4,337 440 0.1
3.69% 3% 3.74% 4.06%
Central Region 3,796 450 0.12 17,270 630 0.04
4.57% 6.75% 14.88% 5.81%
Western Region 14,600 1850 0.13 16,704 11,580 0.09
17.56% 27.74% 14.39% 14.58%
Southern Region
57,769 3,640 0.06 65,565 6,630 0.1
69.48% 54.57% 56.49% 61.16%
All India 83,146 6,670 0.08 116,069 10,840 0.09
100% 100% 100% 100% Source: Reserve Bank of India’s data on Scheduled Commercial Banks’ Advances Under Priority Sector

57
It is to be noted here that the north eastern region comprises of data from Assam only, since sufficient data was not available for Manipur, Meghalaya, Nagaland, Tripura, Arunachal Pradesh, Mizoram and Sikkim for the years 2000 and 2001 (See Appendix VI)
• More than half of the EL is in the southern region, followed by the western region and together this accounts for over 78% of the total loans outstanding.
• There is an increase in market share of the southern region from 55% in 2000 to 61% in 2001 reinstating the emphasis on higher education prevalent in the southern parts of India (See Table 29). The northern region is emerging as a high potential region as growth in market share has doubled from 7.80% in 2000 to 14.21% in 2001.
5.2 Big Players’ State Wise Analysis Table 30 – Cumulative Share Of Top 10 States In Education Loan Market In % For
The Year 2001
(In %)
States Cumulative O/s Andhra Pradesh 24.75
Tamil Nadu 40.35Karnataka 52.17Delhi 62.61Maharashtra 72.95
Kerala 81.72Gujarat 85.78Uttar Pradesh 88.74Madhya Pradesh 91.32West Bengal 93.54Rest of the states 100.00
Source: Appendix-VII

58
Figure 6- Cumulative Market Share (%) of Top Ten States
24.75%
15.60%
11.82%
10.43%10.34%
20.59%
6.46%
0%
20%
40%
60%
80%
100%
States
% o
f N
atio
nal
O
uts
tan
din
gs
Rest of the states
NEXT 5
Maharashtra
Delhi
Karnataka
Tamil Nadu
Andhra Pradesh
Source: Reserve Bank of India’s data on Scheduled Commercial Banks’ Advances Under Priority Sector
Table 30 shows that the Andhra Pradesh, Tamil Nadu, Karnataka and Delhi dominate 62% of the market for education loans which confirms the finding that the southern states are the dominant players whilst the northern states represent the growing zone for such loans. These statistics could also indicate that the southern states have a better quality of human capital as compared to the North since they are willing to invest more in higher education.
IV. Consumer Durables Finance 1. Data Description The Consumer Durables segment of the consumer finance industry in India consists of loans for purchase of consumer durables (CD). Products financed through this segment include electronic goods such as colour televisions, black and white televisions, personal computers and music systems; white goods such as washing machines, refrigerators and air conditioners (window and mini split); and brown goods such as microwave ovens, toasters, grillers and others. The scheduled commercial banks are the dominant providers of loans in this segment. Significant data on private loan providers is not available (See Appendix IX). Two sources of data are used for this analysis: (1) Reserve Bank of India and (2) CRISIL INFAC Retail Finance Annual Review: January 2003. (1) The RBI data coverage is in three parts for the years ending March 31st in 2000, 2001 and 2002.
(iii) An occupational classification of bank credit gives a state-wise break-up of credit going to different sectors, by different types of scheduled commercial banks. The data is further broken up for each state, but for the purposes of this analysis we use a regional classification.

59
(iv) Population group wise and Bank group wise classification of outstanding credit
of Scheduled Commercial Banks According to Occupation. (2) CRIS INFAC Retail Finance Annual Review: January 2003 2. Retail Finance And Market Shares OF Key Segments
Figure 7:Retail Finance: Relative Share of Key Segments (2001-02)
7%
52%11%
30% Consumer Durables
Housing
Two Wheelers
Car
Source: CRIS INFAC Retail Finance Annual Review: January 2003
According to the CRIS INFAC review on retail finance (2003, Jan), retail finance is likely to form around 30-40% of the total portfolio of key large banks such as SBI, ICICI Bank and HDFC Bank from the current level of around 10-15 %. In the consumer durables loan segment, growth is expected to be higher in the low finance penetration product like the personal computers. Figure 7 shows that consumer durable loans constituted 7% of the retail finance market in 2001-02 as compared to 52% in housing finance and 30% in car finance.
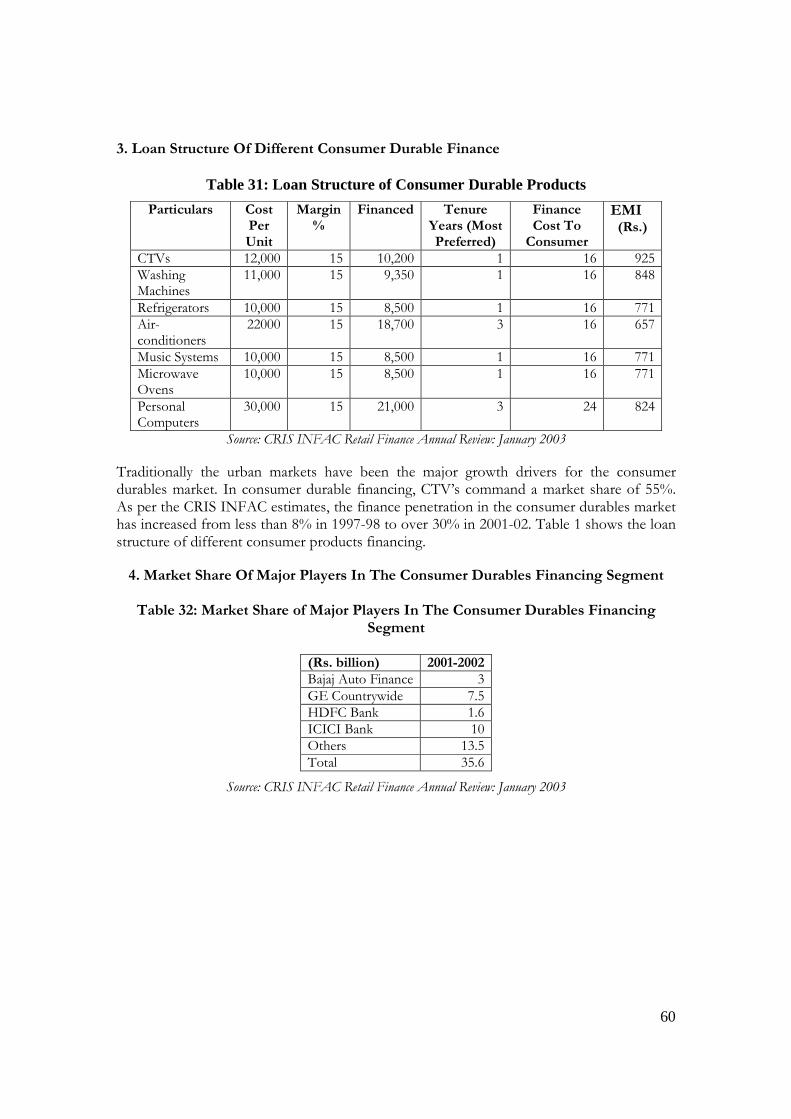
60
3. Loan Structure Of Different Consumer Durable Finance
Table 31: Loan Structure of Consumer Durable Products
Source: CRIS INFAC Retail Finance Annual Review: January 2003
Traditionally the urban markets have been the major growth drivers for the consumer durables market. In consumer durable financing, CTV’s command a market share of 55%. As per the CRIS INFAC estimates, the finance penetration in the consumer durables market has increased from less than 8% in 1997-98 to over 30% in 2001-02. Table 1 shows the loan structure of different consumer products financing.
4. Market Share Of Major Players In The Consumer Durables Financing Segment
Table 32: Market Share of Major Players In The Consumer Durables Financing Segment
(Rs. billion) 2001-2002 Bajaj Auto Finance 3 GE Countrywide 7.5 HDFC Bank 1.6 ICICI Bank 10 Others 13.5 Total 35.6
Source: CRIS INFAC Retail Finance Annual Review: January 2003
Particulars Cost Per Unit
Margin %
Financed Tenure Years (Most Preferred)
Finance Cost To Consumer
EMI (Rs.)
CTVs 12,000 15 10,200 1 16 925 Washing Machines
11,000 15 9,350 1 16 848
Refrigerators 10,000 15 8,500 1 16 771 Air-conditioners
22000 15 18,700 3 16 657
Music Systems 10,000 15 8,500 1 16 771 Microwave Ovens
10,000 15 8,500 1 16 771
Personal Computers
30,000 15 21,000 3 24 824
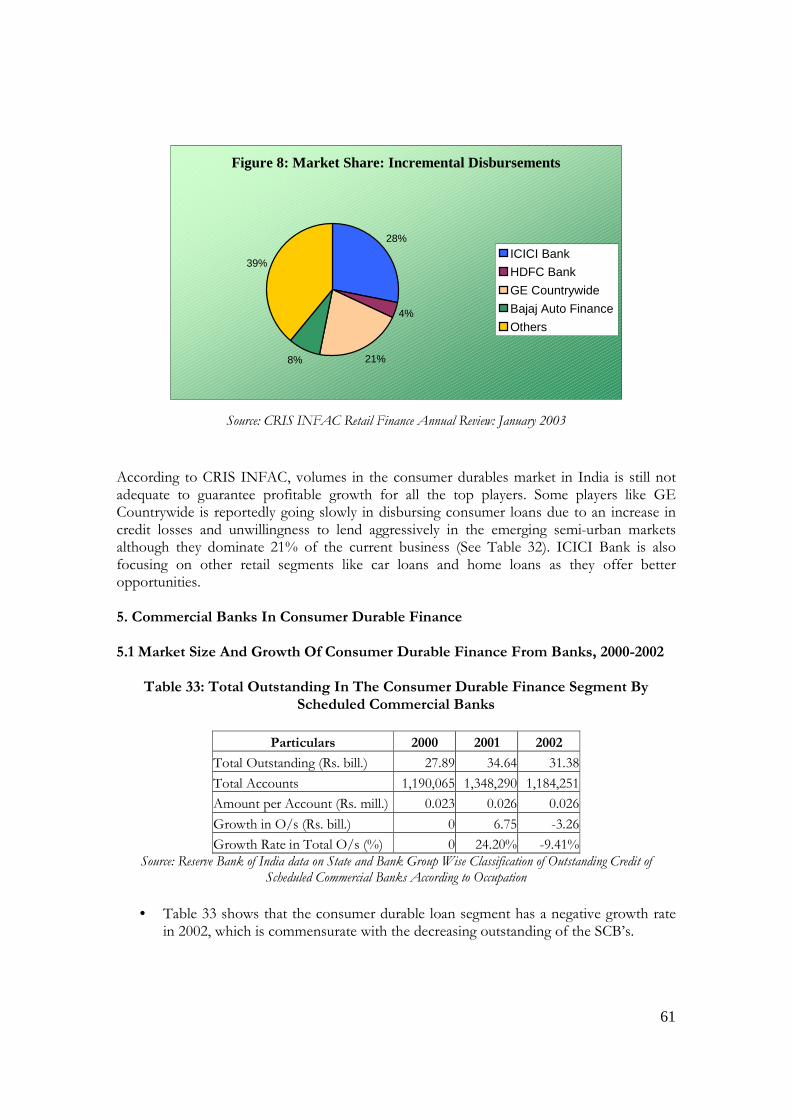
61
Figure 8: Market Share: Incremental Disbursements
28%
4%
21%8%
39%ICICI Bank
HDFC Bank
GE Countrywide
Bajaj Auto Finance
Others
Source: CRIS INFAC Retail Finance Annual Review: January 2003
According to CRIS INFAC, volumes in the consumer durables market in India is still not adequate to guarantee profitable growth for all the top players. Some players like GE Countrywide is reportedly going slowly in disbursing consumer loans due to an increase in credit losses and unwillingness to lend aggressively in the emerging semi-urban markets although they dominate 21% of the current business (See Table 32). ICICI Bank is also focusing on other retail segments like car loans and home loans as they offer better opportunities. 5. Commercial Banks In Consumer Durable Finance 5.1 Market Size And Growth Of Consumer Durable Finance From Banks, 2000-2002
Table 33: Total Outstanding In The Consumer Durable Finance Segment By Scheduled Commercial Banks
Particulars 2000 2001 2002
Total Outstanding (Rs. bill.) 27.89 34.64 31.38
Total Accounts 1,190,065 1,348,290 1,184,251
Amount per Account (Rs. mill.) 0.023 0.026 0.026
Growth in O/s (Rs. bill.) 0 6.75 -3.26
Growth Rate in Total O/s (%) 0 24.20% -9.41% Source: Reserve Bank of India data on State and Bank Group Wise Classification of Outstanding Credit of
Scheduled Commercial Banks According to Occupation
• Table 33 shows that the consumer durable loan segment has a negative growth rate in 2002, which is commensurate with the decreasing outstanding of the SCB’s.

62
5.2 Outstanding Consumer Durable Finance Credit By Types Of Scheduled
Commercial Banks, 2000-2002 Table 34: Outstanding Credit In Consumer Durable Finance Industry By Types Of
SCB’s (2000-2002)
(Rs. mill.)
Outstanding Loans 2000 2001 2002
SBI &Associates 7,797 (27.95%) 7,353 (21.23%) 7,257 (23.12%)
Nationalized Banks 12,853 (46.08%) 17,146 (49.50%) 13,182 (42.00%)
Foreign Banks 2,047 (7.34%) 2,560 (7.39%) 1,722 (5.49%)
RRB 2,728 (9.78%) 4,456 (12.86%) 6,696 (21.34%)
Other SCB 2,468 (8.85%) 3,124 (9.02%) 2,525 (8.05%)
All SCB 27,893 (100%) 34,640 (100%) 31,383 (100%) Source: Reserve Bank of India data on State and Bank Group Wise Classification of Outstanding Credit of
Scheduled Commercial Banks According to Occupation
• Table 34 shows that over the years 2000-02 the market shares of all the banks apart are falling apart from the regional rural banks whose market share has increased to 21.34% in 2002 from 12% in 2001. This could be indicative of the fact that consumerism is catching up in the semi urban areas and along with it the demand for consumer durables financing.
• SBI & Associates along with the nationalized banks dominate over 65-70% of the market.
Table 35: Region Wise Market Share Of Each Bank Type In Outstanding Credit For
Consumer Durable Finance Market For 2002
(in %)
Region/Bank SBI &
Associates Nationalized
Banks Foreign Banks RRB Other SCB
All Banks
Northern Region 20.0% 17.2% 33.4% 7.4% 34.3% 17.9%
North-Eastern Region 5.9% 3.5% 0.5% 22.6% 4.0% 5.0%
Eastern Region 8.9% 12.4% 13.8% 30.4% 1.3% 15.3%
Central Region 18.5% 17.9% 3.3% 13.7% 1.7% 15.3%
Western Region 8.7% 15.5% 22.3% 4.9% 7.9% 12.0%
Southern Region 38.1% 33.6% 26.8% 21.1% 50.8% 34.5%
All India 100% 100% 100% 100% 100% 100% Source: Reserve Bank of India data on State and Bank Group Wise Classification of Outstanding Credit of
Scheduled Commercial Banks According to Occupation

63
• The southern region commands majority of the credit in this segment followed by the northern and then central region.
• Top 6 states (Maharashtra, Tamil Nadu, Karnataka, Andhra Pradesh, Delhi, Uttar Pradesh) dominate 60% of the consumer finance outstanding.
Table 36: Bank Wise Market Share In Each Region For Outstanding Credit In Consumer Durable Finance Market For 2002
(in %)
Region/Bank SBI &
Associates Nationalized
Banks Foreign Banks RRB
Other SCB All Banks
Northern Region
North-Eastern Region
Eastern Region
Central Region
Western Region
Southern Region
All India Source: Reserve Bank of India data on State and Bank Group Wise Classification of Outstanding Credit of
Scheduled Commercial Banks According to Occupation
• Nationalized banks dominate CD lending with a market share of 41.28%. They are followed by SBI and the RRBs with almost
equal market shares at approximately 21-23%.
Table 37: Bank-Wise Market Share In Each Population Group For Outstanding
Credit in The Consumer Durable Finance Segment For 2002
(in %)
Population SBI & Nationalized Foreign RRB Other All SCB
Groups Associates Banks Banks SCB
Rural
Semi-Urban
Urban
Metropolitan
All India Source: Reserve Bank of India data on Population and Bank Group wise classification of outstanding credit of
Scheduled Commercial Banks According to Occupation
• Nationalized banks are the dominant lender to all population groups apart from the rural sector. They are followed by SBI & Associates whose majority lending is allocated in the semi urban areas.
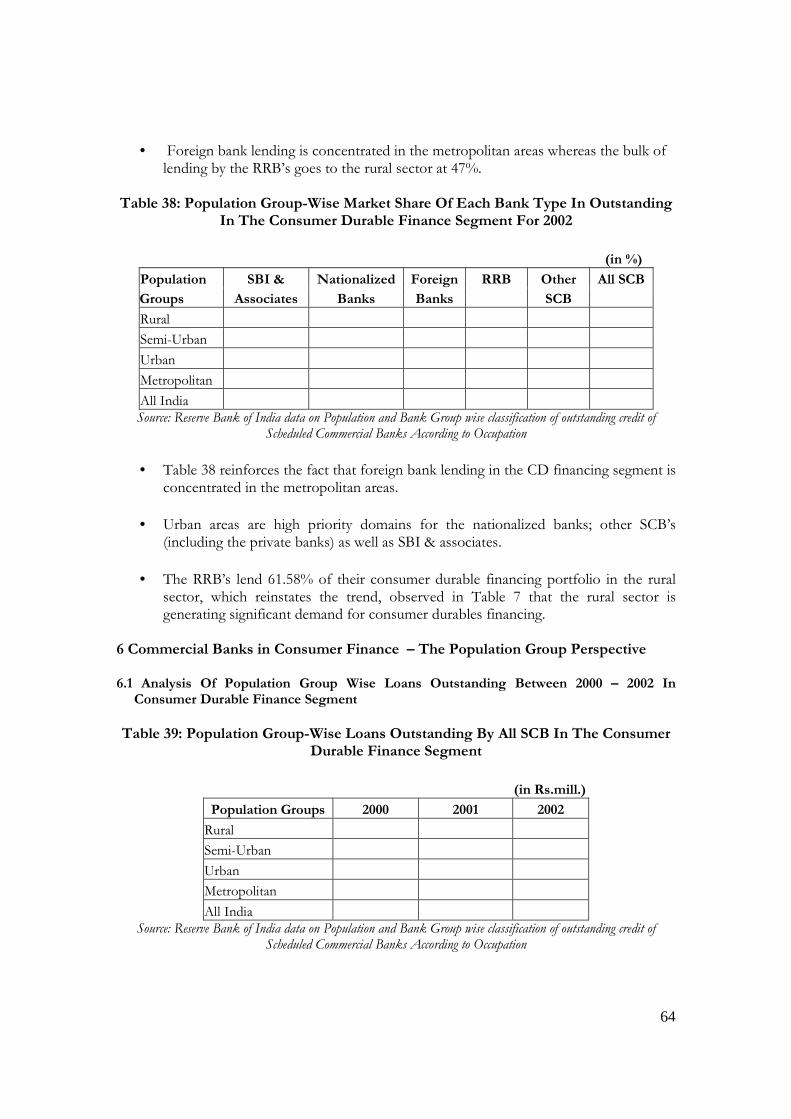
64
• Foreign bank lending is concentrated in the metropolitan areas whereas the bulk of lending by the RRB’s goes to the rural sector at 47%.
Table 38: Population Group-Wise Market Share Of Each Bank Type In Outstanding
In The Consumer Durable Finance Segment For 2002
(in %)
Population SBI & Nationalized Foreign RRB Other All SCB
Groups Associates Banks Banks SCB
Rural
Semi-Urban
Urban
Metropolitan
All India
Source: Reserve Bank of India data on Population and Bank Group wise classification of outstanding credit of Scheduled Commercial Banks According to Occupation
• Table 38 reinforces the fact that foreign bank lending in the CD financing segment is concentrated in the metropolitan areas.
• Urban areas are high priority domains for the nationalized banks; other SCB’s (including the private banks) as well as SBI & associates.
• The RRB’s lend 61.58% of their consumer durable financing portfolio in the rural sector, which reinstates the trend, observed in Table 7 that the rural sector is generating significant demand for consumer durables financing.
6 Commercial Banks in Consumer Finance – The Population Group Perspective 6.1 Analysis Of Population Group Wise Loans Outstanding Between 2000 – 2002 In
Consumer Durable Finance Segment
Table 39: Population Group-Wise Loans Outstanding By All SCB In The Consumer
Durable Finance Segment
(in Rs.mill.)
Population Groups 2000 2001 2002
Rural
Semi-Urban
Urban
Metropolitan
All India
Source: Reserve Bank of India data on Population and Bank Group wise classification of outstanding credit of Scheduled Commercial Banks According to Occupation

65
Figure 9- Population Group Outstanding For Purchase Of Consumer Durables In 2002
25%
25%30%
20%
Rural
Semi-Urban
Urban
Metropolitan
Source: Reserve Bank of India data on Population and Bank Group wise classification of outstanding credit
of Scheduled Commercial Banks According to Occupation
6.2 Population Group-Wise Analysis Of Amount Outstanding Per Loan In The
Consumer Durable Finance Segment
Table 40: Amounts Outstanding Per Loan Account in the Consumer Durable Finance Segment
(in Rs.'000)
Population Group 2000 2001 2002
Rural
Semi-Urban
Urban
Metropolitan
All India Source: Reserve Bank of India data on Population and Bank Group wise classification of outstanding credit of
Scheduled Commercial Banks According to Occupation
• Amount outstanding per loan account has been steadily decreasing in the metropolitan area at the cost of increasing trends in the urban, semi urban and rural areas.

66
7 Formal Credit In Consumer Durable Finance Sector By Location 7.1 Region-Wise Outstanding In Consumer Durable Finance Segment For 2000-2002
Table 41: Region Wise Outstanding By All SCB’s In Consumer Durable Finance
Particulars 2000 2001 2002
Regions of India No. of Amount No. of Amount No. of Amount
Accounts O/s Accounts O/s Accounts O/s
Northern Region North-Eastern Region
Eastern Region
Central Region
Western Region
Southern Region
All India Source: Reserve Bank of India data on State and Bank Group Wise Classification of Outstanding Credit of
Scheduled Commercial Banks According to Occupation
• Total outstanding have been falling in the southern, northern and western regions with increase in the remaining parts of India. Number of accounts are also decreasing in all regions apart from the north eastern region
7.2 Region Wise Analysis Of Amount Outstanding Per Account In The Consumer Durable
Finance Segment
Table 42: Amount Outstanding Per Account in The Consumer Durables Finance
Segment
(Rs. '000)
Regions of India 2000 2001 2002
Northern Region
North-Eastern Region
Eastern Region
Central Region
Western Region
Southern Region
All India Source: Reserve Bank of India data on State and Bank Group Wise Classification of Outstanding Credit of
Scheduled Commercial Banks According to Occupation
• The amount per loan has been decreasing in the northern and western regions. The southern region is growing at a modest rate whereas the north eastern, eastern and central regions show increasing trends. This trend maybe indicative of the fact that

67
consumers are availing CD finance for costlier products, which explains the increase in quantum of loan per account.
V. Auto Finance And Two- Wheeler Finance 1. Data Description The Car Finance (CF) and the Two-Wheeler Finance (TWF) industry in India comprises of the scheduled commercial banks, financial institutions and NBFC’s (See Appendix X). The source of data used for the analysis of these segments is taken from the CRIS INFAC Retail Finance Annual Review January 2003. 2. Market Size Of Car Finance Segment The car finance market comprises one of the largest shares of the key retail finance market with an estimated share of 30% and the two-wheeler finance market accounts for 11% respectively in 2001-2002. The TWF is estimated to have grown at 37% to Rs. 51.7 billion during the 1998-99 to 2001-02 period due to the higher growth in motorcycles sales and higher penetration of finance schemes.
Figure 10:Retail Finance: Relative Share of Key Segments (2001-02)
7%
52%11%
30% Consumer Durables
Housing
Two Wheelers
Car
Source: CRIS INFAC Retail Finance Annual Review: January 2003
The CF market is estimated to have increased at a CAGR of 25% during the 1995-96 to 2001-02 period to around Rs. 125 billion. The TWF market is estimated to have grown by 37% to Rs. 51.7 billion during the 1998-99 to 2001-02 period.

68
Table 43: Retail Finance: Growth Over The Years (Rs. bill.)
Particulars 1995-96 1998-99 2000-01 2001-02 YOY (%) CAGR (%) Car Finance -New cars -Used cars Two Wheeler
Source: CRIS INFAC
3. Key Players in the Car Finance and Two-Wheeler Finance Segments At present foreign banks, financial institutions and large NBFC’s dominate the car finance organised sector. The key players in the car finance market are ICICI Bank, Kotak Mahindra Finance, Citibank and Standard Chartered Bank. According to CRIS INFAC estimates, the share of NBFC’s have declined to around 17% as compared to 83% market share of the banks in 2001-02 (excluding the share of Kotak Mahindra Finance). Table 44: Car Finance: Key Players
( Rs. mill.) Particulars 2000-01 2001-02 ICICI Group Citibank Kotak Group (including Ford Credit) StanChart Group (including ANZ) Sundaram Finance and FISAF ABILL. Amro Bank HDFC Bank GE Countrywide Finance GMAC American Express HSBC Group Tata Finance Ashok Leyland Finance Chola FIDIS
Source: Industry estimates

69
Figure 11: Car Finance-Market Share Estimates (2001-02)
16%
9%
9%
8%
7%6%6%
39%
ICICI Group
CitiBank
Kotak Group
StanChart Group
Sundaram Group
ABN Amro Bank
HDFC Bank
Others
[
The key players in the TWF markets have traditionally been captive finance companies of two wheeler manufacturers such as Auto Finance, Kinetic Finance and Harita Finance (TVS Group). However banks have also emerged as key players in the last three-four years. Prominent players are Centurion Bank, ICICI Bank, Ashok Leyland Finance, HDFC Bank and Cholamandalam Investment & Finance Company Table 44: Two Wheeler Finance-Key Players
(Rs. bill.) Particulars 2001-02 Ashok Leyland Bajaj Auto Finance Kinetic Bank
Source: CRIS INFAC 4. Loan Structure Of Different Car Finance Loans And Two-Wheeler Finance Loans
Table 45: Loan Structure Of Vehicle Financing Products Particulars Cost
Per Unit
Margin (%)
Financed Tenure Years (Most Preferred)
Finance Cost To Consumer
EMI (Rs.)
Car Finance -New cars -Used cars Two- wheelers -Mopeds -Scooters -Motorcycles
Source: CRIS INFAC
There has been an increasing preference for loan products by consumers particularly in the urban areas by the youth. Demand for car finance has
increased due to the extended reach of the financers, higher access to finance in the semi urban areas and emerging towns.

70
VI. Employee Loans Many firms provide loans to employees for purposes such as housing, durables purchase, education for children as well as other loans. Information on such ‘employee loans’ is available from firms’ annual reports. Public sector firms are the most aggressive providers of employee loans, though a few private sector companies such as Hindustan Times are also significant lenders to employees. Employee loans given by the top 50 companies constitutes greater than 90 percent of the employee loans given by all corporates. The details are provided in the tables below. Table 46: Analysis of Employee Loans For The Period 2000-2002
Source: MIE Prowess Database
Table 47: List of Top 50 Companies For the Year 2001- Employee Loan Perspective
Serial No. Companies Employee Loan Amount
(in Rs. mill.)
1 Oil & Natural Gas Corpn. Ltd.
2 National Thermal Power Corpn. Ltd.
3 Bharat Petroleum Corpn. Ltd.
4 Steel Authority Of India Ltd.
5 Standard Chartered Grindlays Bank Ltd. [Merged]
6 Indian Farmers Fertiliser Co-Op. Ltd.
7 Oil India Ltd.
8 National Bank For Agriculture & Rural Development
9 G A I L (India) Ltd.
10 Power Grid Corpn. Of India Ltd.
11 Gujarat State Fertilizers & Chemicals Ltd.
12 Infosys Technologies Ltd.
13 Indian Petrochemicals Corpn. Ltd.
14 Industrial Development Bank Of India
(in Rs. mill.)
PARTICULARS 2000 2001 2002
Total Employee Loan Amount for 1715 companies Total Employee Loan Amount for Top 50 companies
Percentage of top 50 to Total

71
Serial No. Companies Employee Loan Amount
(in Rs. mill.)
15 Standard Chartered Bank
16 Air India Ltd.
17 Rashtriya Chemicals & Fertilizers Ltd.
18 National Aluminium Co. Ltd.
19 Indian Airlines Ltd.
20 Nicholas Piramal India Ltd.
21 Kochi Refineries Ltd.
22 National Hydro-Electric Power Corpn. Ltd.
23 National Fertilizers Ltd.
24 Tamil Nadu Civil Supplies Corpn. Ltd.
25 Shipping Corpn. Of India Ltd.
26 Western Coalfields Ltd.
27 Bharat Heavy Electricals Ltd.
28 H M T Machine Tools Ltd.
29 Associated Cement Cos. Ltd.
30 Housing & Urban Development Corpn. Ltd.
31 Andhra Pradesh State Financial Corpn.
32 Kudremukh Iron Ore Co. Ltd.
33 Ranbaxy Laboratories Ltd.
34 Sun Pharmaceutical Inds. Ltd.
35 Bharat Electronics Ltd.
36 Indian Aluminium Co. Ltd.
37 H M T Watches Ltd.
38 Dabur India Ltd.
39 Tamilnadu Industrial Investment Corpn. Ltd.
40 Rashtriya Ispat Nigam Ltd.
41 Bharat Coking Coal Ltd.
42 H M T Ltd.
43 Stock Holding Corpn. Of India Ltd.
44 Hindustan Newsprint Ltd.
45 Eastern Coalfields Ltd.
46 State Bank Of Saurashtra
47 S I C O M Ltd.
48 Haryana Power Generation Corpn. Ltd.
49 Credit Rating Information Services Of India Ltd.
50 Power Finance Corpn. Ltd.
Source: CMIE Prowess Database

72
VII. SFCs and Cooperatives
VII.A Cooperative Banks 1. Introduction
Availability of institutional credit in India, particularly in rural areas, was almost absent at the dawn of the twentieth century. The rural population had to depend on moneylenders for the bulk of their agriculture and related activities at high rates of interest. Co-operative banks arrived in India in the beginning of 20th Century as an effort to create a new type of institution based on the principles of co-operative organization and management, suitable for problems peculiar to Indian conditions. These banks were conceived as substitutes for moneylenders, to provide timely and adequate short-term and long-term institutional credit at reasonable rates of interest. Since then, the cooperative banking sector has made significant strides in the field of rural credit. Their role in rural financing continues to be important even today, and their business in the urban areas also has increased phenomenally in recent years mainly due to the sharp increase in the number of primary co-operative banks.
Though registered under the Co-operative Societies Act of the Respective States, the banking related activities of the co-operative banks are also regulated by the Reserve Bank of India. They are governed by the Banking Regulations Act 1949 and Banking Laws (Co-operative Societies) Act, 1965.
2. Categories
There are 2 main categories of the co-operative banks:
a) Short term lending oriented co-operative banks constituting the state co-operative
banks, district co-operative banks and Primary Agriculture co-operative societies. b) Long term lending oriented co-operative banks constituting land development banks
at state, district and village levels. Of the two the former form the bulk of the cooperative credit.
The cooperative banking structure in India is divided into the following main categories:
1. Primary Urban Co-op Banks (PUCB)
2. Primary Agricultural Credit Societies (PACS)
3. District Central Co-operative Banks (DCCB)
4. State Co-operative Banks (SCB)
5. Land Development Banks (LDB)

73
3. Whom they cater to?
As have been mentioned earlier the co-operative banks arrived to cater to the demand of rural credit. Over the years, they have remained the prime institutional agencies with their vast network, wider coverage and outreach extending to remotest part of the country. Both the short term and long term cooperative credit institutions are basically farmers' organizations primarily meant to meet their credit related requirements. While the co-operative banks in rural areas mainly finance agricultural based activities including farming, cattle, milk, hatchery, personal finance etc. along with some small scale industries and self-employment driven activities, the co-operative banks in urban areas mainly finance various categories of people for self-employment, industries, small scale units, home finance, consumer finance, personal finance, etc.
Although commercial banks, have entered rural areas and opened large number of branches and RRBs have also established a large network of rural branches to cater to the credit need of rural poor, cooperatives continue to enjoy a place of crucial importance in the rural credit scenario. The reasons for their essential existence are:
– These institutions are primarily owned by the farmers, rural artisans, etc.
– They have been set up with the objective of promoting thrift and mutual help.
4. Current Status
The short-term cooperative credit structure consists of around 98,843 Primary Agricultural Credit Societies, 367 District Central Cooperative Banks and 30 State Cooperative Banks functioning with 831 and 12580 branches respectively purveying agricultural credit.
As at the end of 2000-01, the long term co-operative credit structure consisted of State Cooperative Agriculture and Rural Development Banks (SCARDBs) in 20 States /Union Territories with 732 Primary Cooperative Agriculture and Rural Development Banks (PCARDBs)/ branches of SCARDBs. Of the 20 SCARDBs, nine have unitary structure with branches; twelve have federal/mixed structure with PCARDBs and their branches
Total loans issued by SCBs and DCCBs witnessed a significant decline during the period between 1999-2000 and 2000-2001, registering decrease of 8.2% and 3.4%, respectively. However, DCCB saw a slight increase of 0.5% in the loan issued between the periods 2000-01 to 2001-02. While the loan issued by SCB continue to fall at a rate of 0.2%.
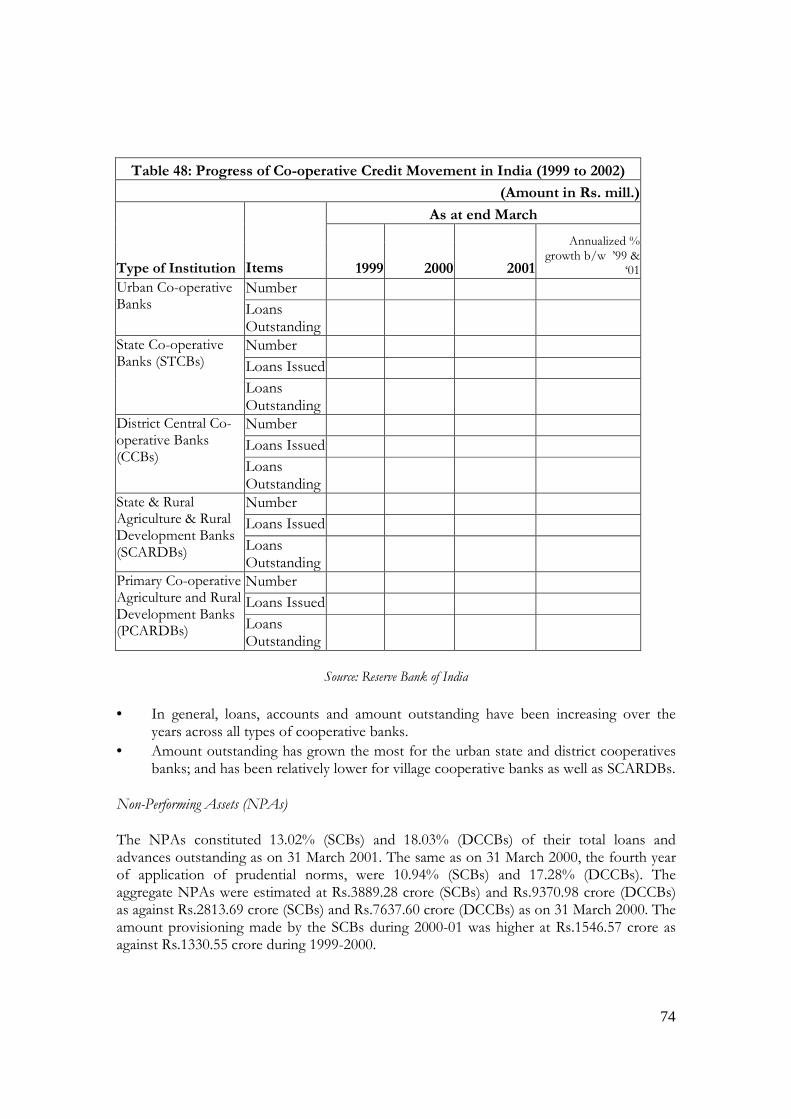
74
Table 48: Progress of Co-operative Credit Movement in India (1999 to 2002)
(Amount in Rs. mill.)
As at end March
Type of Institution Items 1999 2000 2001
Annualized % growth b/w ’99 &
‘01
Number Urban Co-operative Banks Loans
Outstanding
Number
Loans Issued
State Co-operative Banks (STCBs)
Loans Outstanding
Number
Loans Issued
District Central Co-operative Banks (CCBs)
Loans Outstanding
Number
Loans Issued
State & Rural Agriculture & Rural Development Banks (SCARDBs) Loans
Outstanding
Number
Loans Issued
Primary Co-operative Agriculture and Rural Development Banks (PCARDBs) Loans
Outstanding
Source: Reserve Bank of India
• In general, loans, accounts and amount outstanding have been increasing over the years across all types of cooperative banks.
• Amount outstanding has grown the most for the urban state and district cooperatives banks; and has been relatively lower for village cooperative banks as well as SCARDBs.
Non-Performing Assets (NPAs)
The NPAs constituted 13.02% (SCBs) and 18.03% (DCCBs) of their total loans and advances outstanding as on 31 March 2001. The same as on 31 March 2000, the fourth year of application of prudential norms, were 10.94% (SCBs) and 17.28% (DCCBs). The aggregate NPAs were estimated at Rs.3889.28 crore (SCBs) and Rs.9370.98 crore (DCCBs) as against Rs.2813.69 crore (SCBs) and Rs.7637.60 crore (DCCBs) as on 31 March 2000. The amount provisioning made by the SCBs during 2000-01 was higher at Rs.1546.57 crore as against Rs.1330.55 crore during 1999-2000.

75
The NPAs as on 31 March 2001 constituted 20.39% (SCARDBs) and 24.1% (PCARDBs) of their total loans and advances outstanding as on that date. The SCARDBs in Punjab and Haryana reported 'NIL' NPAs. The aggregate NPAs as on 31 March 2001 were estimated at Rs.2568.01 crore (SCARDBs) and Rs.2004.77 crore (PCARDBs).
5. Future of Cooperative banks
It is expected that cooperatives will continue to play an important role in the coming years – however there market shares will decline as RRBs, private sector and even some public sector banks take some of their shares especially in semi urban areas. However all in all for many more years to come they will continue to play an important role. Their poor performance compared to SCBs suggests that increasingly greater regulations will be imposed on them.
VII.B State Financial Corporations1
1. Introduction
The State Financial Corporations (SFCs), operating as development banks, are state-level financial institutions, play a crucial role in the development of small and medium enterprises in the states in tandem with the national priorities. In all, there are 18 SFCs in the country, of which 17 were set up under the SFCs Act 1951. Tamil Nadu Industrial Investment Corporation Limited, established in 1949 under the Companies Act as Madras Industrial Investment Corporation, also functions as a SFC.
2. Whom they cater to?
The SFCs provide financial assistance by way of term loans, direct subscription to equity/ debentures, guarantees, discounting of bills of exchange and seed/special capital. The SFCs operate a number of schemes of refinance and equity type assistance, in addition to the special schemes for artisans, and special target groups such as SC/ST, women, ex-servicemen and physically handicapped.
3. Current Status
The disbursements of SFCs saw a decline of 24 % in 1997-98 and 23 % in 1998-99. However, a growth of 12% in the year 1999-2000 and a further growth of 10% in the 2000-01 was observed.
1 This section has benefited significantly from http://www.idbi.com/bnk02/Chapter-15.pdf

76
Table 49: Year wise disbursement from 1997 to 2001
Year Disbursements (Rs Million)
Growth rate (%)
1997-98
1998-99 1999-2000
2000-01
Source: http://www.idbi.com/bill.k02/Chapter-15.pdf
Table 50: Assets of State Financial Corporations
(Rs. in Million)
Assets Year Loans and Advances Other Assets
1997-98
1998-99 2000-01
Source: Handbook of Statistics on Indian Economy, Reserve Bank of India, 1999 *Provisional figures for 2001
4. Future
The Government of India has set up a Committee headed by Shri G.P. Gupta, the then Chairman and Managing Director, Industrial Development Bank of India for looking into the functioning of SFCs and making recommendations for their restructuring and revitalization. The Committee, in its report submitted to the Government of India in January 2001, indicated that the future business canvas of SFCs is likely to be affected by stiff competition emerging in the financial system. In the wake of WTO provisions becoming effective, SSI sector would face new challenges. The Committee also felt that, there would be a new role for financial institutions specialising in and dedicated to financing and development of SSI sector. On the whole, SFCs will suffer financially due to the ongoing opening of financial markets for private players. And many are re-appraising their role. Currently there is no indication that they will be wound up, however many SFCs are currently re-appraising the role that they will play in the future.

77
VIII. Priority Sector Lending The regulation directing banks to lend 40% of their advances to the priority sectors is the first exercise that the Government of India undertook by way of a corrective measure for the lop-sided credit policies of the Banks in India in those days i.e. prior to nationalization of banks in 1969. This discipline was enforced when banks were brought under social control in 1967 i.e. even before nationalization. This is a comprehensive measure, since it automatically cast an obligation on the banks for lending 18% of their net outstanding credit to Agriculture as part of the priority sector targets. This in turn focused and depended on opening a number of rural and semi-urban branches. Banks cannot lend to agriculture significantly enough to fulfill the target unless they move to the rural areas extensively. The obligation to provide a wide spread and coverage of these type of advances necessitates the Banks to change the basic culture of their lending exercise, hitherto confined primarily to big businessmen and traders locating their operations predominately in the metropolitan and urban centres. Banks were necessarily to move to the rural and semi-urban centers and to hitherto unbanked/ underbanked areas in order to fulfill their new responsibility. Table 51: Advances to the Priority Sectors by Scheduled Commercial Banks, 2001
(Rs. mill.)
I. Agriculture
i) Direct
ii) Indirect
II. Small-scale industries
III. Other priority sector
Advances*
IV. Total priority sector
Advances#
Priority Sector Advances - the What & Why Targets under Priority Sector Lending
The targets and sub-targets set under priority sector lending for domestic and foreign banks operating in India are furnished below:

78
Categories of Advances
Domestic banks (both public sector and
private sector banks) Foreign banks
operating in India
Total Priority Sector advances percent of NBC percent of NBC
Total agricultural advances percent of NBC No target
SSI advances No target percent of NBC
Export credit
Export credit does not form part of priority
sector percent of NBC
Advances to weaker sections percent of NBC No target
[Note: NBC denotes Net Bank Credit]
Composition of Priority Sector Credit Broadly, the priority sector comprises the following:
� Agriculture (direct & indirect finance) � Direct & Indirect Finance to Small scale industries (including setting up of industrial
estates) � Small road and water transport operators (owning up to 10 vehicles). � Small business (Original cost of equipment used for business not to exceed Rs. 20
lakh) � Retail trade (advances to private retail traders up to Rs.10 lakh) � Professional and self-employed persons (borrowing limit not exceeding Rs.10 lakh of
which not more than Rs.2 lakh for working capital; in the case of qualified medical practitioners setting up practice in rural areas, the limits are Rs. 15 lakh and Rs. 3 lakh respectively and purchase of one motor vehicle within these limits can be included under priority sector)
� State sponsored organizations for Scheduled Castes/Scheduled Tribes � Education (educational loans granted to individuals by banks) � Housing [both direct and indirect - loans up to Rs.5 lakh (direct loans up to Rs. 10
lakh in urban/ metropolitan areas), Loans up to Rs. 1 lakh and Rs. 2 lakh for repairing of houses in rural/ semi-urban and urban areas respectively]
� Consumption loans (under the consumption credit scheme for weaker sections)

79
� Micro-credit provided by banks either directly or through any intermediary; Loans to self help groups (SHGs)/ Non Governmental Organizations (NGOs) for further lending to SHGs
� Loans to the software industry (having credit limit not exceeding Rs. 1 crore from the banking system)
� Loans to specified industries in the food and agro-processing sector having investment in plant and machinery up to Rs. 5 crore
� Investment by banks in venture capital (venture capital funds/ companies registered with SEBI)
� Direct Finance to Agriculture � Indirect Finance to Agriculture � Small Scale Industries � Tiny Sector � Small Scale Service & Business Enterprises (SSSBE's)
Direct Finance to Agriculture: Direct Agricultural advances denote advances given by banks directly to farmers for agricultural purposes. These include short-term loans for raising crops i.e. for crop loans. In addition, advances up to Rs. 5 lakh to farmers against pledge/hypothecation of agricultural produce (including warehouse receipts) for a period not exceeding 12 months, where the farmers were given crop loans for raising the produce, provided the borrowers draw credit from one bank. Direct finance also includes medium and long-term loans (Provided directly to farmers for financing production and development needs) such as Purchase of agricultural implements and machinery, Development of irrigation potential, Reclamation and Land Development Schemes, Construction of farm buildings and structures, etc. Other types of direct finance to farmers includes loans to plantations, development of allied activities such as fishery, poultry etc and also establishment of bio-gas plants, purchase of land for agricultural purposes by small and marginal farmers and loans to agri-clinics and agri-business centres. Indirect Finance to Agriculture: Indirect finance denotes to finance provided by banks to farmers indirectly, i.e., through other agencies. Important items included under indirect finance to agriculture are as under:
� Credit for financing the distribution of fertilizers, pesticides, seeds, etc. � Loans up to Rs. 25 lakhs granted for financing distribution of inputs for the allied
activities such as, cattle feed, poultry feed, etc. � Loans to Electricity Boards for reimbursing the expenditure already incurred by
them for providing low tension connection from step-down point to individual farmers for energizing their wells.
� Loans to State Electricity Boards for Systems Improvement Scheme under Special Project Agriculture (SI-SPA).
� Deposits held by the banks in Rural Infrastructure Development Fund (RIDF) maintained with NABARD.
� Subscription to bonds issued by Rural Electrification Corporation (REC) exclusively for financing pump-set energisation programme in rural and semi-urban areas and also for financing System Improvement Programme (SI-SPA).

80
� Subscriptions to bonds issued by NABARD with the objective of financing agriculture/allied activities.
� Finance extended to dealers in drip irrigation/sprinkler irrigation system/agricultural machinery, subject to the following conditions:
� The dealer should be located in the rural/semi-urban areas. � He should be dealing exclusively in such items or if dealing in other products, should
be maintaining separate and distinct records in respect of such items. � A ceiling of up to Rs. 20 lakhs per dealer should be observed. � Loans to Arthias (commission agents in rural/semi-urban areas) for meeting their
working capital requirements on account of credit extended to farmers for supply of inputs.
� Lending to Non Banking Financial Companies (NBFCs) for on-lending to agriculture
'Small Scale Industries' (SSI): Small scale industrial units are those engaged in the manufacture, processing or preservation of goods and whose investment in plant and machinery (original cost) does not exceed Rs. 1 crore. These would, inter alia, include units engaged in mining or quarrying, servicing and repairing of machinery. In the case of ancillary units, the investment in plant and machinery (original cost) should also not exceed Rs. 1 crore to be classified under small-scale industry. The investment limit of Rs.1 crore for classification as SSI has been enhanced to Rs.5 crore in respect of certain specified items under hosiery and hand tools by the Government of India 'Tiny Enterprises': The status of 'Tiny Enterprises' is given to all small scale units whose investment in plant & machinery is up to Rs. 25 lakhs, irrespective of the location of the unit. Small Scale Service & Business Enterprises (SSSBE's): Industry related service and business enterprises with investment up to Rs. 10 lakhs in fixed assets, excluding land and building will be given benefits of small scale sector. For computation of value of fixed assets, the original price paid by the original owner will be considered irrespective of the price paid by subsequent owners. Indirect finance in the Small-Scale Industrial Sector – Components
� Financing of agencies involved in assisting the decentralized sector in the supply of inputs and marketing of outputs of artisans, village and cottage industries.
� Finance extended to Government sponsored Corporation/ organizations providing funds to the weaker sections in the priority sector.
� Advances to handloom co-operatives. � Term finance/loans in the form of lines of credit made available to State Industrial
Development Corporation/State Financial Corporations for financing SSIs.

81
� Funds provided by banks to SIDBI/SFCs by way of rediscounting of bills � Subscription to bonds floated by SIDBI, SFCS, SIDCS and NSIC exclusively for
financing SSI units. � Subscription to bonds issued by NABARD with the objective of financing
exclusively non-farm sector. � Financing of NBFCS or other intermediaries for further lending to the tiny sector. � Deposits placed with SIDBI by Foreign Banks in fulfillment of shortfall in attaining
priority sector targets. � Bank finance to HUDCO either as a line of credit or by way of investment in special
bonds issued by HUDCO for on lending to artisans, handloom weavers, etc. under tiny sector may be treated as indirect lending to SSI (Tiny) Sector.
Types of investment made by Banks included under Priority Sector: Investments made by the banks in special bonds issued by the specified institutions could be reckoned as part of priority sector advances, subject to the following conditions:
State Financial Corporations (SFCs)/State Industrial Development Corporations (SIDCs). Subscription to bonds exclusively floated by SFCs & SIDCs for financing SSI units will be eligible for inclusion under priority sector as indirect finance to SSI.
Rural Electrification Corporation (REC). Subscription to special bonds issued by REC exclusively for financing pump-set energisation programme in rural and semi-urban areas and the System Improvement Programme under its Special Projects Agriculture (SI-SPA) will be eligible for inclusion under priority sector lending as indirect finance to agriculture.
NABARD. Subscription to bonds issued by NABARD with the objective of financing exclusively agriculture/allied activities and the non-farm sector will be eligible for inclusion under the priority sector as indirect finance to agriculture/ SSI, as the case may be.
Small Industries Development Bank of India (SIDBI). Subscriptions to bonds exclusively floated by SIDBI for financing of SSI units will be eligible for inclusion under priority sector as indirect finance to SSIs.
The National Small Industries Corporation Ltd. (NSIC). Subscription to bonds issued by NSIC exclusively for financing of SSI units will be eligible for inclusion under priority sector as indirect finance to SSIs.
National Housing Bank (NHB). Subscription to bonds issued by NHB exclusively for financing of housing, irrespective of the loan size per dwelling unit, will be eligible for inclusion under priority sector advances as indirect housing finance.
Housing & Urban Development Corporation (HUDCO). Subscription to bonds issued by HUDCO exclusively for financing of housing, irrespective of the loan size per dwelling unit, will be eligible for inclusion under priority sector advances as indirect housing finance.
Investment in special bonds issued by HUDCO for on lending to artisans, handloom weavers, etc. under tiny sector will be classified as indirect lending to SSI (Tiny) sector. [Source: Reserve Bank of India]

82
What constitutes net bank credit?
The net bank credit should tally with the figure reported in the fortnightly return submitted under section 42(2) of the Reserve Bank of India Act, 1934. However, outstanding deposits under the FCNR (B) and NRNR Schemes are excluded from net bank credit for computation of priority sector lending target/ sub-targets.
Components of Weaker Sections within the Priority Sector
The weaker sections under priority sector include the following:
• Small and marginal farmers with land holding of 5 acres and less and landless labourers, tenant farmers and sharecroppers.
• Artisans, village and cottage industries where individual credit limits do not exceed Rs. 50,000.
• Beneficiaries of Swarnjayanti Gram Swarojgar Yojana (SGSY) • Scheduled Castes and Scheduled Tribes • Beneficiaries of Differential Rate of Interest (DRI) scheme • Beneficiaries under Swarna Jayanti Shahari Rojgar Yojana (SJSRY) • Beneficiaries under the Scheme for Liberation and Rehabilitation of Scavangers
(SLRS). • Self Help Groups (SHGs)
Penalties/Action Taken in the case of Non-Achievement of Priority Sector Lending Target by a Bank
• Domestic scheduled commercial banks having shortfall in lending to priority sector / agriculture are allocated amounts for contribution to the Rural Infrastructure Development Fund (RIDF) established in NABARD. Details regarding operationalisation of the RIDF such as the amounts to be deposited by banks, interest rates on deposits, period of deposits etc., are decided every year after announcement in the Union Budget about setting up of RIDF.
• In the case of foreign banks operating in India, which fail to achieve the priority, sector lending target or sub-targets, an amount equivalent to the shortfall is required to be deposited with SIDBI for one year at the interest rate of 8 percent per annum.
Time Limit for Disposal of Loan Applications under PS Credit
• All loan applications up to a credit limit of Rs. 25,000 should be disposed of within a fortnight and those for over Rs. 25,000 within 8 to 9 weeks.
• Rate of Interest to be charged for Loans under Priority Sector • As per the current interest rate policy, in the case of loans up to Rs. 2 lakh, the
interest rate should not exceed the prime-lending rate (PLR) of the bank, while in the case of loans above Rs. 2 lakh, banks are free to determine the interest rate.

83
Monitoring of Priority Sector Lending by RBI Priority sector lending by commercial banks is monitored by Reserve Bank of India through periodical Returns received from them. Performance of banks is also reviewed in the various for a set up under the Lead Bank Scheme (at State, District and Block levels). [Source: Reserve Bank of India]
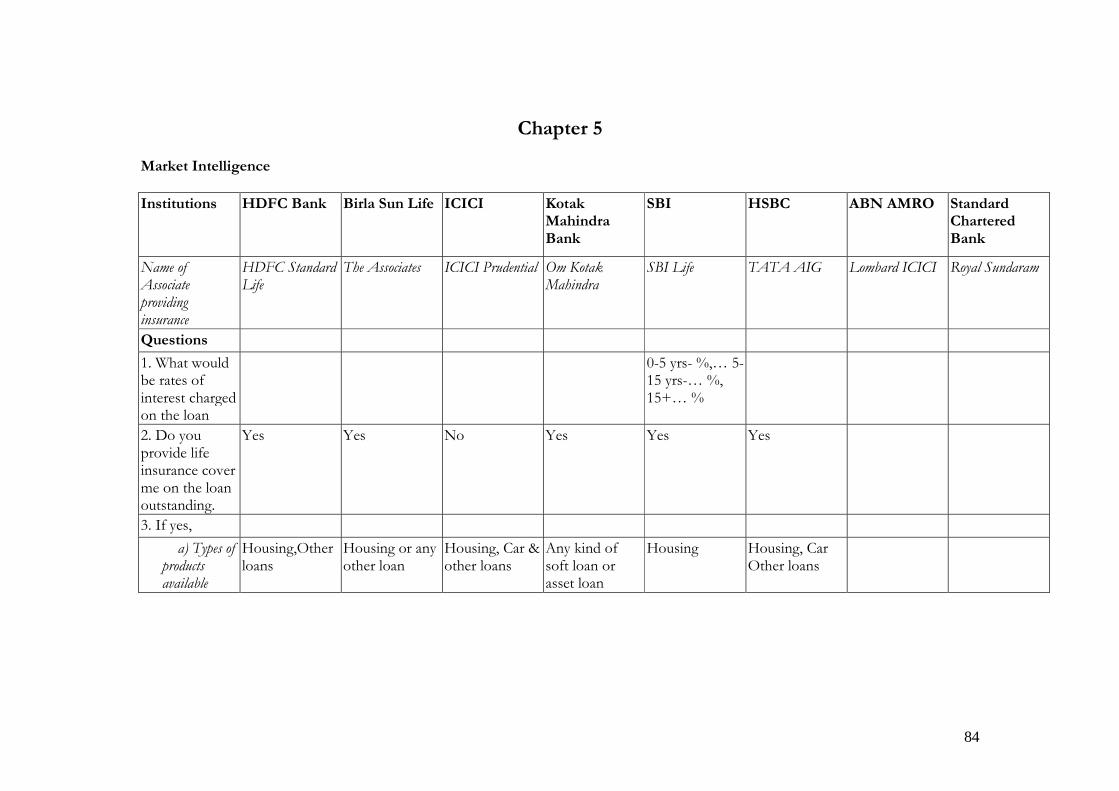
84
Chapter 5
Market Intelligence
Institutions HDFC Bank Birla Sun Life ICICI Kotak Mahindra Bank
SBI HSBC ABN AMRO Standard Chartered Bank
Name of Associate providing insurance
HDFC Standard Life
The Associates ICICI Prudential Om Kotak Mahindra
SBI Life TATA AIG Lombard ICICI Royal Sundaram
Questions
1. What would be rates of interest charged on the loan
0-5 yrs- %,… 5-15 yrs-… %, 15+… %
2. Do you provide life insurance cover me on the loan outstanding.
Yes Yes No Yes Yes Yes
3. If yes,
a) Types of products available
Housing,Other loans
Housing or any other loan
Housing, Car & other loans
Any kind of soft loan or asset loan
Housing Housing, Car Other loans

85
Institutions HDFC Bank Birla Sun Life ICICI Kotak Mahindra Bank
SBI HSBC ABN AMRO Standard Chartered Bank
b) Would the coverage under the policy be it be for the outstanding balance of the loan amount or for a specified amount at the beginning of the policy
Beginning Both types Outstanding balance is also done
Outstanding balance taken
No answer Both ways
c) What are the payment options single one time premium and/or part of EMIs and/or annual payment.
single Annual Payment
Life insurance not covered
Each year Single -one time
Both options
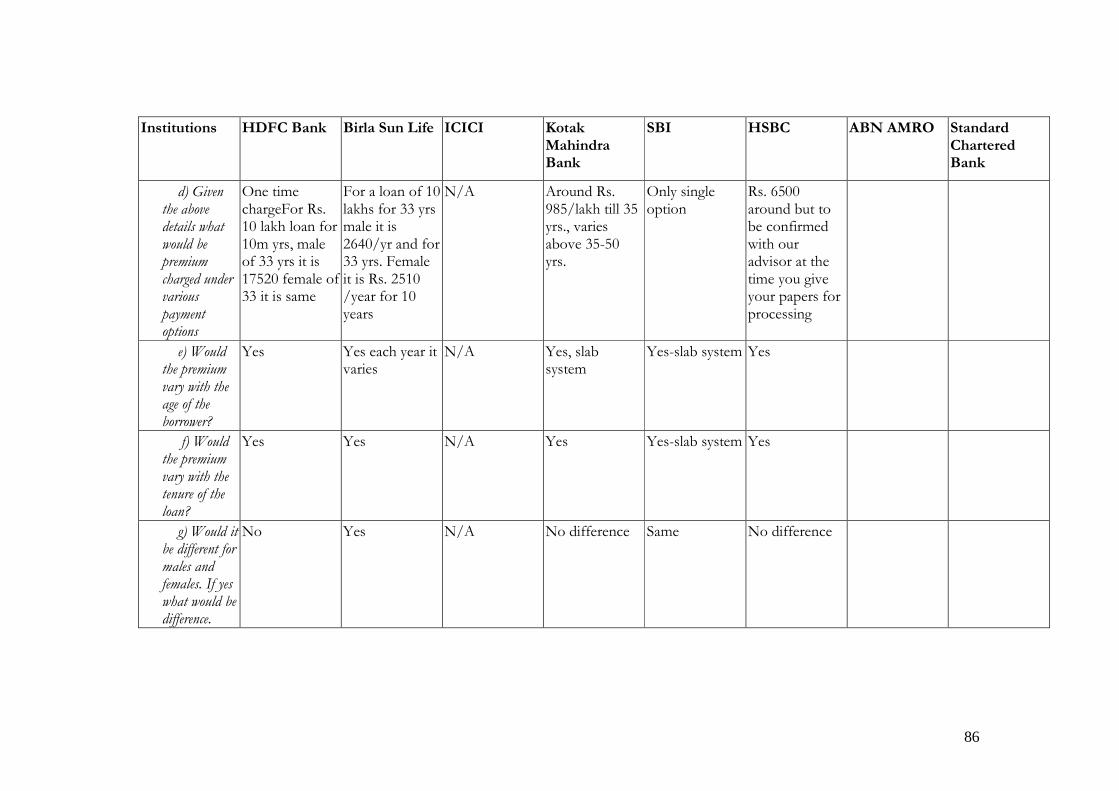
86
Institutions HDFC Bank Birla Sun Life ICICI Kotak Mahindra Bank
SBI HSBC ABN AMRO Standard Chartered Bank
d) Given the above details what would be premium charged under various payment options
One time chargeFor Rs. 10 lakh loan for 10m yrs, male of 33 yrs it is 17520 female of 33 it is same
For a loan of 10 lakhs for 33 yrs male it is 2640/yr and for 33 yrs. Female it is Rs. 2510 /year for 10 years
N/A Around Rs. 985/lakh till 35 yrs., varies above 35-50 yrs.
Only single option
Rs. 6500 around but to be confirmed with our advisor at the time you give your papers for processing
e) Would the premium vary with the age of the borrower?
Yes Yes each year it varies
N/A Yes, slab system
Yes-slab system Yes
f) Would the premium vary with the tenure of the loan?
Yes Yes N/A Yes Yes-slab system Yes
g) Would it be different for males and females. If yes what would be difference.
No Yes N/A No difference Same No difference

87
Institutions HDFC Bank Birla Sun Life ICICI Kotak Mahindra Bank
SBI HSBC ABN AMRO Standard Chartered Bank
h) Are similar credit shields available on other types of loans such as personal loan, car loan etc.
Yes Yes N/A Yes Only Housing Yes