market pay. company’s compensation strategy example: base pay will lag market (25 th percentile)...
TRANSCRIPT

Market PayMarket Pay
Company’s Compensation Company’s Compensation StrategyStrategy
Example:Example: Base Pay will lag market (25Base Pay will lag market (25thth percentile) percentile) Base + Target Incentive will match market Base + Target Incentive will match market
(50(50thth percentile) percentile) Base + Target Incentive + Stock Options Base + Target Incentive + Stock Options
will lead market (75will lead market (75thth – 90 – 90thth percentile) percentile)

Company’s Compensation Company’s Compensation StrategyStrategy
ExampleExample Need to attract and retain the best talentNeed to attract and retain the best talent Lead the market in base pay, paying Lead the market in base pay, paying
above the market (75above the market (75thth percentile) of the percentile) of the general industrygeneral industry
Share team success with team based Share team success with team based incentive payincentive pay
Support career advancement with key Support career advancement with key management level incentive paymanagement level incentive pay
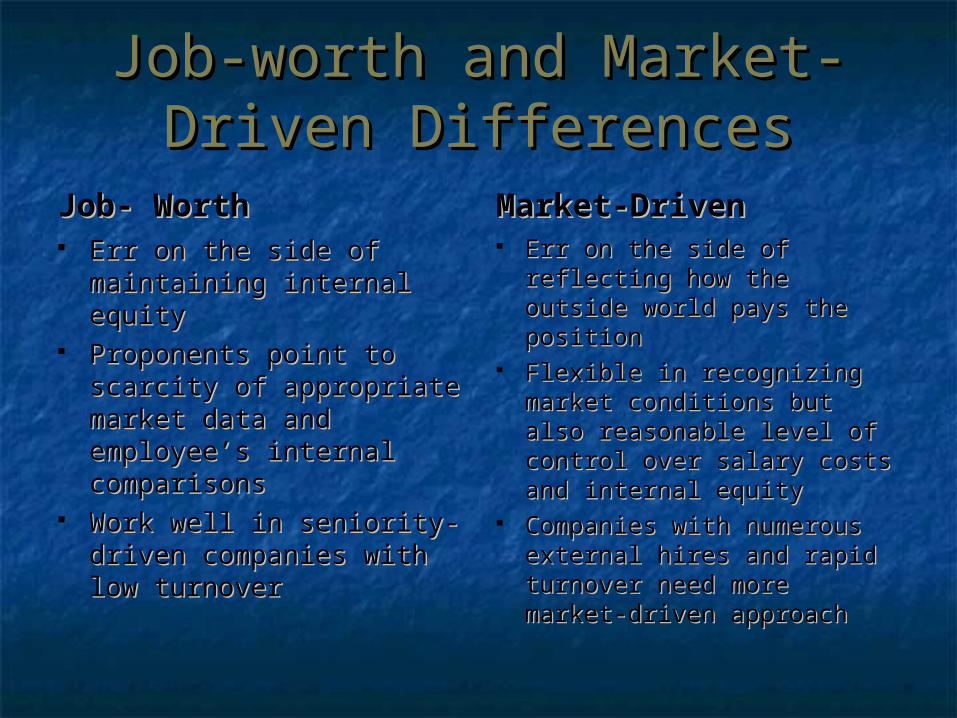
Job-worth and Market-Job-worth and Market-Driven DifferencesDriven Differences
Job- WorthJob- Worth Err on the side of Err on the side of
maintaining internal maintaining internal equityequity
Proponents point to Proponents point to scarcity of appropriate scarcity of appropriate market data and market data and employee’s internal employee’s internal comparisonscomparisons
Work well in seniority-Work well in seniority-driven companies with driven companies with low turnoverlow turnover
Market-DrivenMarket-Driven Err on the side of reflecting Err on the side of reflecting
how the outside world how the outside world pays the positionpays the position
Flexible in recognizing Flexible in recognizing market conditions but also market conditions but also reasonable level of control reasonable level of control over salary costs and over salary costs and internal equityinternal equity
Companies with numerous Companies with numerous external hires and rapid external hires and rapid turnover need more turnover need more market-driven approachmarket-driven approach

Job-worth and Market-Job-worth and Market-Driven ApproachesDriven Approaches
Many organizations use a hybrid of a job–Many organizations use a hybrid of a job–worth hierarchy with market-driven worth hierarchy with market-driven benchmarks to balance both internal benchmarks to balance both internal equity and market demands.equity and market demands.
Market-PricingMarket-Pricing
Market Pricing – the process of analyzing Market Pricing – the process of analyzing external salary survey data to establish external salary survey data to establish the worth of jobs as represented by the the worth of jobs as represented by the data, based upon the “scope” of the job data, based upon the “scope” of the job (company size, industry type, geography, (company size, industry type, geography, etc.).etc.).
Some form of market pricing is used by Some form of market pricing is used by more than 80 percent of companiesmore than 80 percent of companies
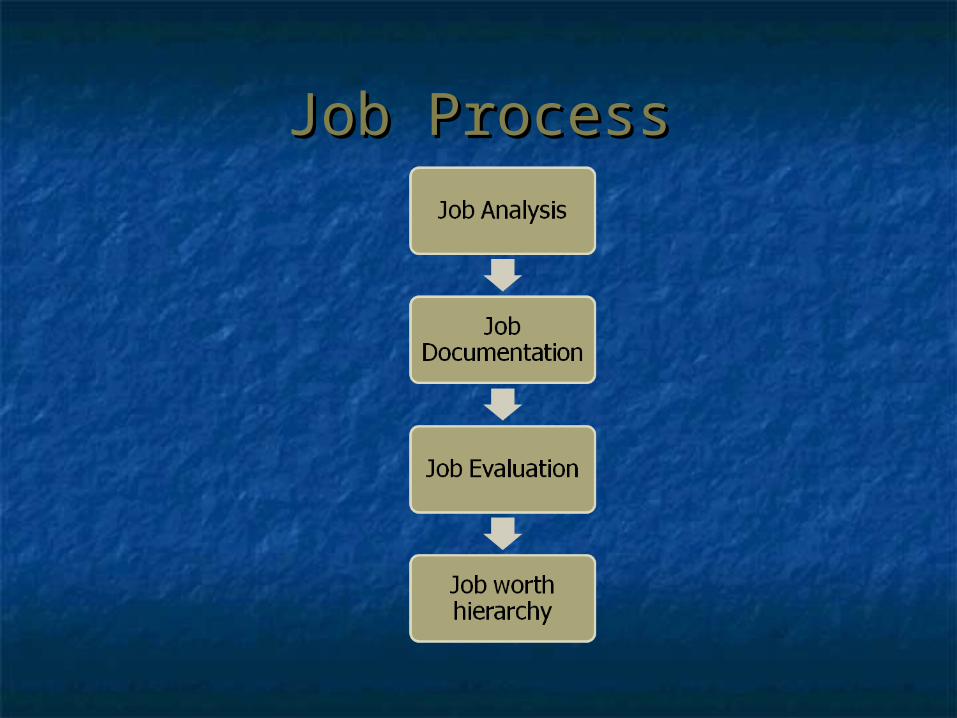
Job ProcessJob Process

Job ProcessJob Process
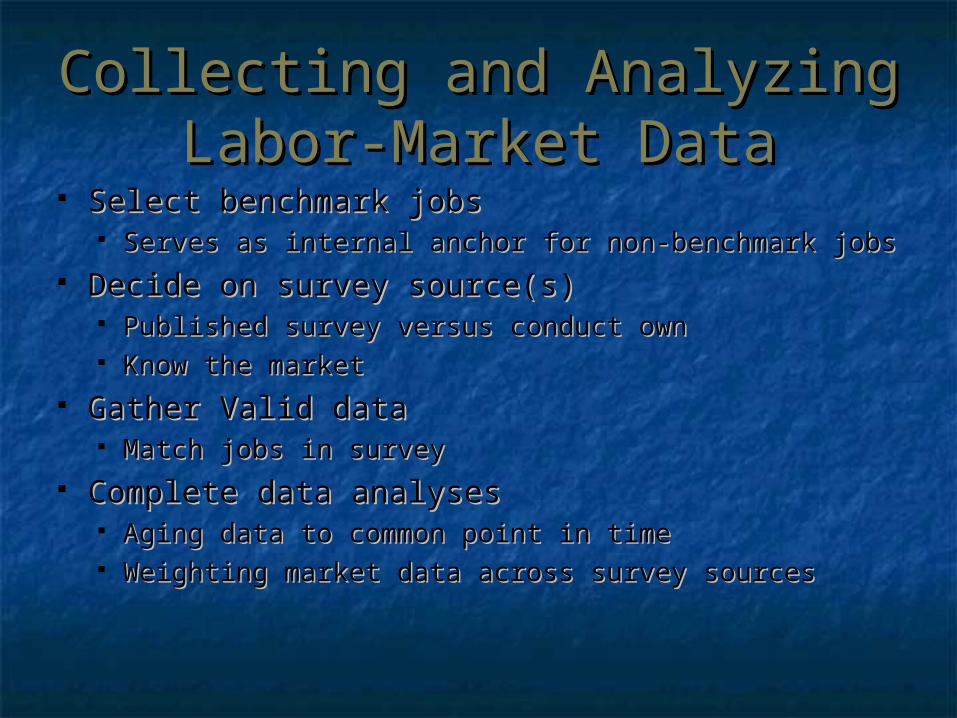
Collecting and Analyzing Collecting and Analyzing Labor-Market DataLabor-Market Data
Select benchmark jobsSelect benchmark jobs Serves as internal anchor for non-benchmark jobsServes as internal anchor for non-benchmark jobs
Decide on survey source(s)Decide on survey source(s) Published survey versus conduct ownPublished survey versus conduct own Know the marketKnow the market
Gather Valid data Gather Valid data Match jobs in surveyMatch jobs in survey
Complete data analysesComplete data analyses Aging data to common point in timeAging data to common point in time Weighting market data across survey sourcesWeighting market data across survey sources
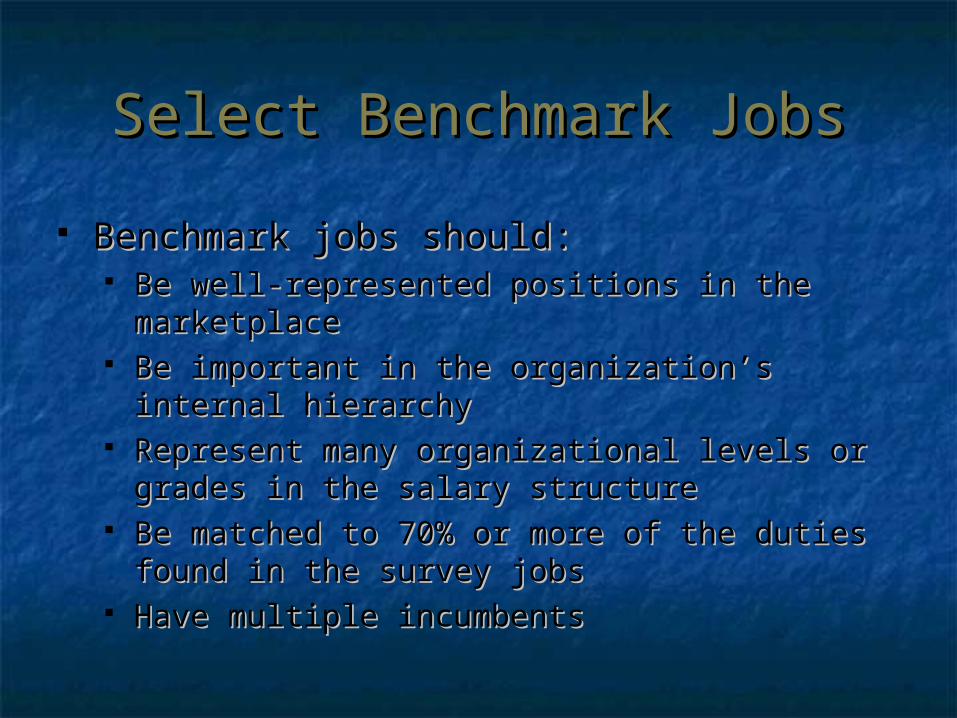
Select Benchmark JobsSelect Benchmark Jobs
Benchmark jobs should:Benchmark jobs should: Be well-represented positions in the Be well-represented positions in the
marketplacemarketplace Be important in the organization’s internal Be important in the organization’s internal
hierarchyhierarchy Represent many organizational levels or Represent many organizational levels or
grades in the salary structuregrades in the salary structure Be matched to 70% or more of the duties Be matched to 70% or more of the duties
found in the survey jobsfound in the survey jobs Have multiple incumbentsHave multiple incumbents
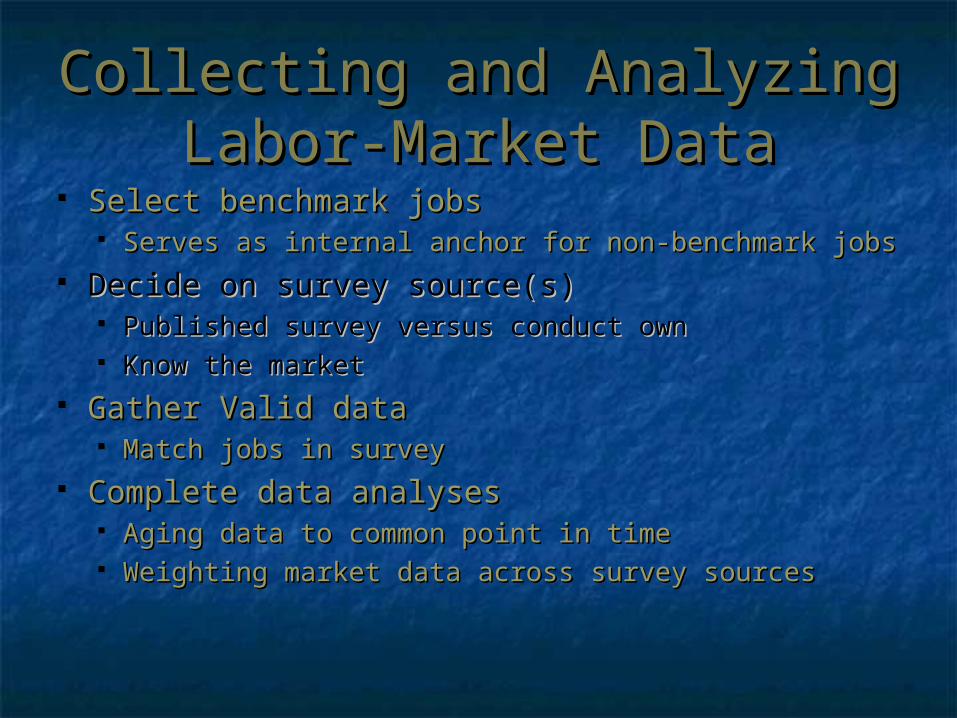
Collecting and Analyzing Collecting and Analyzing Labor-Market DataLabor-Market Data
Select benchmark jobsSelect benchmark jobs Serves as internal anchor for non-benchmark jobsServes as internal anchor for non-benchmark jobs
Decide on survey source(s)Decide on survey source(s) Published survey versus conduct ownPublished survey versus conduct own Know the marketKnow the market
Gather Valid data Gather Valid data Match jobs in surveyMatch jobs in survey
Complete data analysesComplete data analyses Aging data to common point in timeAging data to common point in time Weighting market data across survey sourcesWeighting market data across survey sources
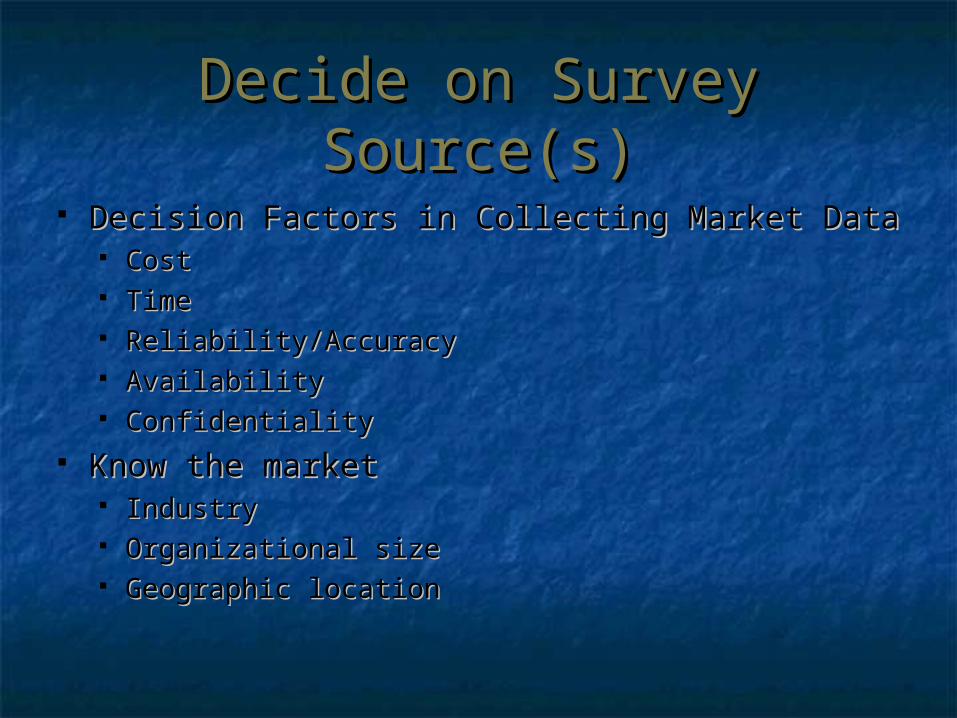
Decide on Survey Source(s)Decide on Survey Source(s) Decision Factors in Collecting Market DataDecision Factors in Collecting Market Data
Cost Cost TimeTime Reliability/AccuracyReliability/Accuracy AvailabilityAvailability ConfidentialityConfidentiality
Know the marketKnow the market IndustryIndustry Organizational sizeOrganizational size Geographic locationGeographic location
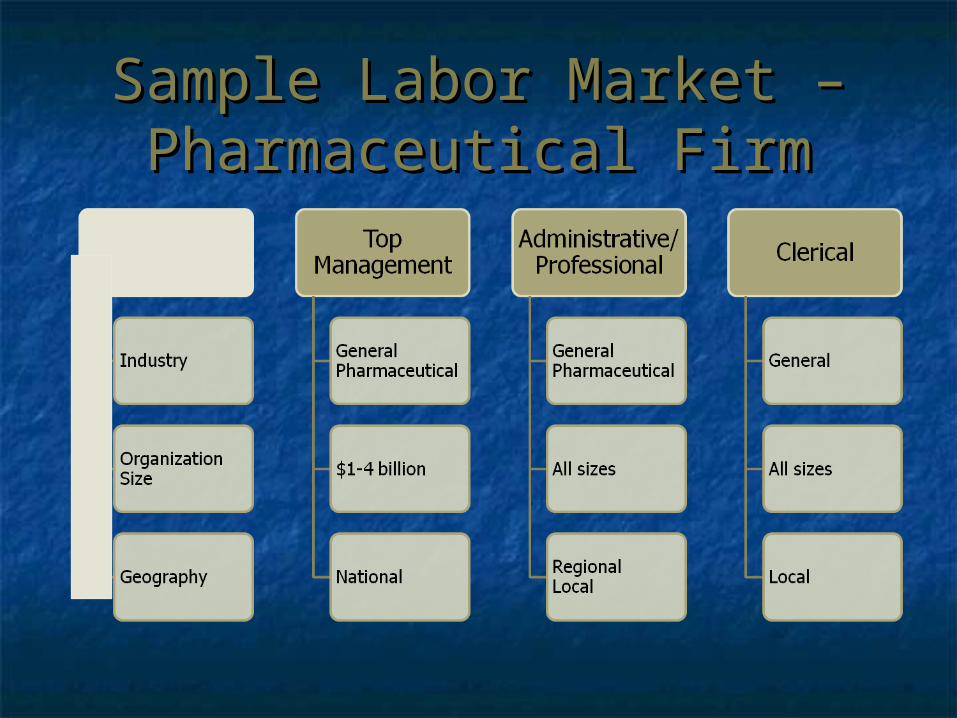
Sample Labor Market – Sample Labor Market – Pharmaceutical FirmPharmaceutical Firm
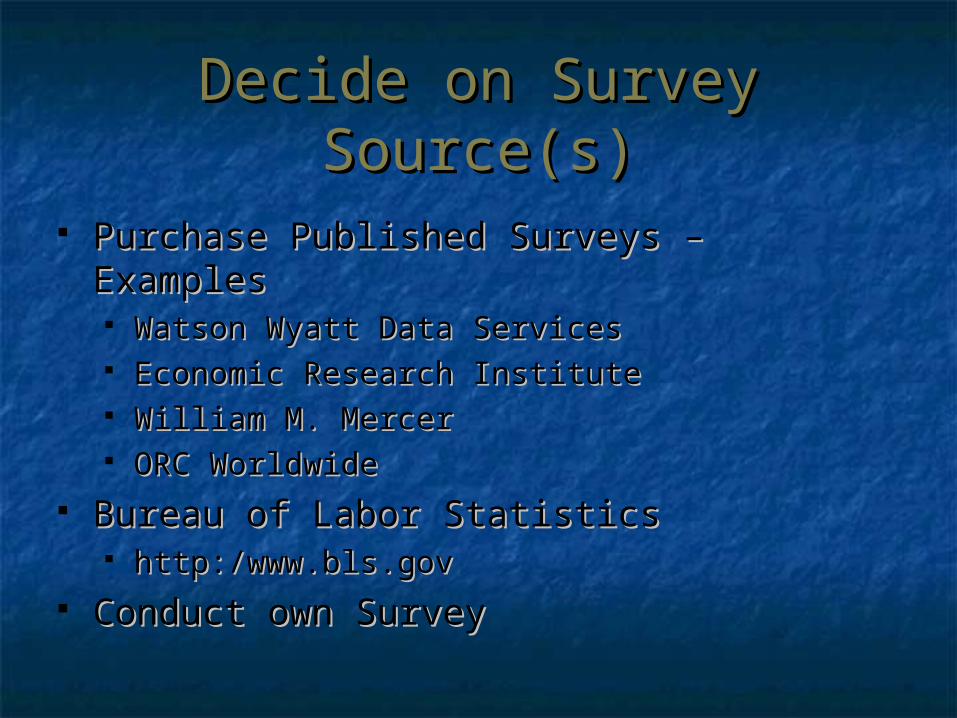
Decide on Survey Source(s)Decide on Survey Source(s)
Purchase Published Surveys – ExamplesPurchase Published Surveys – Examples Watson Wyatt Data ServicesWatson Wyatt Data Services Economic Research InstituteEconomic Research Institute William M. MercerWilliam M. Mercer ORC WorldwideORC Worldwide
Bureau of Labor StatisticsBureau of Labor Statistics http:/www.bls.govhttp:/www.bls.gov
Conduct own SurveyConduct own Survey
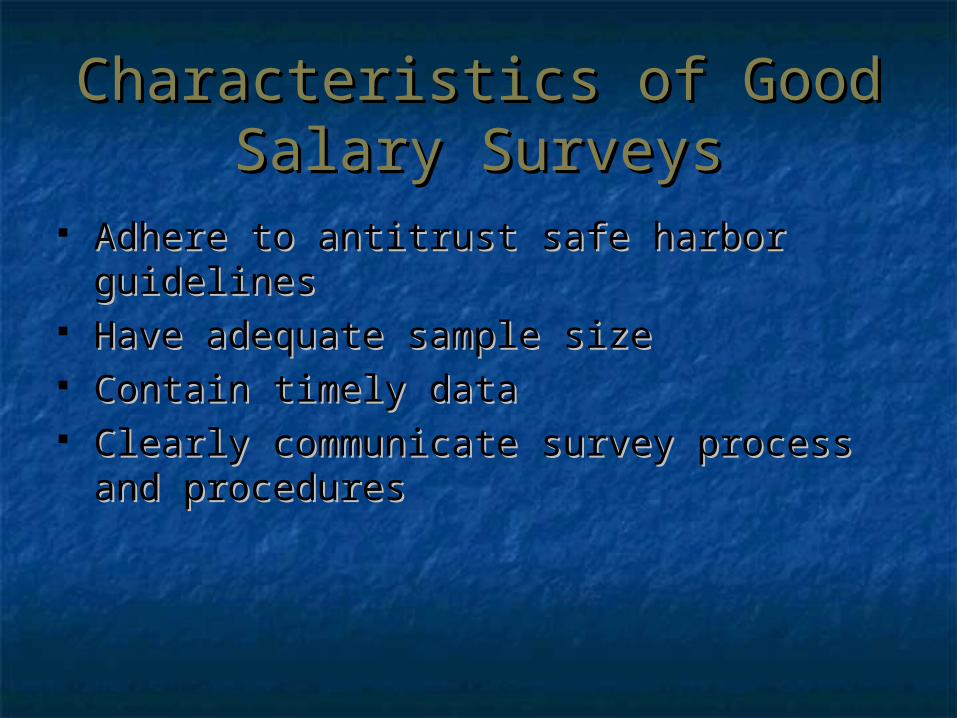
Characteristics of Good Characteristics of Good Salary SurveysSalary Surveys
Adhere to antitrust safe harbor guidelinesAdhere to antitrust safe harbor guidelines Have adequate sample sizeHave adequate sample size Contain timely data Contain timely data Clearly communicate survey process and Clearly communicate survey process and
proceduresprocedures
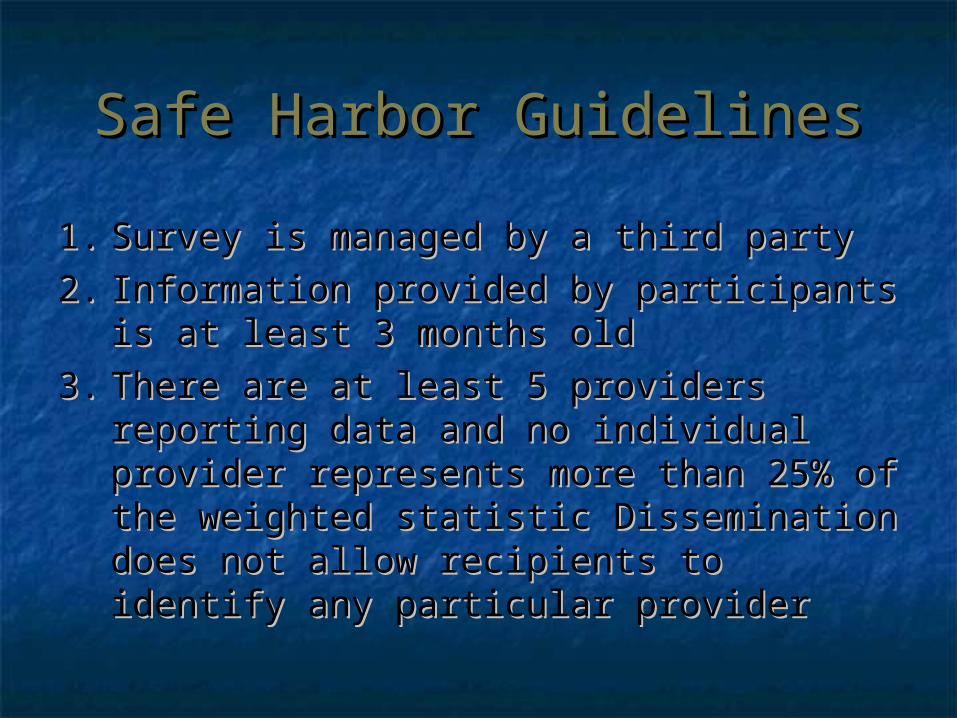
Safe Harbor GuidelinesSafe Harbor Guidelines
1.1. Survey is managed by a third partySurvey is managed by a third party
2.2. Information provided by participants is at Information provided by participants is at least 3 months oldleast 3 months old
3.3. There are at least 5 providers reporting There are at least 5 providers reporting data and no individual provider data and no individual provider represents more than 25% of the represents more than 25% of the weighted statistic Dissemination does not weighted statistic Dissemination does not allow recipients to identify any particular allow recipients to identify any particular providerprovider

Collecting and Analyzing Collecting and Analyzing Labor-Market DataLabor-Market Data
Select benchmark jobsSelect benchmark jobs Serves as internal anchor for non-benchmark jobsServes as internal anchor for non-benchmark jobs
Decide on survey source(s)Decide on survey source(s) Published survey versus conduct ownPublished survey versus conduct own Know the marketKnow the market
Gather Valid data Gather Valid data Match jobs in surveyMatch jobs in survey
Complete data analysesComplete data analyses Aging data to common point in timeAging data to common point in time Weighting market data across survey sourcesWeighting market data across survey sources
Gather Valid Data Gather Valid Data
Job matching is the most important Job matching is the most important component of a salary survey.component of a salary survey.
Job matched on job content Job matched on job content notnot job titles. job titles. Underlying assumption is the incumbents Underlying assumption is the incumbents
are performing at a solid competent level – are performing at a solid competent level – not beginners or superstars.not beginners or superstars.
One rule of thumb is to consider the match One rule of thumb is to consider the match to be appropriate if to be appropriate if 70% or more 70% or more of the of the job content is similarjob content is similar
How to Handle Incomplete How to Handle Incomplete Job MatchesJob Matches
Let’s say 60% of a job is “chief bottle Let’s say 60% of a job is “chief bottle washer” and 40% of a job is “executive washer” and 40% of a job is “executive chef”. What can you do?chef”. What can you do?
Pay market rate of a similar benchmark jobPay market rate of a similar benchmark job Pay the market rate of the bottle washerPay the market rate of the bottle washer Pay the “bottle washer” rate + a premium %Pay the “bottle washer” rate + a premium % Combine the market data 60%/40%Combine the market data 60%/40% Pay the highest market rate of the two jobsPay the highest market rate of the two jobs
Survey Job DescriptionsSurvey Job Descriptions
Vary from short paragraphs to a full pageVary from short paragraphs to a full page Often include organizational chartOften include organizational chart
Collecting and Analyzing Collecting and Analyzing Labor-Market DataLabor-Market Data
Select benchmark jobsSelect benchmark jobs Serves as internal anchor for non-benchmark jobsServes as internal anchor for non-benchmark jobs
Decide on survey source(s)Decide on survey source(s) Published survey versus conduct ownPublished survey versus conduct own Know the marketKnow the market
Gather Valid data Gather Valid data Match jobs in surveyMatch jobs in survey
Complete data analysesComplete data analyses Aging data to common point in timeAging data to common point in time Weighting market data across survey sourcesWeighting market data across survey sources
Complete data analysesComplete data analyses
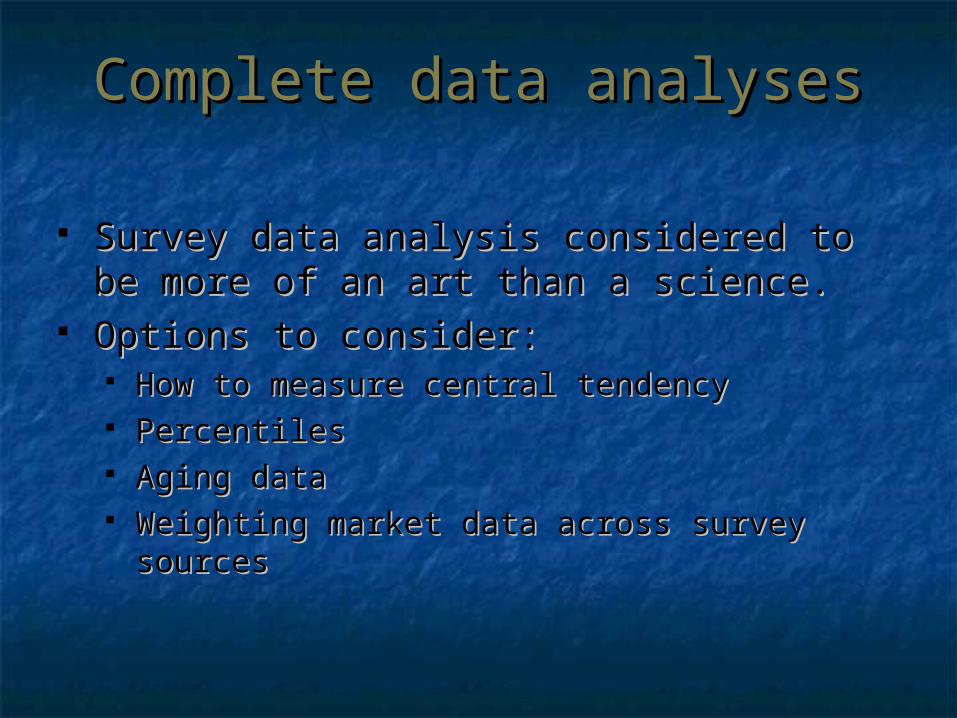
Survey data analysis considered to be Survey data analysis considered to be more of an art than a science.more of an art than a science.
Options to consider:Options to consider: How to measure central tendencyHow to measure central tendency PercentilesPercentiles Aging dataAging data Weighting market data across survey sourcesWeighting market data across survey sources
Common Measures of Common Measures of Central TendencyCentral Tendency
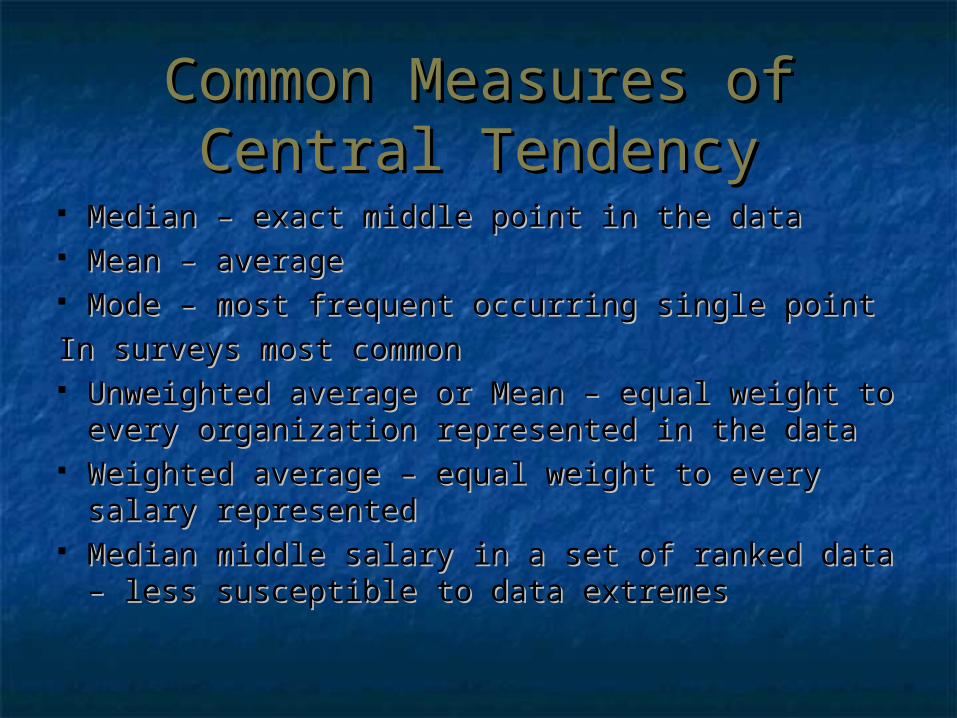
Median – exact middle point in the dataMedian – exact middle point in the data Mean – averageMean – average Mode – most frequent occurring single point Mode – most frequent occurring single point
In surveys most commonIn surveys most common Unweighted average or Mean – equal weight to Unweighted average or Mean – equal weight to
every organization represented in the dataevery organization represented in the data Weighted average – equal weight to every salary Weighted average – equal weight to every salary
representedrepresented Median middle salary in a set of ranked data – less Median middle salary in a set of ranked data – less
susceptible to data extremessusceptible to data extremes
PercentilesPercentiles
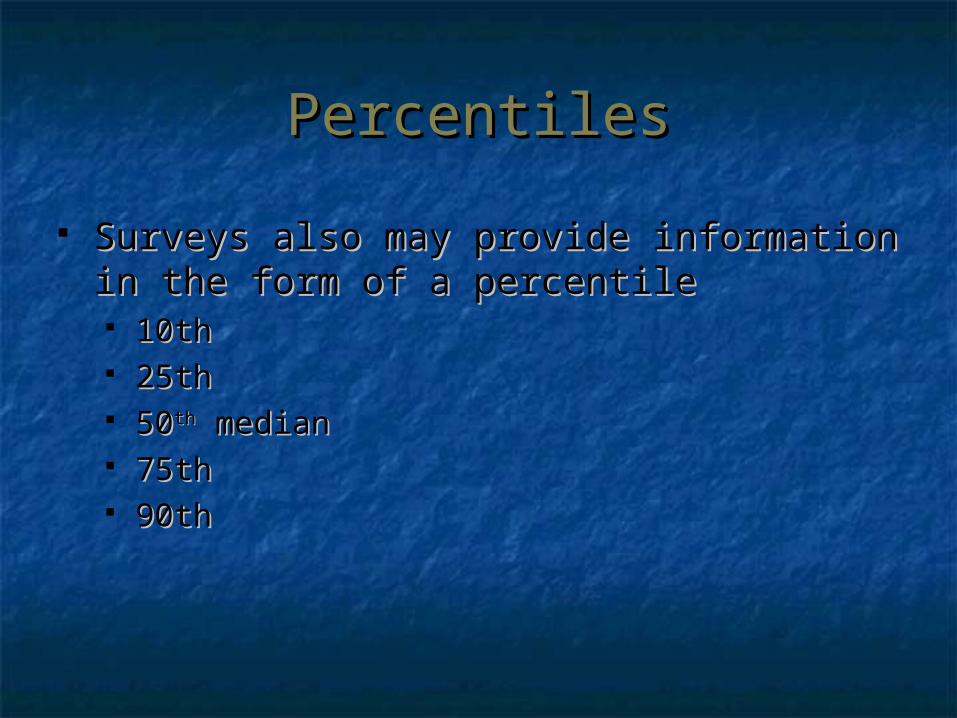
Surveys also may provide information in Surveys also may provide information in the form of a percentilethe form of a percentile
10th10th 25th25th 5050thth median median 75th75th 90th90th
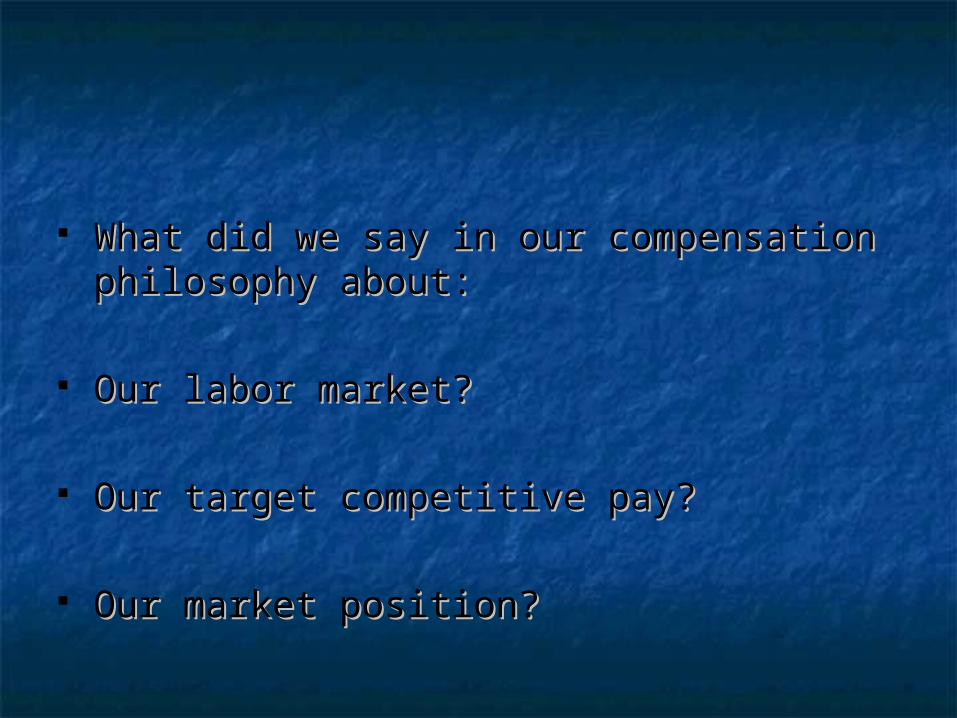
What did we say in our compensation What did we say in our compensation philosophy about:philosophy about:
Our labor market?Our labor market?
Our target competitive pay?Our target competitive pay?
Our market position?Our market position?
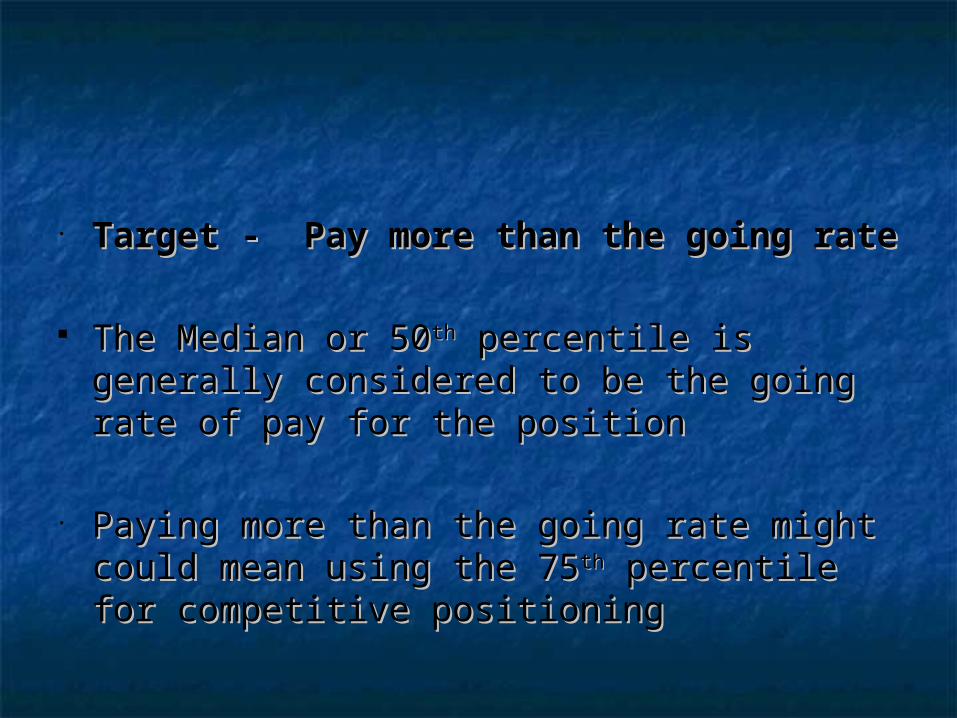
• Target - Pay more than the going rateTarget - Pay more than the going rate
The Median or 50The Median or 50thth percentile is generally percentile is generally considered to be the going rate of pay for considered to be the going rate of pay for the positionthe position
• Paying more than the going rate might could Paying more than the going rate might could mean using the 75mean using the 75thth percentile for percentile for competitive positioningcompetitive positioning
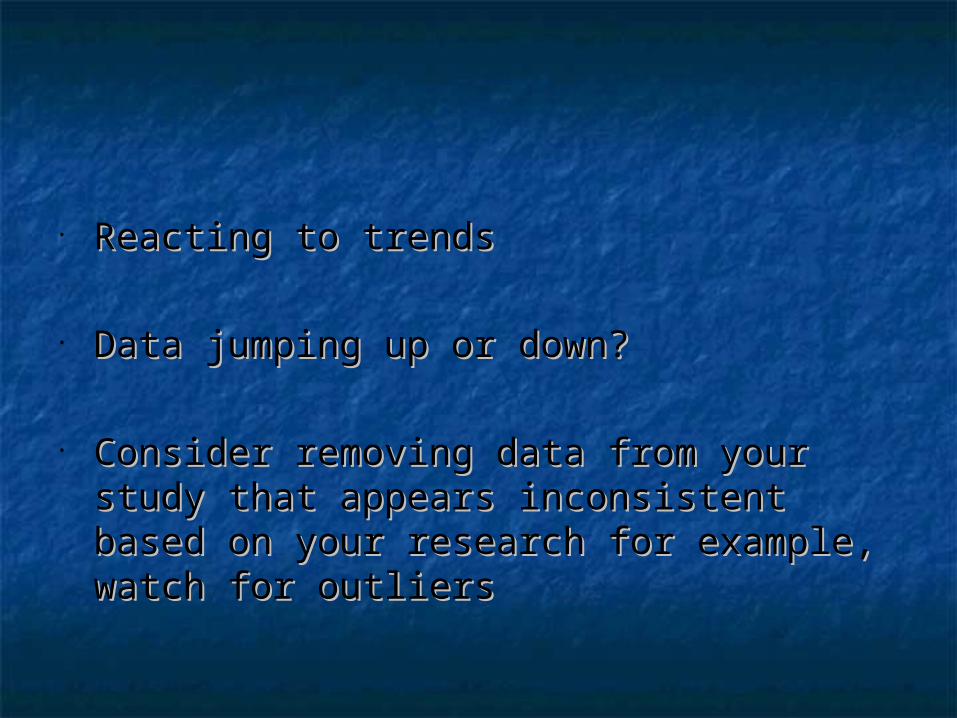
• Reacting to trendsReacting to trends
• Data jumping up or down?Data jumping up or down?
• Consider removing data from your study Consider removing data from your study that appears inconsistent based on your that appears inconsistent based on your research for example, watch for outliersresearch for example, watch for outliers
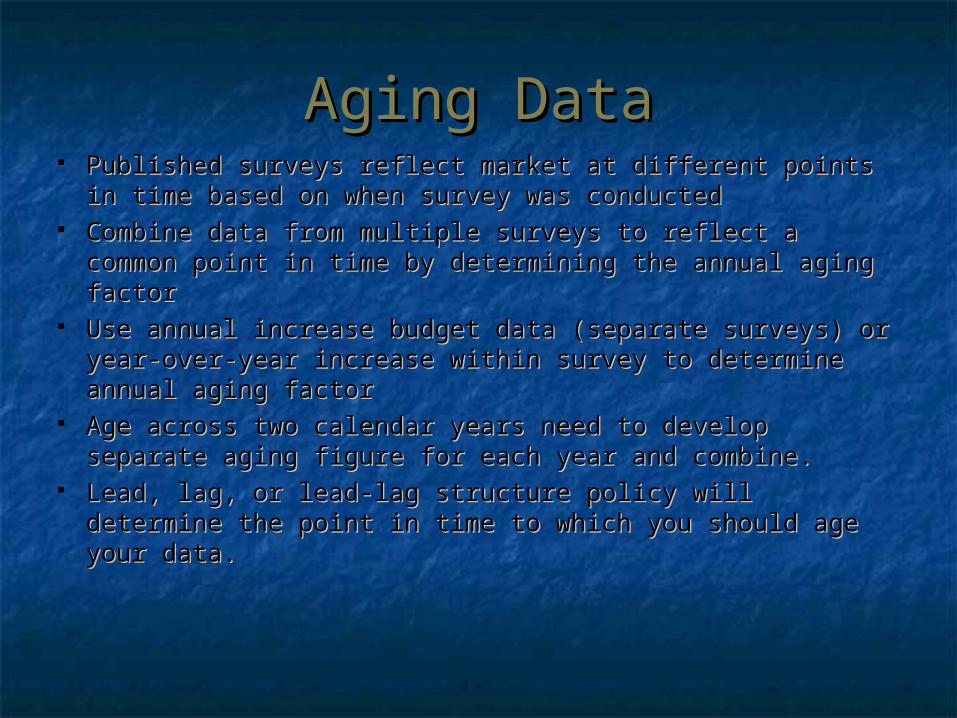
Aging DataAging Data Published surveys reflect market at different points in Published surveys reflect market at different points in
time based on when survey was conductedtime based on when survey was conducted Combine data from multiple surveys to reflect a common Combine data from multiple surveys to reflect a common
point in time by determining the annual aging factorpoint in time by determining the annual aging factor Use annual increase budget data (separate surveys) or Use annual increase budget data (separate surveys) or
year-over-year increase within survey to determine year-over-year increase within survey to determine annual aging factorannual aging factor
Age across two calendar years need to develop separate Age across two calendar years need to develop separate aging figure for each year and combine.aging figure for each year and combine.
Lead, lag, or lead-lag structure policy will determine the Lead, lag, or lead-lag structure policy will determine the point in time to which you should age your data. point in time to which you should age your data.
Aging Survey DataAging Survey Data
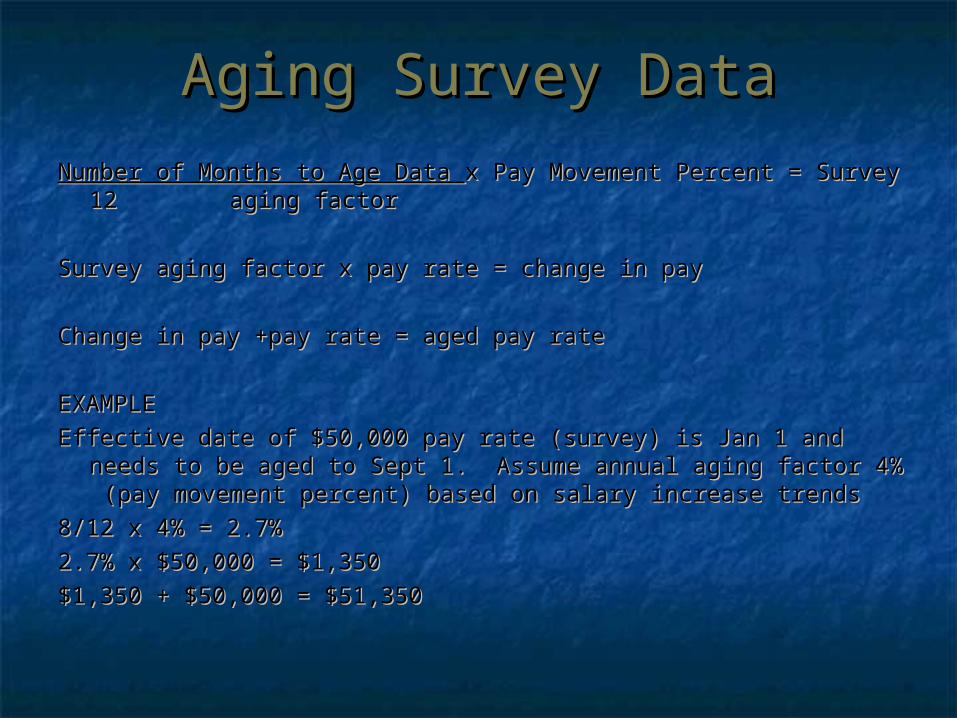
Number of Months to Age Data Number of Months to Age Data x Pay Movement Percent = Survey x Pay Movement Percent = Survey 1212 aging factor aging factor
Survey aging factor x pay rate = change in paySurvey aging factor x pay rate = change in pay
Change in pay +pay rate = aged pay rateChange in pay +pay rate = aged pay rate
EXAMPLEEXAMPLE
Effective date of $50,000 pay rate (survey) is Jan 1 and needs to be Effective date of $50,000 pay rate (survey) is Jan 1 and needs to be aged to Sept 1. Assume annual aging factor 4% (pay movement aged to Sept 1. Assume annual aging factor 4% (pay movement percent) based on salary increase trendspercent) based on salary increase trends
8/12 x 4% = 2.7%8/12 x 4% = 2.7%
2.7% x $50,000 = $1,3502.7% x $50,000 = $1,350
$1,350 + $50,000 = $51,350$1,350 + $50,000 = $51,350
Weighting Data Across Weighting Data Across Survey SourcesSurvey Sources
What do you do with multiple survey sources or What do you do with multiple survey sources or data points?data points?
• Take the average of the data points for each Take the average of the data points for each jobjob
• Weight surveys/data differently based on your Weight surveys/data differently based on your compensation strategycompensation strategy
• Weight surveys/data differently based on the Weight surveys/data differently based on the quality of the survey/dataquality of the survey/data
• Weight surveys/data differently based on the Weight surveys/data differently based on the job matchjob match

Weighting Data Across Weighting Data Across Survey SourcesSurvey Sources
Three surveys for the same position may Three surveys for the same position may decide:decide:
to average the 3 medians for salary amountto average the 3 medians for salary amount to weight one survey’s median 60% and other to weight one survey’s median 60% and other
2 surveys 20% each since one survey 2 surveys 20% each since one survey contained more of competitors or had better contained more of competitors or had better job matches or ….job matches or ….

Collecting and Analyzing Collecting and Analyzing Labor-Market DataLabor-Market Data
Select benchmark jobsSelect benchmark jobs Serves as internal anchor for non-benchmark jobsServes as internal anchor for non-benchmark jobs
Decide on survey source(s)Decide on survey source(s) Published survey versus conduct ownPublished survey versus conduct own Know the marketKnow the market
Gather Valid data Gather Valid data Match jobs in surveyMatch jobs in survey
Complete data analysesComplete data analyses Aging data to common point in timeAging data to common point in time Weighting market data across survey sourcesWeighting market data across survey sources

Salary Ranges/BandsSalary Ranges/Bands Some BasicsSome Basics
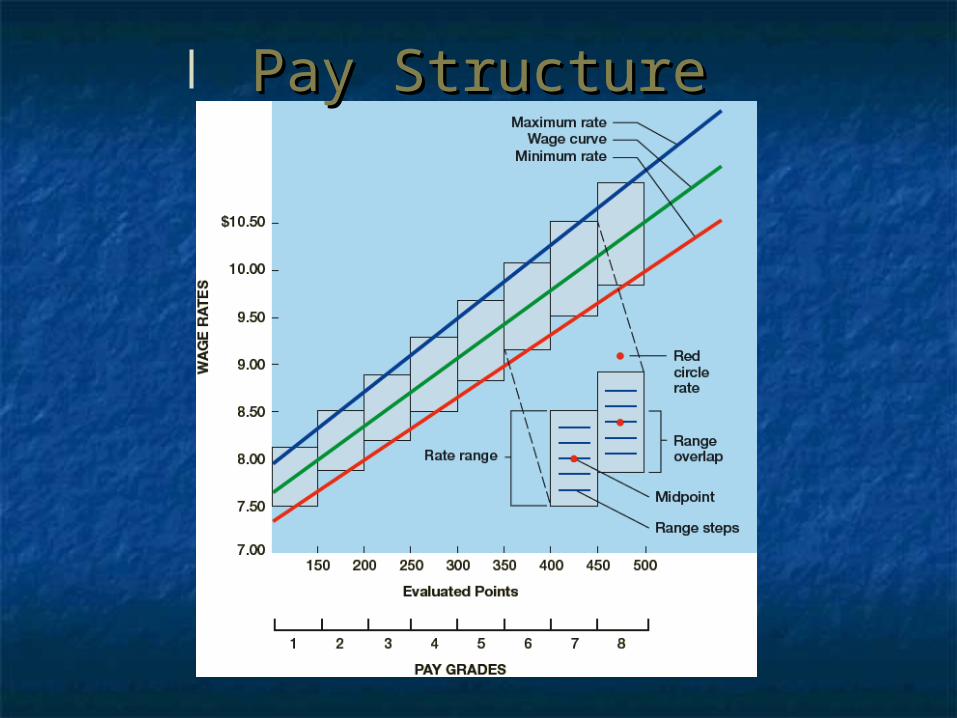
Salary ranges have a minimum, midpoint, and Salary ranges have a minimum, midpoint, and maximum (some companies use quartiles or thirds)maximum (some companies use quartiles or thirds)
Difference between minimum and the maximum is Difference between minimum and the maximum is the “spread”the “spread”
Minimum often reflects starting salaryMinimum often reflects starting salary Reviewed and updated annuallyReviewed and updated annually Typically midpoint is geared to the marketTypically midpoint is geared to the market Employees above maximum “overpaid”, below Employees above maximum “overpaid”, below
minimum “underpaid”minimum “underpaid” Decide on Ranges versus Bands (broader)Decide on Ranges versus Bands (broader)
Pay StructurePay Structure
Calculating RangesCalculating Ranges
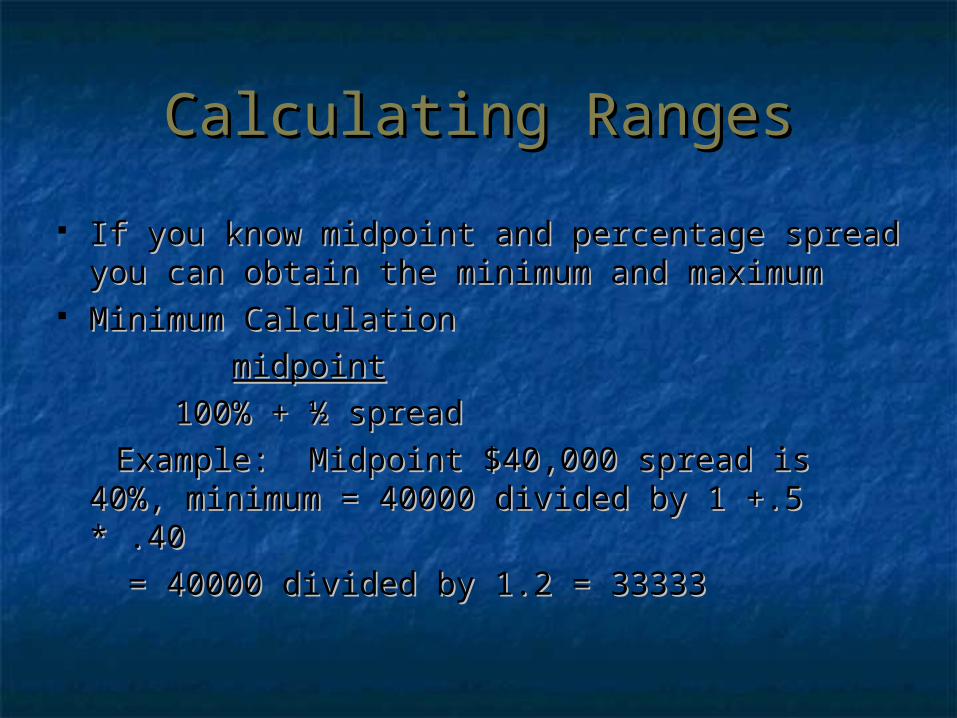
If you know midpoint and percentage spread If you know midpoint and percentage spread you can obtain the minimum and maximumyou can obtain the minimum and maximum
Minimum CalculationMinimum Calculation
midpointmidpoint
100% + ½ spread100% + ½ spread
Example: Midpoint $40,000 spread is 40%, Example: Midpoint $40,000 spread is 40%, minimum = 40000 divided by 1 +.5 * .40 minimum = 40000 divided by 1 +.5 * .40
= 40000 divided by 1.2 = 33333 = 40000 divided by 1.2 = 33333
Calculating RangesCalculating Ranges
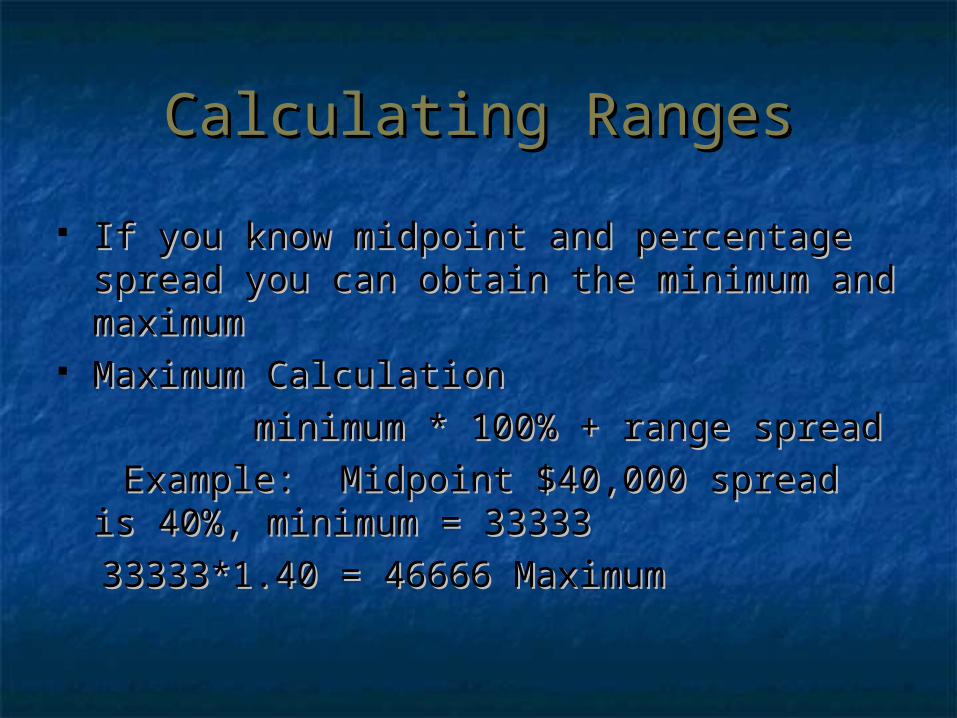
If you know midpoint and percentage If you know midpoint and percentage spread you can obtain the minimum and spread you can obtain the minimum and maximummaximum
Maximum CalculationMaximum Calculation
minimum * 100% + range spreadminimum * 100% + range spread
Example: Midpoint $40,000 spread is Example: Midpoint $40,000 spread is 40%, minimum = 33333 40%, minimum = 33333
33333*1.40 = 46666 Maximum33333*1.40 = 46666 Maximum
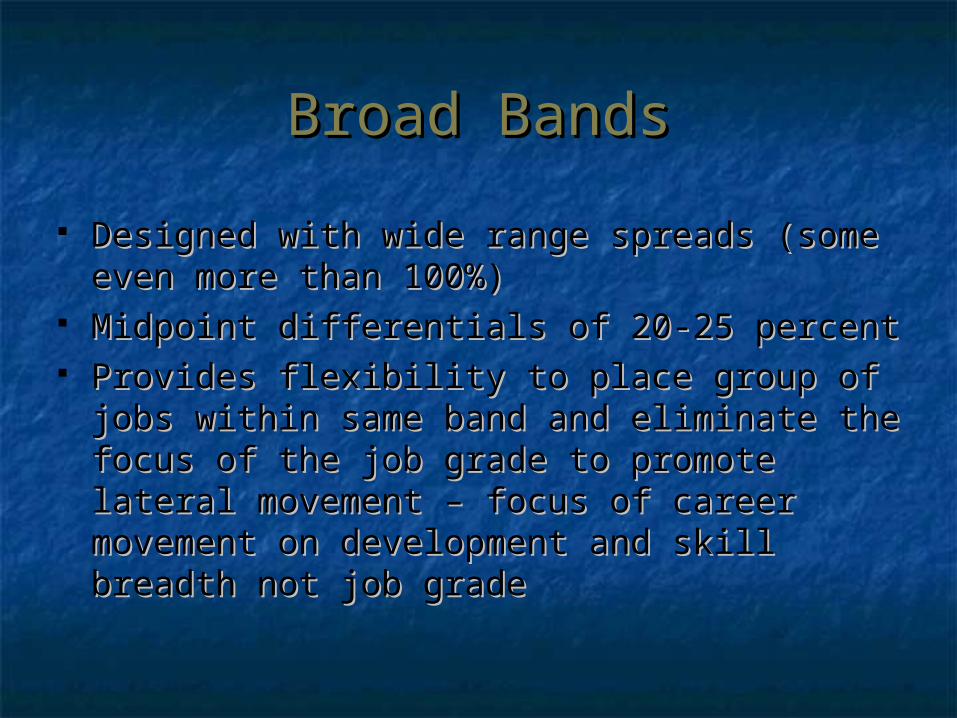
Broad BandsBroad Bands
Designed with wide range spreads (some Designed with wide range spreads (some even more than 100%)even more than 100%)
Midpoint differentials of 20-25 percentMidpoint differentials of 20-25 percent Provides flexibility to place group of jobs Provides flexibility to place group of jobs
within same band and eliminate the focus within same band and eliminate the focus of the job grade to promote lateral of the job grade to promote lateral movement – focus of career movement on movement – focus of career movement on development and skill breadth not job development and skill breadth not job gradegrade
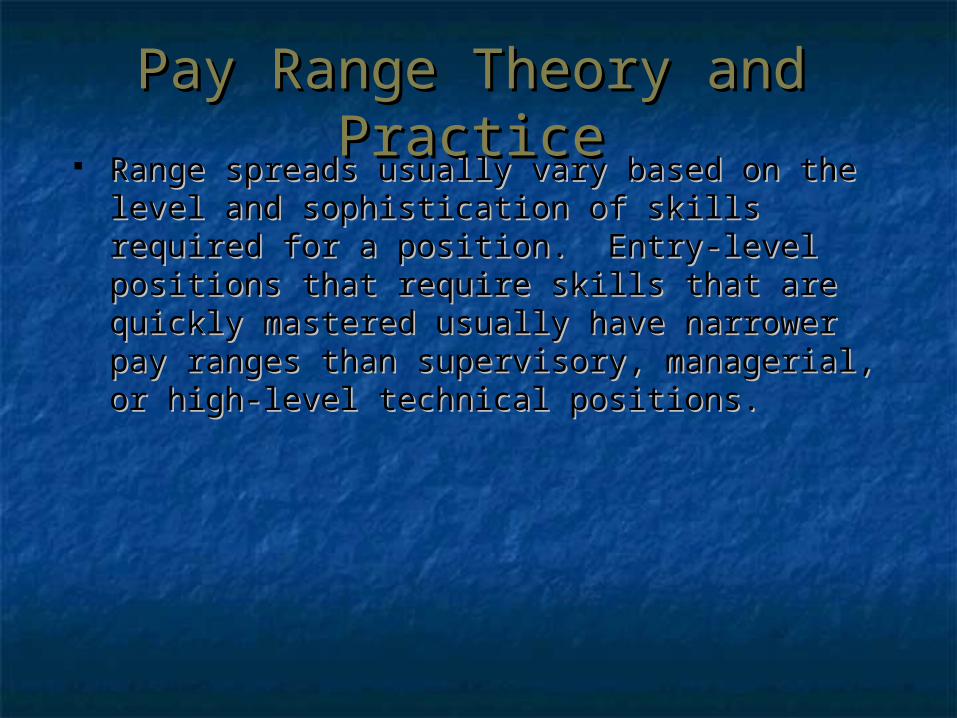
Pay Range Theory and PracticePay Range Theory and Practice Range spreads usually vary based on the level and Range spreads usually vary based on the level and
sophistication of skills required for a position. Entry-sophistication of skills required for a position. Entry-level positions that require skills that are quickly level positions that require skills that are quickly mastered usually have narrower pay ranges than mastered usually have narrower pay ranges than supervisory, managerial, or high-level technical supervisory, managerial, or high-level technical positions. positions.
• Pay rates are set – they are aligned with Pay rates are set – they are aligned with the compensation philosophy……so now the compensation philosophy……so now what?what?
• Compare incumbent pay to the market Compare incumbent pay to the market data and analyze need to adjust paydata and analyze need to adjust pay
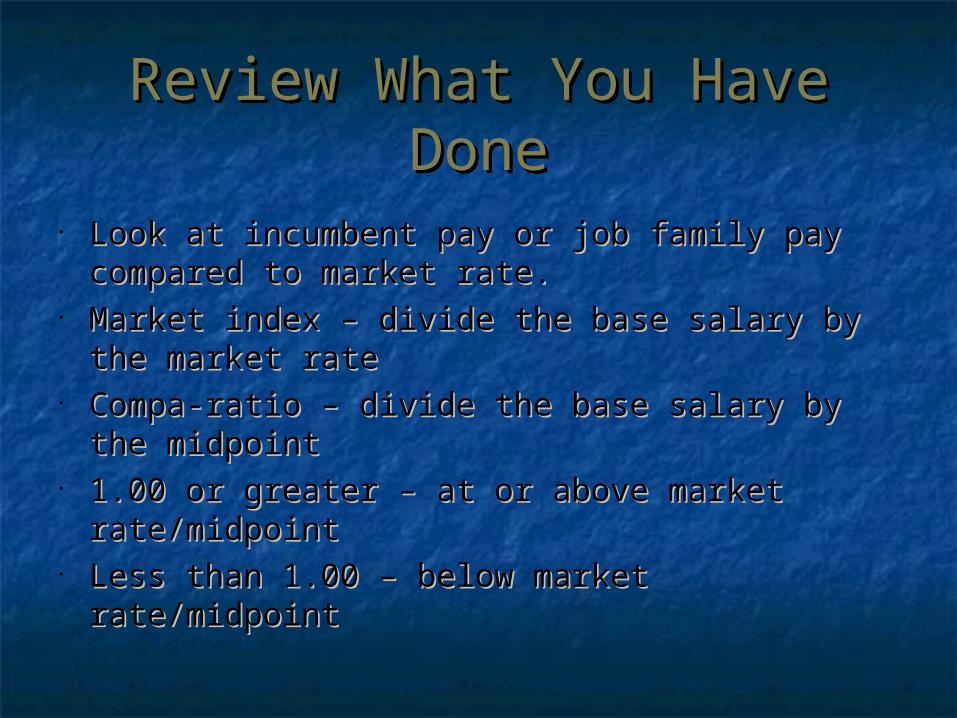
Review What You Have Review What You Have DoneDone
• Look at incumbent pay or job family pay Look at incumbent pay or job family pay compared to market rate.compared to market rate.
• Market index – divide the base salary by the Market index – divide the base salary by the market ratemarket rate
• Compa-ratio – divide the base salary by the Compa-ratio – divide the base salary by the midpointmidpoint
• 1.00 or greater – at or above market 1.00 or greater – at or above market rate/midpointrate/midpoint
• Less than 1.00 – below market rate/midpointLess than 1.00 – below market rate/midpoint
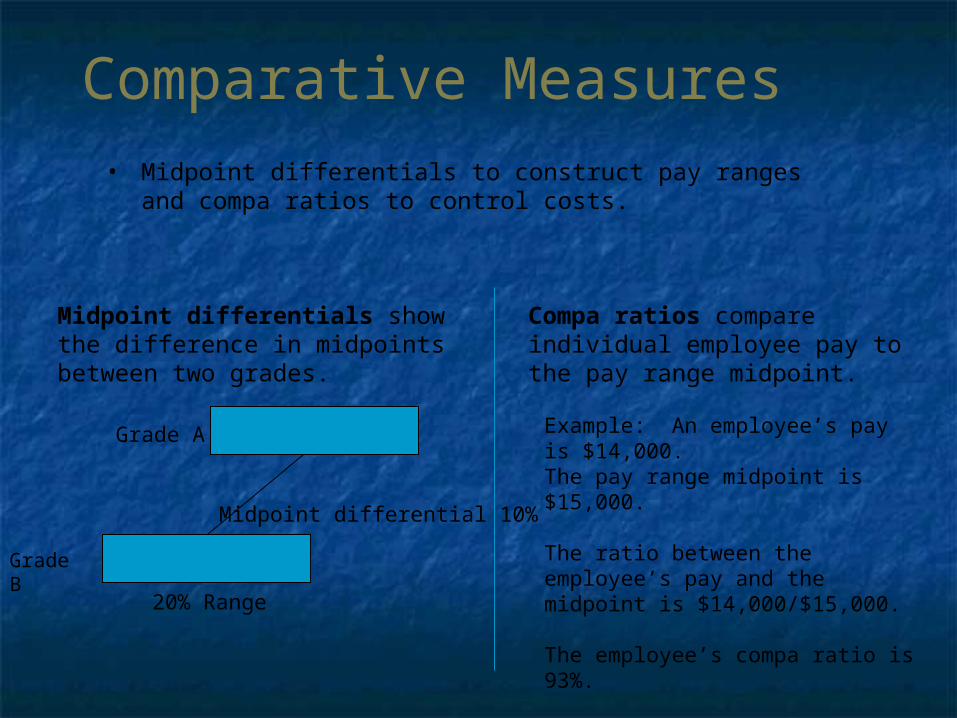
Comparative Measures
Midpoint differentials show the difference in midpoints between two grades.
Midpoint differential 10%
20% Range
Grade A
Grade B
Compa ratios compare individual employee pay to the pay range midpoint.
Example: An employee’s pay is $14,000.The pay range midpoint is $15,000.
The ratio between the employee’s pay and the midpoint is $14,000/$15,000.
The employee’s compa ratio is 93%.
• Midpoint differentials to construct pay ranges and compa ratios to control costs.
Things to consider if it appears you are Things to consider if it appears you are over/underpaying:over/underpaying:
• Match to marketMatch to market• Skill/performanceSkill/performance• Accuracy of survey dataAccuracy of survey data• Labor market conditionsLabor market conditions• Plan to correct issues over timePlan to correct issues over time
Educating staff:Educating staff:
• Communicate, communicate, Communicate, communicate, communicatecommunicate
• TransparencyTransparency
• Support the “right” decisionsSupport the “right” decisions
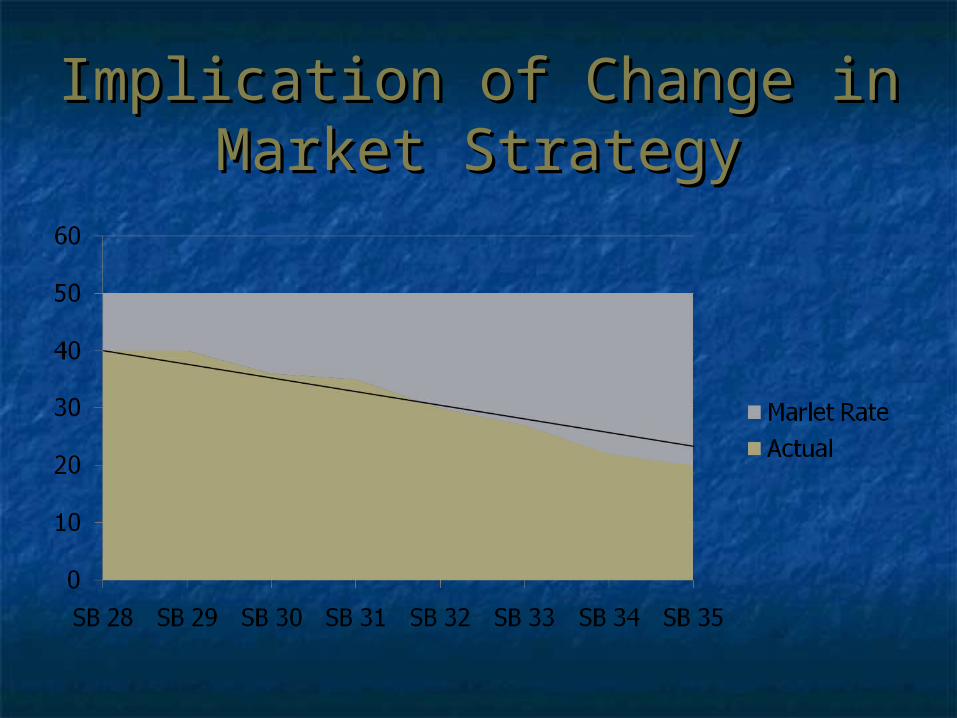
Implication of Change in Implication of Change in Market StrategyMarket Strategy
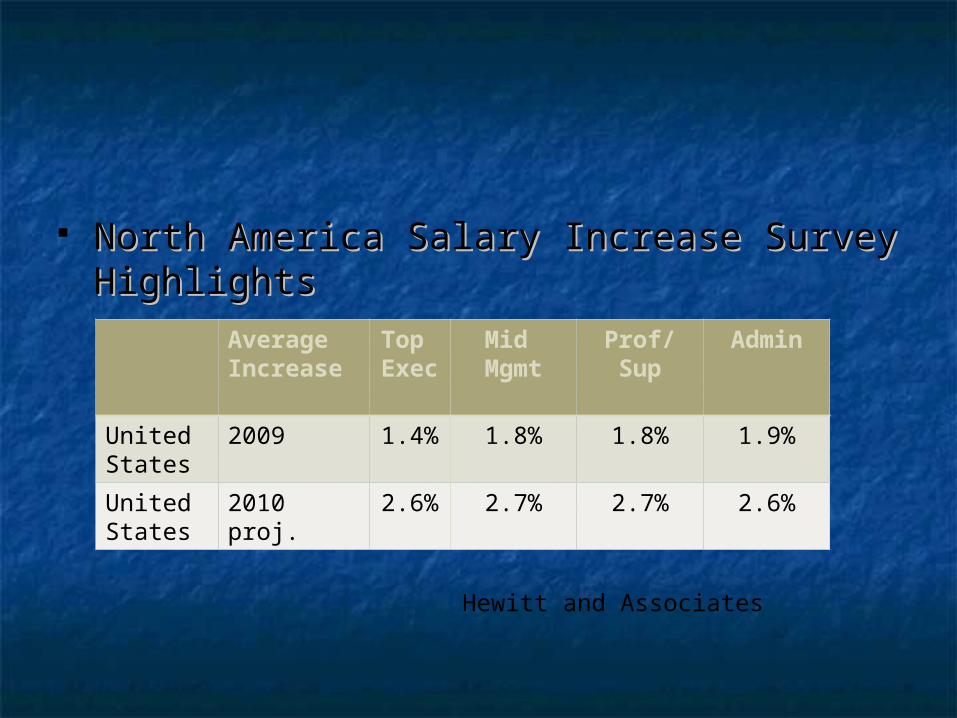
North America Salary Increase Survey North America Salary Increase Survey HighlightsHighlights
Average Increase
Top Exe
c
Mid Mgmt
Prof/Sup
Admin
United States
2009 1.4% 1.8% 1.8% 1.9%
United States
2010 proj. 2.6% 2.7% 2.7% 2.6%
Hewitt and Associates