market outlook - sbi funds outlook_july 2017.pdf · indian stock market snapshot: june 2017 ....
TRANSCRIPT

Market Outlook
July 2017

EQUITY MARKET
Global equity market snapshot: June 2017
Source: Bloomberg, SBIMF Research
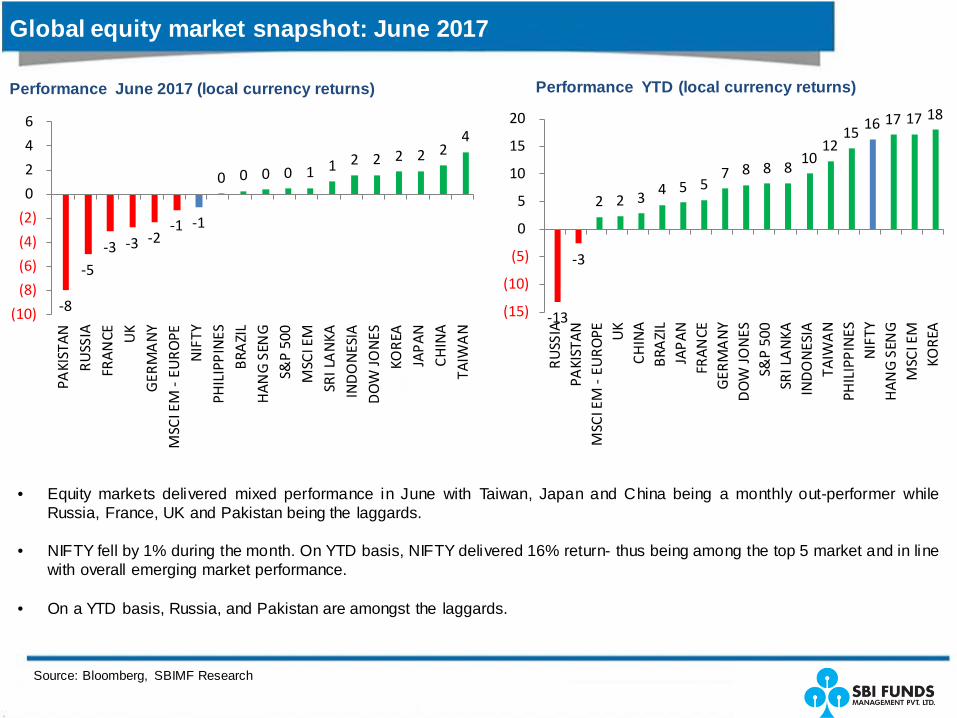
• Equity markets delivered mixed performance in June with Taiwan, Japan and China being a monthly out-performer while Russia, France, UK and Pakistan being the laggards.
• NIFTY fell by 1% during the month. On YTD basis, NIFTY delivered 16% return- thus being among the top 5 market and in line with overall emerging market performance.
• On a YTD basis, Russia, and Pakistan are amongst the laggards.
Performance June 2017 (local currency returns) Performance YTD (local currency returns)
-8
-5 -3 -3 -2
-1 -1
0 0 0 0 1 1 2 2 2 2 2 4
(10)
(8)
(6)
(4)
(2)
0
2
4
6
PAKI
STAN
RUSS
IAFR
ANCE U
KG
ERM
AN
YM
SCI E
M -
EURO
PEN
IFTY
PHIL
IPPI
NES
BRA
ZIL
HAN
G S
ENG
S&P
500
MSC
I EM
SRI L
AN
KAIN
DO
NES
IAD
OW
JON
ESKO
REA
JAPA
NCH
INA
TAIW
AN
-13
-3
2 2 3 4 5 5 7 8 8 8
10 12
15 16 17 17 18
(15)
(10)
(5)
0
5
10
15
20
RUSS
IAPA
KIST
ANM
SCI E
M -
EURO
PE UK
CHIN
ABR
AZI
LJA
PAN
FRAN
CEG
ERM
AN
YD
OW
JON
ESS&
P 50
0SR
I LA
NKA
IND
ON
ESIA
TAIW
AN
PHIL
IPPI
NES
NIF
TYH
ANG
SEN
GM
SCI E
MKO
REA

Indian stock market snapshot: June 2017
Performance in June 2017
Source: Bloomberg, SBIMF Research
• Nifty and Sensex are down by 1% each in June. Performance down the capitalization curve was mildly positive with Mid Cap and Small Cap Index rising 0.1% and 2% respectively.
• Sector-wise: Real Estate and Pharma outshined during the month, while Oil& Gas, PSU and IT under-performed.
• YTD, Nifty and Sensex are up by 16% each. Sector-wise performance has been positive across all sectors on a YTD basis (barring Pharma and IT). Real estate has out-performed significantly (up 62%.)
Performance YTD
-7 -7
-4 -3 -3
-1 -1 -1 -1 0
0 1
2 3
5 6
(8)
(6)
(4)
(2)
0
2
4
6
8
OIL
& G
AS
PSU IT
AUTO
CAP
GO
OD
S
NIF
TY
BAN
KEX
BSE
100
SEN
SEX
BSE
500
MID
CAP
MET
ALS
SMAL
L CA
P
FMCG
PHAR
MA
REAL
EST
ATE
-4 -3
5 9
13 16 16 16 17 19 22
25 27 28 28
62
(10)
0
10
20
30
40
50
60
70
PHAR
MA IT
PSU
OIL
& G
AS
MET
ALS
AUTO
SEN
SEX
NIF
TY
BSE
100
BSE
500
MID
CAP
CAP
GO
OD
S
BAN
KEX
SMAL
L CA
P
FMCG
REAL
EST
ATE
Source: CMIE, SBIMF Research,
Growth: Strong Agriculture and Services but weakness in Industry
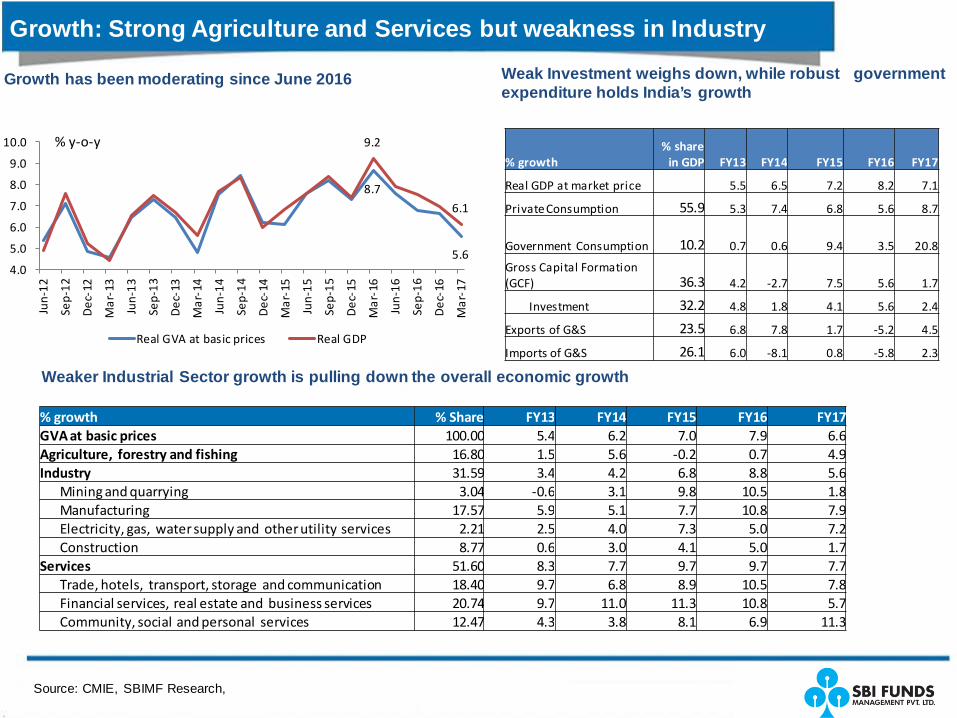
Growth has been moderating since June 2016
Weaker Industrial Sector growth is pulling down the overall economic growth
8.7
5.6
9.2
6.1
4.0
5.0
6.0
7.0
8.0
9.0
10.0
Jun-
12
Sep-
12
Dec
-12
Mar
-13
Jun-
13
Sep-
13
Dec
-13
Mar
-14
Jun-
14
Sep-
14
Dec
-14
Mar
-15
Jun-
15
Sep-
15
Dec
-15
Mar
-16
Jun-
16
Sep-
16
Dec
-16
Mar
-17
Real GVA at basic prices Real GDP
% y-o-y
% growth % Share FY13 FY14 FY15 FY16 FY17 GVA at basic prices 100.00 5.4 6.2 7.0 7.9 6.6 Agriculture, forestry and fishing 16.80 1.5 5.6 -0.2 0.7 4.9 Industry 31.59 3.4 4.2 6.8 8.8 5.6 Mining and quarrying 3.04 -0.6 3.1 9.8 10.5 1.8 Manufacturing 17.57 5.9 5.1 7.7 10.8 7.9 Electricity, gas, water supply and other utility services 2.21 2.5 4.0 7.3 5.0 7.2 Construction 8.77 0.6 3.0 4.1 5.0 1.7 Services 51.60 8.3 7.7 9.7 9.7 7.7 Trade, hotels, transport, storage and communication 18.40 9.7 6.8 8.9 10.5 7.8 Financial services, real estate and business services 20.74 9.7 11.0 11.3 10.8 5.7 Community, social and personal services 12.47 4.3 3.8 8.1 6.9 11.3
% growth % share
in GDP FY13 FY14 FY15 FY16 FY17
Real GDP at market price 5.5 6.5 7.2 8.2 7.1
Private Consumption 55.9 5.3 7.4 6.8 5.6 8.7
Government Consumption 10.2 0.7 0.6 9.4 3.5 20.8
Gross Capital Formation (GCF) 36.3 4.2 -2.7 7.5 5.6 1.7
Investment 32.2 4.8 1.8 4.1 5.6 2.4
Exports of G&S 23.5 6.8 7.8 1.7 -5.2 4.5
Imports of G&S 26.1 6.0 -8.1 0.8 -5.8 2.3
Weak Investment weighs down, while robust government expenditure holds India’s growth

Source: CMIE, pib.nic.in, SBIMF Research,
Agriculture: Sowing data paints favourable prospects
Agriculture production (mn tonnes) Foodgrains Oilseeds Sugar Cane Horticulture FY06 209 28 281 183 FY07 217 24 356 192 FY08 231 30 348 211 FY09 234 28 285 215 FY10 218 25 292 223 FY11 244 32 342 241 FY12 259 30 361 257 FY13 257 31 341 269 FY14 265 32 352 277 FY15 252 27 362 278 FY16 (final estimate) 252 22 348 286 FY17 (3rd estimate) 273 33 306 287 % CAGR between FY06 to FY16 1.9 -2.3 2.2 4.6 % growth in FY16 -0.2 -16.6 -3.8 3.0 % growth in FY17 8.7 46.2 -12.2 0.5
FY17 Food grains and oilseeds showed a record production growth of 8.7% and 46% respectively. Horticulture was flat while Sugarcane production fell
Continued improvement in FY18 sowing (+9% period to Date) bodes well for Agricultural output , but…
Crop Sowing (in lakh hectare) as of 7th July Area sown in FY18 Area sown in FY17 Rice 79.8 75.3 Pulses 44.1 35.9 Coarse Cereals 80.8 70.1 Oilseeds 72.9 69.7 Sugarcane 47.9 45.2 Jute & Mesta 7.0 7.3 Cotton 71.8 67.9 Total 404.3 371.4
…falling food prices somewhat dents the rise in agricultural income
-2 -5
0
5
10
15
20
May
-13
Aug
-13
Nov
-13
Feb-
14
May
-14
Aug
-14
Nov
-14
Feb-
15
May
-15
Aug
-15
Nov
-15
Feb-
16
May
-16
Aug
-16
Nov
-16
Feb-
17
May
-17
WPI: Food (% y-o-y)

Source: CMIE, SBIMF Research,
Rural Demand to pick-up
Rural wages are gradually rising
• Rural demand had weakened owing to unfavourable weather conditions in FY15 and FY16 leading to the pile-up in agri-debt, fall in rural wages and falling construction activities.
• Situation seems to be turning at the margin. Agricultural income improved in FY17 due to increased agricultural output. For FY18 as well, the outlook on monsoon and sowing is favourable.
• Construction activities are also improving due to pick-up in rural road projects, irrigation projects and Increased execution of housing for all under PMAY- Gramin.
• Government has also increased its allocation to MGNREGA this year
• Farm loan waiver has gained traction. So far loan waivers up to 1% of GDP has already been announced. It is an unfavourable development from the overall macro perspective as it spoils the credit culture, can be inflationary and puts pressure on the government deficit. However, from rural perspective it alleviates some of the debt concerns in the rural area and frees up the income for consumption spending, albeit with a lag.
6.1
6.9
3.03.54.04.55.05.56.06.57.07.5
Non-agricultural occupations : Contruction workers (% y-o-y)
Rural wages (% y-o-y)
Higher allocation under MGNREGA by government
335 358
292 303 330 325
373
445 480
-25.0-20.0-15.0-10.0-5.00.05.010.015.020.025.0
-
100
200
300
400
500
600
FY10 FY11 FY12 FY13 FY14 FY15 FY16 FY17RE FY18BE
MGNREGA Spend (Rs. Billion) % y-o-y- RHS

Source: CMIE, SBIMF Research, NB: * AP and Telangana started their waiver program in 2014- spread over 4 years
Farm Loan waiver
• The timing of the 2008 loan waiver was commensurate with many other measures by the government such as implementation of 6th Pay commission, launching of MGNREGA scheme, tax incentives, double digit growth in MSP. At the same time, food prices were rising exponentially, implementation of MGNREGA had led to a double digit growth in rural wages. All this together led to nearly 40% rise in average monthly expenditure of rural households. In this round, while we do expect some consumption stimulus in the rural economy from the loan waiver and many other on-going developments (road construction, PMAY-G, higher devolvement under MGNREGA, increased food production), we do not expect the consumption boost of a similar scale this time as most of the other fire-powers are missing (muted MSP hikes, modest growth in rural wages, weak food prices).
2008 Farm Loan Waiver 2017 Farm Loan Waiver
Implementing body
Central government at Pan India level 7 States so far (UP, Maharashtra, Punjab, Karnataka, Tamil Nadu, AP*, Telangana*)
Announcement Period
Feb 2008 AP, Telangana- 2014; UP- April 2017; Tamil Nadu- January 2017; Maharashtra, Punjab, Karnataka- June 2017
Completion Period
Dec 2010 AP and Telangana has commenced paying the banks, rest of the states yet to commence
Amount Involved Announcement of: Rs. 717 billion (1.6% GDP, 8.3% Agri GDP) Actual disbursement: Rs. 525 billion (1.2% GDP, 6.1% Agri GDP)
Announcement: Rs. 1,380 billion (1% of GDP, 5% of Agri GDP) Actual disbursement: To be seen
No. of Beneficiaries
~37 million (26% of total farmer families in India) ~ 40 million (expected, but restricted to farmers of the 7 states)
Average / farmer ~Rs. 14,000 Rs. 34,000 (expected)
Impact: • Additional fiscal burden of 1.2% spread over FY09 to FY11,
• Loan waiver along with other developments led to ~40% increase in agriculture families’ consumption expenditure (impact most pronounced in jewellery and consumer durable spending)
• No impact on bank Agriculture loan growth
• Expect State Fiscal deficit to be impacted by 50 bps over FY18 and FY19 (over and above the accounted) accompanied with 70bps decrease in FY17 capital expenditure (vs. budgeted)
• Marginal increase in consumption expenditure • Initial signs of weakness Agriculture credit growth seen
Source: CMIE, SBIMF Research,
Industrial sector weak due to low capital & durable goods demand
-1
1
3
5
7
9
11
Jan-
11
May
-11
Sep-
11
Jan-
12
May
-12
Sep-
12
Jan-
13
May
-13
Sep-
13
Jan-
14
May
-14
Sep-
14
Jan-
15
May
-15
Sep-
15
Jan-
16
May
-16
Sep-
16
Jan-
17
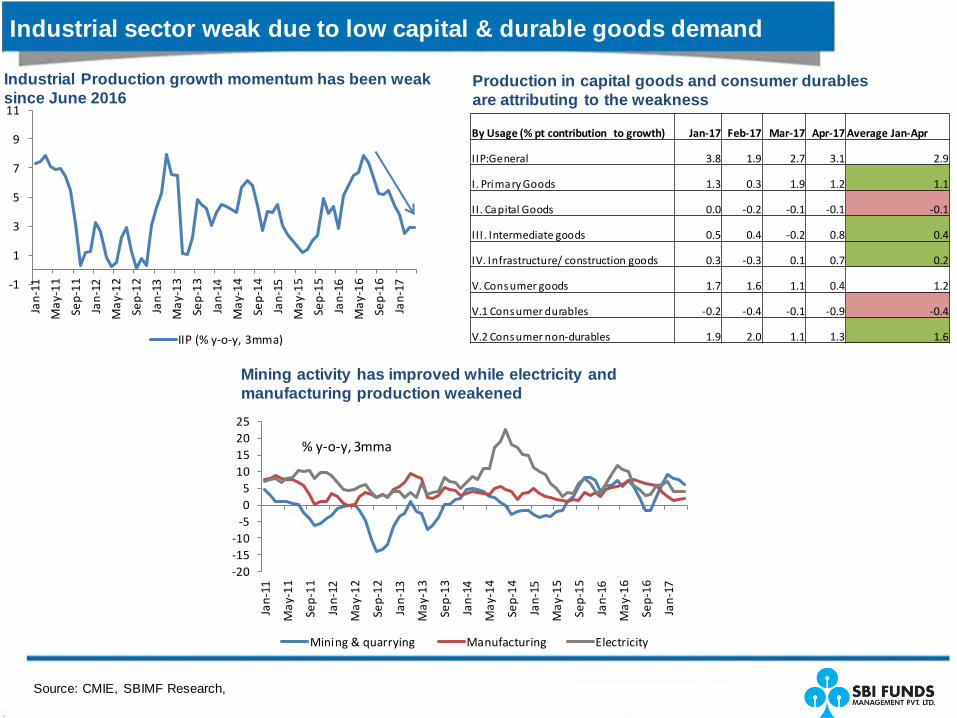
IIP (% y-o-y, 3mma)
By Usage (% pt contribution to growth) Jan-17 Feb-17 Mar-17 Apr-17 Average Jan-Apr
I IP:General 3.8 1.9 2.7 3.1 2.9
I . Primary Goods 1.3 0.3 1.9 1.2 1.1
I I . Capital Goods 0.0 -0.2 -0.1 -0.1 -0.1
I I I . Intermediate goods 0.5 0.4 -0.2 0.8 0.4
IV. Infrastructure/ construction goods 0.3 -0.3 0.1 0.7 0.2
V. Consumer goods 1.7 1.6 1.1 0.4 1.2
V.1 Consumer durables -0.2 -0.4 -0.1 -0.9 -0.4
V.2 Consumer non-durables 1.9 2.0 1.1 1.3 1.6
Industrial Production growth momentum has been weak since June 2016
Production in capital goods and consumer durables are attributing to the weakness
-20-15-10
-505
10152025
Jan-
11
May
-11
Sep-
11
Jan-
12
May
-12
Sep-
12
Jan-
13
May
-13
Sep-
13
Jan-
14
May
-14
Sep-
14
Jan-
15
May
-15
Sep-
15
Jan-
16
May
-16
Sep-
16
Jan-
17
Mining & quarrying Manufacturing Electricity
% y-o-y, 3mma
Mining activity has improved while electricity and manufacturing production weakened
Source: CMIE, SBIMF Research,
Investment: New investment decision lacks steam
0
5,000
10,000
15,000
20,000
25,000
Sep-
01M
ar-0
2Se
p-02
Mar
-03
Sep-
03M
ar-0
4Se
p-04
Mar
-05
Sep-
05M
ar-0
6Se
p-06
Mar
-07
Sep-
07M
ar-0
8Se
p-08
Mar
-09
Sep-
09M
ar-1
0Se
p-10
Mar
-11
Sep-
11M
ar-1
2Se
p-12
Mar
-13
Sep-
13M
ar-1
4Se
p-14
Mar
-15
Sep-
15M
ar-1
6Se
p-16
Mar
-17
Private Sector: New Investment Projects
Government: New Investment Projects
4Q rolling sum; Rs. Billion
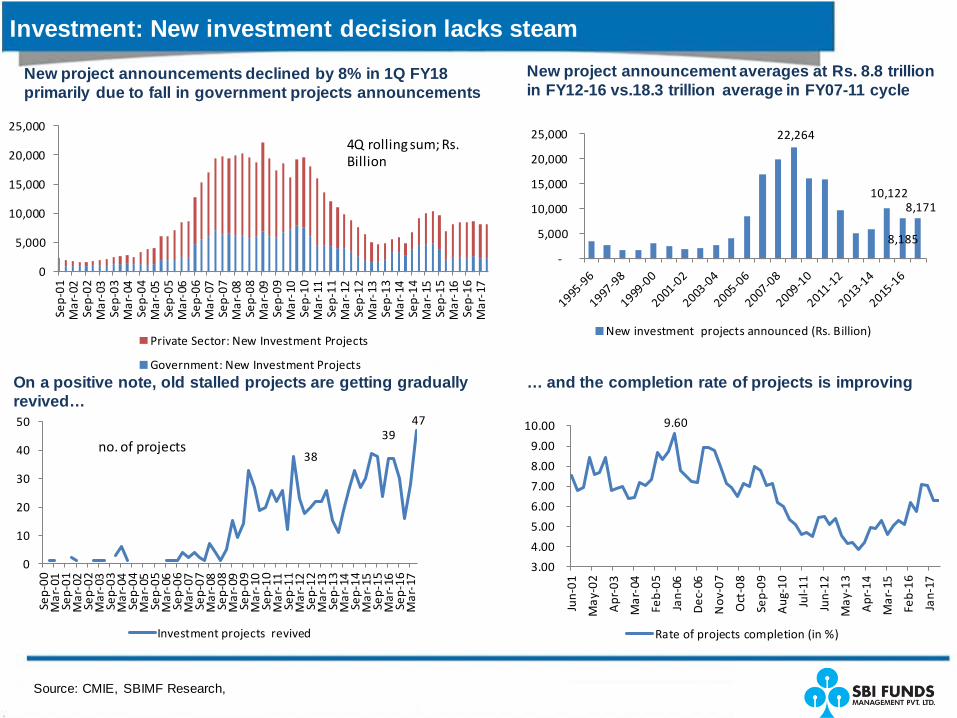
New project announcements declined by 8% in 1Q FY18 primarily due to fall in government projects announcements
22,264
10,122
8,185
8,171
-
5,000
10,000
15,000
20,000
25,000
New investment projects announced (Rs. Billion)
New project announcement averages at Rs. 8.8 trillion in FY12-16 vs.18.3 trillion average in FY07-11 cycle
On a positive note, old stalled projects are getting gradually revived…
… and the completion rate of projects is improving
9.60
3.00
4.00
5.00
6.00
7.00
8.00
9.00
10.00
Jun-
01
May
-02
Apr
-03
Mar
-04
Feb-
05
Jan-
06
Dec
-06
Nov
-07
Oct
-08
Sep-
09
Aug
-10
Jul-1
1
Jun-
12
May
-13
Apr
-14
Mar
-15
Feb-
16
Jan-
17
Rate of projects completion (in %)
38
39 47
0
10
20
30
40
50
Sep-
00M
ar-0
1Se
p-01
Mar
-02
Sep-
02M
ar-0
3Se
p-03
Mar
-04
Sep-
04M
ar-0
5Se
p-05
Mar
-06
Sep-
06M
ar-0
7Se
p-07
Mar
-08
Sep-
08M
ar-0
9Se
p-09
Mar
-10
Sep-
10M
ar-1
1Se
p-11
Mar
-12
Sep-
12M
ar-1
3Se
p-13
Mar
-14
Sep-
14M
ar-1
5Se
p-15
Mar
-16
Sep-
16M
ar-1
7
Investment projects revived
no. of projects
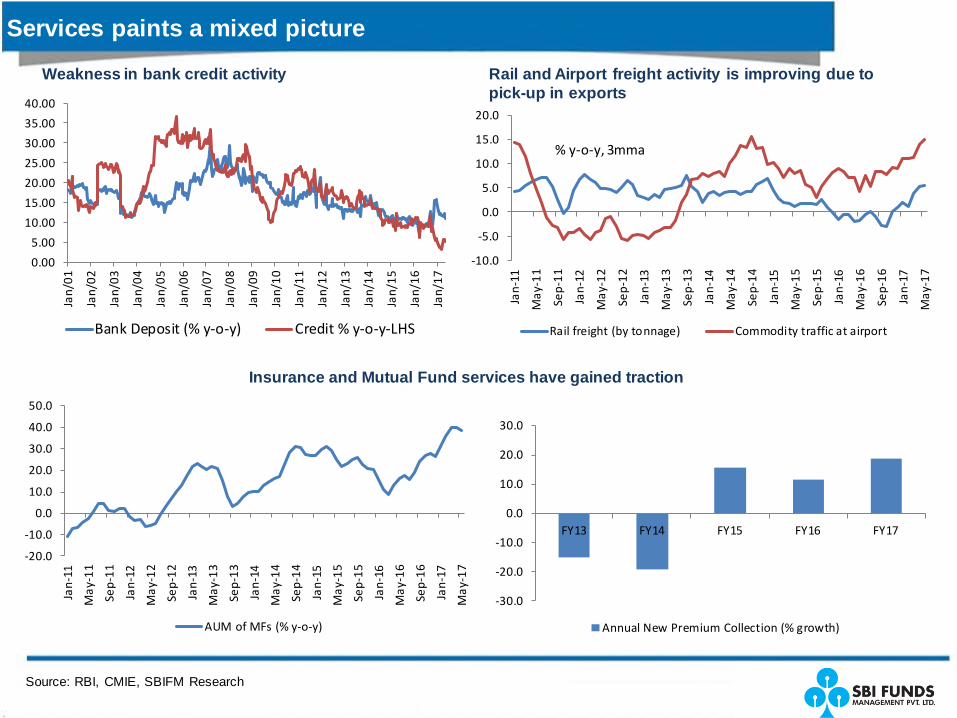
Services paints a mixed picture
Source: RBI, CMIE, SBIFM Research
Weakness in bank credit activity Rail and Airport freight activity is improving due to pick-up in exports
Insurance and Mutual Fund services have gained traction
-30.0
-20.0
-10.0
0.0
10.0
20.0
30.0
FY13 FY14 FY15 FY16 FY17
Annual New Premium Collection (% growth)
0.00
5.00
10.00
15.00
20.00
25.00
30.00
35.00
40.00
Jan/
01
Jan/
02
Jan/
03
Jan/
04
Jan/
05
Jan/
06
Jan/
07
Jan/
08
Jan/
09
Jan/
10
Jan/
11
Jan/
12
Jan/
13
Jan/
14
Jan/
15
Jan/
16
Jan/
17
Bank Deposit (% y-o-y) Credit % y-o-y-LHS
-10.0
-5.0
0.0
5.0
10.0
15.0
20.0
Jan-
11
May
-11
Sep-
11
Jan-
12
May
-12
Sep-
12
Jan-
13
May
-13
Sep-
13
Jan-
14
May
-14
Sep-
14
Jan-
15
May
-15
Sep-
15
Jan-
16
May
-16
Sep-
16
Jan-
17
May
-17
Rail freight (by tonnage) Commodity traffic at airport
% y-o-y, 3mma
-20.0
-10.0
0.0
10.0
20.0
30.0
40.0
50.0
Jan-
11
May
-11
Sep-
11
Jan-
12
May
-12
Sep-
12
Jan-
13
May
-13
Sep-
13
Jan-
14
May
-14
Sep-
14
Jan-
15
May
-15
Sep-
15
Jan-
16
May
-16
Sep-
16
Jan-
17
May
-17
AUM of MFs (% y-o-y)

Source: CBEC, Ministry of Rural Development, Elara Securities, SBIMF Research; NB: Based of 1482 items under the HS Code classification as of 11th June; Does not include additional cess which has been imposed on 55 items so far
Reforms by government makes market positive about future growth
GST: Government finalized the rates on all items and most items will attract an effective tax rate of less than 18%*
Tax Rate # Items
0% 9.6% of the items
5% 19.9% of the items
12% 16.6% of the items
18% 37.7% of the items
28% 16.1% of the items
Affordable Housing Vision of the government picks up pace
1080 1083 1182
1803
3200
5100 5100
0
1000
2000
3000
4000
5000
6000
FY13 FY14 FY15 FY16 FY17 FY18E FY19E
No. of Rural HousingCompleted (in '000)
Key Reforms in recent months • Affordable Housing picks-up pace: The government has targeted construction of 51 lakh houses in 2017-18 that would
meet its target of one crore houses by 2019 under the revised Pradhan Mantri Awaas Yojana Gramin (PMAY-G) and hopes to bring down the building time to 6-12 months from 18 months to 3 years earlier. Over 32 lakh houses have been reported complete in FY17 and 18 lakh in FY16.
• Real Estate Regulation Act: was implemented on a nation-wide basis on 1st May. RERA ensures that there is enough long term visibility for players with strong corporate governance, brand and capital allocation standards
• Ordinance to speed up NPA resolution: Government has passed an ordinance to empower the RBI to setup oversight committees and giving immunity to bankers. This is a positive move for clearing stressed loans which are 13% of total loans.

Government Infrastructure push positive for growth
Source: Spark, Government documents, SBIFM Research
299 384 386
932
1307 1432
0
200
400
600
800
1000
1200
1400
1600
FY13 FY14 FY15 FY16 FY17RE FY18BE
Road infra (Rs. Billion)
Spending on Road construction has jumped 3.7x times in last 3 years
Execution has picked up pace in Road construction
492 520 643
935
1210 1310
0
200
400
600
800
1000
1200
1400
FY13 FY14 FY15 FY16 FY17RE FY18BE
Railways infra (Rs. Billion)
Spending on Railways has jumped 2 times in last 3 years
Railways- another key area of spend
55
90 84
121
196 199
0
50
100
150
200
250
FY13 FY14 FY15 FY16 FY17RE FY18BE
Metro and MRTS Projects
Metro spending projected to grow at 12%
Metro construction happening in partnership with states and JICA
980 960 1059 1145
1441 1565
0
500
1000
1500
2000
FY13 FY14 FY15 FY16 FY17RE FY18BE
Rural and Agri Spending
Irrigation and Rural Development
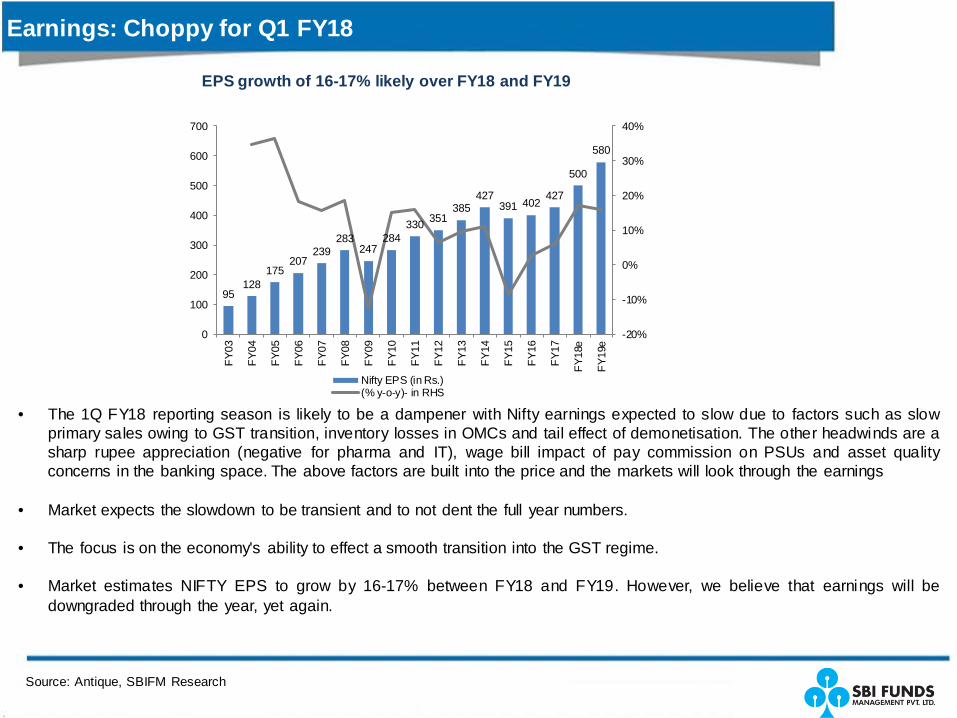
Earnings: Choppy for Q1 FY18
Source: Antique, SBIFM Research
EPS growth of 16-17% likely over FY18 and FY19
• The 1Q FY18 reporting season is likely to be a dampener with Nifty earnings expected to slow due to factors such as slow primary sales owing to GST transition, inventory losses in OMCs and tail effect of demonetisation. The other headwinds are a sharp rupee appreciation (negative for pharma and IT), wage bill impact of pay commission on PSUs and asset quality concerns in the banking space. The above factors are built into the price and the markets will look through the earnings
• Market expects the slowdown to be transient and to not dent the full year numbers.
• The focus is on the economy's ability to effect a smooth transition into the GST regime.
• Market estimates NIFTY EPS to grow by 16-17% between FY18 and FY19. However, we believe that earnings will be downgraded through the year, yet again.
95 128
175 207
239 283
247 284
330 351 385
427 391 402
427
500
580
-20%
-10%
0%
10%
20%
30%
40%
0
100
200
300
400
500
600
700
FY03
FY04
FY05
FY06
FY07
FY08
FY09
FY10
FY11
FY12
FY13
FY14
FY15
FY16
FY17
FY18
e
FY19
e
Nifty EPS (in Rs.)(% y-o-y)- in RHS
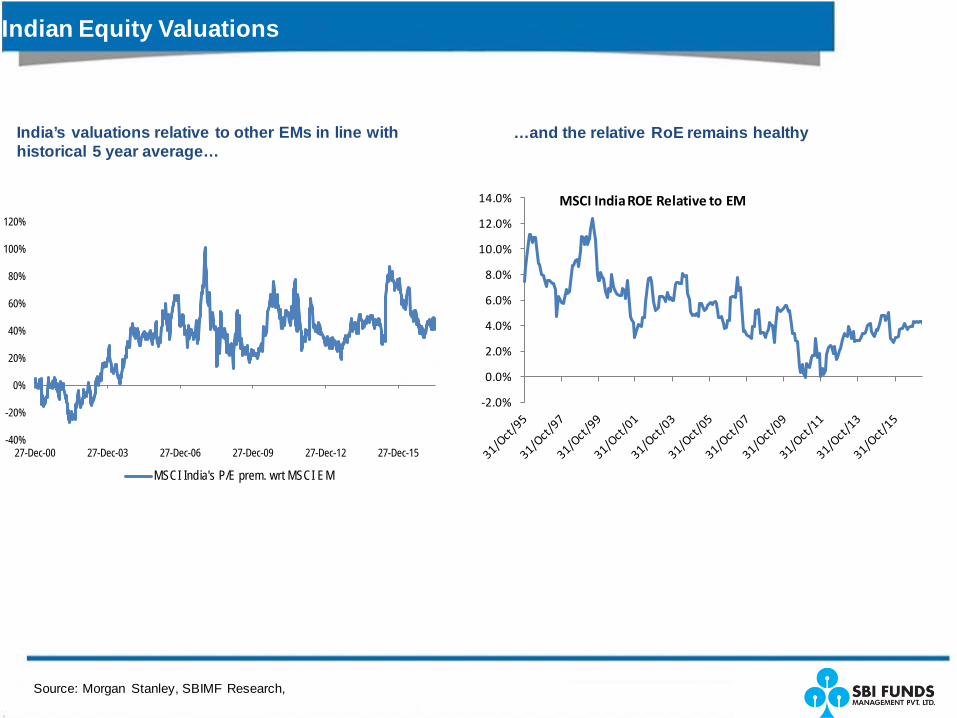
Source: Morgan Stanley, SBIMF Research,
Indian Equity Valuations
India’s valuations relative to other EMs in line with historical 5 year average…
…and the relative RoE remains healthy
-2.0%
0.0%
2.0%
4.0%
6.0%
8.0%
10.0%
12.0%
14.0% MSCI India ROE Relative to EM
-40%
-20%
0%
20%
40%
60%
80%
100%
120%
27-Dec-00 27-Dec-03 27-Dec-06 27-Dec-09 27-Dec-12 27-Dec-15
MSCI India's P/E prem. wrt MSCI EM

Liquidity: Robust inflow from FIIs and Domestic Mutual Fund
Source: MOSL NSDL, SBIMF Research
FIIs have invested US$ 23 billion in India YTD, of which ~US$ 8.5 billion is invested in Indian equity market
Domestic Mutual Funds, too, continue to pump money in the Indian equity market
Insurance companies, however, have been a net seller in the India equity market
8.4 10.4
3.2
-0.1
6.6
4.1
6.2
3.5 2.3
6.0
0.2
-2.6
-0.3
1.2 1.7
4.6
-4.6
6.6
1.8
Dec
-12
Mar
-13
Jun-
13
Sep-
13
Dec
-13
Mar
-14
Jun-
14
Sep-
14
Dec
-14
Mar
-15
Jun-
15
Sep-
15
Dec
-15
Mar
-16
June
-16
Sep-
16
Dec
-16
Mar
-17
Jun-
17
-1.4 -1.4 -1.0
-0.6 -0.8 -1.3
0.1
2.7 2.4 1.5
3.7 3.9
2.1
0.4 1.0 1.0
4.7
1.7
4.6
Dec
-12
Mar
-13
Jun-
13
Sep-
13
Dec
-13
Mar
-14
Jun-
14
Sep-
14
Dec
-14
Mar
-15
Jun-
15
Sep-
15
Dec
-15
Mar
-16
June
-16
Sep-
16
Dec
-16
Mar
-17
Jun-
17
-2.1
-4.9
-0.3 -0.2
-3.9
-0.9
-2.8 -3.0
-2.0 -2.4
1.3
0.3
-0.1
0.5
-0.6
-2.2
0.5
-1.5
Dec
-12
Mar
-13
Jun-
13
Sep-
13
Dec
-13
Mar
-14
Jun-
14
Sep-
14
Dec
-14
Mar
-15
Jun-
15
Sep-
15
Dec
-15
Mar
-16
June
-16
Sep-
16
Dec
-16
Mar
-17

Equity Market outlook
• Indian equity market had depicted a gain of 16.3% in 1H 2017, albeit marginally less than emerging market returns of 17.2% (for MSCI-EM). The market fell 1% during the last month. That said, July started on a positive note as market cheered the country’s transition to Goods and Services tax (GST). As of 11th July, NIFTY stands at its historic al high of 9816.
• Real estate sector was among the best performing sector as RERA became effective from 1st May while IT and Pharma sectors were the laggards likely reflecting the effect of currency appreciation on these export oriented sectors.
• On the global front, while the key economies are expected to tighten their monetary policy, there is a rising expectations of fiscal stimulus - with infrastructure and defence spending likely to take the lead. Global trade cycle is also improving gradually.
• Locally, the country embarked on GST. While, the business face some implementation challenges in the first month of the new indirect tax regime, it is expected to lead to significant efficiency gains in the long run.
• RBI identified 12 large NPA accounts which require increased provisioning by the banks. Banks have also been asked to resolve 55 cases of bad loans within six months or refer to the Insolvency and Bankruptcy Code. Higher provisioning could lead to muted earnings for banks going ahead.
• Earnings over 1H FY18 could also be disrupted from the GST implementation, thus challenging the 20% of NIFTY earnings growth pencilled in by the market.
• Valuations are already rich owing primarily to robust equity market participation by FIIs and Domestic Mutual funds. FIIs have invested US$ 8.5 billion between Jan to June, while DIIs have invested US$ 3.4 billion during the same period.
• Sensex is trading around 19 times 1-year forward earnings as investors bet on the long-term growth potential of the economy. In such a scenario, we continue to remain focussed on bottom up stock picking.
Valuations are at +18 times on 1 year forward earnings
Source: Bloomberg, SBIMF Research
7.0
9.0
11.0
13.0
15.0
17.0
19.0
21.0
23.0
25.0
Feb/
06Ju
l/06
Dec
/06
May
/07
Oct
/07
Mar
/08
Aug
/08
Jan/
09Ju
n/09
Nov
/09
Apr
/10
Sep/
10Fe
b/11
Jul/
11D
ec/1
1M
ay/1
2O
ct/1
2M
ar/1
3A
ug/1
3Ja
n/14
Jun/
14N
ov/1
4A
pr/1
5Se
p/15
Feb/
16Ju
l/16
Dec
/16
Sensex 1Y fwd…
Mean: 16
+1 SD
-1 SD
FIXED INCOME MARKET
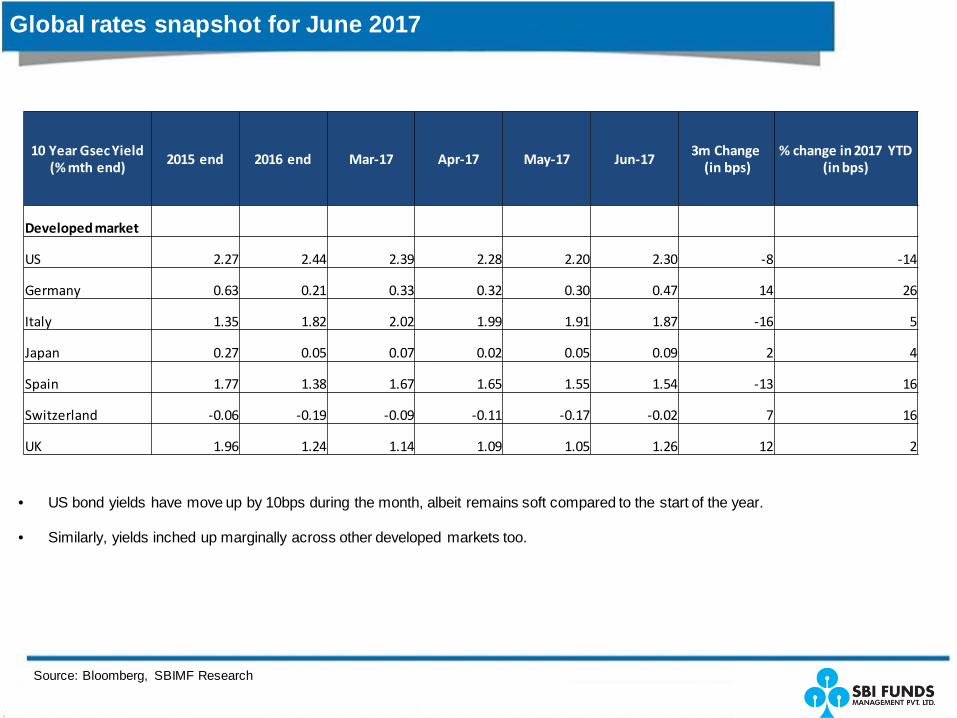
Global rates snapshot for June 2017
• US bond yields have move up by 10bps during the month, albeit remains soft compared to the start of the year.
• Similarly, yields inched up marginally across other developed markets too.
Source: Bloomberg, SBIMF Research
10 Year Gsec Yield (% mth end) 2015 end 2016 end Mar-17 Apr-17 May-17 Jun-17 3m Change
(in bps) % change in 2017 YTD
(in bps)
Developed market
US 2.27 2.44 2.39 2.28 2.20 2.30 -8 -14
Germany 0.63 0.21 0.33 0.32 0.30 0.47 14 26
Italy 1.35 1.82 2.02 1.99 1.91 1.87 -16 5
Japan 0.27 0.05 0.07 0.02 0.05 0.09 2 4
Spain 1.77 1.38 1.67 1.65 1.55 1.54 -13 16
Switzerland -0.06 -0.19 -0.09 -0.11 -0.17 -0.02 7 16
UK 1.96 1.24 1.14 1.09 1.05 1.26 12 2

Emerging Market Bond yields- June 2017
Source: Bloomberg, SBIMF Research
Bond yields depicts movements on both sides in the Emerging markets. Korea, Philippines and China depicted the rise in bond yields while bond yields fell or remain flat for other key EMs YTD
10 Year Gsec Yield (% mth end) 2015 end 2016 end Mar-17 Apr-17 May-17 Jun-17 3m Change
(in bps) % change in 2017 YTD
(in bps)
Emerging Market
Brazil 16.5 11.4 10.1 10.3 10.7 10.5 47 -87
China 2.8 3.0 3.3 3.5 3.6 3.6 28 53
India 7.8 6.5 6.7 7.0 6.7 6.5 -18 -2
Indonesia 8.7 7.9 7.0 7.0 6.9 6.8 -22 -112
Korea 2.1 2.1 2.2 2.2 2.2 2.2 3 14
Malaysia 4.2 4.2 4.1 4.0 3.9 3.9 -22 -27
Philippines 3.9 4.6 4.6 4.7 4.7 4.7 8 8
Russia 9.6 8.4 7.9 7.6 7.6 7.7 -22 -67
South Africa 9.8 8.9 8.9 8.7 8.6 8.8 -10 -14
Taiwan 1.0 1.2 1.1 1.0 1.0 1.1 -3 -13
Thailand 2.5 2.6 2.7 2.7 2.6 2.5 -21 -17

India Rates Snapshot for June 2017
• Indian bond yields continued to fall in June on account of soft inflation print and building hopes of rate cut by RBI.
• Money market rates, were mostly flat during the month as system liquidity continues to be ample.
• Crude oil prices fell sharply -7.9% over the month and -11.7% YTD.
• Rupee has appreciated sharply on YTD basis owing to massive FII inflows in the debt and equity market.
Source: Bloomberg, PPAC, CCIL, SBIMF Research; NB: **Crude oil price is average $/barrel for the month, rest of the data are % month end; *Corporate bond rate is for AAA rated bonds ,*** Refers to PSU Banks CD rate; # INR and Oil price changes are % change
Apr-17 May-17 Jun-17 m-o-m change (in bps) Change YTD (in bps)
1 Yr T-Bill 6.41 6.44 6.36 -9 3
3M T-Bill 6.18 6.28 6.29 0 9
10 year GSec 6.96 6.66 6.51 -15 0
3M CD*** 6.35 6.35 6.33 -2 5
12M CD*** 6.75 6.73 6.63 -10 0
3 Yr Corp Bond* 7.60 7.46 7.29 -17 0
5 Yr Corp Bond* 7.71 7.53 7.41 -12 4
10 Yr Corp Bond* 7.90 7.75 7.57 -18 -1
1 Yr IRS 6.52 6.42 6.25 -17 7
5 Yr IRS 6.82 6.57 6.29 -27 3
Overnight MIBOR Rate 6.18 6.25 6.25 0 0
INR/USD 64.2 64.5 64.6 -0.1 5.2#
Crude Oil Indian Basket** 52.6 50.6 46.6 -7.9 -11.7#
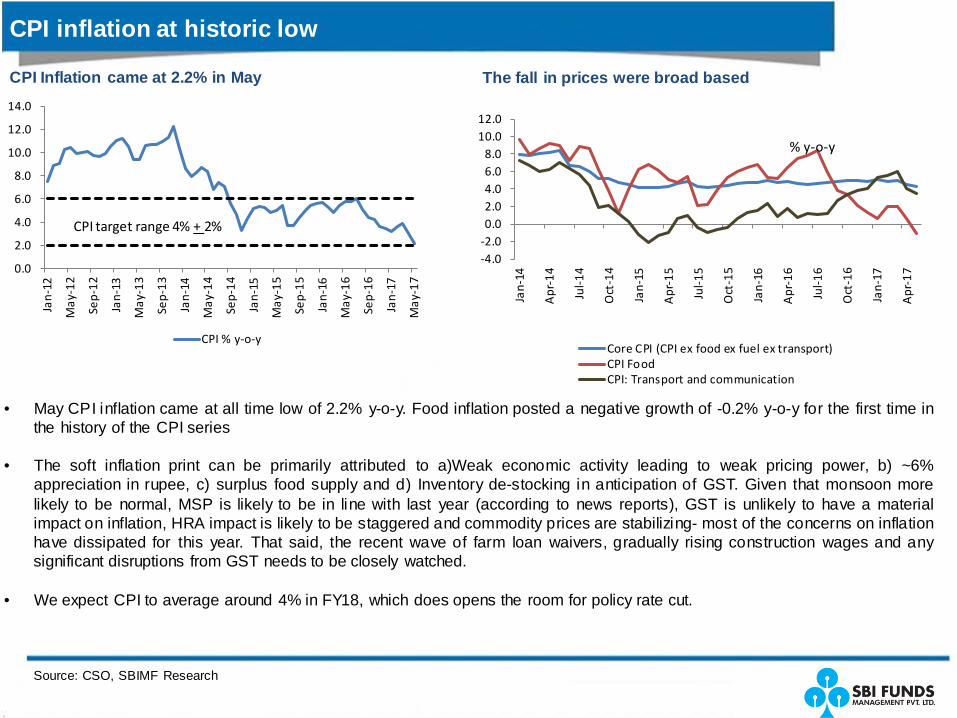
CPI inflation at historic low
Source: CSO, SBIMF Research
• May CPI inflation came at all time low of 2.2% y-o-y. Food inflation posted a negative growth of -0.2% y-o-y for the first time in the history of the CPI series
• The soft inflation print can be primarily attributed to a)Weak economic activity leading to weak pricing power, b) ~6% appreciation in rupee, c) surplus food supply and d) Inventory de-stocking in anticipation of GST. Given that monsoon more likely to be normal, MSP is likely to be in line with last year (according to news reports), GST is unlikely to have a material impact on inflation, HRA impact is likely to be staggered and commodity prices are stabilizing- most of the concerns on inflation have dissipated for this year. That said, the recent wave of farm loan waivers, gradually rising construction wages and any significant disruptions from GST needs to be closely watched.
• We expect CPI to average around 4% in FY18, which does opens the room for policy rate cut.
CPI Inflation came at 2.2% in May The fall in prices were broad based
0.0
2.0
4.0
6.0
8.0
10.0
12.0
14.0
Jan-
12
May
-12
Sep-
12
Jan-
13
May
-13
Sep-
13
Jan-
14
May
-14
Sep-
14
Jan-
15
May
-15
Sep-
15
Jan-
16
May
-16
Sep-
16
Jan-
17
May
-17
CPI % y-o-y
CPI target range 4% + 2%
-4.0-2.00.02.04.06.08.0
10.012.0
Jan-
14
Apr
-14
Jul-1
4
Oct
-14
Jan-
15
Apr
-15
Jul-1
5
Oct
-15
Jan-
16
Apr
-16
Jul-1
6
Oct
-16
Jan-
17
Apr
-17
Core CPI (CPI ex food ex fuel ex transport)CPI FoodCPI: Transport and communication
% y-o-y

Source: Bloomberg, SBIMF Research,
Commodity prices pressures gradually easing
In 2015, all the commodities registered a price decline mainly due to China, global growth slowdown and excess capacity. In 2016, prices rose across most commodities (barring Uranium, wheat and corn)
Despite 2016 price rise, overall commodity index still far lower than 2014 highs
In 2017, price pressures seems to gradually easing as supply conditions respond to 2016 price rise
-25.0-20.0-15.0-10.0
-5.00.05.0
10.015.020.025.0
Iron
Ore
Suga
rW
TIG
asol
ine
Bren
tH
eati
ng O
ilG
as O
ilN
atur
al G
asCo
ffee
Nic
kel
Tin
Soyb
eans
Cott
onLe
adU
rani
umPl
atin
umCo
rnCo
alSi
lver
Zinc
Copp
erG
old
Alu
min
ium
Whe
atPa
lladi
um
% change YTD in 2017
-60.0-40.0-20.0
0.020.040.060.080.0
100.0% change in 2015 % change in 2016
90
110
130
150
170
190
210
230
Jan-
05
Sep-
05
May
-06
Jan-
07
Sep-
07
May
-08
Jan-
09
Sep-
09
May
-10
Jan-
11
Sep-
11
May
-12
Jan-
13
Sep-
13
May
-14
Jan-
15
Sep-
15
May
-16
Jan-
17
CRB Food Index CRB Commodity Index
Jan 2010=100

Liquidity overhang from demonetization to stay over the year
Source: RBI, SBIMF Research
• Overhang of liquidity consequent upon demonetization continues to weigh on money markets for nine months in succession.
• RBI has issued Rs. 1.9trillion of MSS and CMBs to mop-up the excess liquidity. Rs. 200 billion of OMO sales has announced in
July so far. Despite these measures, at +3 trillion, the banking system liquidity is ample.
• The robust foreign capital inflow had led RBI to build US$ 22 billion of reserves book in the spot market YTD (inclusive of revaluation gains/ losses) and US$ 13billion of short-term forward book. If the central bank is unable to roll-over the forward contracts, this will lead to additional liquidity injection through the year.
• Factoring in the current pace of weekly withdrawal and other stated dynamics, the system looks in a comfortable liquidity situation over the next couple of months, lest the RBI intervention gets more active.
Liquidity surplus averaged at Rs. 3.1 trillion during June The pace of currency withdrawal has slowed down in June 18.0
9
15.3
CIC beforedemonetization (Rs.
Trillion)
CIC on 6th Jan (thelowest point)
CIC as of 23rd June 2017
-4000
-2000
0
2000
4000
6000
8000
10000
Banking System Liquidity (Rs. Billion)
+1% of NDTL
-1% of NDTL

Overall external account is comfortable
Exports depicting a cyclical recovery and overall trade deficit is contained
Source: CMIE, RBI, SBIFM Research
Low trade deficit has helped Current Account deficit to stay below 2% of GDP
India’s Net FDI inflow sufficient to fund Current account deficit since FY15
FX reserves at US$ 387bn as of June end is sufficient to finance 11 months of import
-8.0 -7.0 -6.0 -5.0 -4.0 -3.0 -2.0 -1.0 -
-35.0
-30.0
-25.0
-20.0
-15.0
-10.0
-5.0
-
Mar
-11
Aug
-11
Jan-
12
Jun-
12
Nov
-12
Apr
-13
Sep-
13
Feb-
14
Jul-1
4
Dec
-14
May
-15
Oct
-15
Mar
-16
Aug
-16
Jan-
17
Current Account Balance (US$ bn) as % of GDP - RHS
0
5
10
15
20
25
30
1520253035404550
Jan-
10
Jun-
10
Nov
-10
Apr
-11
Sep-
11
Feb-
12
Jul-1
2
Dec
-12
May
-13
Oct
-13
Mar
-14
Aug
-14
Jan-
15
Jun-
15
Nov
-15
Apr
-16
Sep-
16
Feb-
17
Trade Deficit (USD bn)- RHS Exports (USD bn)
Imports (USD bn)
48
78 88
32 28 22
15
33
12 22 20 22
33 36 36 36
0
20
40
60
80
100
FY11
FY12
FY13
FY14
FY15
FY16
FY17
FY18
E
CAD FDI
USD bn
67891011121314
260
280
300
320
340
360
380
400
Jan-
10A
pr-1
0Ju
l-10
Oct
-10
Jan-
11A
pr-1
1Ju
l-11
Oct
-11
Jan-
12A
pr-1
2Ju
l-12
Oct
-12
Jan-
13A
pr-1
3Ju
l-13
Oct
-13
Jan-
14A
pr-1
4Ju
l-14
Oct
-14
Jan-
15A
pr-1
5Ju
l-15
Oct
-15
Jan-
16A
pr-1
6Ju
l-16
Oct
-16
Jan-
17A
pr-1
7
FX reserves (USD bn)- LHS Import cover (in months RHS)

Currency: Massive appreciation due to strong FII flows
Source: Bloomberg, SBIMF Research
Rupee depicted appreciation bias between Jan-June 2017 in line with other Emerging market currencies
DXY falls below 100 since April Rupee appreciated by 5.2% YTD and holds at~64-65 levels
-1.7 -1.6 -1.4
0.1 0.9 2.4 4.5 4.5 5.1 5.2 5.4 5.6 6.2 8.9 13.1 14.4
-30-25-20-15-10
-505
1015
Phili
ppin
e Pe
so
Braz
il Re
al
Colo
mbi
an P
eso
Turk
ey L
ira
Indo
nesi
an R
upia
h
Chin
ese
renm
inbi
Mal
aysi
an R
ingi
tt
Russ
ian
Roub
le
Afr
ican
Ran
d
Indi
an R
upee
Kore
an W
on
Thai
Bah
t
Taiw
anes
e D
olla
r
Hun
gari
an F
orin
t
Polis
h Zl
oty
Mex
ican
Pes
o
% change in 2014 % change in 2015 % change in 2016 % change YTD (June end)
5759616365676971
Jan-
14Fe
b-14
Mar
-14
Apr
-14
May
-14
Jun-
14Ju
l-14
Aug
-14
Sep-
14O
ct-1
4N
ov-1
4D
ec-1
4Ja
n-15
Feb-
15M
ar-1
5A
pr-1
5M
ay-1
5Ju
n-15
Jul-1
5A
ug-1
5Se
p-15
Oct
-15
Nov
-15
Dec
-15
Jan-
16Fe
b-16
Mar
-16
Apr
-16
May
-16
Jun-
16Ju
l-16
Aug
-16
Sep-
16O
ct-1
6N
ov-1
6D
ec-1
6Ja
n-17
Feb-
17M
ar-1
7A
pr-1
7M
ay-1
7Ju
n-17
Indian Rupee
103
96
70
75
80
85
90
95
100
105
Jan-
05M
ay-0
5Se
p-05
Jan-
06M
ay-0
6Se
p-06
Jan-
07M
ay-0
7Se
p-07
Jan-
08M
ay-0
8Se
p-08
Jan-
09M
ay-0
9Se
p-09
Jan-
10M
ay-1
0Se
p-10
Jan-
11M
ay-1
1Se
p-11
Jan-
12M
ay-1
2Se
p-12
Jan-
13M
ay-1
3Se
p-13
Jan-
14M
ay-1
4Se
p-14
Jan-
15M
ay-1
5Se
p-15
Jan-
16M
ay-1
6Se
p-16
Jan-
17M
ay-1
7
DXY Index

In the last monetary policy (held in June), while the RBI kept the policy rate unchanged and stance neutral, the narratives were definitely less hawkish.
The central bank acknowledged the weaker than expected growth data
for 4Q as well as lower than expected inflation, but opined the need to have a more detailed study of both the prints.
Further, while acknowledging the lower inflation prints in recent months, the central bank continues to appear guarded. They cited that the food prices may be depicting a mixed impact of lingering effects of demonetization which have overlapped with excess food supply situation in some food items. These have contributed to the better-than-expected April inflation of 3%, but blur the future outlook on inflation.
Present stance of RBI factors in the lower inflation prints over the first half of FY17-18 (2.0-3.5%) and 2HFY18 inflation to range in 3.5-4.5%.
According to their media communication, the recent release of CSO revised series on IIP and WPI has likely impacted the growth estimates of the economy and need to be analysed in greater detail.
On balance, given the less-hawkish tone of the statement, it appears that unless the trends on inflation were to be reverse significantly, the ground has been laid for the MPC to sound more accommodative and deliver a rate cut during the year.
Policy Rate Outlook
Source: RBI, CSO, SBIFM Research
4.00
5.00
6.00
7.00
8.00
9.00
10.00
Jun-
05
Mar
-06
Dec
-06
Sep-
07
Jun-
08
Mar
-09
Dec
-09
Sep-
10
Jun-
11
Mar
-12
Dec
-12
Sep-
13
Jun-
14
Mar
-15
Dec
-15
Sep-
16
Repo Rate (mth end, %)

Bond market dynamics have changed considerably in last two months primarily due to change in inflation trajectory.
The recent fall in food inflation has been unexpectedly acute. Favourable monsoon and sowing pattern thus far into the Kharif season, contained MSP announcement and weakness in global food prices adds to the comfort of the food inflation trajectory. The present print of ~2% inflation looks unsustainable and near-term uncertainty around inflation has accentuated owing to multiple factors of 7th Pay commission implementation, GST, unsustainably low food prices, fiscal profligacy in farm loan. But despite all this, one could comfortably fathom inflation to average around 4% over the next couple of years owing to falling cost of production in Indian economy.
Broad economic activity is weak with most of the economic fire-power coming from government spending (both revenue and capital).
The near-term growth inflation dynamics warrants the incremental accommodation in RBI’s monetary policy.
The debt market had a whopping inflow of US$ 14.6 billion between January to June. Robust capital inflow has led the FX reserves to go up by US$ 22 billion in 2017 (till 23rd June) and RBI’s long forward position to go up from near nil to US$ 13.5 billion as of April end. If the central bank is unable to roll-over its forward book, it could further add to the liquidity glut of the market.
The central bank has decided to conduct a Rs. 200 billion of OMO sale in July so far. But it has been re-emphasizing that they will be doing so in a non-disruptive fashion. Owing to these mix of factors, liquidity may take its own sweet time to normalize.
The favourable liquidity and growth inflation dynamics makes us positive on outlook more confident to maintain relatively high duration in our portfolio.
Debt Market Outlook
Source: Bloomberg, SBIFM Research
4.00
5.00
6.00
7.00
8.00
9.00
10.00
Apr
-09
Oct
-09
Apr
-10
Oct
-10
Apr
-11
Oct
-11
Apr
-12
Oct
-12
Apr
-13
Oct
-13
Apr
-14
Oct
-14
Apr
-15
Oct
-15
Apr
-16
Oct
-16
Apr
-17
10 year GSec yield (mth end, %) Repo Rate (mth end, %)

Thank you

Disclaimer
This presentation is for information purposes only and is not an offer to sell or a solicitation to buy any mutual fund units/securities. These views alone are not sufficient and should not be used for the development or implementation of an investment strategy. It should not be construed as investment advice to any party. All opinions and estimates included here constitute our view as of this date and are subject to change without notice. Neither SBI Funds Management Private Limited, nor any person connected with it, accepts any liability arising from the use of this information. The recipient of this material should rely on their investigations and take their own professional advice. Mutual Funds investments are subject to market risks, read all scheme related documents carefully. Asset Management Company: SBI Funds Management Private Limited (A joint venture with SBI and AMUNDI). Trustee Company: SBI Mutual Fund Trustee Company Private Limited.

Contact Details
SBI Funds Management Private Limited
(A joint venture between SBI and AMUNDI)
Corporate Office: 9th Floor, Crescenzo, C-38 & 39, G Block, Bandra Kurla Complex, Bandra (East), Mumbai - 400 051 Tel: +91 22 6179 3000 Fax: +91 22 6742 5687/88/89/90/91 Website: www.sbimf.com
Call: 1800 425 5425
Visit us @ www.youtube.com/user/sbimutualfund
SMS: “SBIMF” to 56161
Email: [email protected]
Visit us @ www.facebook.com/SBIMF