market making and trading in nasdaq...
TRANSCRIPT
Financial The Review
EFA Eastern Finance
Association The Financial Review 34 (1999) 2 7 4 4
Market Making and Trading in Nasdaq Stocks
Michael A. Goldstein The University of Colorado at Boulder, and
International and Research Division New York Siock Exchange
Edward F. Nelling* Georgia Institute of Technology
Abstract
This paper examines the relations between the number of market makers, trading activity, and price improvement in Nasdaq stocks, using a model motivated by Grossman and Miller (1988). Results indicate a positive relation between the number of market makers and trading frequency, and that competition among market makers reduces effective bid-ask spreads. Results estimated using a simultaneous equations framework support the model predictions of Grossman and Miller. Results also indicate that trading frequency may be more important than trade size in determining the number of market makers.
Keywords: market making, price improvement, microstructure, endogeneity JEL classifications: G20lC3 1
1. Introduction
Market making and equity trading activity have been the focus of much aca- demic research. Although many studies have examined these processes separately,
*Corresponding author: DuPree College of Management, Georgia Institute of Technology, Atlanta, GA 30332-0520; Phone: (404) 894-4963, Fax: (404) 894-6030, E-mail: [email protected]
An earlier version of this paper was presented at the 1995 Financial Management Association Meeting. The authors thank James Angel, Sanjai Bhagat, Michael Edelson, Chris Leach, James Mahoney, Sheridan Titman, Russell Wermers and William Wilhelm for their helpful comments and insights. Goldstein acknowledges Geewax, Terker, & Company and Nelling acknowledges Invesco for financial support.
27

28 M A . Goldstein, E.F. Nelling/The Financial Review 34 (1999) 2744
they are obviously related. Market making is related to trading activity, since dealers trade with each other as well as the public. Market making and trading activity also affect the bid-ask spread. Trading costs will be determined by competition among market makers, and lower trading costs may induce more trading activity. The relations among these variables suggest that theoretical and empirical research should consider their potential endogeneity.
Seminal papers in the area of market structure such as Ho and Stoll (1981) or Glosten and Milgrom (1985) consider only the displayed spread, and take the structure of the market as given. In contrast, Grossman and Miller (1988) do consider the interrelated, and therefore endogenous, nature of market making and trading. Their study (hereafter referred to as GM) is also one of the first to allow for the possibility of price improvement, i.e., the occurrence of trades at prices within the displayed bid and ask quotes. While GM claim that they do not consider spreads explicitly in their model, Whitcomb (1988) points out in his discussion of their paper that “the spread is the eminence gris [sic] of their model.” Although it is likely that Whitcomb was referring to the displayed spread, it would be more accurate to consider that GM were in fact discussing the effective spread as they considered the expected returns to the market makers of offsetting order imbalances through trading. The effective spread represents the prices at which investors are willing to buy and sell, as inferred from actual transaction prices. The difference between the effective and quoted spreads provides a measure of price improvement received by some investors. In recent years, other researchers have provided empirical evidence on the extent of price improvement in equity markets.’
As noted above, price improvement is related to the level of trading activity. Trading activity, in turn, has two components: the trade size and the frequency of trading. Glosten and Milgrom (1985) consider only trading frequency, as the trade size is restricted to a single share. On the other hand, GM explicitly consider varying trade size and implicitly consider trading frequency in their modeL2 Ho and Stoll (1981) assume that traders arrive via a Poisson jump process wishing to trade different size lots, and thus consider both trade size and trading frequency.
Previous empirical work has not provided an integrated analysis of trading and the endogenous nature of variables related to market making. In addition, existing empirical studies tend to examine volume instead of the components called for in theoretical models, namely trade size and trading frequency.
’ See, for example, Blume and Goldstein, (1992, 1997); Goldstein, (1994); Lee, (1993); or Petersen and Fialkowski, (1994). Other papers that have used measures that consider trades within the quoted spread include Angel, (1997); Battalio, Greene and Jennings, (1997); and Huang and Stoll, (1996).
’ In Grossman and Miller (1988), the time period between date one and date two varies: “ ... the length of time between date one and date two is the period of time needed for enough orders of outside customers to arrive at the market to offset the initial order imbalance” (p. 622). Since Var,(P) is considered from date one to date two, variance will increase with the length of time it takes to accumulate enough shares to offset the imbalance. As a result, the frequency of trades indirectly enters their model, as it affects the amount of time one has to wait from date one to date two, and thus affects Var,(P).
M.A. Goldstein, E.F. Nelling/The Financial Review 34 (1999) 27-44 29
Early empirical studies of market making in Nasdaq stocks include Tinic and West (1972) and Stoll (1978). These studies examine data close to the origin of Nasdaq, which started in 1971, and found volume to be a significant determinant of the number of market makers. However, over the intervening years Nasdaq has evolved, due to natural growth, advances in technology, legislative mandates and competitive pressures. For example, Nasdaq created the National Market System (which has now evolved into the National Market), partially in response to the 1975 Amendments to the Securities Exchange Act of 1934, which called for integration of U.S. equity markets. In addition, Nasdaq developed the Small Order Execution System, which altered the trading of small orders during the 1990s. Therefore, over the past two decades, Nasdaq has evolved from a system in its infancy to a more mature and complex system. These developments, combined with allegations of collusion among Nasdaq market makers by Christie and Schultz (1994), warrant a reexamination of the number of market makers with more recent data.
The study in this paper is more closely related to Wahal (1997), who examines the impact of entry and exit of market makers on Nasdaq to investigate the effects of competition. Using an event study methodology with data from 1982-1993, he finds that increased competition reduces spreads. He also uses Poisson regression to account for the integer nature of the data to model the determinants of the number of market makers. Earlier studies used ordinary least squares estimation, which assumes a continuously distributed dependent variable.
This study addresses important issues related to market making and trading in Nasdaq stocks. Specifically, it examines empirically the determinants of the number of market makers in Nasdaq National Market System (NMS) stocks and the relation between the number of market makers, trading activity, and trading costs faced by investors.’ The Nasdaq NMS provides an appropriate setting for the exploration of these issues, since it allows market makers to switch relatively freely the stocks in which they make markets and provides low barriers for entry or exit, allowing the total number of market makers to be determined by market factors. The study explicitly examines the effects of trade size and the number of trades on market making and the bid-ask spread, and considers that the relation between the number of market makers and effective spreads may be determined jointly.
This paper differs from earlier work in a number of respects. First, with respect to the number of market makers, it uses more recent data than Tinic and West (1972) or Stoll(l978). In addition, while previous research has indicated that volume is a primary determinant of the number of market makers, it has not identified which aspect of volume, trade size or the number of trades, is more important. Since Ho and Stoll(l981) and GM include both trade size and trade frequency in their models, this study decomposes volume into two components, trade size and the number of trades, to determine whether each is related to the number of market makers.
As this study uses data from 1990, it uses the older term “National Market System” as that was the name in use during 1990. The Nasdaq National Market System is now referred to as the Nasdaq National Market.
30 M.A. Goldstein, E.F. Nelling/The Financial Review 34 (1999) 27-44
Additionally, previous work examined the relation between the number of market makers and the displayed (quoted) bid-ask spread. Since papers such as Angel, (1997); Battalio, Greene and Jennings, (1997); Blume and Goldstein, (1992); Goldstein, (1994); Huang and Stoll, (1996); Lee, (1993); and Petersen and Fialkow- ski, (1994) have noted that transactions occur inside the quotes, the percent displayed spread may differ from the percent effective spread. In addition, since GM indirectly imply that the effective spread represents the returns to market making, the percent effective spread is included as a measure of price improvement.
As the model in GM postulates an endogenous relation between market making and trading activity, this study examines a two-equation simultaneous equation model based on the theoretical model developed in GM. This study also examines a broader three-equation system that includes the GM model by estimating a system of simultaneous equations that jointly determine the number of market makers, the average number of trades, and the effective bid-ask spread. To control for possible errors in model specification, results from ordinary least squares regressions are compared with those from a Poisson regression model that is more appropriate for discrete data such as the number of market makers.
Overall, the results indicate that inferences indeed depend upon whether the number of market makers, effective spreads and trading activity are all treated as endogenous and examined in a simultaneous equations framework. Furthermore, decomposing volume into the number of trades and trade size yields additional insights as to how trading activity is related to market making. Specifically, results indicate that it is trading frequency, and not trade size, that is of primary importance in determining the number of market makers.
2. Data and descriptive statistics
The data used in this study were obtained from the Center for Research in Security Prices (CRSP) and the Institute for the Study of Security Markets (ZSSM). The CRSP Nasdaq Daily Stock File provided data on the number of market makers as of year-end 1990, daily trading volume for all of 1990, the number of shares traded per day for all of 1990, share price and number of shares outstanding as of year-end 1990, and daily stock returns for 1988-1990. The daily returns were compounded to form monthly returns, and the standard deviation of the 36 monthly returns from 1988-1990 was c~mputed .~
The CRSP data for 1990 was used because that was the year for which the authors had access to ISSM data. The number of market makers according to the CRSP data is the registered number of market makers for the stock. In practice, the degree to which each market maker is actively making a market by providing competitive quotes will depend upon his inventory level and other market conditions. As a result, the effective number of market makers may differ from the actual number of market makers. Furthermore, implicit market making activity may take place in the form of limit orders submitted by investors or in electronic crossing networks. As long as the stated number of market makers is correlated with the effective number of market makers, our results should not be significantly affected.

M A . Goldstein, E.F. Nelling/The Financial Review 34 (1999) 27-44 3 1
As noted above, most of the early empirical literature on the number of market makers examined displayed spreads, based on quoted bid and ask prices. This study instead includes a measure of the effective spread in the analysis. The use of effective spreads is important, as there is a potential difference in the interpretation of the displayed and effective spreads in a study with the number of market makers. The displayed spread may be used as a measure of the risk that the dealer is taking by participating in the market. When dealers provide quotes to the market, they are in essence providing a free option to the market to transact at those prices. This option exposes them to risk, and the size of the quoted spread is an estimate of the magnitude of the dealer’s risk exposure. However, as noted above, the quoted spread is not necessarily a measure of the trading profits that the dealer will receive since some trades may occur within the quotes. The effective spread is therefore a better measure of the return available to the dealer for making a market in the stock. Thus, due to its inherent option-like characteristics, the displayed spread may be used as a measure of the dealer’s risk, while the effective spread may be used as a measure of their potential returns, as it is constructed from actual trades.
The trade and quote data required to construct the percent effective spread series came from the 1990 Trades and Quotes Transaction Files from ZSSM. It is important in a study of effective spreads to pair trades with the proper quotes. As Nasdaq NMS trades are subject to the “last trade reporting” rule, which requires that the price of any trade must be reported within 90 seconds, any trade on a Nasdaq NMS stock that occurred less than 90 seconds after a quote change was ignored. Other price and quote filters were imposed to ensure the accuracy of the effective spread series, and are available from the authors upon request.
The average percent effective spread for each stock was calculated by calculat- ing twice the average of the absolute deviation of the trade price from the midpoint of the immediately prior quote divided by the price at which the trade took place:
I (Ask + Bid)
I P, - 2 2 T P,
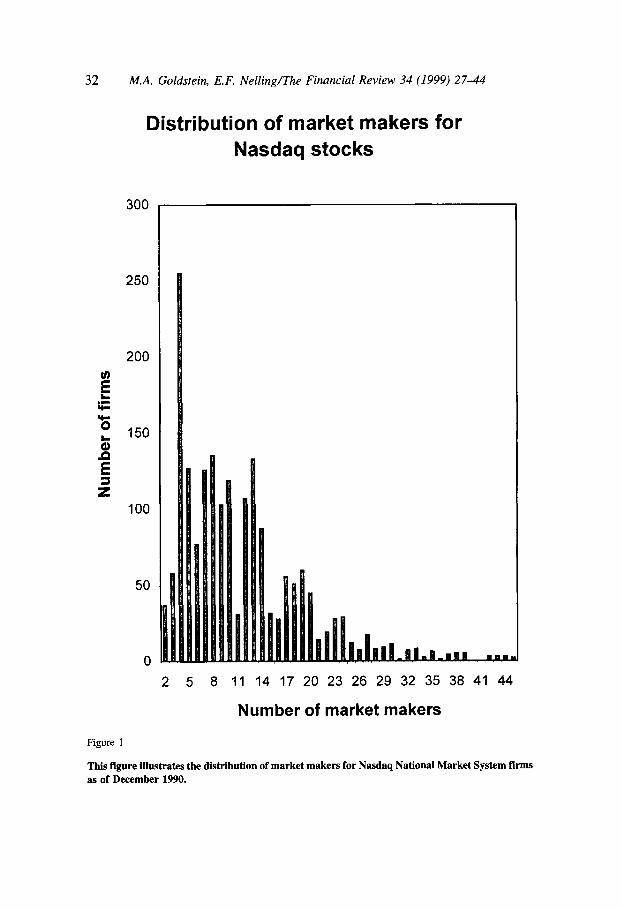
(1) % effective spread = - x:, The construction of the above variables resulted in a cross-section of 1,878 firms. Figure 1 illustrates the variability of the number of market makers for Nasdaq NMS firms. Almost 75% of the sample had over five market makers, and almost 50% had 10 or more. The distribution of the data illustrates its discrete nature, and motivates the analysis of model specification in Section 4 of the paper.
Table 1 indicates that the number of market makers per stock increases with volume and market capitalization. Stocks with only two market makers had a median average daily trading volume of only 954 shares and a median market capitalization
32 M.A. Goldstein, E.F. Nelling/The Financial Review 34 (1999) 2 7 4 4
Distribution of market makers for Nasdaq stocks
300
250
200
E L .L * yl * 150 P
3 z
t E
100
50
0 2 5 8 11 14 17 20 23 26 29 32 35 38 41 44
Number of market makers
Figure 1
This figure illustrates the distribution of market makers for Nasdaq National Market System firms as of December 1990.
M.A. Goldstein, E.F. NellinglThe Financial Review 34 (1999) 2744 33
of only $7.5 mi l l i~n .~ In contrast, stocks with 19 market makers had a median daily trading volume of over 43,000 shares and a market capitalization of $83 million. Table 1 also indicates that spreads decrease as the number of market makers increases. This inverse relation holds for both the displayed and the effective spreads, in percentage terms and in absolute dollar terms: the median effective spread is $0.69 (10.3%) and displayed spread is $0.97 (14.2%) for stocks with only two market makers, and the median effective spread is $0.23 (2.2%) and displayed spread is $0.29 (2.7%) for stocks with 19 market makers. There appears to be little correlation between standard deviation or share price and the number of market makers.
3. Empirical results
3.1. Volume, the number of trades and trade size Previous research has determined that trading volume is related to the number
of market makers. A natural question arises as to whether market making is more closely related to volume or its components: the number of trades and trade size. If market makers are interested in making few trades with a large potential profit, then the number of market makers should increase with trade size. On the other hand, if market makers are averse to making large trades due to added risk, one should expect an inverse relation. If, however, market makers are indifferent to trade size, the coefficient should be insignificant.
If market makers instead prefer to earn profits from many trades due to liquidity and their ability to offset positions rapidly, then the number of trades will be significant and positive. Since it is likely that the profitability of market making would increase with the frequency of trading, the number of trades should explain a substantial amount of the variance of the number of market makers per stock.
The dependence of market making on trading activity is examined in Table 2 with regressions of the number of market makers on volume, number of trades, and trade size. All variables are transformed by taking natural logs to improve model specification and to reduce the effects of outliers. Another justification for log transformations is that the incremental effect of adding additional market makers is likely to diminish as the number of market makers increases, e.g., going from two to three market makers is likely to be more significant than going from 22 to 23 market makers.6
For ease in exposition, the term “median” will be used instead of “median average”. The reader is reminded that all statistics relating to volume and bid-ask spreads are based on the average of all such values over all trading days in 1990.
By taking the log transformation of the number of market makers, the increase of one additional market maker from two to three constitutes a change of 0.405 (ln3-ln2), while the increase of one additional market maker from 22 to 23 constitutes a change of only 0.044 (ln23-11122). Thus, the increase of an additional market maker has only about 1/10 the effect once there are 22 market makers as it did when there were only two. As a result, the use of log transformations substantially reduces the issue of effective vs. stated number of market makers.

34 M.A. Goldstein, E.F. Nelling/The Financial Review 34 (1999) 2 7 4 4
Table 1
Summary statistics of trading volume, bid-ask spreads and market making in Nasdaq stocks This table reports median summary statistics for variables related to trading activity and liquidity grouped by the number of market makers in Nasdaq National Market stocks. The 1,948 stocks in the sample were first grouped according to the number of market makers for each stock as of year-end 1990. For each stock in the group, the following variables were constructed: Average Daily Trading Volume is the average daily trading volume (in shares) during 1990; Market Capitalization is the 1990 year-end market capitalization; Standard Deviation is the standard deviation of the firm’s monthly stock return from 1988-1990; Price is the 1990 year-end share price; Effective Spread ($) is the average effective bid-ask spread, in dollars, in 1990 (where effective spread is calculated as twice the average absolute deviation of the trade price from the midpoint of the prior best quote); Effective Spread (%) is the average effective bid-ask spread, as a percentage of the quote midpoint, in 1990; Displayed Spread ($) is the average displayed bid-ask spread, in dollars, in 1990; and Displayed Spread (%) is the average displayed bid-ask spread, as a percentage of the quote midpoint, in 1990. Reported values are medians for each variable.
Market Effective Effective Displayed Number of Volume Capitalization Standard Spread Spread Displayed Spread
Market Makers (shares) ($Millions) Deviation Price ($) ($) (%) Spread ($) (%)
2 3 4 5 6 7 8 9
10 11 12 13 14 15 16 17 18 19
220
954 1140 2013 2469 4640 4392 5668 8232
10216 13681 15035 17728 17695 32123 34125 36913 38785 43053 99510
7.5 0.10 4.25 6.4 0.09 4.69
12.3 0.10 6.00 15.2 0.10 6.50 17.6 0.12 4.50 18.0 0.10 5.63 20.9 0.11 6.91 18.6 0.12 5.50 22.3 0.12 5.75 29.6 0.14 5.56 34.4 0.12 6.25 34.3 0.13 6.06 51.8 0.12 8.63 35.2 0.14 4.25 40.1 0.13 5.13 82.5 0.13 9.25 57.6 0.14 5.63 83.0 0.12 9.00
142.5 0.14 9.50
0.69 10.3 0.97 14.2 0.55 10.5 0.74 14.1 0.52 7.8 0.67 10.0 0.46 6.8 0.60 9.1 0.39 6.0 0.49 7.3 0.40 5.5 0.49 7.0 0.43 4.9 0.52 5.9 0.32 4.9 0.41 6.0 0.33 4.6 0.41 5.5 0.21 3.7 0.26 4.6 0.28 3.5 0.35 4.3 0.27 3.4 0.34 4.5 0.30 3.3 0.36 4.1 0.21 3.6 0.26 4.4 0.18 3.5 0.22 4.4 0.27 2.3 0.33 3.0 0.20 2.9 0.24 3.7 0.23 2.2 0.29 2.7 0.18 1.9 0.21 2.3
The first model in Table 2 indicates that volume is significantly related to the number of market makers, with an adjusted R2 of 70.7%. However, the number of trades alone is also significantly related to the number of market makers, with an adjusted R2 of 70.1% (Model 3). While the coefficient on trade size is also significant when trade size alone is used (Model 2), it does not explain as much of the cross- sectional variance, with an adjusted R2 of 15.1%. When both trade size and the number of trades are examined and used in place of volume (Model 6), both are significant, with an adjusted R2 of 70.8%. Since the two components of volume provide a more accurate representation of the underlying trading processes, subse-

M.A. Goldstein, E.F. Nelling/The Financial Review 34 (1999) 27-44 35
Table 2
OLS regression analysis of determinants of number of market makers for Nasdaq stocks This table reports the results of ordinary least squares regressions examining the relation between market making and trading activity in Nasdaq stocks. The estimated model is a variant of the form
log(Nmmkr) = Po + PJog(Vo1ume) + &log(Trade Size) + PJog(Number of Trades) + E
Where: Nmmkr is the number of market makers in the stock; Volume is the log of the average daily trading volume (in shares) during 1990; Trade Size is the average daily trade size for that stock during 1990; and Number of Trades is the average number of trades per day in that stock for 1990. Numbers in parentheses are standard errors. Each model used 1,878 observations.
Number of Adjusted Model # Intercept Volume Trade Size Trades RZ
P O PI PZ P3
1 -1.024** 0.354** 7 1 .O% (0.049) (0.005)
2 -1.732** (0.216)
3 1.239** (0.017)
0.545** 15.3% (0.030)
0.492** 71.4% (0.007)
4 0.696** 0.412** -0.3 lo** 74.1 % (0.125) (0.006) (0.021)
(0.096) (0.014) (0.020) 5 0.086 0.175** 0.264** 73.5%
6 0.353* (0.128)
0.127** 0.472** 72.1 % (0.0 18) (0.008)
** Indicates statistical significance at the 0.01 level. * Indicates statistical significance at the 0.05 level.
quent empirical analysis in this study will use trade size and the number of trades instead of volume.
3.2. Market making, bid-ask spreads, and trading activity
The analysis of the relations among market making, effective spreads, and trading activity begins with three OLS regressions based on the model of Grossman and Miller (GM). GM suggest that the number of market makers is a function of average trade size, the average number of trades, and the standard deviation of stock returns. Market capitalization is included to control for other potential differences among firms, such as the amount of information available to investors.
Although the model of GM first determines the number of market makers and then the spread, it is possible that in practice the size of the spread affects the number of market makers. The percent effective spread is therefore included as an
36 M.A. Goldstein, E.F. Nelling/The Financial Review 34 (1999) 27-44
explanatory variable. After taking the natural log of trade size, number of trades and market capitalization to reduce the effect of nonlinearities, the following model is estimated:
LnNummkr = Po + P,(LnTrdsize) + P2(LnNumtr) + P,(LnMktCap) + P4(Std dev) + P,(%Eff) + E (2)
In the model above and the ones that follow, the following abbreviations are used to describe variables: LnNmmkr is the log of the number of market makers in the stock; LnTrdsize is the log of the average daily trade size in shares; LnNumtr is the log of the average number of trades per day for that stock; LnMktCap is the log of market capitalization; Std dev is the standard deviation of the firm’s monthly stock return; and %Eff is the average effective bid-ask spread, as a percentage of the quote midpoint.
Also of interest is the relation between the percent effective spread and trading activity. GM suggest that the expected return on trading is a function of average trade size, the number of trades, price, standard deviation and the number of market makers. This relation is examined by the following model:
%Eff = Po + P,(LnTrdsize) + P,(LnNumtr) + P3(LnPrice) + P4(Std dev) + P,(LnNmmkr) + E (3)
Although not considered explicitly in the GM model, the frequency of trading is important in a number of models such as Ho and Stoll(l981). A positive correlation should exist between the number of trades and the number of market makers, since the greater liquidity supplied by the market makers would facilitate trading. Conversely, a larger displayed spread should make trades more costly, possibly reducing the number of trades. Finally, a larger market capitalization may imply a better known and thus more active stock. The above relations were examined using the following model:
LnNumtr = Po + P,(LnNmmkrs) + P,(%Eff) + P3(LnMktCap) + E (4)
The models described in Equations 2 through 4 are estimated for all firms in the sample. To help partition out the effects of the independent variables, the firms in the sample were divided into two groups based on their average daily trading volume. The analysis was then performed separately on the high and low volume groups.’
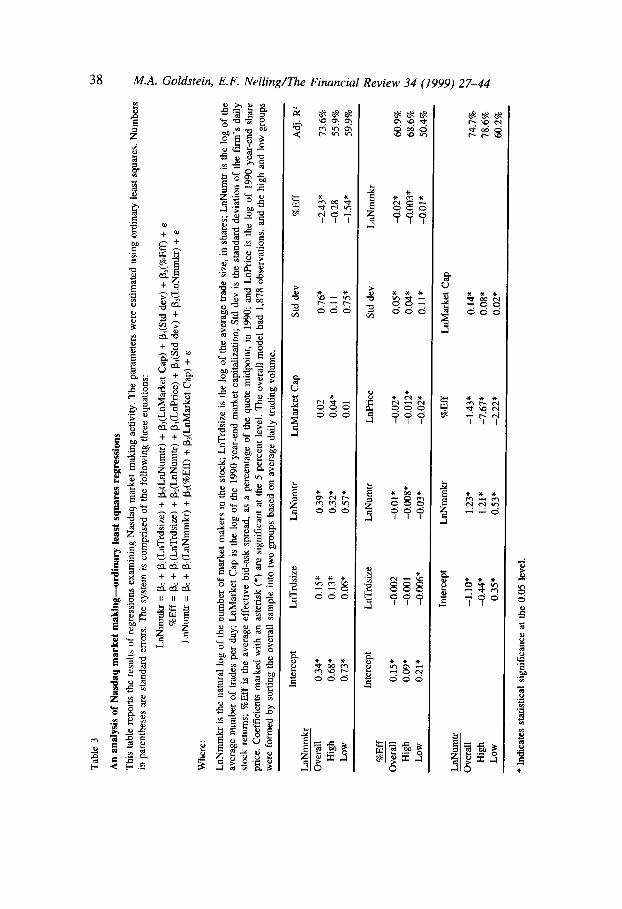
Table 3 reports the results of OLS regressions for the three models described above. The number of market makers is positively related to both trade size and the number of trades, suggesting that more frequent and larger trades occur in stocks with more market makers. The coefficient on firm size is positive and significant,
’ The sample was also segmented into two groups based on their market capitalization. The results are substantively similar to those obtained for the trading volume subgroups.
M.A. Goldstein, E.F. Nelling/The Financial Review 34 (1999) 27-44 37
indicating that larger stocks have more market makers. The standard deviation of returns is positively related to the number of market makers. This result appears to be counterintuitive. Perhaps stocks with greater price volatility tend to trade at wider spreads, holding other factors constant. These wider spreads may result in greater profits from market making. The coefficient on the percent effective spread is negative and significant, suggesting that competition among market makers reduces the effective spread, and thereby increases price improvement. The results of this model are consistent with the predictions of GM. The model also explains much of the cross-sectional variance in the number of market makers per stock, with an adjusted R2 of 71.4%.
For the second model, which examines the determinants of the percent effective spread, a significantly negative relation exists between the spread and the number of trades. This is to be expected, as stocks that trade more frequently tend to receive more price improvement, thus reducing the percent effective spread. Opposite to the predictions in GM, trade size is insignificant, and the coefficient on price, while significant, is negative. However, as predicted in GM, a significantly negative relation exists between the number of market makers and the effective spread, suggesting that competition among market makers reduces spreads. Overall, this model had an adjusted R2 of 60%.
The third model examines the determinants of trading activity, as measured by the number of trades. The coefficient on the number of market makers is positive and significant, suggesting that stocks with more market makers trade more fre- quently. Trading activity is inversely related to the percent effective spread, sug- gesting that narrower spreads induce more trades. The coefficient on market capital- ization is positive, suggesting that larger firms are more actively traded than smaller ones. Similar to the first two models, this model explained a significant amount of the variation in the dependent variable, with adjusted R2 of 73.7%.
Each of the three equations in Table 3 was then re-estimated for the high and low volume groups. The results for each equation for the high and low groups are substantively similar to each other and to the overall analyses, providing further support for the overall results.
4. An analysis of model specification
One issue that has received little attention in existing empirical research on market microstructure is the influence of model specification errors on the results. This study examines two potential sources of specification error. The first is the observation that one of the dependent variables, the number of market makers, is in the form of count data, i.e., it is a nonnegative integer. The second is that these equations may be determined jointly. For example, does the presence of more market makers result in increased trading, or does an increase in trading induce more brokers to make a market in the stock? In this section. the above models are estimated under
38 M.A. Goldstein, E.F. Nelling/The Financial Review 34 (1999) 27-44
M.A. Goldstein, E.F. Nelling/The Financial Review 34 (1999) 27-44 39
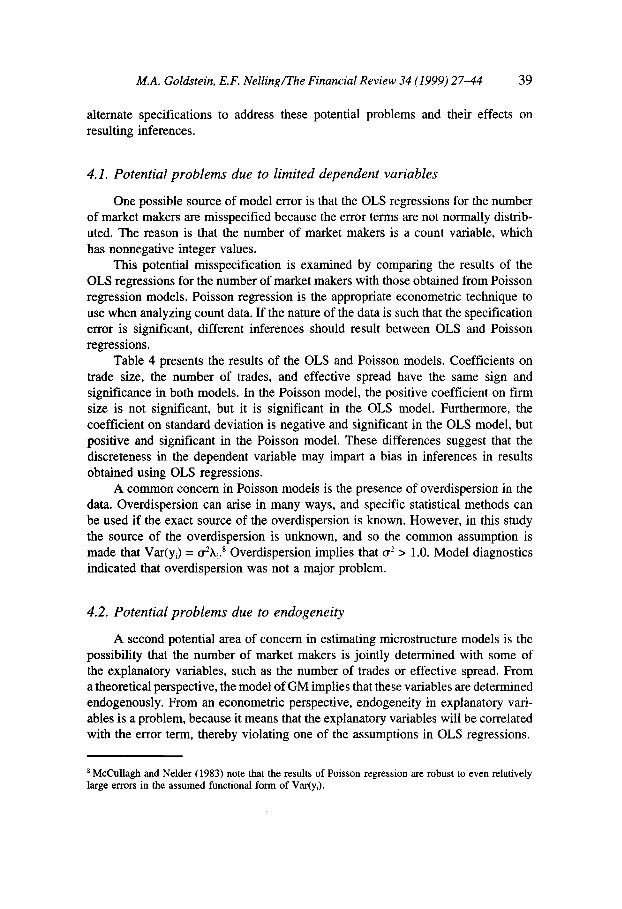
alternate specifications to address these potential problems and their effects on resulting inferences.
4. I . Potential problems due to limited dependent variables
One possible source of model error is that the OLS regressions for the number of market makers are misspecified because the error terms are not normally distrib- uted. The reason is that the number of market makers is a count variable, which has nonnegative integer values.
This potential misspecification is examined by comparing the results of the OLS regressions for the number of market makers with those obtained from Poisson regression models. Poisson regression is the appropriate econometric technique to use when analyzing count data. If the nature of the data is such that the specification error is significant, different inferences should result between OLS and Poisson regressions.
Table 4 presents the results of the OLS and Poisson models. Coefficients on trade size, the number of trades, and effective spread have the same sign and significance in both models. In the Poisson model, the positive coefficient on firm size is not significant, but it is significant in the OLS model. Furthermore, the coefficient on standard deviation is negative and significant in the OLS model, but positive and significant in the Poisson model. These differences suggest that the discreteness in the dependent variable may impart a bias in inferences in results obtained using OLS regressions.
A common concern in Poisson models is the presence of overdispersion in the data. Overdispersion can arise in many ways, and specific statistical methods can be used if the exact source of the overdispersion is known. However, in this study the source of the overdispersion is unknown, and so the common assumption is made that Var(y,) = Overdispersion implies that a' > 1.0. Model diagnostics indicated that overdispersion was not a major problem.
4.2. Potential problems due to endogeneity
A second potential area of concern in estimating microstructure models is the possibility that the number of market makers is jointly determined with some of the explanatory variables, such as the number of trades or effective spread. From a theoretical perspective, the model of GM implies that these variables are determined endogenously. From an econometric perspective, endogeneity in explanatory vari- ables is a problem, because it means that the explanatory variables will be correlated with the error term, thereby violating one of the assumptions in OLS regressions.
' McCullagh and Nelder (1983) note that the results of Poisson regression are robust to even relatively large errors in the assumed functional form of Var(y,).

40 M.A. Goldstein, E.F. Nelling/The Financial Review 34 (1999) 2 7 4 4
Table 4
Comparison of OLS and Poisson regression analysis of determinants of number of market makers for Nasdaq stocks This table reports the results of OLS and Poisson regressions examining the determinants of the number of market makers in Nasdaq stocks. The estimated OLS model is:
Nmmkr = + p,(LnTrdsize) + P2(LnNumtr) + P,(LnMarket Cap) + P,(Std dev) + P5(%Eff) + E
The estimated Poisson model is:
Log(Nmmkr) = log(Pa + P,(LnTrdsize) + P,(LnNumtr) + P,(LnMarket Cap) + P,(Std dev) + P,(%Eff)) + E
Where:
Nmmkr is the number of market makers in the stock LnTrade Size is the log of the average daily trade size (in shares) during 1990; LnNumtr is the log of the average number of trades per day for that stock during 1990; LnMarket Cap is the log of the 1990 year-end market capitalization; Std dev is the standard deviation of the fm’s monthly stock return from 1988-1990; and %Eff is the average effective bid-ask spread, as a percentage of the quote midpoint, in 1990. Numbers in parentheses are standard errors. The model used 1,878 observations.
~~
Intercept LnTrdsize LnNumtr LnMktCap Std Dev %Eff
(1.54) (0.22) (0.14) (0.11) (2.28) (3.17)
(0.12) (0.02) (0.01) (0.008) (0.17) (0.32)
OLS Regressions -10.43* 1.16* 5.75* 0.43* -0.93 -9.77*
Poisson Regressions 0.29* 0.19* 0.34* 0.001 0.68* -3.27*
* Indicates statistical significance at the 0.05 level.
The endogeneity assumption inherent in the GM model is addressed by estimat- ing the regression models in the previous section as a system of simultaneous equations to examine the relations among the variables. The first equation determines the number of market makers, the second determines the percent effective spread, and the third determines the average number of trades.
The effect of treating trading frequency as exogenous (as is assumed in the GM model) is examined by estimating two systems of simultaneous equations: one with just the first two equations (market making and effective spread) as per GM, and another with all three equations.
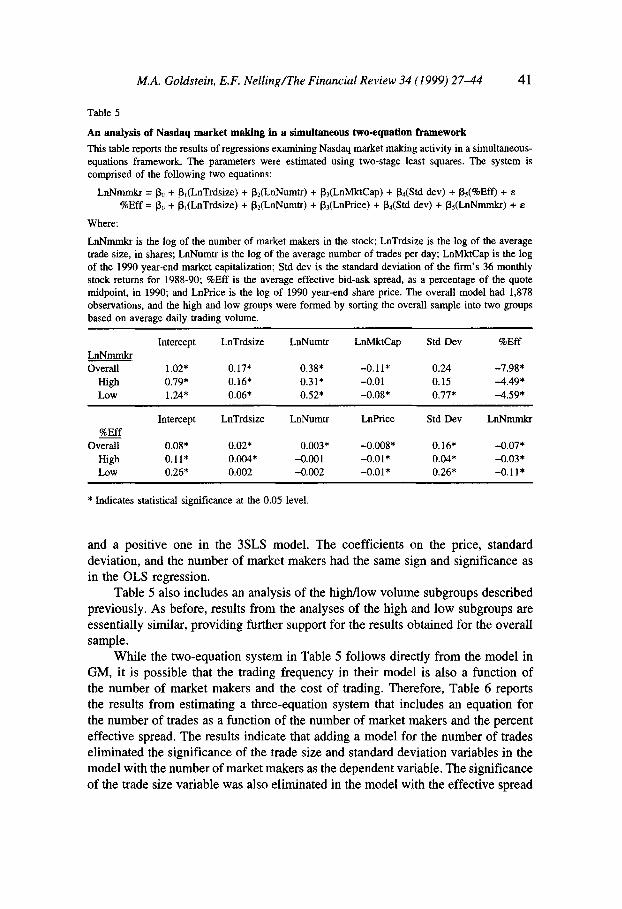
Table 5 presents the results of the simultaneous two-equation system estimated using three-stage least squares (3SLS). All of the variables in the first equation are significantly related to the number of market makers. The primary difference between this model and the OLS regression is that the coefficient on market capitalization is negative, suggesting that the number of market makers is inversely related to firm size, holding other variables constant.
In the model for percent effective spread, differences on the coefficients on the trading activity variables emerge between 3SLS and OLS estimation. The coeffi- cient on trade size is positive and significant under 3SLS, but negative and insignifi- cant under OLS. The trade size variable has a negative coefficient in the OLS model,
M.A. Goldstein, E.F. Nelling/The Financial Review 34 (1999) 27-44 41
Table 5
An analysis of Nasdaq market making in a simultaneous two-equation framework This table reports the results of regressions examining Nasdaq market making activity in a simultaneous- equations framework. The parameters were estimated using two-stage least squares. The system is comprised of the following two equations:
LnNmmkr = Po + P,(LnTrdsize) + pz(LnNumtr) + p3(LnMktCap) + P4(Std dev) + p,(%Eff) + E
%Eff = Po + P,(LnTrdsize) + P,(LnNumtr) + P,(LnPrice) + p4(Std dev) + p,(LnNmmkr) + E
Where:
LnNmmkr is the log of the number of market makers in the stock; LnTrdsize is the log of the average trade size, in shares; LnNumtr is the log of the average number of trades per day; LnMktCap is the log of the 1990 year-end market capitalization; Std dev is the standard deviation of the f m ' s 36 monthly stock returns for 1988-90; %Eff is the average effective bid-ask spread, as a percentage of the quote midpoint, in 1990; and Lnhice is the log of 1990 year-end share price. The overall model had 1,878 observations, and the high and low groups were formed by sorting the overall sample into two groups based on average daily trading volume.
Intercept LnTrdsize LnNumtr LnMktCap Std Dev %Eff LnNmmkr Overall 1.02* 0.17* 0.38* -0.11* 0.24 -7.98'
LOW 1.24* 0.06* 0.52* -0.08* 0.77* -4.59* High 0.79* 0.16* 0.3 1 * -0.01 0.15 -4.49*
Intercept LnTrdsize LnNumtr Lnhice Std Dev LnNmmkr %Eff
Overall 0.08* 0.02* 0.003* -0.008* 0.16* -0.07* High 0.11* 0.004* -0.001 -0.01* 0.04* -0.03* Low 0.26* 0.002 -0.002 -0.01* 0.26* -0.11*
* Indicates statistical significance at the 0.05 level.
and a positive one in the 3SLS model. The coefficients on the price, standard deviation, and the number of market makers had the same sign and significance as in the OLS regression.
Table 5 also includes an analysis of the higMow volume subgroups described previously. As before, results from the analyses of the high and low subgroups are essentially similar, providing further support for the results obtained for the overalI sample.
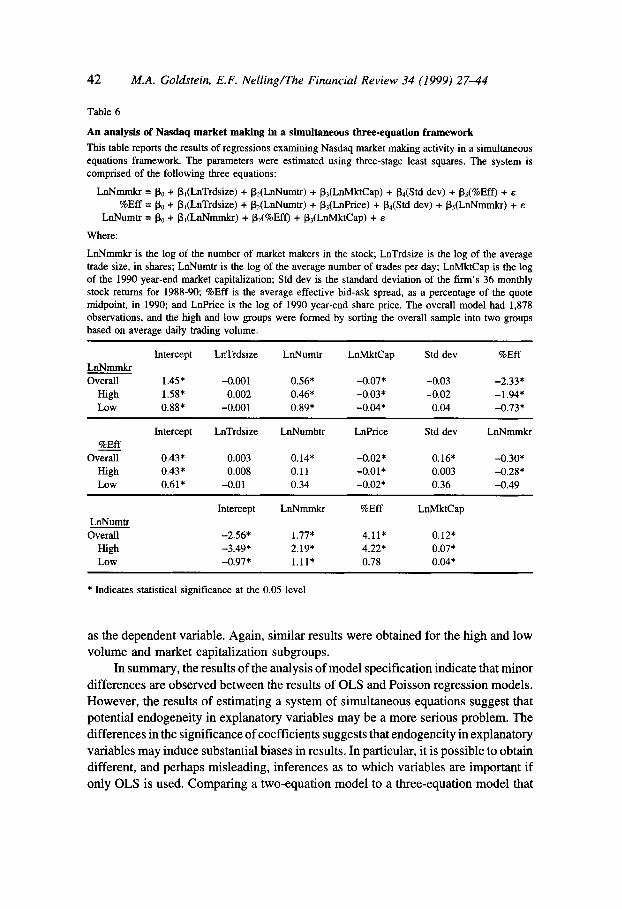
While the two-equation system in Table 5 follows directly from the model in GM, it is possible that the trading frequency in their model is also a function of the number of market makers and the cost of trading. Therefore, Table 6 reports the results from estimating a three-equation system that includes an equation for the number of trades as a function of the number of market makers and the percent effective spread. The results indicate that adding a model for the number of trades eliminated the significance of the trade size and standard deviation variables in the model with the number of market makers as the dependent variable. The significance of the trade size variable was also eliminated in the model with the effective spread
42 M.A. Goldstein, E.F. Nelling/The Financial Review 34 (1999) 2 7 4 4
Table 6
An analysis of Nasdaq market making in a simultaneous three-equation framework This table reports the results of regressions examining Nasdaq market making activity in a simultaneous equations framework. The parameters were estimated using three-stage least squares. The system is comprised of the following three equations:
LnNmmkr = Po + PdLnTrdsize) + PdLnNumtr) + P,(LnMktCap) + pa(Std dev) + P5(%Eff) + E
%Eff = Po + P1(LnTrdsize) + P,(LnNumtr) + P,(LnPrice) + P4(Std dev) + P,(LnNmmkr) + E
LnNumtr = Po + P,(LnNmmkr) + p2(%Eff) + p,(LnMktCap) + E
Where:
LnNmmkr is the log of the number of market makers in the stock LnTrdsize is the log of the average trade size, in shares; LnNumtr is the log of the average number of trades per day; LnMktCap is the log of the 1990 year-end market capitalization; Std dev is the standard deviation of the f m ’ s 36 monthly stock returns for 1988-90; %Eff is the average effective bid-ask spread, as a percentage of the quote midpoint, in 1990; and LnPrice is the log of 1990 year-end share price. The overall model had 1,878 observations, and the high and low groups were formed by sorting the overall sample into two groups based on average daily trading volume.
Intercept LnTrdsize LnNumtr Lnh4ktCap Std dev %Eff LnNmmkr Overall 1.45* -0.001 0.56* -0.07* -0.03 -2.33*
High 1.58* 0.002 0.46* -0.03* -0.02 -1.94* LOW 0.88* -0.001 0.89* -0.04* 0.04 -0.73*
Intercept LnTrdsize LnNumbtr LnPrice Std dev LnNmmkr %Eff
Overall 0.43* 0.003 0.14* -0.02* 0.16* -0.30* High 0.43* 0.008 0.11 -0.01* 0.003 -0.28* LOW 0.61* -0.01 0.34 -0.02* 0.36 -0.49
-
LnNumtr Overall
Intercept LnNmmkr %Eff LnMktCap
-2.56* 1.77* 4.11* 0.12* High -3.49* 2.19* 4.22* 0.07* LOW -0.97* 1.11* 0.78 0.04*
* Indicates statistical significance at the 0.05 level
as the dependent variable. Again, similar results were obtained for the high and low volume and market capitalization subgroups.
In summary, the results of the analysis of model specification indicate that minor differences are observed between the results of OLS and Poisson regression models. However, the results of estimating a system of simultaneous equations suggest that potential endogeneity in explanatory variables may be a more serious problem. The differences in the significance of coefficients suggests that endogeneity in explanatory variables may induce substantial biases in results. In particular, it is possible to obtain different, and perhaps misleading, inferences as to which variables are important if only OLS is used. Comparing a two-equation model to a three-equation model that

M.A. Goldstein, E.F. Nelling/The Financial Review 34 (1999) 27-44 43
considers trading frequency as endogenous indicates that it is trading frequency, and not trade size, that is of primary importance in market microstructure.
5. Conclusions and implications for future research
This paper has examined the cross-sectional relations between market making, effective bid-ask spreads, and trading activity for Nasdaq stocks using a framework based on the model of Grossman and Miller (1988). The empirical analysis herein uses appropriate econometric techniques to analyze potential sources of model specification error. These techniques include Poisson regression, a statistical tech- nique that is appropriate when the dependent variable, the number of market makers, is measured as a positive integer. A system of simultaneous equations addresses the endogeneity in explanatory variables related to market making and trading activity.
Volume is decomposed into its component parts of trade size and the number of trades, and the primary determinant of the number of market makers is found to be the number of trades, i.e., the frequency of trading. Firms that trade more frequently tend to have more market makers, and firms with more market makers tend to have smaller bid-ask spreads. In general, the results obtained are consistent with the predictions of Grossman and Miller (1988).
The findings also suggest that future empirical research on issues of market structure should conduct formal tests for endogeneity in explanatory variables. In addition, researchers may wish to examine explicitly the separate effects of trade size and trading frequency rather than the aggregate effect of volume. Econometri- cians may wish to develop techniques for treating limited dependent variables within a simultaneous-equations framework.
References
Angel, James J., 1997. Who gets price improvement on the NYSE? Working paper, Georgetown Uni- versity.
Battalio, Robert, Jason Greene, and Robert Jennings, 1997. Do competing specialists and preferencing dealers affect market quality? Review of Financial Studies 10, 969-993.
Blume, Marshall E. and Michael A. Goldstein, 1992. Displayed and effective spreads by market, Working paper 27-92, Rodney L. White Center for Financial Research, The Wharton School, University of Pennsylvania.
Blume, Marshall E. and Michael A. Goldstein, 1997. Quotes, order flow, and price discovery, Journal of Finance 52, 221-244.
Christie, William G. and Paul H. Schultz, 1994. Why do Nasdaq market makers avoid odd-eighth quotes?, Journal of Finance 49, 1813-1840.
Glosten, Lawrence R. and Paul R. Milgrom, 1985. Bid, ask and transaction prices in a specialist market with heterogeneously informed traders, Journal of Financial Economics 14, 7 1-100.
Goldstein, Michael A., 1994. Competitive specialist vs. dealer markets: effective and displayed spreads on Nasdaq NMS and the U.S. stock exchange system, University of Colorado College of Business faculty working paper series, 94-101.
Grossman, Sanford J. and Merton H. Miller, 1988. Liquidity and market structure, Journal of Finance 43, 617-633.
44 M A . Goldstein, E.F. NellingIThe Financial Review 34 (1999) 2744
Huang, Roger D. and Hans R. Stoll, 1996. Dealer versus auction markets: a paired comparison of
Ho, Thomas and Hans R. Stoll, 1981. Optimal dealer pricing under transactions and return uncertainty,
Lee, Charles M. C., 1993. Market integration and price execution for NYSE-listed securities, Journal
McCullagh, P., and J. A. Nelder, 1983. Generalized Linear Models (Chapman and Hall, New York). Petersen, Mitchell A. and David Fialkowski, 1994. Posted vs. effective spreads: good prices or bad
Stoll, Hans R., 1978. The pricing of security dealer services: an empirical study of Nasdaq stocks.
Tinic, Seha M. and Richard West, 1972. Competition and the pricing of dealer services in the over-the-
Wahal, Sunil, 1997. Entry, exit, market makers and the bid-ask spread, Review of Finuncial Studies 10,
Whitcomb, David K., 1988. Discussion of Grossman and Miller, Journal of Finance 43, 634-637.
execution costs on Nasdaq and the NYSE, Journal of Financial Economics 41, 313-357.
Journal of Financial Economics 9, 47-73.
of Finance 48, 1009-1038.
quotes? Journal of Financial Economics 35, 269-292.
Journul of Finance 33, 1153-1 172.
counter market, Journal of Financial and Quantitative Analysis 7 , 1707-1727.
871-901.