market in a circular economy - mdpi
TRANSCRIPT

resources
Article
Rational Behavior of an Enterprise in the EnergyMarket in a Circular Economy
Lazar Gitelman 1, Elena Magaril 2,* , Mikhail Kozhevnikov 1 and Elena Cristina Rada 3
1 Department of Management Systems for Energy and Industrial Enterprises, Ural Federal University,Mira str., 19, 620002 Ekaterinburg, Russia; [email protected] (L.G.); [email protected] (M.K.)
2 Department of Environmental Economics, Ural Federal University, Mira str., 19, 620002 Ekaterinburg, Russia3 Department of Theoretical and Applied Sciences, Insubria University of Varese, Via G.B. Vico, 46,
21100 Varese, Italy; [email protected]* Correspondence: [email protected]; Tel.: +7-912-63-98-544
Received: 2 March 2019; Accepted: 17 April 2019; Published: 19 April 2019�����������������
Abstract: In order to ensure their market sustainability, it is essential for energy-intensive industrialcompanies to address the issues of efficient energy use. Companies that are prepared to embrace tariffhikes, structural changes in fuel and energy markets, and a shortage of energy resources have a widerrange of options to respond to the new challenges posed by the external environment and to reducetheir risks. This task becomes particularly relevant in the context of the development of the circulareconomy that is aimed at resource optimization, energy conservation, zero-waste manufacturing,and business models that are based on maximum operational efficiency. This study aims to develop amethodology for rational behavior of the energy consumer in the context of the circular economy.The concept of “rational behavior” is defined by the authors as the intention to make the maximumuse of the advantages and potential of energy markets in order to reduce the cost of energy supply,increase the level of electrification in industrial production, and use the capabilities of their ownenergy business. The article describes the main principles of rational behavior that serve as thefoundation for effective implementation of various strategies (that of the seller, buyer, or both) in acompany. A link is shown between rational behavior and energy market potential management in acompany as a mix of technological, economic, and organizational activities performed by the energyconsumer in a competitive market and effective market risk management. Forms of off-grid powersupply and conditions for their application in manufacturing, for example, mini-combined heat andpower (CHP) plants and quadgeneration plants at large metallurgical facilities were analyzed.
Keywords: energy market; strategy; rational behavior; circular economy; business model; industrialenterprise; zero-waste production; recovered energy; energy management; energy costs
1. Introduction
The transition to a circular economy is a development priority for many countries. For example,China, Finland, Germany, Canada, and Japan are implementing a state policy facilitating such atransition [1–3]. The European Union adopted a roadmap that sets a 60% reduction target forhousehold solid waste by 2025 [4]. For that sake, a joint European circular economy stakeholderplatform was launched [5]. Similar goals are being set for the economy as a whole and for individualindustries, with the leading role being given to the energy sector as it both generates and consumes aconsiderable amount of various waste types. In Estonia and Poland, for example, the energy sectorgenerates around 20% to 30% of total waste [6]. Coupled with the mining industry (including fossilenergy sources), that amounts to 70%. In Russia, energy and mining sectors account for over 90% ofwaste [7,8].
Resources 2019, 8, 73; doi:10.3390/resources8020073 www.mdpi.com/journal/resources

Resources 2019, 8, 73 2 of 19
For the energy sector, including industrial power engineering, the principles of circular economycould be implemented along the following three trajectories [9–12]:
(1) Through closed-loop energy production. In this case, the main “action tactics” include givingpriority to renewable energy sources (RES), thorough planning of waste disposal processes,and their application in a repetitive production cycle;
(2) Through forming sustainable cooperation in the chain “energy sector–industry–utilitiessector–municipality (region)”. In this case, the goal is to optimize energy flows, design mechanismsfor minimizing energy losses, and develop distributed generation;
(3) Through integration with end consumers and creation of appropriate innovative businessmodels. From this perspective, the key tasks are to implement demand-side managementprograms, expand two-sided (platform) markets for electricity and heat, intensify electrificationof household and industrial processes, and adopt progressive technologies that provide forbetter energy efficiency, such as knowledge-intensive services and digital metering, monitoring,and power consumption systems.
The trajectories described above build upon the idea of the transition to zero-waste energyproduction, which involves the utilization of energy resources in a closed cycle starting with primaryraw materials, on to production and consumption, and ending with secondary raw materials (Figure 1).In the context of the first trajectory, it seems reasonable to use the technology of fluidized bedcombustion as it increases the generator efficiency, ensures environmental safety of power production,and makes it possible to recycle leftover ash in the production of construction materials. Another optionis to minimize waste by creating so-called off-the-grid power systems (Figure 2) that could consist ofphotovoltaic converters, a small-scale wood-chip-fired combined heat and power (CHP) plant, a dieselpower plant, a pellet-burning boiler house, and other equipment [13,14].
Resources 2019, 8, x FOR PEER REVIEW 2 of 20
energy sources), that amounts to 70%. In Russia, energy and mining sectors account for over 90% of waste [7,8].
For the energy sector, including industrial power engineering, the principles of circular economy could be implemented along the following three trajectories [9–12]: 1) Through closed-loop energy production. In this case, the main “action tactics” include giving
priority to renewable energy sources (RES), thorough planning of waste disposal processes, and their application in a repetitive production cycle;
2) Through forming sustainable cooperation in the chain “energy sector–industry–utilities sector–municipality (region)”. In this case, the goal is to optimize energy flows, design mechanisms for minimizing energy losses, and develop distributed generation;
3) Through integration with end consumers and creation of appropriate innovative business models. From this perspective, the key tasks are to implement demand-side management programs, expand two-sided (platform) markets for electricity and heat, intensify electrification of household and industrial processes, and adopt progressive technologies that provide for better energy efficiency, such as knowledge-intensive services and digital metering, monitoring, and power consumption systems. The trajectories described above build upon the idea of the transition to zero-waste energy
production, which involves the utilization of energy resources in a closed cycle starting with primary raw materials, on to production and consumption, and ending with secondary raw materials (Figure 1). In the context of the first trajectory, it seems reasonable to use the technology of fluidized bed combustion as it increases the generator efficiency, ensures environmental safety of power production, and makes it possible to recycle leftover ash in the production of construction materials. Another option is to minimize waste by creating so-called off-the-grid power systems (Figure 2) that could consist of photovoltaic converters, a small-scale wood-chip-fired combined heat and power (CHP) plant, a diesel power plant, a pellet-burning boiler house, and other equipment [13,14].
Figure 1. Energy for industrial use in circular economy.
The circular economy, however, necessitates the adoption of near-zero-waste production practices not only at a company level, but within a single eco-system that includes the energy sector, manufacturing, the utilities sector, and end consumers [15,16]. An example of the second trajectory is a neighborhood of Stockholm called Hammarby Sjöstad that was designed and constructed entirely in accordance with the canons of the closed-loop economy [17]. District heating and electricity, water supply, and sewage and waste handling utilities are integrated into a single technological system. Waste heat recovered from the sewage treatment plant, combined with heat issued from a local wood-chip-fired CHP plant, provides district heating. Methane gas from wastewater is processed into cooking and vehicular fuel, while its residual sludge reverts to fertilize the forest.
Figure 1. Energy for industrial use in circular economy.
The circular economy, however, necessitates the adoption of near-zero-waste production practicesnot only at a company level, but within a single eco-system that includes the energy sector,manufacturing, the utilities sector, and end consumers [15,16]. An example of the second trajectory is aneighborhood of Stockholm called Hammarby Sjöstad that was designed and constructed entirely inaccordance with the canons of the closed-loop economy [17]. District heating and electricity, watersupply, and sewage and waste handling utilities are integrated into a single technological system.Waste heat recovered from the sewage treatment plant, combined with heat issued from a localwood-chip-fired CHP plant, provides district heating. Methane gas from wastewater is processed intocooking and vehicular fuel, while its residual sludge reverts to fertilize the forest.

Resources 2019, 8, 73 3 of 19
Another example is an industry cluster in Denmark. Drugmaker Novo Nordisk, enzyme producerNovozymes, and DONG Energy, together with Denmark’s largest oil refinery, run by Statoil, swapwaste and byproducts [18]. Steam from DONG’s power station is pumped along pipelines aroundtown to the Novo Nordisk and Novozymes plants where it is used in several processes. The powerstation’s waste—ash and gypsum waste—are moved to a cement company and a plasterboard maker,respectively. Novo Nordisk and Novozymes wastewater is purified for municipal use, while theirleftover biomass is converted to fertilizer. Statoil also reduced emissions by turning waste sulfur andnitrogen into fertilizer and they also feed back used water to the power station and a water reservoir.
Resources 2019, 8, x FOR PEER REVIEW 3 of 20
Another example is an industry cluster in Denmark. Drugmaker Novo Nordisk, enzyme producer Novozymes, and DONG Energy, together with Denmark’s largest oil refinery, run by Statoil, swap waste and byproducts [18]. Steam from DONG’s power station is pumped along pipelines around town to the Novo Nordisk and Novozymes plants where it is used in several processes. The power station’s waste—ash and gypsum waste—are moved to a cement company and a plasterboard maker, respectively. Novo Nordisk and Novozymes wastewater is purified for municipal use, while their leftover biomass is converted to fertilizer. Statoil also reduced emissions by turning waste sulfur and nitrogen into fertilizer and they also feed back used water to the power station and a water reservoir.
Figure 2. An example of an off-the-grid power supply system at a manufacturing company.
Essential changes to production processes that happen in the context of circular economy lead to a transformation of business models at manufacturing companies (third trajectory). In the transformed models, profits are generated not only by the sale of end products and services, but mostly by means of optimization of material flows and diverse use of resources, materials, and end products for a continuous length of time. The focus of such models is on improving operational efficiency and organizational structures. Variants of such business models in the context of energy business are described in Table 1.
Table 1. Circular business models [19–22].
Type Characteristic Energy Sector Example
Circular value chains
Replacement of limited resources with fully renewable ones
Royal DSM created cellulosic bio-ethanol technology that converts agricultural residue
into renewable fuel
Recovery and reprocessing
Using technological capability for recovery and recycling of resources
Fortum runs circular economy village pilot projects. In the village, biowaste, plastic, metals, and fuels are processed to supply
energy to industrial facilities Extension of product life
cycle
Extension of economic life of a product through restoration, repair,
refurbishment, or remarketing
E.On carries out maintenance of energy equipment on the basis of the state of
generating assets Exchange and
joint consumption
Platforms for exchanging goods or assets with low utilization factor; creation of eco-systems bringing
The excess heat from Yandex's data center is collected and fed into the district heating
network in Mäntsälä (Finland); this reduces
Figure 2. An example of an off-the-grid power supply system at a manufacturing company.
Essential changes to production processes that happen in the context of circular economy lead toa transformation of business models at manufacturing companies (third trajectory). In the transformedmodels, profits are generated not only by the sale of end products and services, but mostly by meansof optimization of material flows and diverse use of resources, materials, and end products for acontinuous length of time. The focus of such models is on improving operational efficiency andorganizational structures. Variants of such business models in the context of energy business aredescribed in Table 1.
Table 1. Circular business models [19–22].
Type Characteristic Energy Sector Example
Circular value chains Replacement of limited resources withfully renewable ones
Royal DSM created cellulosic bio-ethanoltechnology that converts agricultural residue
into renewable fuel
Recovery and reprocessing Using technological capability forrecovery and recycling of resources
Fortum runs circular economy village pilotprojects. In the village, biowaste, plastic,metals, and fuels are processed to supply
energy to industrial facilities
Extension of product life cycleExtension of economic life of a
product through restoration, repair,refurbishment, or remarketing
E.On carries out maintenance of energyequipment on the basis of the state of
generating assets

Resources 2019, 8, 73 4 of 19
Table 1. Cont.
Type Characteristic Energy Sector Example
Exchange and joint consumption
Platforms for exchanging goods orassets with low utilization factor;creation of eco-systems bringing
together manufacturers,utilities and consumers
The excess heat from Yandex’s data center iscollected and fed into the district heating
network in Mäntsälä (Finland); this reducesYandex’ running costs, overall demand for
fuel for district heating purposes, and carbondioxide emissions
Product as service Customers use products by “renting”it on a pay-per-use basis
Philips retains the right of ownership of theenergy equipment it supplies; customers donot pay for installation and maintenance as
this constitutes the service part of the contract
On the one hand, the problem of adaptation of energy arrangements at manufacturing companiesto the needs of a circular economy appears quite solvable in terms of technical solutions, manyof which were already scientifically investigated and trialed in practice. The list of such solutionsincludes, first and foremost, measures to eliminate losses of energy carriers, energy recycling, an overallrational approach to energy consumption, and introduction of an energy management system [23–25].Other areas, however, are less researched. These include ways of fostering the rational behavior ofcompanies in energy markets and principles of creating off-grid power sources. This is mainly due tothe cross-disciplinary nature of such studies as they represent an integration of various innovativeaspects in the fields of technology, ecology, economics, market strategies, and competence of personnel.At the same time, generalizations applied to industrial power are not sufficiently developed, and theauthors’ research is devoted to this specific purpose.
The significance of the problem of companies’ behavior in energy markets is growing due to thetransition to a new energy paradigm that is defined by the development of small-scale generation andmicrogrids, active expansion of smart grids, transformation of energy and service markets, the emergence ofproactive consumers of various nature and, finally, “overall energy hyperconnectivity” [26]. Embracing thecircular economy concept, manufacturing companies are becoming active players in the energy market,thus discovering new opportunities for modernization of manufacturing operations and introduction ofinnovations. The Ellen MacArthur Foundation estimates that this could ensure a 3% increase in productivityannually [3,27]. Moreover, as our research shows, it is precisely these issues that are of the greatest interestto practitioners, both in terms of methodology and promotional tools.
The purpose of this paper is to construct a comprehensive view of the rational behavior of theenergy consumer in the framework of a circular economy, to determine basic strategies of manufacturingcompanies in the energy market and conditions for implementing such strategies effectively.
2. Materials and Methods
The research methodology consisted of several stages that made it possible to present approachesto solving the problem of developing energy market strategies for manufacturing companies.
In order to systematize approaches to shaping manufacturing companies’ behavior in energymarkets, a survey of experts was conducted in the first stage of the research to identify the most“popular” trends and problem areas of zero-waste production management as the priority goal of thecircular economy. In the second stage of the research, the authors sought to refine the terminologyin order to give more specific definitions to the conceptual aspects of behavior in energy markets.The concept of rational behavior of the energy consumer was introduced; its main principles wereexplained, along with the structure of the energy market potential of a manufacturing company.The methods that were used in this stage included decomposition, structural, logic, and visual analysis,and conceptual design [28,29]. Using the proposed conceptual framework along with content analysisenabled the authors to develop a classification and formulate a methodology for designing an energymarket strategy that takes into account both technical and economic features of energy arrangements

Resources 2019, 8, 73 5 of 19
at manufacturing companies operating in various industries, elimination of risks, and utilization of thecapabilities of the energy market, as well as justification for creating on-site power generation.
The empirical basis for the research is formed by data harvested from surveys and interviews withthe participation of 50 experts, among whom there were heads of energy companies, energy departmentsat major Russia-based metal companies, chemical companies, and power equipment manufacturers(Table 2). The objectives of the survey were to identify the main directions of the organization ofzero-waste production at the enterprises; priority organizational, economic, and technological problemsin the transition to zero-waste production and circular economy; formats of work of enterprises in theenergy markets; and specific cases for the introduction of advanced energy technologies, including thecreation on-site power generation.
Table 2. Pool of respondent enterprises surveyed.
Company IndustryNumber of Experts Interviewed The Proportion of
Respondents by IndustryTop Managers Line Managers
LLC “Bashkirenergo” Energy 2 2
30%PJSC Gazprom Energy 2 2
PJSC “T Plus” Municipal energy 2 2
Municipal UnitaryEnterprise “Vodokanal” Municipal energy 1 2
LLC “SIEMENS” Mechanicalproduction 1 2
24%JSC “SINARA-Transport Machines” Mechanical
production 1 2
JSC “The Ural Turbine Works” Mechanicalproduction 1 2
JSC “SVEL Group” Mechanicalproduction 1 2
LLC “Ural Mining MetallurgicalCompany” (UMMC) Metallurgy 2 2
28%JSC “TMK” Metallurgy 2 2
JSC “EVRAZ Nizhny TagilMetallurgical Plant” Metallurgy 1 2
PJSC Novolipetsk Iron and SteelWorks (NLMK Group) Metallurgy 1 2
LLC LUKOIL-Permnefteorgsintez Chemical industry 1 2
18%PJSC “Ural Rubber Technical
Products Plant” Chemical industry 1 2
LLC “SIBUR TOBOLSK” Chemical industry 1 2
Total 20 30 100%
3. Results and Discussion
3.1. Main Approaches to Zero-Waste Production Management in Industrial Energy Use
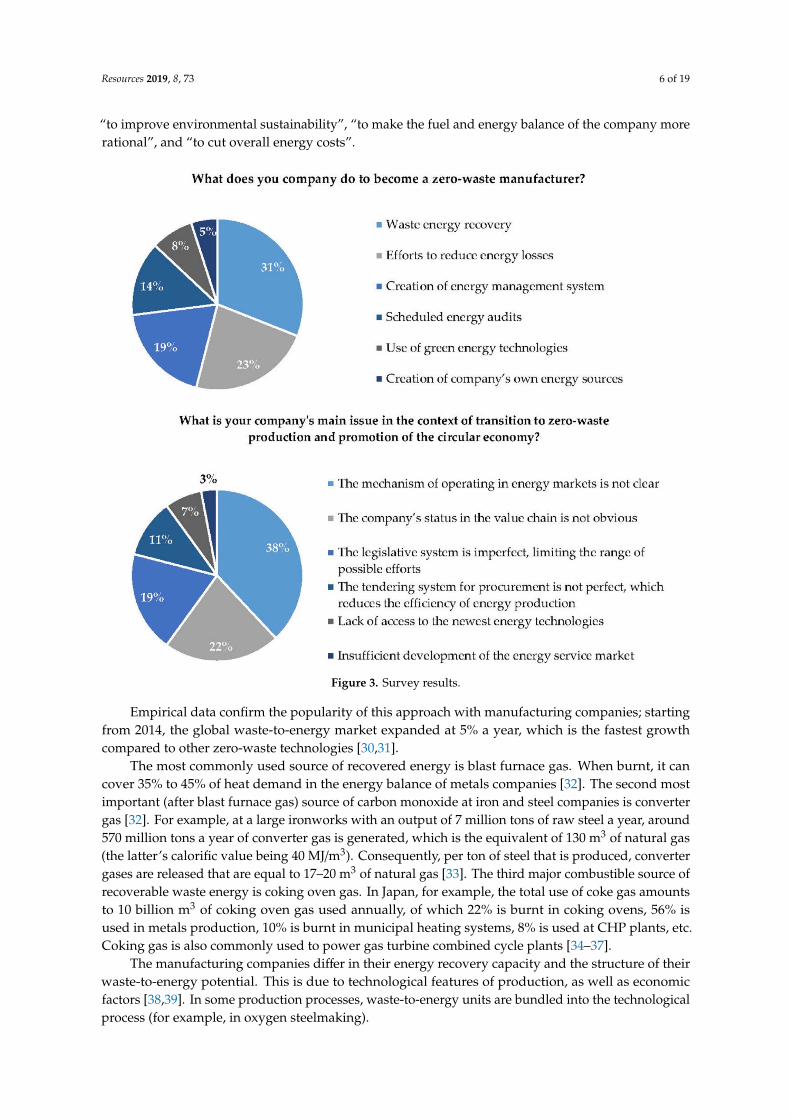
The conducted survey made it possible to identify the most common and “less popular”problem-prone areas in the development of zero-waste energy production in manufacturing. The useof recovered energy and reduction of energy losses under load conditions and in distribution linescould be classified as category one. One of the problem-prone areas is the process of decision-makingon entering energy markets (Figure 3).
According to the experts who took part in the survey, the use of recovered energy that constitutescompanies’ own internal sources of fuel and energy in today’s conditions makes it possible to “minimizemarket price risks in a situation of externally supplied energy”, “to improve the reliability and flexibilityof power supply”, “to increase the economic and energy efficiency of the core technological processes”,
Resources 2019, 8, 73 6 of 19
“to improve environmental sustainability”, “to make the fuel and energy balance of the company morerational”, and “to cut overall energy costs”.
Resources 2019, 8, x FOR PEER REVIEW 6 of 20
According to the experts who took part in the survey, the use of recovered energy that constitutes companies’ own internal sources of fuel and energy in today’s conditions makes it possible to “minimize market price risks in a situation of externally supplied energy”, “to improve the reliability and flexibility of power supply”, “to increase the economic and energy efficiency of the core technological processes”, “to improve environmental sustainability”, “to make the fuel and energy balance of the company more rational”, and “to cut overall energy costs”.
Figure 3. Survey results.
Empirical data confirm the popularity of this approach with manufacturing companies; starting from 2014, the global waste-to-energy market expanded at 5% a year, which is the fastest growth compared to other zero-waste technologies [30,31].
The most commonly used source of recovered energy is blast furnace gas. When burnt, it can cover 35% to 45% of heat demand in the energy balance of metals companies [32]. The second most important (after blast furnace gas) source of carbon monoxide at iron and steel companies is converter gas [32]. For example, at a large ironworks with an output of 7 million tons of raw steel a year, around 570 million tons a year of converter gas is generated, which is the equivalent of 130 m3 of natural gas (the latter’s calorific value being 40 MJ/m3). Consequently, per ton of steel that is produced, converter gases are released that are equal to 17–20 m3 of natural gas [33]. The third major combustible source of recoverable waste energy is coking oven gas. In Japan, for example, the total use of coke gas amounts to 10 billion m3 of coking oven gas used annually, of which 22% is burnt in coking ovens, 56% is used in metals production, 10% is burnt in municipal heating systems, 8% is
Figure 3. Survey results.
Empirical data confirm the popularity of this approach with manufacturing companies; startingfrom 2014, the global waste-to-energy market expanded at 5% a year, which is the fastest growthcompared to other zero-waste technologies [30,31].
The most commonly used source of recovered energy is blast furnace gas. When burnt, it cancover 35% to 45% of heat demand in the energy balance of metals companies [32]. The second mostimportant (after blast furnace gas) source of carbon monoxide at iron and steel companies is convertergas [32]. For example, at a large ironworks with an output of 7 million tons of raw steel a year, around570 million tons a year of converter gas is generated, which is the equivalent of 130 m3 of natural gas(the latter’s calorific value being 40 MJ/m3). Consequently, per ton of steel that is produced, convertergases are released that are equal to 17–20 m3 of natural gas [33]. The third major combustible source ofrecoverable waste energy is coking oven gas. In Japan, for example, the total use of coke gas amountsto 10 billion m3 of coking oven gas used annually, of which 22% is burnt in coking ovens, 56% isused in metals production, 10% is burnt in municipal heating systems, 8% is used at CHP plants, etc.Coking gas is also commonly used to power gas turbine combined cycle plants [34–37].
The manufacturing companies differ in their energy recovery capacity and the structure of theirwaste-to-energy potential. This is due to technological features of production, as well as economicfactors [38,39]. In some production processes, waste-to-energy units are bundled into the technologicalprocess (for example, in oxygen steelmaking).

Resources 2019, 8, 73 7 of 19
The efficiency of energy recovery also strongly depends on the operation cycles of machines andmechanisms generating waste energy. This is partly the reason why the utilization of waste energy isfairly low in the machinery industry [40].
In general, the practice of designing and calculating economic justification for energy recoveryinstallations, as well as their actual performance, shows that they produce significant efficiency gains.For example, the cost of “fuelless” steam that is generated by exhaust heat boilers is half the cost of thesteam produced by CHP plants. The efficiency of investment in energy recycling is two to three timeshigher than in the conventional fuel and energy industry. The most important outcome of energyrecovery is the saving of primary energy carriers. This is the main determining factor of the obtainedeconomic effect from the perspective of the circular economy.
Many of the companies analyzed by the authors constructed their own small-scale CHP plantsand on-site generators as part of programs aimed at improving energy efficiency and zero-wasteproduction. By doing so, they seek to realize a dual goal of reducing the cost of prime productionand going off the grid. Companies that possess big potential in terms of recyclable resources findthemselves in the most favorable situation.
For example, on-site electricity produced by Russia’s Magnitogorsk Iron and Steel Works is2.5 times cheaper than the market price because the company-owned power plants utilize blastfurnace gas, coke-oven gas, and other secondary energy sources, while transmission costs areminimal [41]. Novolipetsk Iron and Steel Works recycle furnace blast gas and coke-oven gas topower a waste-to-energy 150-MW and a 24-MW top-pressure recovery turbine plant consisting of twopressure recovery turbines as part of its “green” energy strategy. The facilities brought the share ofown-generated electricity in the company’s total consumption in 2016 to 54% [42]. EVRAZ Nizhny TagilMetallurgical Plant implemented a project to utilize a previously unused resource—converter gas—forgenerating steam in heat recovery boilers. This makes it possible to heat return water in the districtheating network. By installing the heat recovery equipment, the company was able to considerablyreduce the consumption of natural gas, thus improving the ecological footprint of generation andminimizing water loss and waste of chemical water treatment.
It has to be noted that the attitude of businesses to specific processes of the actual implementationof the above trends evolves in line with the economic situation and emergence of new technologies.For example, the cost of adding heat recovery equipment on the existing technologies in the iron andsteel industry might sometimes prove higher than core production costs.
Substantial and easily adoptable reserves for increasing resource efficiency can also be found inconventional technologies. For example, energy losses occur in all elements of the energy technologicalsystem, but the cost of eliminating them varies significantly. In this context, it is advisable to startenergy–economic analysis of the system starting from the end stage of the technological process becausethe lowest-cost energy-saving options are usually hidden in the process load.
Losses in distribution lines can also be substantial. For example, many manufacturing companiestypically sustain considerable heat losses in poorly insulated pipelines that lead to units using steam atdifferent pressure. There are also leaks from flange joins, threaded connections, etc. By detecting theabove sources of losses, it is possible to considerably reduce fuel and electricity consumption at thecompany’s boiler house and cut back on bills for externally supplied heat.
Despite the relatively strong “popularity” of this approach among the respondents, loss eliminationmeasures often prove too complicated a task. As a rule, the main difficulties stem from anineffective manufacturing culture that is still typical of the majority of developing countries [37,43].Consequently, it might be reasonable to recommend that a manufacturing company fine-tunes itssystem of energy management first and then moves on to implementing specific measures in the fieldof zero-waste production [44].

Resources 2019, 8, 73 8 of 19
3.2. Authors’ Definition of the Concept “Rational Behavior of the Energy Consumer”
There are several currently relevant tasks energy managers at manufacturing companies need toaddress both from the methodological and practical points of view. The priority for most of them is tominimize current expenditures on fuel and energy carriers, to design mechanisms for reducing theenergy intensity of production, and cost management. More complex tasks are associated with thedevelopment of rational behavior when taking part in operation in energy markets, construction ofappropriate energy market strategies, and making strategic decisions by the owners on creating thecompany’s own energy sources. The tasks could be solved within the framework of various approachesto energy cost management (Table 3).
Table 3. Methodological approaches to energy cost management in manufacturing.
Approach Conditions of Use Peculiarities
Minimization of energy costs
• There are limitations in terms ofequipment productivity, product quality,safety, and eco-friendlinessof production
• Consumer has no choice over energyprices and energy suppliers
• Main efforts are aimed at changing thestructure of replaceable energy carriersin favor of cheaper ones and transition toless energy-intensive types of products
Weaker connection between energycost management and efficiency
management in core production. As aresult, the introduction of advanced
energy intensive technologicalprocesses slows and product
innovations slow down; electricpower use per worker ratio and
electrification levels do not grow.
Optimization of energy costs
• High degree of competition inmain markets
• Uncertainty about energy prices andenergy market trends
• Main efforts are aimed at general energyconservation and higher energyefficiency of production, introduction ofnew technology, expansionof electrification
Energy costs might be higher ascompared to the first approach,
but opportunities emerge for thecompany’s technical development anddiversification of its energy business.
The approach based on energy cost minimization limits opportunities for the company’s technicaldevelopment, which means its efficiency will be frozen at the current level. This does not apply toextremely energy-intensive production facilities where electrification reaches the upper limit. In thatcase, cost minimization is the only possible option. The implementation of the more advanced conceptof energy cost optimization implies that the consumer is able to look for and freely choose among energysupply options, based on prices of energy carriers, energy suppliers, and various ancillary services.
Companies’ action strategy is built on the principles of rational behavior that the authors defineas “seeking to make the maximum use of advantages and capabilities of energy markets in order to cutenergy costs, increase the level of the electrification of manufacturing, and develop its own energybusiness while minimizing associated threats and risks”. The principles are as follows:
1. Motivation to cut (optimize) energy costs. Different consumers will tend to behave in a certain way inenergy markets depending on the power of their motivation to be proactive. It has to be observedthat positioning oneself as a knowledgeable consumer who operates as an independent buyer inthe wholesale market (proactive type of behavior) or as a customer of an energy provider (passivetype of behavior) does not mean by itself that measures aimed rationalization of energy processesand zero-waste management will prove ineffective. Such positioning could be prescribed by thetechnical characteristics of the consumer [45].
2. Monitoring of the company’s own energy market potential. Energy market potential describesthe technical, economic, and organizational prerequisites for maneuvering in a competitivemarket and effective management of market risks by the consumer. The concept and the
Resources 2019, 8, 73 9 of 19
corresponding characteristic property of a company need to be introduced in order to determinethe market status of the consumer, motivation to reduce energy costs and engage in energybusiness, the preparedness of energy managers to operate proactively in markets, and prioritymarket strategies.
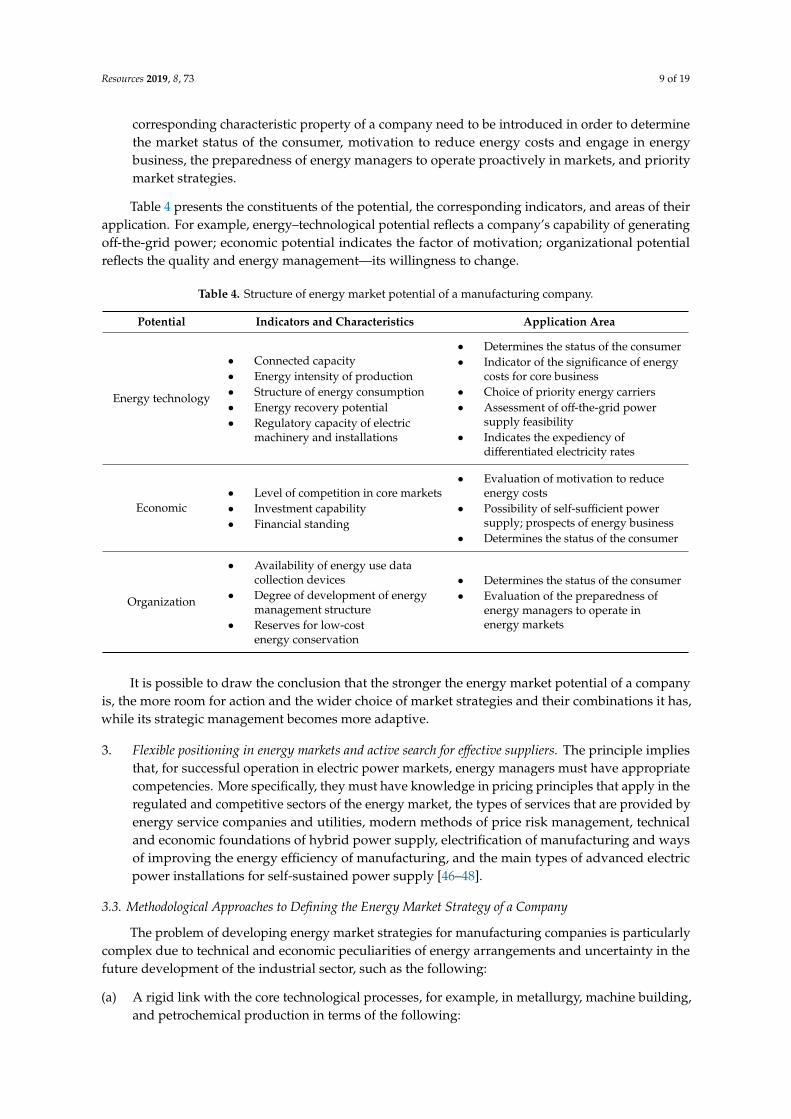
Table 4 presents the constituents of the potential, the corresponding indicators, and areas of theirapplication. For example, energy–technological potential reflects a company’s capability of generatingoff-the-grid power; economic potential indicates the factor of motivation; organizational potentialreflects the quality and energy management—its willingness to change.
Table 4. Structure of energy market potential of a manufacturing company.
Potential Indicators and Characteristics Application Area
Energy technology
• Connected capacity• Energy intensity of production• Structure of energy consumption• Energy recovery potential• Regulatory capacity of electric
machinery and installations
• Determines the status of the consumer• Indicator of the significance of energy
costs for core business• Choice of priority energy carriers• Assessment of off-the-grid power
supply feasibility• Indicates the expediency of
differentiated electricity rates
Economic• Level of competition in core markets• Investment capability• Financial standing
• Evaluation of motivation to reduceenergy costs
• Possibility of self-sufficient powersupply; prospects of energy business
• Determines the status of the consumer
Organization
• Availability of energy use datacollection devices
• Degree of development of energymanagement structure
• Reserves for low-costenergy conservation
• Determines the status of the consumer• Evaluation of the preparedness of
energy managers to operate inenergy markets
It is possible to draw the conclusion that the stronger the energy market potential of a companyis, the more room for action and the wider choice of market strategies and their combinations it has,while its strategic management becomes more adaptive.
3. Flexible positioning in energy markets and active search for effective suppliers. The principle impliesthat, for successful operation in electric power markets, energy managers must have appropriatecompetencies. More specifically, they must have knowledge in pricing principles that apply in theregulated and competitive sectors of the energy market, the types of services that are provided byenergy service companies and utilities, modern methods of price risk management, technicaland economic foundations of hybrid power supply, electrification of manufacturing and waysof improving the energy efficiency of manufacturing, and the main types of advanced electricpower installations for self-sustained power supply [46–48].
3.3. Methodological Approaches to Defining the Energy Market Strategy of a Company
The problem of developing energy market strategies for manufacturing companies is particularlycomplex due to technical and economic peculiarities of energy arrangements and uncertainty in thefuture development of the industrial sector, such as the following:
(a) A rigid link with the core technological processes, for example, in metallurgy, machine building,and petrochemical production in terms of the following:

Resources 2019, 8, 73 10 of 19
• The types, volume and parameters of products (steam, hot water, compressed air, oxygen);• Production modes;
(b) Correspondence between the composition of energy facilities and the technological structure ofcore production in terms of the following:
• Heat-generating equipment (CHP plants, boiler houses);• Type and quantity of company-run substations;• Waste energy recovery equipment (heat recovery boilers, steam accumulators, gas-holders, etc.);
(c) Dependence on the efficiency and characteristics of electrification (for example, replacement ofplasma arc or melting furnaces, as well as kilns, with electrical ones);
(d) Backing up of heat-generating units at company-run boiler houses and at CHP plants (for example,boilers or standby steam boilers).
Consequently, the strategy for industrial on-site power generation and energy use (especiallyregarding capacity expansion) is pegged to the growth strategy for core production. It can, however,have its own strategic goals that reflect areas such as reliability, energy efficiency, or the format ofparticipation in energy markets.
The authors define energy market strategy as a tool of implementing the principle of “rationalbehavior”. This tool is of practical value for the energy management of enterprises in determiningthe direction of actions to use the opportunities of the energy market that have different options andscenarios (Figure 4).
Resources 2019, 8, x FOR PEER REVIEW 10 of 20
• The types, volume and parameters of products (steam, hot water, compressed air, oxygen); • Production modes; b) Correspondence between the composition of energy facilities and the technological
structure of core production in terms of the following:
• Heat-generating equipment (CHP plants, boiler houses); • Type and quantity of company-run substations; • Waste energy recovery equipment (heat recovery boilers, steam accumulators, gas-holders, etc.);
c) Dependence on the efficiency and characteristics of electrification (for example, replacement of plasma arc or melting furnaces, as well as kilns, with electrical ones);
d) Backing up of heat-generating units at company-run boiler houses and at CHP plants (for example, boilers or standby steam boilers).
Consequently, the strategy for industrial on-site power generation and energy use (especially regarding capacity expansion) is pegged to the growth strategy for core production. It can, however, have its own strategic goals that reflect areas such as reliability, energy efficiency, or the format of participation in energy markets.
The authors define energy market strategy as a tool of implementing the principle of “rational behavior”. This tool is of practical value for the energy management of enterprises in determining the direction of actions to use the opportunities of the energy market that have different options and scenarios (Figure 4).
Figure 4. Range of strategic choices for a company considering operating in energy markets.
There are three basic strategies that can be identified for different companies. The following strategies reflect the above principles of rational behavior in energy markets: 1) Strategy of the buyer; 2) Strategy of the seller; 3) Combined strategy.
Figure 4. Range of strategic choices for a company considering operating in energy markets.
There are three basic strategies that can be identified for different companies. The followingstrategies reflect the above principles of rational behavior in energy markets:
(1) Strategy of the buyer;

Resources 2019, 8, 73 11 of 19
(2) Strategy of the seller;(3) Combined strategy.
The choice of a strategy is influenced by the technical and economic peculiarities of the energyarrangements at companies.
Strategy of the buyer (Figure 5). This strategy can be conventionally designated as “price searchstrategy”. It is suitable for companies that do not have their own power-generating installations andare not going to acquire them, or when the available generators only meet part of the demand forelectric power.
Resources 2019, 8, x FOR PEER REVIEW 11 of 20
The choice of a strategy is influenced by the technical and economic peculiarities of the energy arrangements at companies.
Strategy of the buyer (Figure 5). This strategy can be conventionally designated as “price search strategy”. It is suitable for companies that do not have their own power-generating installations and are not going to acquire them, or when the available generators only meet part of the demand for electric power.
Figure 5. Strategy of the buyer (“price search strategy”).
The technology employed by some manufacturing companies (for example, in electrometallurgy) determines the high energy intensity of production and the levels of electrification of industrial processes that are close to the upper limits. In that case, the strategic goal is to “minimize energy costs” by improving energy efficiency and choosing an optimal price of electricity on the basis of the technical and commercial reliability of suppliers and with the goal of encouraging energy conservation. At the same time, it is inexpedient in terms of the competitiveness of costs to try to get the lowest price if there are reserves for saving electricity in the processes where it is the only energy option. That would block investments in rationalizing energy arrangements at such production facilities. The ultimate decision has to be guided by the considerations of economic effectiveness and ensuring the required degree of reliability of power supply.
Other companies have technical and economic opportunities for using alternative energy carriers and increase the level of the electrification of industrial processes by replacing quality fuel with electricity (for example, in high-temperature processes in mechanical production). The natural result of exercising these options will be an increase in the ratio of energy costs to total production costs. On other hand, the integrated effect of electrification will yield a reduction in other elements of costs, higher equipment productivity, and better quality. As a result, the overall economic effectiveness of production grows.
This case matches a strategic goal that can be described as “optimization of energy costs” when the purpose of searching for a better price is to increase the economic competitiveness of electric power in comparison to the energy carrier being replaced (most often natural gas). This means that the upper limit for the electricity price will be determined by natural gas prices; thus, searching for the lowest possible price of electric power in order to meet the goal is quite reasonable.
Demand for electric power at a manufacturing company can be divided into three blocks that each cover specific consumers: groups of energy-consuming equipment and processes. Consequently, the strategic goals of the buyer will differ in relation to individual energy-consuming processes. For example, cost optimization matches the peculiarities of technology-determined
Figure 5. Strategy of the buyer (“price search strategy”).
The technology employed by some manufacturing companies (for example, in electrometallurgy)determines the high energy intensity of production and the levels of electrification of industrialprocesses that are close to the upper limits. In that case, the strategic goal is to “minimize energy costs”by improving energy efficiency and choosing an optimal price of electricity on the basis of the technicaland commercial reliability of suppliers and with the goal of encouraging energy conservation. At thesame time, it is inexpedient in terms of the competitiveness of costs to try to get the lowest price ifthere are reserves for saving electricity in the processes where it is the only energy option. That wouldblock investments in rationalizing energy arrangements at such production facilities. The ultimatedecision has to be guided by the considerations of economic effectiveness and ensuring the requireddegree of reliability of power supply.
Other companies have technical and economic opportunities for using alternative energy carriersand increase the level of the electrification of industrial processes by replacing quality fuel withelectricity (for example, in high-temperature processes in mechanical production). The natural resultof exercising these options will be an increase in the ratio of energy costs to total production costs.On other hand, the integrated effect of electrification will yield a reduction in other elements of costs,higher equipment productivity, and better quality. As a result, the overall economic effectiveness ofproduction grows.
This case matches a strategic goal that can be described as “optimization of energy costs” whenthe purpose of searching for a better price is to increase the economic competitiveness of electric powerin comparison to the energy carrier being replaced (most often natural gas). This means that the upperlimit for the electricity price will be determined by natural gas prices; thus, searching for the lowestpossible price of electric power in order to meet the goal is quite reasonable.

Resources 2019, 8, 73 12 of 19
Demand for electric power at a manufacturing company can be divided into three blocksthat each cover specific consumers: groups of energy-consuming equipment and processes.Consequently, the strategic goals of the buyer will differ in relation to individual energy-consumingprocesses. For example, cost optimization matches the peculiarities of technology-determinedconsumption that allows for electrification expansion (for example, furnaces can be powered by bothelectricity and gas). In this case, it is desirable to receive electricity at a stably low price. The goal of costminimization applies to electrical equipment and lighting, as electricity is practically the no-alternativeenergy carrier powering them; hence, higher prices generally encourage power conservation.
The “blocking” method proposed within the framework of the strategy of the buyer allowsfor well-grounded planning of demand for capacity and electricity, and to formulate case-specificrequirements to price limits and associated risks.
Strategy of the seller. The conventional name of the strategy is “energy business”. The followingbusiness processes are designed within the framework of the strategy:
• Generation and sale of electricity (capacity) in a retail and wholesale market;• Generation and sale of heat (capacity) in local markets;• Provision of technological services in a wholesale electricity market (under a contract with the
grid operator).
In order to engage in energy business, a company needs to have unused (excess) generatingcapacity. The capacity might emerge as a result of a cut in the company’s own energy consumptionthanks to energy-saving measures and ensuing changes in the company’s output and product range.Excess capacity also appears as a result of converting boiler houses into steam turbine plants and therenovation of on-site gas turbine power plants that are converted into CHP plants. Both main andbackup equipment could be used as commercial energy sources. Only large corporations can afford toconstruct a high-capacity CHP plant specifically for its energy business or to buy a stake in a largepower plant, as they possess the necessary investment and financial resources, and have access tocheap fossil fuels (for example, major oil- and gas-producing companies) [48].
When pursuing this strategy, one needs to remember that the competitiveness of an industrialCHP plant in heat and electricity markets is determined by a number of factors [49]. The first factor isthe technical and economic characteristics of generators, gas turbines, and combined cycle installationsbeing recognized as leaders in this regard. The second factor is fuel prices and the ratio betweenmarket prices of electricity and market prices of natural gas. Together, these two factors form the grossrevenue that a CHP plant must generate as a business-driven project. Thirdly, it is necessary to provideaccurate substantiation for the selling price at which both energy carriers will be offered. That willrequire effective price marketing arrangements and a method of distributing indirect costs of runningthe CHP plant. The method should be in line with the current market conditions. Another importantfactor is the cost of heat and the existence of potential buyers of thermal energy.
Combined strategy (Figure 6). The strategy is named “regulatory consumer”. A company thatpursues the strategy buys electricity (capacity) in different markets and also offers and supplies itsregulatory resource in the technology services market. Two schemes could be activated within theframework of the strategy: one involving controllable sets and another one utilizing backup generatorsfor meeting peak demand.
Flexible controllable units (for example, ferroalloy furnaces) must have the technical capabilityto shed the load during peak hours (up to complete stoppage) without any damage to the quality ofproducts. During night hours, they operate in a boost mode. The regulatory potential of the company’sflexible equipment might be demanded by the grid operator, for example, when there is insufficientbalance of generating capacity in the grid, a shortage of peak-hour capacity, etc. Additionally, suchservices will be paid for by the market operator at set prices (later at bid prices), and the providingcompany will be exempt from a charge for maintaining reserve capacity that is usually included in theelectricity price.

Resources 2019, 8, 73 13 of 19Resources 2019, 8, x FOR PEER REVIEW 13 of 20
Figure 6. Combined strategy “regulatory consumer”.
Flexible controllable units (for example, ferroalloy furnaces) must have the technical capability to shed the load during peak hours (up to complete stoppage) without any damage to the quality of products. During night hours, they operate in a boost mode. The regulatory potential of the company’s flexible equipment might be demanded by the grid operator, for example, when there is insufficient balance of generating capacity in the grid, a shortage of peak-hour capacity, etc. Additionally, such services will be paid for by the market operator at set prices (later at bid prices), and the providing company will be exempt from a charge for maintaining reserve capacity that is usually included in the electricity price.
3.4. Construction of Company’s Own Energy Sources
A company’s decision to go completely or partially off the grid and to start using its own energy source could be viewed as a kind of consumer choice and a response to economic threats and risks generated by energy markets [50,51]. The company may change its market status by turning from a buyer to a seller if its generating units operate in parallel with the energy system and supply excess energy and capacity (electric power and thermal energy) to the regional grid.
The expert survey conducted by the authors showed that manufacturing companies were guided by the following motivations when they constructed on-site generators: • Growing or unstable prices of electricity and heat; • Development of renewable energy sources and small-scale generation, along with a decrease in
the cost of RES equipment and technologies. For example, the price of a standard photovoltaic module in the world decreased tenfold over the past decade, while the total capacity of photovoltaic (PV) systems increased 15 times between 2008 and 2018 (Figure 7). Expert assessments of the so-called levelized cost of electricity from renewables are consistently indicating that the cost of electricity production from renewables is near that of electricity generated by means of conventional technologies [52–54];
• The external source of electricity supply does not meet the reliability requirements of the consumer; • Technical restrictions on connection of new consumers to the grid.
Figure 6. Combined strategy “regulatory consumer”.
3.4. Construction of Company’s Own Energy Sources
A company’s decision to go completely or partially off the grid and to start using its own energysource could be viewed as a kind of consumer choice and a response to economic threats and risksgenerated by energy markets [50,51]. The company may change its market status by turning from abuyer to a seller if its generating units operate in parallel with the energy system and supply excessenergy and capacity (electric power and thermal energy) to the regional grid.
The expert survey conducted by the authors showed that manufacturing companies were guidedby the following motivations when they constructed on-site generators:
• Growing or unstable prices of electricity and heat;• Development of renewable energy sources and small-scale generation, along with a decrease in the
cost of RES equipment and technologies. For example, the price of a standard photovoltaic modulein the world decreased tenfold over the past decade, while the total capacity of photovoltaic(PV) systems increased 15 times between 2008 and 2018 (Figure 7). Expert assessments ofthe so-called levelized cost of electricity from renewables are consistently indicating that thecost of electricity production from renewables is near that of electricity generated by means ofconventional technologies [52–54];
• The external source of electricity supply does not meet the reliability requirements of the consumer;• Technical restrictions on connection of new consumers to the grid.
There are also internal prerequisites, such as high electric power and thermal energy intensity ofproduction, the availability of the company’s own cheap fuel (recovered energy, production waste,secondary fuels), strong incentives to reduce energy costs, and the company’s investment capabilities.That leads one to a conclusion that even strong external motivating factors may fail to encourage everysingle consumer to fully switch over to off-the-grid energy sources unless it has the actual means andcapability to do that.
There are various forms of stand-alone power supply. They differ by the degree of theirindependence from external energy supply, type of generator, economic efficiency, and theircompatibility with the baseline characteristics of consumers and energy market parameters (Table 5).

Resources 2019, 8, 73 14 of 19Resources 2019, 8, x FOR PEER REVIEW 14 of 20
Figure 7. Growth of photovoltaics: ratio of installed capacity and cost of cells.
There are also internal prerequisites, such as high electric power and thermal energy intensity of production, the availability of the company’s own cheap fuel (recovered energy, production waste, secondary fuels), strong incentives to reduce energy costs, and the company’s investment capabilities. That leads one to a conclusion that even strong external motivating factors may fail to encourage every single consumer to fully switch over to off-the-grid energy sources unless it has the actual means and capability to do that.
There are various forms of stand-alone power supply. They differ by the degree of their independence from external energy supply, type of generator, economic efficiency, and their compatibility with the baseline characteristics of consumers and energy market parameters (Table 5).
Table 5. Forms of self-sufficient power supply and conditions for their application at manufacturing companies.
Form of Power Supply
Consumption Characteristics
Energy Market Characteristics
Type of Installation
Outcomes
Combined generation of electric and
thermal energy (cogeneration)
High electric and thermal intensity of
production; round-the-year
constant heat load; access to cheap
energy resources
High prices of electric and
thermal energy; low prices of natural gas;
restrictions on new grid
connections
Gas-turbine combined heat
and power (CHP) plants, small steam units with
coefficient of performance (COP) ≈ 90%;
energy-recovering units
Lower energy costs; income from selling
excess energy (capacity);
launch of new production capacity
Peak-load coverage
High load at peak times; electricity
consumption mode cannot be changed
High prices during peak
hours; restrictions on power supply
during peak hours
Peaking gas turbine units of various types
(efficiency ≈ 38–40%)
Peak time money saving; stable power supply during peak
load hours
Auxiliary consumption
High cost of thermal energy; high
High electricity prices; grid
Combined-cycle gas-turbine units,
Money saved on auxiliary electricity
Figure 7. Growth of photovoltaics: ratio of installed capacity and cost of cells.
Table 5. Forms of self-sufficient power supply and conditions for their application atmanufacturing companies.
Form of PowerSupply
ConsumptionCharacteristics
Energy MarketCharacteristics Type of Installation Outcomes
Combinedgeneration ofelectric and
thermal energy(cogeneration)
High electric andthermal intensity of
production;round-the-year
constant heat load;access to cheap
energy resources
High prices ofelectric and
thermal energy;low prices ofnatural gas;
restrictions on newgrid connections
Gas-turbine combinedheat and power (CHP)
plants, small steam unitswith coefficient of
performance (COP) ≈ 90%;energy-recovering units
Lower energy costs;income from selling excess
energy (capacity);launch of new
production capacity
Peak-load coverage
High load at peaktimes; electricity
consumption modecannot be changed
High prices duringpeak hours;
restrictions onpower supply
during peak hours
Peaking gas turbine unitsof various types
(efficiency ≈ 38–40%)
Peak time money saving;stable power supply
during peak load hours
Auxiliaryconsumption boilerhouse unit drives
High cost of thermalenergy; high
electricityconsumption by
auxiliary boiler units
High electricityprices; grid
disruptions andrestrictions
Combined-cyclegas-turbine units, smallsteam units (without an
electric generator)
Money saved on auxiliaryelectricity consumption;
higher reliability ofthermal supply for
production processes
Emergency powersupply
Presence ofresponsible power
consumers
High failure rate inpower supply
system
Diesel (multi-fuel)generators
Elimination (minimization)of damage from
interrupted power supply
The following types of energy installations are recommended for decentralized power supply ofmanufacturing companies:
• Combined-cycle gas turbines and gas-powered generators;• Small combined-cycle steam power plants with back pressure turbines;• Peaking gas turbine units (with an efficiency of 38 to 40%);• Diesel engine based combined-cycle power plants;• Peaking and backup diesel engine-based installations;• Steam and gas turbines for on-site industrial boiler houses (with the option to recover exhaust heat).
Small and medium combined-cycle gas-turbine units (0.5 to 20 MW) are the most attractive optionfor operation in a baseload mode. They are compact and fairly inexpensive (500 to 600 United States

Resources 2019, 8, 73 15 of 19
dollars (USD)/kW) yet highly efficient (up to 85 to 90%). The thermal efficiency of such units will bethe highest if the rated capacity of the gas turbine unit matches the guaranteed thermal load of theunit throughout the year [55]. Backup turbine units of industrial CHP plants with high flexibilitycharacteristics can prove economically efficient when used for meeting the system peak load and as apaid-for system emergency reserve. An important prerequisite for the wide application of small- andmedium-sized combined-cycle CHP plants is the possibility of adding them onto existing industrialgas-powered boiler houses in case of the renovation, expansion, or modernization of the latter [56,57].
There are a number of configurations of combined-cycle CHP plants with high thermal efficiencyand electricity generation capacity at the set thermal input. The simplest and most common one is thethermal scheme that envisages that heat energy is only generated by capturing the heat from exhaustgases in the turbines of gas-cooled heat exchangers (heat recovery boilers, heating or steam boilers).
The installation of small steam turbine generator sets at industrial boiler houses, especially thosepowered with residual oil and solid fuels, is globally recognized as a highly promising global trend [58].Turbines work instead of throttling devices—pressure-reducing valves—when the pressure of thepassing steam changes in transition between the boiler and extraction for industrial purposes, or theheat exchanger. Installing the turbines in parallel with throttling valves makes it possible to produceelectricity that is eight times cheaper than externally sourced electricity. Small steam turbine sets canbe used not only for driving generators, but also for propelling generator sets at all types of boilerhouses powered by industrial steam. This allows for cutting internal electric power consumption by70% to 80%. The replacement of a section of boilers at gas-powered boiler houses with combined-cyclegas turbine units will pursue the same goals.
There are, however, certain performance-related technical issues that hamper the economicefficiency of industrial energy sources utilizing advanced technologies [59]. For example, it can bedifficult to ensure that electricity produced at units at small-scale CHP plants operating in stand-alonemode meets the established quality standards [60]. However, it is much easier to do in the case ofparallel operation with the grid. The parallel mode increases short-circuit currents in the distributionnetwork that will have to be overhauled at a cost borne by the owner of the small-scale power plant.
Ural Mining and Metallurgical Company (UMMC), a leader of the global metal industry, is anexample of a company that actively expands it is own small-scale generation. One of its subsidiaries,Sredneuralsk Copper Smelter (SUMZ), launched a mini-CHP plant consisting of five 4.3-MW gasgenerator sets manufactured by Motoren WerkeManheim. The generators operate in cogenerationmode producing hot water. The annual electricity output of the mini power plant is 162 million kWhof thermal energy (97,000 Gcal). The CHP plant enabled SUMZ to not only improve the reliability ofpower supply at its facilities, to reduce energy costs and increase the energy and environmental safetyof production, but it was also a pilot project implemented by UMMC under a build–operate–transfer(BOT) contract, whereby an investor funds the construction of an on-site power generating facility thatis then leased to the contractor. The term of the lease is usually equal to the project payback period.When it ends, the facility is transferred into the ownership of the operator.
Another example that fully fits the peculiarities of the circular economy, as well as of industrialdigitalization trends, is the construction of a smart energy center to service UMMC’s greenhousecomplex in Yekaterinburg (Sverdlovsk Region, Russia). The energy center operates in isolation fromthe local distribution network (island mode). The installed capacity of the energy center is 26.4 MW forelectricity and 94.3 Gcal/hour for thermal energy, which meets the energy needs of the greenhousecomplex by practically 100% as energy costs account for up to 50% to 60% of the total costs of greenhousecrop production using supplemental lighting. Having a small CHP plant will not only make it possibleto minimize expenditure on externally sourced energy, but also to considerably increase crop yieldthanks to carbon dioxide recovered from exhaust gases.
The energy center employs a quadgeneration system combining the production of heat, carbondioxide, power generation, and refrigeration, which is a unique solution as heat is generated in parallelwith chill. In addition to the main energy components (electricity and heat), the gas generator set
Resources 2019, 8, 73 16 of 19
of the energy center produces a plant fertilizer—carbon dioxide—thanks to the CoDiNox r Catalyticsystem. The project also envisages the installation of absorption refrigerators that will eliminate themain drawback of greenhouse complexes that have to use water heaters in the summer to producecarbon dioxide while releasing excess heat into the environment. The UMMC energy center utilizesexcess heat in absorption refrigerators for generating chill to air-condition the sorting and packing area.
4. Conclusions
High costs of energy production and transmission, unstable energy process, and the urge toswitch over to a resource-saving and low-carbon model of business are a source of uncertainty,risks, and problems for companies in terms of efficient energy use. This is particularly relevant toenergy-intensive consumers who rely on costly and high-quality energy carriers (gas and electricpower) and who operate in a tough competitive environment.
The circular economy sets special requirements for energy management in manufacturing.This, first and foremost, means putting straight energy consumption in order to ensure the maximumconservation of energy down the entire production and process chain. These are purely organizationalmeasures that do not require big investment, but that have great potential in developing countries(improved accounting practices, energy-saving measures in universal processes such as lightning,electric engines, ventilation, heating).
At the same time, the study shows the increasing relevance of a strategic approach to manufacturingcompanies’ behavior in energy markets. In this regard, this study may be of particular interest fordeveloping countries that are in the final stage of energy liberalization, as well as for countries withcomplex energy market structures.
The conceptual framework that was developed by the authors allows for building a methodologicalbasis of such an approach to energy management and to ensure the participation of specialists fromdifferent fields of knowledge and practice in making interdisciplinary decisions. The proposedclassification of energy market strategies and areas of their application enables one to make a rationalchoice of behavior alternatives that match the specific marketing goals of a company. The choice canbe made through analyzing the technological peculiarities of production processes, determining themarketing goals of the company, verifying the volume of demand and the structure of demand for(supply of) the company’s core products, and the volume of energy that is required for production.
As small-scale generation technologies are getting increasingly advanced, having an on-site energysource is becoming more attractive as an option. Coupled with the penetration of smart technologies incore manufacturing practices and a transition to a new energy paradigm, conditions for comprehensiveutilization of reserves of various resources are created.
In this regard, this scientific paper opens up prospects for further research in a number of areas.On that score, the studies of the characteristics of the new stage of electrification determined by thetrends of the Fourth Industrial Revolution are relevant, as industrial enterprises are transforming intoactive consumers interested in implementing energy demand management programs and using newtechnological opportunities to customize production at a fast pace. Another major scientific task is thedefinition of competencies and the organization of advanced training of highly qualified specialistsand teams to work in the new energy paradigm conditions and markets.
Author Contributions: All authors contributed equally to the present work. Conceptualization and methodology,L.G. and M.K.; formal analysis and investigation, L.G., M.K., and E.M., writing—original draft preparation, M.K.;writing—review and editing, E.M. and E.C.R.; validation and visualization, E.C.R. and M.K.
Funding: This research received no external funding.
Acknowledgments: The work was supported by Act 211 of the Government of the Russian Federation, contractNO. 02.A03.21.0006.
Conflicts of Interest: The authors declare no conflicts of interest.
Resources 2019, 8, 73 17 of 19
Abbreviations
AC AccumulatorCHP plant Combined heat and power plantCOP Coefficient of performanceDPP Diesel power plantIV InverterRES Renewable energy sourcesPV PhotovoltaicPVC Photovoltaic convertersSP Solar panelsSTS Solar thermal power generation system
References
1. Ruiz-Real, J.L.; Uribe-Toril, J.; Valenciano, J.D.P.; Gázquez-Abad, J.C. Worldwide research on circular economyand environment: A bibliometric analysis. Int. J. Environ. Res. Public Health 2018, 15, 2699. [CrossRef]
2. Ghisellini, P.; Cialani, C.; Ulgiati, S. A review on circular economy: The expected transition to a balancedinterplay of environmental and economic systems. J. Clean. Prod. 2016, 114, 11–32. [CrossRef]
3. Towards the Circular Economy. Economic and Business Rationale for an Accelerated Transition.Ellen Macarthur Foundation. 2013. Available online: https://www.ellenmacarthurfoundation.org/assets/downloads/publications/Ellen-MacArthur-Foundation-Towards-the-Circular-Economy-vol.1.pdf (accessedon 24 February 2019).
4. Rada, E.C. Special Waste valorization and renewable energy generation under a circular economy: Whichpriorities? WIT Trans. Ecol. Environ. 2019, 222, 145–157. [CrossRef]
5. European Circular Economy Stakeholder Platform Names Its Coordination Group Members.Available online: https://ec.europa.eu/growth/content/european-circular-economy-stakeholder-platform-names-its-coordination-group-members_fr (accessed on 24 February 2019).
6. Zamparutti, T.; McNeill, A.; Moora, H.; Jõe, M.; Piirsalu, E. Circular Economy with Focus on Waste, RenewableEnergy and Sustainable Bioenergy in Estonia. Available online: http://www.europarl.europa.eu/RegData/
etudes/BRIE/2017/602038/IPOL_BRI(2017)602038_EN.pdf (accessed on 24 February 2019).7. OECD.Stat. Available online: https://stats.oecd.org (accessed on 24 February 2019).8. Russian Federation Federal State Statistics Service. Available online: http://www.gks.ru/wps/wcm/connect/
rosstat_main/rosstat/en/main/ (accessed on 24 February 2019).9. Pomponi, F.; Moncaster, A. A Theoretical Framework for Circular Economy Research in the Built Environment.
In Building Information Modelling, Building Performance, Design and Smart Construction; Dastbaz, M., Gorse, C.,Moncaster, A., Eds.; Springer: Cham, Switzerland, 2017; pp. 31–44. [CrossRef]
10. Gerasimenko, D.; Nikolayeva, I. Circular economy in Russia in the context of the UN Sustainable DevelopmentGoals and the Year of Ecology. Bridges 2017, 10. Available online: https://www.ictsd.org/bridges-news(accessed on 24 February 2019).
11. Donia, E.; Mineo, A.M.; Sgroi, F. A methodological approach for assessing businness investments in renewableresources from a circular economy perspective. Land Use Policy 2018, 76, 823–827. [CrossRef]
12. Giezen, M. Shifting infrastructure landscapes in a circular economy: An institutional work analysis of thewater and energy sector. Sustainability 2018, 10, 3487. [CrossRef]
13. Marchenko, O.V.; Solomin, S.V. Integrated use of renewable energy sources of different types for combinedheat and electricity production. Ind. Energy 2018, 5, 52–57.
14. Panepinto, D.; Zanetti, M.C.; Gitelman, L.; Kozhevnikov, M.; Magaril, E.; Magaril, R. Energy from Biomassfor Sustainable Cities. IOP Conf. Ser. Earth Environ. Sci. 2017, 72, 012021. [CrossRef]
15. Albores, P.; Petridis, K.; Dey, P.K. Analysing efficiency of Waste to Energy Systems: Using Data EnvelopmentAnalysis in Municipal Solid Waste Management. Procedia Environ. Sci. 2016, 35, 265–278. [CrossRef]
16. Cioca, L.I.; Ferronato, N.; Viotti, P.; Magaril, E.; Ragazzi, M.; Torretta, V.; Rada, E.C. Risk Assessment in aMaterials Recycling Facility: Perspectives for Reducing Operational Issues. Resources 2018, 7, 85. [CrossRef]
17. Brown, H. A Circular Energy Economy: Cross-Sector Successes in Brazil and India. Available online:http://ic-sd.org/wp-content/uploads/sites/4/2018/02/Hillary-Brown.pdf (accessed on 24 February 2019).

Resources 2019, 8, 73 18 of 19
18. Batova, N.; Sachek, P.; Tochitskaya, I. Circular economy in action: Forms of organization and best practices.BEROC Green Econ. Policy Pap. Ser. 2018, 5. Available online: http://eng.beroc.by/research/policy_papers/ge-5/
(accessed on 24 February 2019).19. Lahti, T.; Wincent, J.; Parida, V. A Definition and Theoretical Review of the Circular Economy, Value Creation,
and Sustainable Business Models: Where Are We Now and Where Should Research Move in the Future?Sustainability 2018, 10, 2799. [CrossRef]
20. Lacy, P.; Rutqvist, J. Waste to Wealth. The Circular Economy Advantage; Palgrave Macmillan: Basingstoke, UK, 2015.21. Gabriel, C.-A.; Kirkwood, J. Business models for model businesses: Lessons from renewable energy
entrepreneurs in developing countries. Energy Policy 2016, 95, 336–349. [CrossRef]22. Circular Advantage: Innovative Business Models and Technologies to Create Value in a World without Limits to
Growth. Available online: https://www.accenture.com/t20150523T053139__w__/us-en/_acnmedia/Accenture/
Conversion-Assets/DotCom/Documents/Global/PDF/Strategy_6/Accenture-Circular-Advantage-Innovative-BusinessModels-Technologies-Value-Growth.pdf (accessed on 24 February 2019).
23. Dobrova, K.B.; Danilochkina, N.G.; Cherner, N.V.; Dobrov, V.P.; Dobrov, P.P.; Sepiashvili, E.N.Innovational Management of Industrial Enterprises in the Energy Sector. Eur. Res. Stud. J. 2018, 21,447–458.
24. Păunescu, C.; Blid, L. Effective energy planning for improving the organization’s energy performance.Manag. Mark. Chall. Knowl. Soc. 2016, 11, 513–531. [CrossRef]
25. Ciacci, L.; Vassura, I.; Passarini, F. Shedding Light on the Anthropogenic Europium Cycle in the EU-28.Marking Product Turnover and Energy Progress in the Lighting Sector. Resources 2018, 7, 59. [CrossRef]
26. Semeria, M. Symbiotic Low-Power Smart and Secure Technologies in the Age of Hyperconnectivity.In Proceedings of the IEEE 62nd International Electron Devices Meeting (IEDM), San Francisco, CA, USA,3–7 December 2016; pp. 9–22. [CrossRef]
27. Gitelman, L.D.; Gitelman, L.M.; Kozhevnikov, M.V. Window of opportunity for sustainable energy. Int. J.Energy Prod. Manag. 2017, 2, 173–185. [CrossRef]
28. Ryzhuk, O.B.; Gitelman, L.D.; Kozhevnikov, M.V.; Bashorina, O.V.; Boyarinov, A.; Buntov, E.A.; Kuzmina, A.V.;Makarova, O.A.; Pishevskaya, E.S.; Polyakova, V.V.; et al. Visual Brainstorming in Concept ProjectDevelopment in the Power Industry. In Challenges and Solutions in the Russian Energy Sector, Innovation andDiscovery in Russian Science and Engineering, Series; Syngellakis, S., Brebbia, C., Gitelman, L.D., Magaril, E.R.,Eds.; Springer: Cham, Switzerland, 2018; pp. 243–250. [CrossRef]
29. Gitelman, L.D.; Ryzhuk, O.B.; Kozhevnikov, M.V. Visual analysis for conceptual design of complex systems.Int. J. Des. Nat. Ecodyn. 2018, 13, 166–175. [CrossRef]
30. World Energy Resources: Waste to Energy. Available online: https://www.worldenergy.org/wp-content/uploads/2017/03/WEResources_Waste_to_Energy_2016.pdf (accessed on 24 February 2019).
31. Themelis, N.J. An overview of the global waste-to-energy industry. Waste Manag. World 2003, 40–47.32. Mandal, M.K.; Sinha, O.P. Technological Changes in Blast Furnace Iron Making in India since Last Few
Decades. Int. J. Sci. Res. 2013, 2, 211–219.33. Dragna, E.C.; Ioana, A.; Constantin, N. Methods of steel manufacturing—The electric arc furnace. IOP Conf.
Ser. Mater. Sci. Eng. 2017, 294, 012017. [CrossRef]34. Branchini, L. Advanced Waste-to-Energy Cycles. Available online: http://amsdottorato.unibo.it/4696/1/Tesi_
Dottorato_Branchini.pdf (accessed on 24 February 2019).35. Campos, U.; Zamenian, H.; Koo, D.D.; Goodman, D.W. Waste-to-Energy (WTE) Technology Applications for
Municipal Solid Waste (MSW) Treatment in the Urban Environment. Int. J. Emerg. Technol. Adv. Eng. 2015, 5,504–508.
36. Ionescu, R.D.; Ragazzi, M.; Battisti, L.; Rada, E.C.; Ionescu, G. Potential of electricity generation fromrenewable energy sources in standard domestic houses. WIT Trans. Ecol. Environ. 2013, 176, 245–253.[CrossRef]
37. Perrot, J.-F.; Subiantoro, A. Municipal Waste Management Strategy Review and Waste-to-Energy Potentialsin New Zealand. Sustainability 2018, 10, 3114. [CrossRef]
38. Van Caneghem, J.; De Coster, E.; Vandenbergh, K.; De Broyer, S.; Lambrix, N.; Weemaels, L. Closing thehousehold metal packaging cycle through recovery of scrap from waste-to-energy bottom ash: The casestudy of Flanders. Resour. Conserv. Recycl. 2019, 144, 115–122. [CrossRef]

Resources 2019, 8, 73 19 of 19
39. Rada, E.C.; Ragazzi, M.; Torretta, V.; Castagna, G.; Adami, L.; Cioca, L.I. Circular economy and waste toenergy. AIP Conf. Proc. 2018, 1968, 030050. [CrossRef]
40. World Energy Resources: Waste to Energy. Available online: https://www.worldenergy.org/wp-content/uploads/2013/10/WER_2013_7b_Waste_to_Energy.pdf (accessed on 24 February 2019).
41. Magnitogorsk Iron and Steel Works. Annual Report 2015. Available online: http://eng.mmk.ru/upload/
iblock/632/Annual%20Report_2015.pdf (accessed on 24 February 2019).42. NLMK Annual Report 2016. Available online: https://nlmk.com/upload/iblock/6da/nlmk-draft-annual-
report-2016-eng.pdf (accessed on 24 February 2019).43. Sheltawy, S.; Al-Sakkari, E.; Fouad, M. Waste to Energy Trends and Prospects: A Review.
Available online: https://www.researchgate.net/publication/312137263_Waste_to_Energy_Trends_and_Prospects_A_Review (accessed on 24 February 2019).
44. Winston, A.; Favaloro, G.; Healy, T. Energy Strategy for the C-Suite. Available online: https://hbr.org/2017/01/
energy-strategy-for-the-c-suite (accessed on 24 February 2019).45. Perillo, G. Energy Management as Production Input. WIT Trans. Ecol. Environ. 2016, 205, 3–9. [CrossRef]46. Dudin, M.N.; Reshetov, K.Y.; Mysachenko, V.I.; Mironova, N.N.; Divnenko, O.V. Green Technology and
Renewable Energy in the System of the Steel Industry in Europe. Int. J. Energy Econ. Policy 2017, 7, 310–315.47. Olson, E.G. Creating an enterprise-level “green” strategy. J. Bus. Strategy 2008, 29, 22–30. [CrossRef]48. Lyaskovskaya, E.A.; Kurbangaliev, M.R. Energy management of industrial enterprise. SHS Web Conf. 2017,
35, 01129. [CrossRef]49. Simchak, T.; Davis, S. Combined Heat and Power for Industrial Revitalization. Policy Solutions to Overcome
Barriers and Foster Greater Deployment. Available online: http://ccap.org/assets/White-Paper_Combined-Heat-and-Power-for-Industrial-Revitalization_CCAP_July-20131.pdf (accessed on 24 February 2019).
50. Tchorzewska-Cieslak, B.; Pietrucha-Urbanik, K.; Urbanik, M.; Rak, J.R. Approaches for Safety Analysis ofGas-Pipeline Functionality in Terms of Failure Occurrence: A Case Study. Energies 2018, 11, 1589. [CrossRef]
51. Tchórzewska-Cieslak, B.; Pietrucha-Urbanik, K. Approaches to Methods of Risk Analysis and AssessmentRegarding the Gas Supply to a City. Energies 2018, 11, 3304. [CrossRef]
52. International Energy Outlook 2016. Available online: https://www.eia.gov/outlooks/ieo/pdf/0484(2016).pdf(accessed on 24 February 2019).
53. Dorris, G.; Blanco, C. Navigating the New Energy Market Dynamics. Available online: https://www.ascendanalytics.com/assets/er0218-technical_7.pdf (accessed on 24 February 2019).
54. Candelise, C.; Winskel, M.; Gross, R. The dynamics of solar PV costs and prices as a challenge for technologyforecasting. Renew. Sustain. Energy Rev. 2013, 26, 96–107. [CrossRef]
55. Oyedepo, S.O.; Fagbenle, R.O.; Adefila, S.S.; Adavbiele, S.A. Performance evaluation and economic analysisof a gas turbine power plant in Nigeria. Energy Convers. Manag. 2014, 79, 431–440. [CrossRef]
56. Ishikawa, M.; Terauchi, M.; Komori, T.; Yasuraoka, J. Development of High Efficiency Gas Turbine CombinedCycle Power Plant. Mitsubishi Heavy Ind. Tech. Rev. 2008, 45, 15–17.
57. Larsson, E. Diagnosis and Supervision of Industrial Gas Turbines. Available online: https://www.vehicular.isy.liu.se/Publications/Lic/12_LIC_1528_EL.pdf (accessed on 24 February 2019).
58. Wu, X.; Shen, J.; Li, Y.; Lee, K.Y. Steam power plant configuration, design, and control. Wiley Interdiscip. Rev.Energy Environ. 2015, 4, 537–563. [CrossRef]
59. Electricity End Uses, Energy Efficiency, and Distributed Energy Resources Baseline: Industrial Sector Chapter.Available online: https://emp.lbl.gov/sites/all/files/end_use_baseline-industrial_sector-final.pdf (accessed on24 February 2019).
60. Gu, C.; Xie, D.; Sun, J.; Wang, X.; Ai, Q. Optimal Operation of Combined Heat and Power System Based onForecasted Energy Prices in Real-Time Markets. Energies 2015, 8, 14330–14345. [CrossRef]
© 2019 by the authors. Licensee MDPI, Basel, Switzerland. This article is an open accessarticle distributed under the terms and conditions of the Creative Commons Attribution(CC BY) license (http://creativecommons.org/licenses/by/4.0/).