mark jones - - working with residents to deliver quality … 2 php local 145a/b/c % satisfaction...
TRANSCRIPT

(includes all performance indicators up to the end of 31/3/2016)

Poole Housing Partnership Quality Homes in Strong Communities
Introduction
This in-house publication is designed, collated and published on a quarterly basis by
the Performance Monitoring Officer at PHP.
New for 2015/6 - reports are now split into three ‘themes’ each with a dashboard
page summarising selected key indicators, some new ‘capability’ charts which help to
explain performance for certain indicators together with the usual bar graphs for
each area.
Section Content
A. Reports Key
B. Key to Capability Charts
C. Report Index
D. Adding Value Theme Overview
o Individual PI graphs (pages 1-12)
E. Managing The Stock Theme Overview
o Individual PI graphs (pages 13-29)
F. Strong and Sustainable Communities Theme Overview
o Individual PI graphs (pages 30-40)
Any queries regarding this publication should be addressed to the Performance
Monitoring Officer (direct telephone 01202-264401)
Poole Housing Partnership Ltd
Beech House, 28-30 Wimborne Road, Poole , Dorset BH15 2BU
website: www.yourphp.org.uk
(Poole Housing Partnership is a company controlled by the Borough of Poole)

Key to Reports
94.0%
98.0%
95.7%
92.9%
2004/5
may
jul
sep
nov
jan
mar
80% 82% 84% 86% 88% 90% 92% 94% 96% 98% 100%
% of repairs within time limit
Responsible Manager
Mark Jones -Technical Services
Criteria UsedReported monthly, on a cumulative basis,
shown as a %.
Comments
Actual performance for 2004/5 did not meet target of 95%.
PHP LOCAL 20 - % of urgent repairs carried out within Government time limits
RESPONSIVE REPAIRS
HOUSEMARK ALMO PI CLUB BENCHMARKING
2004/5 - Ranked20 out of 31
On some of the reports (ie where there are targets),the background colours here illustrate how actual performance compares v. target. Thus, in the example above:
actual performance in the green range of 98-100% = good performance the amber range (93-98%) = performance with room for improvement the red range (below 93%) = performance where there is cause for
concern (eg May 2005 at 92.9% in this example) A
Example graph

Capability Charts
Capability charts are a way of showing KPIs in a different way. As well as showing an average for costs or timescales, for example, capability charts show ‘normal’ variation for a given period of time. For example, taking all repair costs over 3 months could show a normal variation of between £20 and £250, meaning that all repairs between these values are typical or ‘normal’ for the service. This then means anything ABOVE £250 could be a cause for concern and by showing specific jobs over this amount, the manager for that team can focus on those considered above normal. This would apply to timescales, for example void re-let times. PHP intends to use capability chart analysis as well as averages moving forward, where relevant and appropriate to KPI reporting and service management. Using this method of reporting over time also gives a better insight into what could be considered normal variation.
B
Example graph

REPORT INDEX
Latest performance against our targets is reflected by the use of a background colour as shown below:
shows good performance, on or better than target
shows performance where there is room for improvement
shows performance where there is cause for concern
shows performance where there are no set targets (although the aim is usually for 100% or occasionally, zero)
Trends for Q4 (against 1415 performance) are highlighted by the direction of an arrow:
shows performance improving (or maintained at an optimum level)
shows stable performance
shows performance deteriorating
ADDING VALUE THEMEAccess & Customer Care
n/a Page 1 PHP Local 30a Number of complaints dealt with under the complaints procedure
Page 2 PHP Local 145a/b/c % satisfaction with handling of complaints
Page 3 PHP Local 33 % of residents letters answered within 10 working days
Page 4 PHP Local 73 % of visitors to reception seen within 5 minutes of their appointment
CapacityPage 5 PHP Local 37 Number of working days lost due to sickness absence (ave per employee) per annum
Financial InclusionPage 6 PHP Local 152 Number of Finance checks completed
Page 7 PHP Local 153 Total Annual Benefit Gain identified
Financial ManagementPage 8 PHP Local 84 The percentage of invoices for commercial goods and services that were paid by PHP
within 30 days of such invoices being received by PHPGovernancePage 9 PHP Local 47 % of Board Members attendance at meetings
Income ManagementPage 10 PHP Local 85 Proportion of rent collected (ex BVPI 66a)
Page 11 PHP Local 86 Proportion of current tenants with more than 7 weeks arrears
Information Technologynew Page 12 PHP Local 158/406 Number of Website Visits/No of Facebook 'likes'
MANAGING THE STOCK THEMECapital Programme
Page 13 PHP Local 307 % of properties decent
Planned Maintenance and Health & Safety Page 14 PHP Local 92 Avg SAP rating of LA dwelling
Page 15 PHP Local 24 Number of properties where gas servicing not taken place
new Page 16 PHP Local 300b % of communal areas where asbestos review surveys overdue
new Page 17 PHP Local 301 % of communal legionella assessments completed
new Page 18 PHP Local 302 % of dwellings with a current electrical test certificate
new Page 19 PHP Local 303 % of communal areas with a current specific Fire Risk Assessment
Response RepairsPage 20 PHP Local 305 Average cost of Spectrum Property Care works
n/a Page 21 PHP Local 305a Variation for Spectrum Property Care response repair costs (capability chart)
n/a Page 22 PHP Local 306 No of Response Repairs (completed)
Page 23 PHP Local 22 % response repairs completed on 1st visit
Voids ManagementPage 24 PHP Local 3 Avg relet time for LA dwellings (cal days)
n/a Page 25 PHP Local 308 Normal variation for relet times - ALL (capability chart)
new Page 26 PHP Local 10a Avg cost of void work - GN
new Page 27 PHP Local 10b Avg cost of void work - SH
n/a Page 28 PHP Local 309 Normal variation void costs - GN (capability chart)
n/a Page 29 PHP Local 309a Normal variation void costs - SH (capability chart)
STRONG AND SUSTAINABLE COMMUNITIES THEMEASB
n/a Page 30 PHP Local 60a Number of new ASB cases (all)
n/a Page 31 PHP Local 151 Number of ASB cases closed (all)
n/a Page 32 PHP Local 60n Normal variation for ASB case to be opened (capability chart)
Estate Managementnew Page 33 PHP Local 501 % estates graded
new Page 34 PHP Local 501a % estates achieving 'A' or 'B' grades
Housing ManagementPage 35 PHP Local 62 # & % NTV (GN) within 8 week target
Page 36 PHP Local 62a # & % NTV (Sheltered) within 8 week target (all areas)
new Page 37 PHP Local 64 Total number of TRVs completed each month
Resident Involvementnew Page 38 PHP Local 35 # involved residents
Supporting the most vulnerablenew Page 39 PHP Local 503 Number of volunteers
Page 40 PHP Local 503d Number residents moved via Under-occupation Project
C

KPI Dashboard - Adding Value
Reporting Period Q4 - 2015/6 (last updated on 23/5/16)
Access and Customer Care Timescale 14/15 Target Q1 Q2 Q3 Q4 Actual Trend Notes
Number of complaints received quarter 42 No target 9 18 12 4 43 14/15 is yearly total-Actual is yearly total
Number of compliments received quarter NEW No target 51 45 44 78 218 NEW 14/15 is yearly total-Actual is yearly total
% Visitors to reception seen within 5 minutes of their appointment quarterly average 92.1% No target 85.1% 91.3% 97.1% 90.0% 90.9% 14/15 is yearly average- Actual is yearly average
% of residents letters answered within 10 working days (all teams) quarterly average 96.8% No target 98.0% 94.3% 92.3% 85.0% 92.4% 14/15 is yearly average- Actual is yearly average
Capacity 14/15 Target Q1 Q2 Q3 Q4 Actual Trend Notes
Number of working days lost due to sickness absence last 12 months 8.3 8.5 8.6 8.7 7.4 7.0 7.0 14/15 is yearly total-Actual is quarterly (cumulative) - quarterly figures are for the previous 12 months (rolling basis)
Financial Inclusion 14/15 Target Q1 Q2 Q3 Q4 Actual Trend Notes
Number of Finance checks completed quarter 89 No target 135 192 142 115 584 14/15 is average number per quarter-Actual is yearly total
Total savings / gains identified via finance checks quarter £206,312 No target £237,097 £341,746 £354,441 £186,791 £1,120,07514/15 is average amount per quarter-Actual is yearly total
Annual Income Before / After quarter NEW No target £12,158-£16,178 £13,087-£17,290 £5,084-£10,666 £10,903-15,742 £10,308-14,969 NEW Actual shows yearly averages
Number of residents receiving MMS service quarter NEW No target 7 3 0 4 14 NEW Actual shows yearly totals
Financial Management 14/15 Target Q1 Q2 Q3 Q4 Actual Trend Notes
% of invoices for commercial goods/services paid within 30 days of receipt quarterly average 92.1% 95.0% 90.7% 94.1% 93.4% 91.5% 92.4% 14/15 is yearly average- Actual is yearly average
Governance 14/15 Target Q1 Q2 Q3 Q4 Actual Trend
% of Board members attendance at meetings quarter 73% 77% 77% 63% 77% 69.0% 71.5% 14/15 is yearly average- Actual is yearly average
Income Management 14/15 Target Q1 Q2 Q3 Q4 Actual Trend Notes
Proportion of rent collected cumulative 99.0% 99% 97.6% 97.9% 98.4% 98.9% 99.1% 14/15 and Target are end-of-year position-Actual is end-of-quarter (trend compares same quarter this year & last)
Rent arrears as % of rent debit cumulative 0.81% 2% 1.23% 1.54% 1.29% 1.22% 1.2% 14/15 and Target are end-of-year position-Actual is end-of-quarter
Proportion of current tenants with more than 7 weeks arrears cumulative 2.6% 4% 2.4% 2.7% 2.2% 2.3% 2.3% 14/15 and Target are end-of-year position-Actual is end-of-quarter
LA rent collection and arrears: number of current tenants evicted re: rent arrears. cumulative 9 No target 2 4 5 6 6 14/15 is end-of-year position-Actual is end-of-quarter
% of ALL tenants & leaseholders paying by a scheduled method. quarter-end 53.0% No target 53.4% 54.1% 54.3% 53.7% 53.7% 14/15 is end-of-year position-Actual is end-of-quarter
% rent lost through dwellings becoming vacant cumulative 1.00% 1% 0.27% 0.35% 0.38% 0.39% 0.39% 14/15 and Target are end-of-year position-Actual is end-of-quarter
Information Technology 14/15 Target Q1 Q2 Q3 Q4 Actual Trend Notes
Number of Website Visits per month quarterly average 5,587 No target 6,100 6,573 4,535 4,933 5,547 Actual shows current yearly average
Number of Facebook 'likes' per month quarter-end NEW No target 339 389 427 457 457 NEW Actual shows end-of-quarter number
Comments:
Trends shown compare end of year against 14/15 actual.
\\Artemis\php\Team Information\Performance and Communication\Performance and Improvement\Performance & Improvement Team\PI Book Stuff\Quarterly Book\XL - Adding Value Charts Q4XL - Adding Value Charts Q4

XL - Adding Value Charts Q4,ACC Local 30a page 1 27/05/2016
35
42
9
18
12
4
2013/14
2014/15
Q1
Q2
Q3
Q4
0 5 10 15 20 25 30 35 40 45
No. of complaints received
Responsible Manager
Jackie Barton - Company Secretary
Criteria Used
Stage 1 complaints only, received during the quarter
(non-cumulative)
Comments Of the 4 complaints received during Q4, only one has so far progressed to stage 2 of PHP's complaints procedure. This is reported to senior management team and the Board on a quarterly basis. We received a total of 43 complaints during 2015/16.
PHP Local 30a - Number of complaints dealt with under the complaints procedure
ACCESS & CUSTOMER CARE (a Customer Care indicator)
BENCHMARKING
Currently there re no benchmarking figures available for this indicator.
(annual total)
(annual total)

XL - Adding Value Charts Q4,ACC Local 145 a-c page 2 27/05/2016
0%
10%
20%
30%
40%
50%
60%
70%
80%
90%
100%
2013/14 2014/15 Q1 Q2 Q3 Q4
100% 100% 100% 100% 100%
54
% 62
%
54
%
54
%
54
%
31
%
50
%
45
%
46
%
46
%
Responded within timescale? Felt complaint fully investigated? Given full explanation re outcome?
Responsible Manager
Janet Read - Policy and Performance Manager
Criteria Used
Reported quarterly, on a NON-cumulative basis, shown as a cash
amount
PHP LOCAL 154 - % of Types of New Benefits Identified
FINANCIAL INCLUSION (a Customer Care indicator)
Responsible Manager
Jackie Barton - Company Secretary
Criteria Used
Reported quarterly, on a cumulative basis, shown as a %
(telephone surveys)
Comments Based on 13 survey responses after Q4 (although no surveys were carried out in Q3/4).
PHP LOCAL 145 a-c % Satisfaction with the Handling of Complaints
ACCESS & CUSTOMER CARE (a Customer Care indicator
HOUSEMARK ALMO PI CLUB BENCHMARKING
(new
qu
esti
on
s fo
r 2
01
4/1
5)
2013/4 - TOP QUARTILE
2014/5 - BOTTOM QUARTILE
2015/6 - BOTTOM QUARTILE

XL - Adding Value Charts Q4,ACC Local 33 page 3 27/05/2016
97.3%
96.0%
94.0%
100.0%
100.0%
94.0%
96.0%
93.0%
100.0%
94.0%
83.0%
86.0%
88.0%
81.0%
2013/14
2014/15
apr
may
jun
jul
aug
sep
oct
nov
dec
jan
feb
mar
0% 10% 20% 30% 40% 50% 60% 70% 80% 90% 100%
% answered within 10 working days
Responsible Manager
Jackie Barton - Company Secretary
Criteria Used
Reported monthly on a non-cumulative basis, expressed as a percentage
Comments This is an important performance indicator and trends are monitored closely. This performance can also be broken down to individual teams, and performance at this level is monitored at senior management team meetings. For January-March 7 letters out of 54 were not answered on time.
PHP LOCAL 33 - % of residents letters answered within 10 working days
ACCESS & CUSTOMER CARE (a Customer Care indicator)
BENCHMARKING
Currently there are no benchmarking figures available for this indicator.

XL - Adding Value Charts Q4,ACC Local 73 page 4 27/05/2016
93.7%
92.1%
78.9%
93.1%
83.3%
91.3%
90.0%
92.6%
94.3%
97.1%
100.0%
92.9%
87.0%
90.0%
2013/14
2014/15
apr
may
jun
jul
aug
sep
oct
nov
dec
jan
feb
mar
0% 10% 20% 30% 40% 50% 60% 70% 80% 90% 100%
% seen within 5 minutes
Responsible Manager
Jackie Barton - Company Secretary
Criteria Used
Reported monthly on a non-cumulative basis, expressed as a percentage
Comments This is an important indicator of customer care. Only 7 'late' appointments for January to March. Most of these were only missed by a couple of minutes but all are followed up. This indicator is now being reported quarterly to the Senior Management team to ensure there are no repeat 'offenders'.
PHP LOCAL 73 - % Visitors to Reception seen within 5 minutes of appointment
ACCESS & CUSTOMER CARE (a Customer Care indicator)
BENCHMARKING
Currently there are no benchmarking figures available for this indicator.

XL - Adding Value Charts Q4,CY Local 37 37a page 5 27/05/2016
4.14
2.83
3.72
3.5
2.77
2.92
1.54
2.83
1.1
1.18
1.37
1.4
2.76
2.83
3.77
4.02
3.24
2.71
2014/15
Target15/16
Q1
Q2
Q3
Q4
0 1 2 3 4 5 6 7 8 9 10 11 12
working days lost
Short-Term Medium-Term Long-Term
Responsible Manager
Jackie Barton - Company Secretary
Criteria Used
Reported quarterly, on a 12-month rolling total basis
Comments Q4's figure is based on 119 staff and shows a positive trend. Short-term sickness represented 41% of total sickness.
PHP LOCAL 37 - Number of working days lost due to sickness absence (average per employee) per annum
CAPACITY (a Value For Money indicator)
HOUSEMARK ALMO PI CLUB BENCHMARKING
2014/15 - MID/TOP QUARTILE
(8.44 total)
(8.50)
(8.59)
(8.70)
(7.38)
(7.04)
2015/16 - MID/TOP QUARTILE

XL - Adding Value Charts Q4,FI Local 152 page 6 27/05/2016
117
89
135
191
141
115
2013/14
2014/15
Q1
Q2
Q3
Q4
50 70 90 110 130 150 170 190
No. Of Checks Completed
Responsible Manager
Jackie Barton - Company Secretary
Criteria Used
Reported quarterly, on a NON-cumulative basis
Comments There was an unusual 'spike' in the number of checks during the second quarter, however Q3 and Q4 are showing a return to more normal levels. The team now offers information and advice over the telephone to allow it to target finance checks/visits more effectively and to use their time as efficiently as possible.
PHP LOCAL 152 - Number of Finance Checks Completed
FINANCIAL INCLUSION (a Customer Care indicator)
BENCHMARKING
Currently there are no benchmarking figures available for this indicator.
(quarterly average)
(quarterly average)

XL - Adding Value Charts Q4,FI Local 153 page 7 27/05/2016
£236,931
£206,312
£237,097
£341,746
£354,441
£186,791
2013/14
2014/15
Q1
Q2
Q3
Q4
£0 £50,000 £100,000 £150,000 £200,000 £250,000 £300,000 £350,000 £400,000
Amount Identified
Responsible Manager
Jackie Barton - Company Secretary
Criteria Used
Reported quarterly, on a NON-cumulative basis, shown as a cash
amount
Comments
Due to welfare reform, the team now devotes a higher proportion of time doing form-filling, mandatory reconciliations and assisting with benefit appeals. During Q4 the team found they were finding more and more complex scenarios necessitating repeat visits to clients.
PHP LOCAL 153 - Total Benefit Identified
FINANCIAL INCLUSION (a Customer Care indicator)
BENCHMARKING
Currently there are no benchmarking figures available for this indicator.
(quarterly average)
(quarterly average)

XL - Adding Value Charts Q4,FM Local 84 page 8 27/05/2016
89.1%
92.1%
94.0%
87.3%
90.9%
93.7%
92.0%
96.7%
93.4%
94.8%
92.1%
87.0%
94.8%
92.6%
2013/14
2014/15
apr
may
jun
jul
aug
sep
oct
nov
dec
jan
feb
mar
0% 10% 20% 30% 40% 50% 60% 70% 80% 90% 100%
% paid on time
Responsible Manager
Su Spence - Director of Finance and Resources
Criteria Used
Reported monthly on a non-cumulative basis, expressed as a percentage
Comments The use of paper invoices means that the flow of invoices through the organisation sometimes takes longer than it should. Work is ongoing to streamline the process and meet the 95% best practice target regularly. Government expectation is that organisations pay 95% of invoices within 30 days, in order to support cashflow within small and medium enterprises. We agree with this target as we focus on paying promptly and expect top performance from our contractors.
PHP LOCAL 84 - % of invoices for commercial goods/services paid within 30 days of receipt
FINANCIAL MANAGEMENT (a Customer Care indicator)
BENCHMARKING
Currently there are no benchmarking figures available for this indicator.

XL - Adding Value Charts Q4,GV Local 47 page 9 27/05/2016
76%
77%
77%
63%
77%
69%
2014/15
Target15/16
Q1
Q2
Q3
Q4
0% 10% 20% 30% 40% 50% 60% 70% 80% 90% 100%
Attendance %
Responsible Manager
Jackie Barton - Company Secretary
Criteria Used
Reported quarterly, on a NON-cumulative basis, shown as a %.
Comments There has been a slight dip in Q4 due to sickness. We are confident that attendance will return to target level.
PHP LOCAL 47 - of Board Members attendance at meetings
GOVERNANCE (a Value For Money indicator)
(quarterly average) BENCHMARKING
Currently there are no benchmarking figures available for this indicator.

XL - Adding Value Charts Q4,IM Local 85 (annual) page 10 27/05/2016
98.95%
98.50%
99.13%
2014/15
Target15/16
2015/16
90% 91% 92% 93% 94% 95% 96% 97% 98% 99% 100%
% of rent collected
Responsible Manager
Robert Chedzoy - Income Manager
Criteria Used
Reported annually, on a cumulative basis, shown as a % (Hostels are excluded)
Comments
Another year of strong performance. With the rollout of welfare reform, including the first wave of Universal Credit cases, we anticipated a slight drop in income. However, this has not transpired to be the case.
PHP Local 85 - Proportion of rent collected (ex BVPI66a)
INCOME MANAGEMENT (a Value For Money indicator)
HOUSEMARK ALMO PI CLUB ANNUAL BENCHMARKING
2014/15 - TOP QUARTILE
2012/13 - TOP QUARTILE
2013/14 - TOP QUARTILE
2015/16 - TOP QUARTILE

XL - Adding Value Charts Q4,IM Local 86 page 11 27/05/2016
2.6%
4.0%
2.2%
2.3%
2.4%
2.8%
2.8%
2.7%
2.9%
2.8%
2.2%
2.6%
2.4%
1.9%
0.0% 1.0% 2.0% 3.0% 4.0% 5.0% 6.0%
% of tenants with more than 7 weeks arrears
Responsible Manager
Robert Chedzoy - Income Manager
Criteria Used
Reported monthly, on a cumulative basis, shown as a %
Comments A lot of work has gone in on these high level arrears cases and this is evidenced by the strong performance.
PHP Local 86 - Proportion of current tenants with more than 7 weeks arrears
INCOME MANAGEMENT (a Value For Money indicator)
BENCHMARKING
Currently there are no benchmarking figures available for this indicator.

XL - Adding Value Charts Q4,IT Local 158,406 page 12 27/05/2016
CAPITAL PROGRAMME
Responsible Manager
Su Spence - Director of Finance and Resources
Criteria Used
Reported monthly, on a NON-cumulative basis
('likes' is a snapshot figure at the end of each month)
Comments
This is the first year of monitoring website data and should provide benchmarking data for future years. Use of the website is part of the channel shift approach to ensure we provide information quickly and in the right format. This is a key development to provide greater choice for all of our customers.
PHP LOCAL 158/406 - Number of Hits on Website/Facebook 'Likes'
INFORMATION TECHNOLOGY (a Customer Care indicator)
6,080
5,870
6,349
6,781
6,364
6,425
5,019
5,116
3,471
5,179
4,972
4,933
270
333
339
359
285
389
394
413
427
434
443
457
0 1,000 2,000 3,000 4,000 5,000 6,000 7,000 8,000
2013/14
2014/15
apr
may
jun
jul
aug
sep
oct
nov
dec
jan
feb
mar
Hits
'Likes'
BENCHMARKING
Currently there are no benchmarking figures available for this indicator.
(not fully recorded prior to 2015/16)
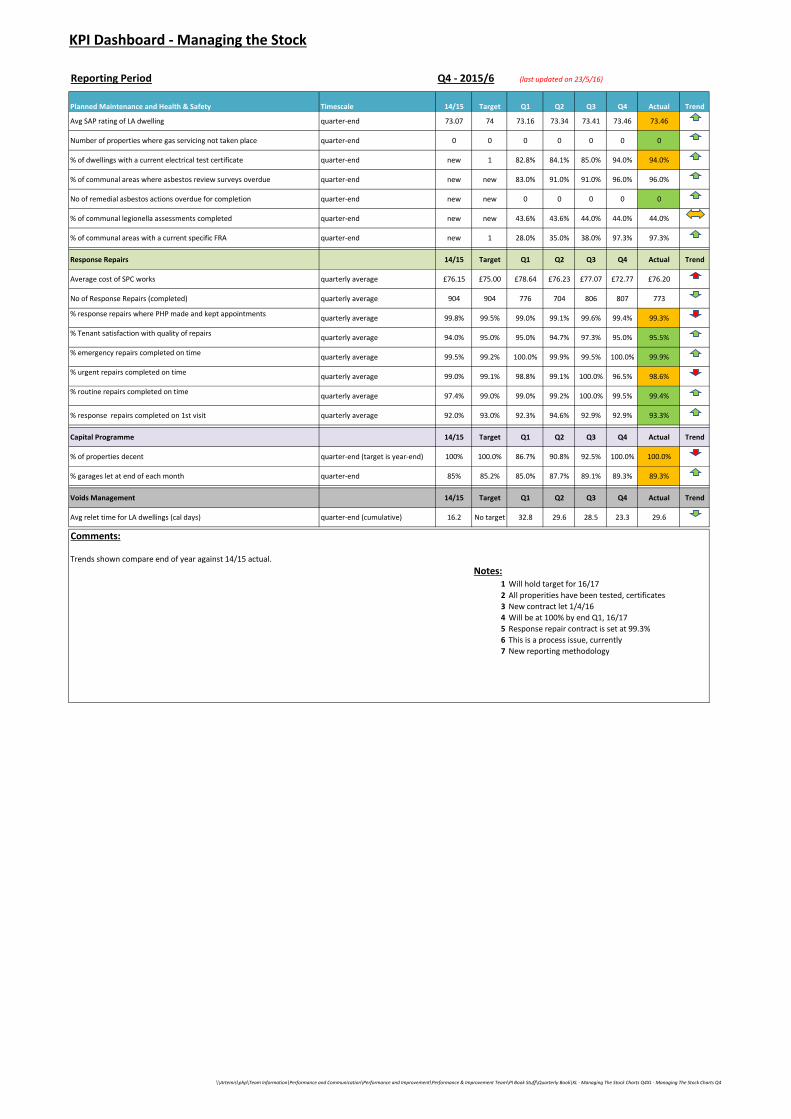
KPI Dashboard - Managing the Stock
Reporting Period Q4 - 2015/6 (last updated on 23/5/16)
Planned Maintenance and Health & Safety Timescale 14/15 Target Q1 Q2 Q3 Q4 Actual Trend
Avg SAP rating of LA dwelling quarter-end 73.07 74 73.16 73.34 73.41 73.46 73.46
Number of properties where gas servicing not taken place quarter-end 0 0 0 0 0 0 0
% of dwellings with a current electrical test certificate quarter-end new 1 82.8% 84.1% 85.0% 94.0% 94.0%
% of communal areas where asbestos review surveys overdue quarter-end new new 83.0% 91.0% 91.0% 96.0% 96.0%
No of remedial asbestos actions overdue for completion quarter-end new new 0 0 0 0 0
% of communal legionella assessments completed quarter-end new new 43.6% 43.6% 44.0% 44.0% 44.0%
% of communal areas with a current specific FRA quarter-end new 1 28.0% 35.0% 38.0% 97.3% 97.3%
Response Repairs 14/15 Target Q1 Q2 Q3 Q4 Actual Trend
Average cost of SPC works quarterly average £76.15 £75.00 £78.64 £76.23 £77.07 £72.77 £76.20
No of Response Repairs (completed) quarterly average 904 904 776 704 806 807 773
% response repairs where PHP made and kept appointmentsquarterly average 99.8% 99.5% 99.0% 99.1% 99.6% 99.4% 99.3%
% Tenant satisfaction with quality of repairsquarterly average 94.0% 95.0% 95.0% 94.7% 97.3% 95.0% 95.5%
% emergency repairs completed on timequarterly average 99.5% 99.2% 100.0% 99.9% 99.5% 100.0% 99.9%
% urgent repairs completed on timequarterly average 99.0% 99.1% 98.8% 99.1% 100.0% 96.5% 98.6%
% routine repairs completed on timequarterly average 97.4% 99.0% 99.0% 99.2% 100.0% 99.5% 99.4%
% response repairs completed on 1st visit quarterly average 92.0% 93.0% 92.3% 94.6% 92.9% 92.9% 93.3%
Capital Programme 14/15 Target Q1 Q2 Q3 Q4 Actual Trend
% of properties decent quarter-end (target is year-end) 100% 100.0% 86.7% 90.8% 92.5% 100.0% 100.0%
% garages let at end of each month quarter-end 85% 85.2% 85.0% 87.7% 89.1% 89.3% 89.3%
Voids Management 14/15 Target Q1 Q2 Q3 Q4 Actual Trend
Avg relet time for LA dwellings (cal days) quarter-end (cumulative) 16.2 No target 32.8 29.6 28.5 23.3 29.6
Comments:
Trends shown compare end of year against 14/15 actual.
Notes:1
2
3
4
5
6
7 New reporting methodology
Will hold target for 16/17
All properities have been tested, certificates
New contract let 1/4/16
Will be at 100% by end Q1, 16/17
Response repair contract is set at 99.3%
This is a process issue, currently
\\Artemis\php\Team Information\Performance and Communication\Performance and Improvement\Performance & Improvement Team\PI Book Stuff\Quarterly Book\XL - Managing The Stock Charts Q4XL - Managing The Stock Charts Q4
XL - Managing The Stock Charts Q4,CP - PHP Local 307 page 13 27/05/2016
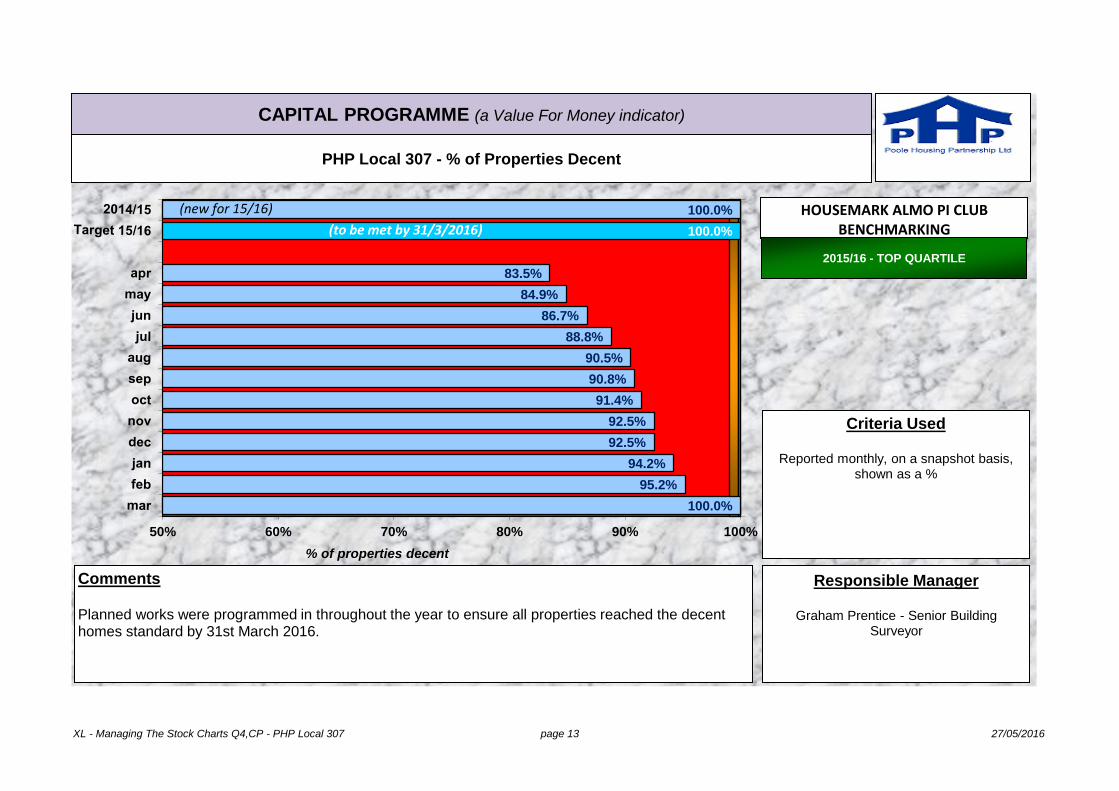
100.0%
100.0%
83.5%
84.9%
86.7%
88.8%
90.5%
90.8%
91.4%
92.5%
92.5%
94.2%
95.2%
100.0%
50% 60% 70% 80% 90% 100%
% of properties decent
Responsible Manager
Graham Prentice - Senior Building Surveyor
Criteria Used
Reported monthly, on a snapshot basis, shown as a %
Comments Planned works were programmed in throughout the year to ensure all properties reached the decent homes standard by 31st March 2016.
PHP Local 307 - % of Properties Decent
CAPITAL PROGRAMME (a Value For Money indicator)
HOUSEMARK ALMO PI CLUB BENCHMARKING
(to be met by 31/3/2016)
(new for 15/16)
2015/16 - TOP QUARTILE

XL - Managing The Stock Charts Q4,PMHS Local 92 page 14 27/05/2016
73.07
74.00
73.10
73.11
73.16
73.25
73.31
73.34
73.36
73.36
73.41
73.41
73.43
73.46
2014/15
Target…
apr
may
jun
jul
aug
sep
oct
nov
dec
jan
feb
mar
70.0 70.5 71.0 71.5 72.0 72.5 73.0 73.5 74.0
SAP Rating (2009 scale)
Responsible Manager
David Hood - Building Surveyor
Criteria Used
Reported quarterly, expressed as a number
Comments Our stock condition database (SAP) rating has now stabilised at 73.46. We expect the score to reduce slightly when we go live with Keystone and move to SAP 2012. SAP 2012 will give those properties with electric heating a lower score. We have approx. 60 properties with a rating of D (55-68) or lower. Many of these are partially as a result of tenant refusals, electrically-heated or top floor flats with little, no or unknown insulation at roof level.
PHP Local 92 - Energy Efficiency - the average SAP rating of Local Authority-owned dwellings
PLANNED MAINTENANCE AND HEALTH & SAFETY (a Health and Safety indicator)
HOUSEMARK ALMO PI CLUB ANNUAL BENCHMARKING
( target to be met by 31/3/16 )
2012/13 - TOP QUARTILE
2013/14 - TOP QUARTILE
2014/15 - TOP QUARTILE
2015/16 - TOP QUARTILE

XL - Managing The Stock Charts Q4,PMHS Local 24 page 15 27/05/2016
2014/15
Target 15/16
apr
may
jun
jul
aug
sep
oct
nov
dec
jan
feb
mar
0 5 10 15
Number of Properties
Responsible Manager
Richard Freeman - Building Services Manager
Criteria Used
Reported monthly; end-of-month snapshot - monitors the number of properties with an
annual gas service outstanding
Comments We have now had 35 months full compliance and this is an outstanding result. This is an ongoing measure of 'no access' through the year. Significant efforts have been made to reduce to a minimum the 'inaccessible' properties. Issues highlighted are identified and rectified with the new operational processes. Urgent action is taken on all properties where our contractor has been unable to gain access. Close working between the planned maintenance team and Housing Officers has been key to success with access issues.
PHP LOCAL 24 - Number of properties where gas service has not taken place (as at the end of the month)
PLANNED MAINTENANCE AND HEALTH & SAFETY (a Health and Safety indicator)
HOUSEMARK ALMO PI CLUB BENCHMARKING ( zero monthly target )
(end of March snapshot was zero)
( zero for the whole of 15/16)
2013/14 - TOP QUARTILE
2014/15 - TOP QUARTILE
2012/13 - MID/BOTTOM QUARTILE
2015/16 - TOP QUARTILE

XL - Managing The Stock Charts Q4,PMHS Local 300b page 16 27/05/2016
83%
91%
91%
96%
2013/14
2014/15
Q1
Q2
Q3
Q4
50% 60% 70% 80% 90% 100%
% of properties overdue
Responsible Manager
Graham Prentice - Senior Building Surveyor
Criteria Used
Reported quarterly, on a snapshot basis, shown as a %
Comments All communal blocks are regularly inspected and any maintenance issues reported. Unfortunately these are not currently recorded and therefore processes have been developed to capture this information. A new programme to inspect all blocks starting April 2016 will ensure all blocks are recorded by the end of June 2016.
PHP LOCAL 300b - % of communal areas where asbestos review surveys overdue
PLANNED MAINTENANCE AND HEALTH & SAFETY (a Health and Safety indicator)
BENCHMARKING
Currently there are no benchmarking figures available for this indicator.
( new indicator for 15/16)
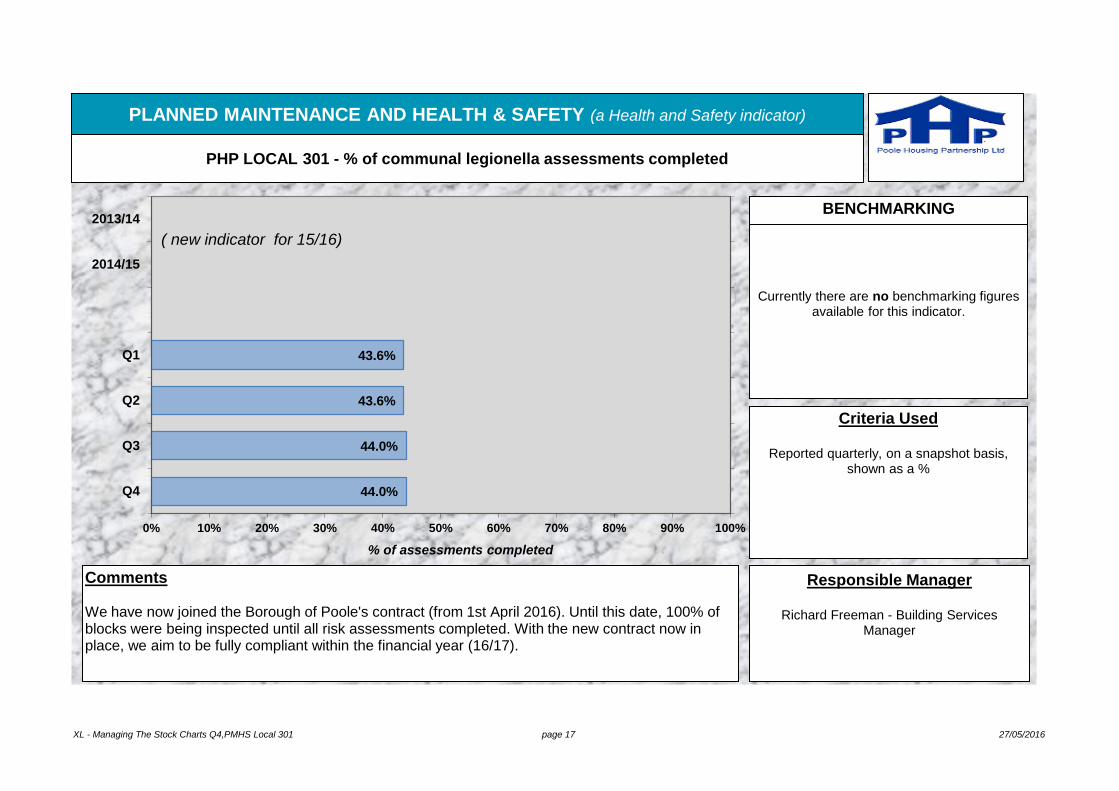
XL - Managing The Stock Charts Q4,PMHS Local 301 page 17 27/05/2016
43.6%
43.6%
44.0%
44.0%
2013/14
2014/15
Q1
Q2
Q3
Q4
0% 10% 20% 30% 40% 50% 60% 70% 80% 90% 100%
% of assessments completed
Responsible Manager
Richard Freeman - Building Services Manager
Criteria Used
Reported quarterly, on a snapshot basis, shown as a %
Comments We have now joined the Borough of Poole's contract (from 1st April 2016). Until this date, 100% of blocks were being inspected until all risk assessments completed. With the new contract now in place, we aim to be fully compliant within the financial year (16/17).
PHP LOCAL 301 - % of communal legionella assessments completed
PLANNED MAINTENANCE AND HEALTH & SAFETY (a Health and Safety indicator)
BENCHMARKING
Currently there are no benchmarking figures available for this indicator.
( new indicator for 15/16)

XL - Managing The Stock Charts Q4,PMHS Local 302 page 18 27/05/2016
82.8%
84.1%
85.0%
94.0%
2013/14
2014/15
Q1
Q2
Q3
Q4
50% 60% 70% 80% 90% 100%
% of dwellings
Responsible Manager
Richard Freeman - Building Services Manager
Criteria Used
Reported quarterly, on a snapshot basis, shown as a %
Comments This is part of an ongoing programme, with the target being to complete all testing by the end of the financial year. The bulk of the 6% left, without current certificates, were re-wired between 2006-2011, but unfortunately certificates cannot be found on our system. These would have a 10 year lifespan before requiring inspection.
PHP LOCAL 302 - % of dwellings with a current electrical test certificate
PLANNED MAINTENANCE AND HEALTH & SAFETY (a Health and Safety indicator)
BENCHMARKING
Currently there are no benchmarking figures available for this indicator.
( new indicator for 15/16)

XL - Managing The Stock Charts Q4,PMHS Local 303 page 19 27/05/2016
28%
35%
38%
97%
2013/14
2014/15
Q1
Q2
Q3
Q4
0% 10% 20% 30% 40% 50% 60% 70% 80% 90% 100%
% of communal areas
Responsible Manager
Graham Prentice - Senior Building Surveyor
Criteria Used
Reported quarterly, on a snapshot basis, shown as a %
Comments Having completed generic fire risk assessments for all communal areas, PHP have now focussed on completing specific FRAs. This is a new target, focussed on the more complex buildings first. The target for the completion of 100% of communal areas was the end of Q4. All surveys are now complete however, and we are just awaiting reports for the 6 outstanding blocks.
PHP LOCAL 303 - % of communal areas with a current specific Fire Risk Assessment
PLANNED MAINTENANCE AND HEALTH & SAFETY (a Health and Safety indicator)
BENCHMARKING
Currently there are no benchmarking figures available for this indicator.
( new indicator for 15/16)

XL - Managing The Stock Charts Q4,RR Local 305 page 20 27/05/2016
76.15
75
76.28
78.67
80.96
79.34
70.49
78.85
82.36
72.2
76.64
73.32
75.1
69.89
£0 £10 £20 £30 £40 £50 £60 £70 £80 £90 £100
Average Cost
Responsible Manager
Ola Onabajo - Maintenance Manager
Criteria Used
Reported monthly, on a NON-cumulative
basis (note that the last 3 months - shaded orange - are projections that are usually
susceptible to marked fluctuations)
Comments Calculation is based on the number of invoices paid and not on completed jobs, hence there is a lag in data. By the end of the year we are only slightly above target value, and the team continue to drive value for money by identifying savings within budgets.
PHP LOCAL - 305 - Average Cost (Per Job) of Spectrum Property Care Works
RESPONSE REPAIRS (a Customer Care/Value For Money indicator)
(new for 2014/15) BENCHMARKING
Currently there are no benchmarking figures available for this indicator.

£0
£100
£200
£300
£400
£500
£600
£700
62
2 5
81
62
8 0
41
62
8 5
57
62
8 7
28
62
8 8
39
62
8 9
12
62
8 9
89
62
9 0
58
62
9 1
21
62
9 2
39
62
9 3
04
62
9 3
38
62
9 4
27
62
9 6
14
62
9 6
76
62
9 7
20
62
9 8
21
62
9 8
40
62
9 8
60
62
9 8
76
62
9 8
97
62
9 9
19
62
9 9
41
62
9 9
67
63
0 0
01
63
0 0
39
63
0 0
65
63
0 0
88
63
0 1
32
63
0 1
66
63
0 2
14
63
0 2
53
63
0 2
75
63
0 3
01
63
0 3
29
63
0 3
50
63
0 3
81
63
0 4
21
63
0 4
59
63
0 4
77
63
0 4
92
63
0 5
29
63
0 5
67
63
0 5
97
63
0 6
31
63
0 6
52
63
0 6
70
63
0 6
87
63
0 7
17
63
0 7
52
63
0 7
86
63
0 8
27
63
0 8
46
63
0 8
95
63
0 9
27
63
0 9
51
63
1 0
00
63
1 0
28
63
1 0
61
63
1 0
98
63
1 1
40
63
1 1
97
63
1 2
19
63
1 2
49
63
1 2
72
63
1 3
14
63
1 3
97
63
1 4
38
63
1 4
65
63
1 5
03
63
1 5
22
63
1 5
56
63
1 6
20
63
1 6
98
63
1 7
82
63
1 8
64
63
2 0
15
63
2 1
26
63
2 2
96
63
2 4
09
63
2 6
04
63
2 7
04
63
2 7
89
63
3 0
40
63
3 3
15
63
3 8
95
63
5 5
60
Repair Numbers
Capability Chart - PHP Local 305a - Response Repair Costs (ALL) 1/1-31/3/16
Responsible Manager
Ola Onabajo - Maintenance Manager
Comments As the year progresses, more data will be available for identifying trends and patterns. Peaks will continue to be investigated and any issues arising resolved. Normal variation here is between £30-£255, whilst the average is £69 for Q4. High value orders have been determined to be warranted, but will continue to inform planned programmes as necessary.
upper control limit
average
XL - Managing The Stock Charts Q4 page 21 27/05/2016

XL - Managing The Stock Charts Q4,RR Local 306 page 22 27/05/2016
904
904
810
713
805
637
734
742
788
873
758
871
798
751
0 100 200 300 400 500 600 700 800 900 1,000
No of Repairs
Responsible Manager
Ola Onabajo - Maintenance Manager
Criteria Used
Reported monthly, on a NON-cumulative
basis (reported with a time-lag to enable accurate reporting)
Comments The average 14/15 figure is taken across the year with monthly numbers recorded being demand-led, and tends to follow a predicted pattern which is monitored for unusual spikes. At year-end monitoring continues and there are no trends identifiable, but responsive works will continue to inform planned maintenance programmes.
PHP LOCAL 306 - No of Response Repairs Completed
RESPONSE REPAIRS (a Customer Care/Value For Money indicator)
BENCHMARKING
Currently there are no benchmarking figures available for this indicator.
(monthly average last 3 years)

XL - Managing The Stock Charts Q4,RR Local 22 page 23 27/05/2016
92.0%
93.0%
90.8%
93.1%
93.1%
94.1%
96.0%
93.7%
94.2%
93.8%
90.7%
92.8%
94.0%
92.0%
50% 55% 60% 65% 70% 75% 80% 85% 90% 95% 100%
% of repairs
Responsible Manager
Ola Onabajo - Maintenance Manager
Criteria Used
Reported monthly, on a NON-cumulative
basis, shown as a %.
Comments First time fixes are high on PHP and Spectrum's agendas as a basis for good customer service and, in turn, customer satisfaction, as well as ensuring an efficient/effective service. Performance has stabilised and repairs continue to be monitored for consistency.
PHP LOCAL 22 - % of responsive repairs completed on the 1st visit
RESPONSE REPAIRS (a Customer Care/Value For Money indicator)
HOUSEMARK ALMO PI CLUB
BENCHMARKING (average monthly figure)
2013/14 - MID/BOTTOM QUARTILE
2012/13 - MID/TOP QUARTILE
2014/15 - MID/TOP QUARTILE
2015/16 - MID/TOP QUARTILE
(end-of-year average performance was above target, at 93.2%)

XL - Managing The Stock Charts Q4,VM Local 3 page 24 27/05/2016
16.0
0.0
32.4
31.4
32.8
29.1
27.2
29.6
29.8
29.5
28.5
27.6
24.3
23.3
0 5 10 15 20 25 30 35
No. of Calendar Days
Responsible Manager
Gisele Hattam - Voids Manager
BENCHMARKING
Criteria Used
Reported monthly, on a cumulative basis,
shown in calendar days
Comments Based on 244 relets after Q4. The relet time has reduced since Q3, but there are still relets with significantly longer than average durations. The main reasons for these were problematic nominations/hard-to-let properties. Other delays were attributed to flea and rat infestations and for a higher than normal number of properties needing various works before they could be re-let. The average relet time should continue to reduce with the new void process now in place.
PHP LOCAL 3 - Average relet time for Local Authority dwellings
VOIDS MANAGEMENT (a Value For Money indicator)
Currently there are no benchmarking figures available

0
10
20
30
40
50
60
70
80
90
26
B A
RN
E AV
ENU
E
27 B
AITER
GA
RD
ENS
60
BO
YD
RO
AD
33
CIN
NA
MO
N LA
NE
40
CY
NTH
IA C
LOSE
50
CY
NTH
IA C
LOSE
3 C
YN
THIA
HO
USE
118
DA
LE CLO
SE
1 D
AV
IS CO
UR
T
21
8 EG
MO
NT
RO
AD
3 B
ELMO
NT C
OU
RT
10
GO
RT R
OA
D
12
7A
HER
BER
T AV
ENU
E
18 H
ERB
ERT C
OU
RT
25
HER
BER
T CO
UR
T
19
2 JU
NC
TION
RO
AD
63
NELSO
N C
OU
RT
62
LIBR
AR
Y R
OA
D
33
MILB
OR
NE C
RESC
ENT
94 M
ILLFIELD
18
MILN
E RO
AD
74
NO
RTH
MER
E DR
IVE
74
OLD
FAR
M R
OA
D
22
PH
YLD
ON
CLO
SE
53
PH
YLD
ON
CLO
SE
55 P
HY
LDO
N C
LOSE
28
PO
TTERY
RO
AD
13
3 R
OSSM
OR
E RO
AD
79
TR
INID
AD
HO
USE
88
TR
INID
AD
HO
USE
22
SELKIR
K C
LOSE
3 SIMM
ON
DS C
LOSE
54
SIMM
ON
DS C
LOSE
65
SIMM
ON
DS C
LOSE
27
SKIN
NER
STR
EET
5 G
REN
VILLE C
OU
RT
23
GR
ENV
ILLE CO
UR
T
7 SOU
TH H
AV
EN C
LOSE
64 STA
NFIELD
CLO
SE
9B
WH
AR
F CLO
SE
11
RA
LPH
JESSOP
CO
UR
T
33
RA
LPH
JESSOP
CO
UR
T
23
BA
ITER G
AR
DEN
S
76
BO
YD
RO
AD
2 CIN
NA
MO
N LA
NE
37
CLA
REN
DO
N R
OA
D
38
DA
LE CLO
SE
42
DA
LE CLO
SE
72
FITZWO
RTH
AV
ENU
E
34
FRO
BISH
ER A
VEN
UE
4A H
OB
BS R
OA
D
24
LEGIO
N C
LOSE
11
3 P
UD
DLETO
WN
CR
ESCEN
T
7 R
ALEIG
H R
OA
D
39
RO
SEMA
RY
RO
AD
17
BO
B H
AN
N C
LOSE
41 SK
INN
ER STR
EET
20
WO
RB
AR
RO
W G
AR
DEN
S
Day
s Capability Chart - PHP LOCAL 308 - Relet Times (ALL)
(Period: Jan to Mar 2016)
Responsible Manager
Gisele Hattam - Voids Officer
Comments Durations are monitored, particularly so with those exceptional voids above (and near to) the upper control limit. There were no re-occurring issues with the five longest relet time voids.
average
upper control limit
XL - Managing The Stock Charts Q4 page 25 27/05/2016

XL - Managing The Stock Charts Q4,VM Local 10a page 26 27/05/2016
£2,757
£2,544
£2,352
2014/15
Target 15/16
apr
may
jun
jul
aug
sep
oct
nov
dec
jan
feb
mar
500 1000 1500 2000 2500 3000 3500
Average Cost (£'s)
Responsible Manager
Gisele Hattam - Voids Officer
Criteria Used
Reported monthly, on a cumulative basis, based on those properties RELET during the reporting
period. For consistency, and to ensure that the vast
majority of void repair items are included, costs are usually reported with a month time-lag.
Comments Based on 36 voids. Costs are well within budget.
PHP LOCAL 10a - Average cost of void works (General Needs properties)
VOIDS MANAGEMENT (a Value For Money indicator)
BENCHMARKING
Currently there are no benchmarking figures available for this indicator.
(NEW VOIDS PROCESS AND CALCULATION FOR 15/16)

XL - Managing The Stock Charts Q4,VM Local 10b page 27 27/05/2016
£930
£864
£873
2014/15
Target 15/16
apr
may
jun
jul
aug
sep
oct
nov
dec
jan
feb
mar
500 600 700 800 900 1000
Average Cost (£'s)
Responsible Manager
Gisele Hattam - Voids Officer
Criteria Used
Reported monthly, on a cumulative basis, based on those properties RELET during the reporting
period. For consistency, and to ensure that the vast
majority of void repair items are included, costs are usually reported with a month time-lag.
Comments Based on 46 voids. Costs are well within budget.
PHP LOCAL 10b - Average cost of void works (Sheltered Housing properties)
VOIDS MANAGEMENT (a Value For Money indicator)
BENCHMARKING
Currently there are no benchmarking figures available for this indicator.
(NEW VOIDS PROCESS AND CALCULATION FOR 15/16)

£0
£1,000
£2,000
£3,000
£4,000
£5,000
£6,000
£7,000
£8,000
£9,000
£10,000
20
Worb
arro
w G
ard
ens
37
Cla
rend
on R
oad
42
Dale
Clo
se
22
Se
lkirk
Clo
se
25
Herb
ert C
ou
rt
18
Miln
e R
oad
62
Lib
rary
Roa
d
19
2 J
un
ctio
n R
oa
d
38
Dale
Clo
se
23
Gre
nville
Cou
rt
74
North
mere
Driv
e
24
Le
gio
n C
lose
21
8 E
gm
ont R
oad
12
7a H
erb
ert A
ve
63
Nels
on C
ourt
72
Fitz
wo
rth A
ve
nue
7 R
ale
igh R
oad
39
Rosem
ary
Roa
d
33
Milb
orn
e C
rescen
t
10
Cole
s A
ve
nue
5 G
ren
ville
Court
18
Herb
ert C
ou
rt
7 S
ou
th H
aven C
lose
34
Fro
bis
her A
ve
nue
11
8 D
ale
Clo
se
10
Gort R
oad
9b
Wharf C
lose
Am
ou
nt
Capability Chart - PHP Local 309 - Void Costs (GN ONLY) (Period: Jan to Mar 2016)
Responsible Manager
Gisele Hattam - Voids Officer
Comments Costs are monitored, particularly so with those exceptional voids above (and near to) the upper control limit.
average
upper control limit
XL - Managing The Stock Charts Q4 page 28 27/05/2016

£0
£500
£1,000
£1,500
£2,000
£2,500
£3,000
£3,500
17
Bo
b H
ann C
lose
2 C
innam
on L
ane
64
Sta
nfie
ld C
lose
65
Sim
mond
s C
lose
3 B
elm
ont C
ourt
55
Ph
yld
on C
lose
94
Millfie
ld
33
Ralp
h J
essop
Cou
rt
40
Cynth
ia C
lose
23
Ba
iter G
ard
en
s
54
Sim
mond
s C
lose
60
Bo
yd
Roa
d
76
Bo
yd
Roa
d
3 C
yn
thia
Ho
use
53
Ph
yld
on C
lose
28
Po
ttery
Ro
ad
48
Ph
yld
on C
lose
44
Ph
yld
on C
lose
27
Skin
ne
r Stre
et
33
Cin
na
mon
Lan
e
9 S
elb
y C
lose
13
3 R
ossm
ore
Ro
ad
3 S
imm
onds C
lose
41
Skin
ne
r Stre
et
11
3 P
udd
leto
wn
Cre
sent
79
Trin
ida
d H
ouse
58
Ph
yld
on C
lose
55
Pu
ddle
tow
n C
rescen
t
30
Bo
b H
ann C
lose
27
Ba
iter G
ard
en
s
11
Cynth
ia H
ouse
25
Be
lmont C
ou
rt
3 B
elm
ont C
ourt
50
Hin
chliffe
Clo
se
15
Junctio
n ro
ad
Am
ou
nt
Capability Chart - PHP Local 309a - Void Costs (Sheltered only, Jan to Mar 2016)
Responsible Manager
Gisele Hattam - Voids Officer
Comments Costs are monitored, particularly so with those exceptional voids above (and near to) the upper control limit.
average
upper control limit
XL - Managing The Stock Charts Q4 page 29 27/05/2016

KPI Dashboard - Strong and Sustainable Communities
Reporting Period Q4 - 2015/6 (last updated on 23/5/16)
Resident Involvement Timescale 14/15 Target Q1 Q2 Q3 Q4 Actual Trend Notes
Number of involved residents quarter-end 109 no target 108 114 114 113 113 14/15 is end of year position, actual is end of year also
ASB 14/15 Target Q1 Q2 Q3 Q4 Actual Trend Notes
Number of new ASB cases (all)quarterly average n/a no target 22 21 18 18 20 NEW actual is monthly average for the YEAR
Number of new ASB cases (GN)quarterly average n/a no target 12 12 12 12 12 NEW actual is monthly average for the YEAR
Number of new ASB cases (SH)quarterly average n/a no target 8 4 3 2 4 NEW actual is monthly average for the YEAR
Number of ASB cases closed (all)quarterly average n/a no target 24 27 21 19 23 NEW actual is monthly average for the YEAR
Number of ASB cases closed (GN)quarterly average n/a no target 16 18 12 14 15 NEW actual is monthly average for the YEAR
Number of ASB cases closed (SH)quarterly average n/a no target 5 6 6 1 5 NEW actual is monthly average for the YEAR
Number of open ASB cases (all)quarter-end 181 no target 170 160 160 161 161 14/15 is end of year position, actual is end of year also
Number of open ASB cases (GN)quarter-end 124 no target 113 103 110 111 111 14/15 is end of year position, actual is end of year also
Number of open ASB cases (SH)quarter-end 30 no target 36 30 24 26 26 14/15 is end of year position, actual is end of year also
Adaptations 14/15 Target Q1 Q2 Q3 Q4 Actual Trend Notes
Avg time to complete major adaptations (months) cumulative 2.2 no target 3.9 3.1 2.9 3.1 3.1 14/15 is end of year position, actual is end of year also
Counter Fraud 14/15 Target Q1 Q2 Q3 Q4 Actual Trend Notes
Number of 'LIVE' tenancy fraud investigations quarter-end new no target 22 22 20 14 14 NEW actual is end of quarter position
Housing Management 14/15 Target Q1 Q2 Q3 Q4 Actual Trend Notes
Total number of GN TRVs completed (5 year rolling programme) quarter new No target 21 32 28 33 29 NEW actual is monthly average for the YEAR
Comments:
Performance across the suite of KPI's remains stable with few areas of deviation from the expected norm.
Trends shown compare end of year against 14/15 actual.
\\Artemis\php\Team Information\Performance and Communication\Performance and Improvement\Performance & Improvement Team\PI Book Stuff\Quarterly Book\XL - Strong & Sustainable Communities Charts Q4XL - Strong & Sustainable Communities Charts Q4

XL - Strong & Sustainable Communities Charts Q4,ASB Local 60 a page 30 27/05/2016
24
21
17
28
30
16
18
13
26
16
10
19
24
13/14 14/15 apr may jun jul aug sep oct nov dec jan feb mar
All ASB
Responsible Manager
Jo Mare - Housing Manager
Criteria Used
Reported non-cumulatively
Comments 219 cases in total for the year, 53 of which were sheltered. Top 4 ASB case types in order were noise, verbal harassment, pets, garden condition.
PHP LOCAL 60a - Number of New ASB Cases
ANTI-SOCIAL BEHAVIOR (a Customer Care indicator)
BENCHMARKING
Currently there are no benchmarking figures available for this indicator.
(acc
ura
te d
ata
no
t a
vaila
ble
)
(mo
nth
ly a
vera
ge)

XL - Strong & Sustainable Communities Charts Q4,ASB Local 151 page 31 27/05/2016
16
34
23
25
37
18
33
20
10
27
12
18
13/14 14/15 apr may jun jul aug sep oct nov dec jan feb mar
All ASB
Responsible Manager
Jo Mare - Housing Manager
Criteria Used
Reported non-cumulatively
Comments Main methods of resolving ASB cases during the year were by visiting perpetrator (16) and by suspended possession order (8).
PHP LOCAL 151 - Number of ASB Cases Closed
ANTI-SOCIAL BEHAVIOR (a Customer Care indicator)
BENCHMARKING
Currently there are no benchmarking figures available for this indicator.
(new
fo
r 1
5/1
6)
0
100
200
300
400
500
600
700
800
11 15
4
11 25
0
11 75
7
11 80
7
11 99
2
12 15
5
12 23
7
12 29
9
12 33
6
12 44
0
12 48
8
12 48
9
12 49
3
12 52
4
12 52
6
12 56
6
12 61
9
12 64
9
12 68
3
12 68
4
12 75
2
12 77
5
12 80
9
12 81
3
12 81
9
12 82
0
12 82
7
12 83
5
12 83
8
12 83
9
12 84
5
12 84
7
12 85
8
12 86
2
12 87
2
12 87
9
12 88
2
12 89
4
12 90
4
12 90
5
12 91
1
12 92
9
12 93
0
12 94
3
12 95
1
12 95
2
12 95
3
12 96
0
12 97
6
12 98
5
12 99
1
12 99
2
12 99
8
13 00
3
13 00
6
13 01
0
13 01
3
13 06
4
Day
s
Case Numbers
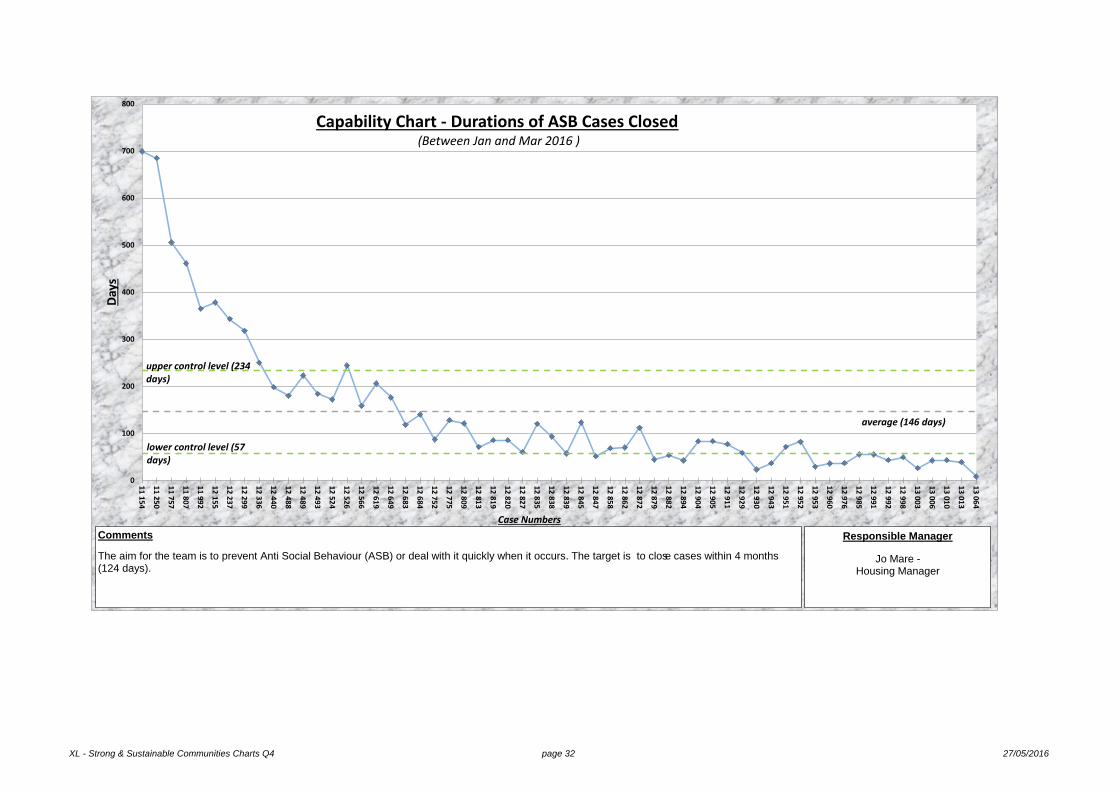
Capability Chart - Durations of ASB Cases Closed (Between Jan and Mar 2016 )
Responsible Manager
Jo Mare - Housing Manager
Comments
The aim for the team is to prevent Anti Social Behaviour (ASB) or deal with it quickly when it occurs. The target is to close cases within 4 months (124 days).
average (146 days)
upper control level (234 days)
lower control level (57 days)
XL - Strong & Sustainable Communities Charts Q4 page 32 27/05/2016

XL - Strong & Sustainable Communities Charts Q4,EM Local 501 page 33 27/05/2016
100.0%
100.0%
2014/15
Target 15/16
2015/16
60% 65% 70% 75% 80% 85% 90% 95% 100%
% of estates graded
Responsible Manager
Gail Percival - Estate Services Manager
Criteria Used
Grading is carried out annually in Aug/Sept each year
Comments The target of completing all gradings was met this year.
PHP Local 501 - % Estates Graded
ESTATE MANAGEMENT (a Customer Care indicator)
HOUSEMARK ALMO PI CLUB BENCHMARKING
Currently there are no benchmarking figures available for this indicator.
(new for 15/16)

XL - Strong & Sustainable Communities Charts Q4,EM Local 501a page 34 27/05/2016
85.0%
84.5%
2014/15
Target 15/16
2015/16
60% 65% 70% 75% 80% 85% 90% 95% 100%
% of 'A' or 'B' Grades
Responsible Manager
Gail Percival - Estate Services Manager
Criteria Used
Grading is carried out annually in Aug/Sept each year
Grading is from A-D with 'A' being the
best grade
Comments Just under target for the year, with almost 85% of estates achieving the top two grades of either 'A' or 'B'.
PHP Local 501a - % Estates Achieving 'A' or 'B' Grades
ESTATE MANAGEMENT (a Customer Care indicator)
HOUSEMARK ALMO PI CLUB BENCHMARKING
Currently there are no benchmarking figures available for this indicator.
(new for 15/16)

XL - Strong & Sustainable Communities Charts Q4,HM Local 62 page 35 27/05/2016
92.1%
98.0%
100.0%
100.0%
100.0%
100.0%
95.0%
95.0%
95.0%
93.0%
92.0%
89.0%
100.0%
2013/14
2014/15
apr
may
jun
jul
aug
sep
oct
nov
dec
jan
feb
mar
0% 10% 20% 30% 40% 50% 60% 70% 80% 90% 100%
% within 8 weeks
Mo
nth
Ten
an
cy C
om
men
ced
Responsible Manager
Sue Howes - Housing Manager
Criteria Used
Reported monthly on a non-cumulative basis, General Needs properties only (including Mutual Exchanges)
Figures are for visits due from signups for a particular
month and are a snapshot of that month AND the previous month
Comments Based on 21 visits (for the latest available two months - January and February). It is important to carry out these visits to ensure new tenants have settled in.
PHP LOCAL 62 - % of new GENERAL NEEDS tenant visits completed within 8 weeks
HOUSING MANAGEMENT (a Customer Care indicator)
BENCHMARKING
Currently there are no benchmarking figures available for this indicator.
(average monthly figure)
(average monthly figure)

XL - Strong & Sustainable Communities Charts Q4,HM Local 62a page 36 27/05/2016
94.6%
94.0%
100.0%
100.0%
100.0%
86.0%
100.0%
83.0%
80.0%
100.0%
100.0%
100.0%
100.0%
2013/14
2014/15
apr
may
jun
jul
aug
sep
oct
nov
dec
jan
feb
mar
0% 10% 20% 30% 40% 50% 60% 70% 80% 90% 100%
% within 8 weeks
Responsible Manager
Kieren Johnson - Housing Support Manager
Criteria Used
Reported quarterly, by area/overall on a NON-cumulative basis, shown as a %.
Comments All recent visits carried out have been within target.
PHP LOCAL 62a - % of New Tenant Visits (Sheltered) Within 8-week Target
HOUSING MANAGEMENT (a Customer Care indicator)
BENCHMARKING
Currently there are no benchmarking figures available for this indicator.
(average monthly figure)
(average monthly figure)
(no visits)

XL - Strong & Sustainable Communities Charts Q4,HM Local 64 page 37 27/05/2016
18
21
23
37
35
25
23
33
28
34
39
26
0 5 10 15 20 25 30 35 40
No of TRVs completed
Responsible Manager
Sue Howes - Housing Manager
Criteria Used
Reported monthly on a non-cumulative basis
Comments A new Tenancy Review Visit process was introduced during this year and is bedding in well. 342 visits were completed during the year. From these visits the main findings requiring further action/follow-up were (mainly minor) tenancy breaches (43%), repairs being needed (43%), and under-occupation (38%). The TRVs allow us to pro-actively ensure that tenants are coping, and to arrange support where needed.
PHP LOCAL 64 - General Needs TRVs Completed Each Month
HOUSING MANAGEMENT (a Customer Care indicator)
BENCHMARKING
Currently there are no benchmarking figures available for this indicator.
(new for 15/16)

XL - Strong & Sustainable Communities Charts Q4,RI Local 35 page 38 27/05/2016
108
110
108
114
114
114
114
113
113
113
0 10 20 30 40 50 60 70 80 90 100 110 120 130 140 150
No of Residents
Responsible Manager
Gail Percival - Estate Services Manager
Criteria Used
Reported monthly as a snapshot at the end of each month
(PHP Residents only)
Comments For the new financial year (16/17) we will be moving to a new methodology for calculating the number of involved residents.
PHP Local 35 - Number of residents involved in tenant participation at the end of the period
RESIDENT INVOLVEMENT (a Customer Care indicator)
BENCHMARKING
PHP are looking to develop benchmarking in the future against partnership organisations
within the ALMO sector
(data not available)
(new indicator for 15/16)

XL - Strong & Sustainable Communities Charts Q4,SV Local 503 page 39 27/05/2016
33
37
37
41
0 5 10 15 20 25 30 35 40 45 50
No of Volunteers
Responsible Manager
Kieren Johnson - Housing Support Manager
Criteria Used
Reported quarterly, as an end-of-quarter snapshot
Comments The numbers are fairly consistent, with a balance between new volunteers and those leaving to pursue education or employment. This offers the volunteers opportunities and provides PHP with value for money.
PHP Local 503 - Number of Volunteers
SUPPORTING THE MOST VULNERABLE (a Customer Care indicator)
BENCHMARKING
Currently there are no benchmarking figures available for this indicator
(new indicator for 15/16)

XL - Strong & Sustainable Communities Charts Q4,SV Local 503d page 40 27/05/2016
54
16
5
7
11
0 5 10 15 20 25 30 35 40 45 50 55 60
No of Residents Moved
Responsible Manager
Kieren Johnson - Housing Support Manager
Criteria Used
Reported quarterly, on a non-cumulative basis
Comments There has been an increase in nominations during the quarter. We nearly achieved the target of 40 householders being moved to smaller accomodation over the financial year - one was moved shortly after the year ended.
PHP Local 503d - No of Residents Moved via Under-occupation Project
SUPPORTING THE MOST VULNERABLE (a Customer Care indicator)
BENCHMARKING
Currently there are no benchmarking figures available for this indicator
(annual figure)
(new indicator for 15/16)