mark a. chappell*, theodore garland, jr., geoff f. robertson, and … · 2007-09-21 · page 1...
TRANSCRIPT

page 1
Relationships among running performance, aerobic physiology, and
organ mass in male Mongolian gerbils
Mark A. Chappell*, Theodore Garland, Jr., Geoff F. Robertson, and Wendy Saltzman
Department of Biology, University of California, Riverside, California, 92521, USA
Running title: Exercise performance in gerbils
*Author for correspondence (e-mail: [email protected])
page 2
Summary
Relationships among individual variation in exercise capacity, resting
metabolism, and morphology may offer insights into the mechanistic basis of whole-
animal performance, including possible performance trade-offs (e.g., burst versus
sustainable exercise; resting ‘maintenance’ costs versus maximal power output).
Although several studies of correlations between performance, metabolism, and
morphology have been performed in fish, birds and squamate reptiles, relatively little
work has been done with mammals. We measured several aspects of forced and
voluntary locomotor performance in Mongolian gerbils (Meriones unguiculatus), along
with minimal and maximal aerobic metabolic rates and organ sizes (mainly visceral
organs and the musculoskeletal system). Maximal sprint and aerobic speeds and
maximal oxygen consumption (V. O2max) during forced exercise were similar to those of
other small rodents; basal metabolic rate was below allometric predictions. At all tested
speeds, voluntary running had a lower energy cost than forced treadmill running, due
primarily to a higher zero-speed intercept of the speed-versus-power (oxygen
consumption) relationship during forced running. Incremental costs of transport
(slopes of speed-versus-power regressions) were slightly higher during voluntary
exercise. Few of the correlations among performance variables, or between
performance and organ morphology, were statistically significant. These results are
consistent with many other studies that found weak correlations between organismal
performance (e.g., V. O2max) and putatively relevant subordinate traits, thus supporting
the idea that some components within a functional system may exhibit excess capacity
at various points in the evolutionary history of a population, while others constitute
limiting factors.
Key words: energetics, individual variation, locomotion, maximum oxygen
consumption, Meriones unguiculatus, metabolic rate, rodent, symmorphosis

page 3
Introduction
Mechanistic, comparative, ecological, and evolutionary physiologists have long
been interested in animal locomotion (e.g., Irschick and Garland, 2001; Oufiero and
Garland, 2007). In most non-sessile animals, locomotor performance can be related
intuitively, and sometimes empirically, to such components of Darwinian fitness as
escape from predators, prey capture, foraging, courtship, territorial behavior, combat or
migration (e.g., Sinervo et al., 2000; Perry et al., 2004; Husak, 2006). From a mechanistic
perspective, locomotion is perhaps the most integrative (Dickinson et al., 2000) and
demanding aspect of organismal physiology, as it is dependent on coordinated
functioning of numerous organ systems and often requires the highest attainable
intensities of aerobic and anaerobic power output. In an ecological context, locomotor
costs are an unavoidable part of an animal’s energy budget, and hence impact food
requirements, foraging efficiency, and allocation of energy among competing demands
of maintenance, growth, and reproduction.
Decades of comparative work have yielded a broad understanding of energetics
and biomechanics during terrestrial locomotion, swimming, and flying (e.g., Taylor et
al., 1970; Tucker, 1975; Miles, 1994; Wainwright et al., 2002; Alexander, 2003; Bejan and
Marden, 2006). The mass scaling of locomotor costs has been documented extensively,
as has the magnitude of interspecific variation in performance abilities during burst and
sustainable exercise (e.g., Djawdan and Garland, 1988; Garland et al., 1988; Djawdan,
1993; Domenici and Blake, 1997; Bonine and Garland, 1999; Weibel et al., 2004). A
number of comparative studies have also explored the mechanistic underpinnings of
locomotor performance; perhaps the best known of these is the classic series of papers
from C. R. Taylor, E. Weibel, and their colleagues on the scaling of mammalian oxygen
uptake, transport and delivery systems in relationship to aerobic capacity in running
exercise (e.g., Weibel and Taylor, 1981; Weibel, 1984; Weibel et al., 2001; 2004).
page 4
More recently, an important contribution of evolutionary physiology has been a
growing focus on intraspecific studies (Bennett, 1987; Garland and Carter, 1994), with
one emphasis being the exploitation of individual variation to gain insights into
performance across many levels of integration. This approach has been used to
examine trade-offs between burst versus endurance performance, links between resting
and maximal metabolic rates, interactions between aerobic capacity and running speed
or endurance, and the sub-organismal traits (limb dimensions, organ size, enzyme
function, mitochondrial properties, etc.) that ‘drive’ performance variation and hence
might be expected to change in response to training (phenotypic plasticity) and/or in
response to selection (genetic evolution). A number of such studies (e.g., Garland, 1984;
Garland and Else, 1987; Gleeson and Harrison, 1988; Chappell and Bachman 1995;
Hammond et al., 2000; Sinervo et al., 2000; Vanhooydonck et al., 2001; Harris and
Steudel, 2002; Odell et al., 2003; Pasi and Carrier, 2003; Brandt and Allen, 2004; Kemp et
al., 2005) have found an assortment of within-species associations between traits, but
the combined results reveal surprisingly few consistent overall patterns (see
Discussion).
Here we report results of a comprehensive intraspecific study of locomotor
performance, aerobic physiology, and organ size in Mongolian gerbils (Meriones
unguiculatus: Milne-Edwards 1867). Mongolian gerbils are small, quadrupedal rodents
native to open grasslands and sandy deserts in central Asia, sheltering in burrows but
foraging and performing other activities above ground (Naumov and Lobachev, 1975;
Ågren et al., 1989). They show no obvious morphological specialization for sprinting,
distance running, or digging and appear to be locomotor generalists. Although
domesticated, gerbils have been removed from the wild state for far fewer generations
than laboratory mice or rats: they were first brought into laboratory culture in 1954
(Schwentker, 1963).
page 5
Our study took advantage of a recently developed method for obtaining detailed
information on the energetics and behavior of voluntary running, in addition to more
traditional tests of the limits to performance in forced exercise. As well as providing
data on the intermediate work intensities frequently used by animals, this approach
might indicate if locomotor physiology differs between forced and voluntary running
(Chappell et al. 2004; Rezende et al. 2006), and if routine voluntary activity is
constrained by physiological limits. Additionally, we were interested in interactions
between different performance traits: sprint versus aerobic performance, basal versus
maximal aerobic metabolism, and relationships between aerobic physiology and
voluntary running. Finally, to explore potential morphological bases for performance
capacity, we examined size variation in major organ systems, including central support
organs (heart, lung, digestive tract, liver, kidneys), control systems (brain), and the
primary peripheral effector of locomotion, the musculoskeletal system.
Methods
Animals: We obtained gerbils from a breeding colony at the University of California,
Riverside; the founding stock came from Harlan Sprague-Dawley, Indianapolis,
Indiana. To avoid potential complications of estrous cycles, we used only adult males
that were between 92 and 174 days old at the conclusion of measurements (mean 123
days, SD 22 days; N = 40). Gerbils were housed initially in standard polycarbonate
cages (48 X 27 X 20 cm) in groups of 2-5 age-matched males; during experiments they
were housed singly. The light cycle was 12 h L: 12 h D (lights on at 0700 – 1900 h),
temperature in the animal room was maintained at ~ 23 °C, and animals had ad libitum
access to water and commercial food (Purina Rodent Chow 5001), supplemented
periodically with sunflower seeds, oats, and carrots (Saltzman et al., 2006).
We collected data from each animal on the following schedule: voluntary wheel
running (acclimation, days 1-4; measurements, days 5-6), maximal oxygen consumption

page 6
during forced treadmill exercise (V. O2max; days 7 and 8), metabolic costs of transport on
a treadmill (day 9), maximal sprint speed (days 10 and 11), basal metabolic rate (BMR)
(night of day 11), and then sacrifice for organ mass measurements (day 12).
All animal procedures were approved by the U.C. Riverside Institutional Animal
Care and Use Committee and are in compliance with U.S. National Institutes of Health
Guidelines (NIH publication 78-23) and U.S. laws.
Energetics of voluntary activity: We used enclosed running wheel respirometers that
permitted simultaneous measurement of wheel speed and gas exchange every 1.5 sec
for 48 h, as described in Chappell et al. (2004; see also Rezende et al., 2006). The wheels
(Lafayette Instruments, Lafayette, Indiana, USA) were constructed of stainless steel and
Plexiglas, with a circumference of 1.12 m. Gerbils were allowed 4 days access to similar
but unenclosed wheels to acclimate prior to measurements. Each Plexiglas wheel
enclosure had an internal fan to rapidly circulate and mix air and contained a standard
polycarbonate mouse cage (27.5 cm X 17 cm X 12 cm, L X W X H) with bedding, a
drinking tube, and a food hopper containing rodent chow. Gerbils could move freely
between the cage and the wheel through a 7.7 cm diameter port cut into the wall of the
cage. Enclosures were supplied with dry air at flow rates of 2500 ml/min STP (± 1%) by
Porter Instruments mass flow controllers (Hatfield, Pennsylvania, USA). The speed and
direction of wheel rotation were transduced by a small generator that functioned as a
tachometer.
Output ports directed air from enclosures to oxygen and CO2 analyzers (‘Oxilla’
and CA-2A, respectively; Sable Systems, Henderson, Nevada, USA), which subsampled
excurrent air at about 100 ml/min. Subsampled air was dried with magnesium
perchlorate prior to analysis. A computer-controlled solenoid system obtained 3-min
reference readings (dry air) every 42 min. Data from all instruments were recorded by a
Macintosh computer equipped with an analog-to-digital converter and Warthog
page 7
Systems 'LabHelper' software (www.warthog.ucr.edu). Because of the large chamber
volume we smoothed metabolic data to minimize electrical noise and used the
‘instantaneous’ transformation to accurately resolve short-term events (Bartholomew et
al., 1981). The effective volume, computed from washout curves, was 17 L. Wheel
measurements lasted approximately 47.5 h. 'LabAnalyst' software (Warthog Systems)
was used to smooth data, subtract baseline values, correct for lag time (i.e., synchronize
wheel speed with gas exchange), replace reference data by interpolation, compute V. O2
and V. CO2, and extract the following values:
Average daily metabolic rate (ADMR; ml O2/min)
respiratory exchange ratio (RER; V. CO2/V
. O2; 24 h mean)
minimum resting V. O2 over 10 min (resting metabolic rate, RMR)
maximum voluntary V. O2 over 1, 2, and 5 min (V
. O2v1, V
. O2v2, V
. O2v5)
maximum instantaneous wheel speed (Vmax) over a 1.5 sec interval
maximum wheel speed over 1, 2, and 5 min (Vmax1, Vmax2, Vmax5)
total distance run (Drun) and total time run (Trun); 24 h means
We used a stepped sampling procedure, with 1-minute averages separated by 3
minutes, to obtain measures of V. O2, V
. CO2, and running speed without autocorrelation
(successive measurements over short intervals are not independent, because wheel
speed and metabolism do not respond instantly to changes in behavior). With this
protocol there is no statistically significant correlation between sequential 1-minute
averages (Chappell et al., 2004; Rezende et al., 2005; 2006). Previous studies with this
system used 5-min minimum averages for RMR, but in the present study we noted that
although the 5-min average RMR was only 9% lower than 10-min average RMR, CVs
were about 50% greater for the shorter averaging interval.
Maximal oxygen consumption: We used a motorized treadmill inclined at 19° above
horizontal to elicit V. O2max (Kemi et al., 2002). Gerbils were placed in a Plexiglas
page 8
running chamber (the working section was 33 cm long, 12.5 cm wide, and 12 cm high)
that slid above the moving tread, with the bottom edge sealed with felt strips and low-
friction Teflon tape. The chamber was supplied with air under positive pressure (8700
ml/min STP from a mass flow controller) through six input ports spaced along the top
of the chamber. About 1000 ml/min of air was pumped out through four ports on the
sides; the remainder escaped under the bottom edge of the chamber. About 150
ml/min of excurrent air was dried with magnesium perchlorate, flowed through a CO2
analyzer (LiCor 6251; Lincoln, Nebraska, USA), scrubbed of CO2 and redried (soda lime
and Dryerite, respectively), and passed through an O2 analyzer (Applied
Electrochemistry S-3A; Pittsburgh, Pennsylvania, USA). Flow rates, tread speed, and
gas concentrations were recorded every 1.0 sec by a computer, using 'LabHelper'
software. As with the running-wheel chamber, we used the ‘instantaneous’ correction
(Bartholomew et al., 1981) to accurately resolve short-term events. The effective volume
of the running chamber was 7200 ml.
An electrical stimulation grid at the rear of the chamber delivered 30-50 VAC
through a 10 K-Ω resistor to provide motivation (Friedman et al., 1991; Swallow et al.,
1998; Dohm et al., 2001). We gave gerbils several minutes to acclimate to the chamber
before starting the tread and accelerating over several seconds to low speed (1-1.5
km/h), which was maintained for about 30 sec. Most individuals quickly oriented
correctly and ran well. Subsequently we increased speed every 30 sec in steps of about
0.4 km/h until the animal could no longer maintain position on the tread, or until VO2
did not increase with increasing speed, or until the gerbil touched the shock grid for
more than 2 sec. Runs lasted 2.5 to 8 min; all animals attained V. O2max at speeds less
than the maximum tread speed of about 3.9 km/h.
Metabolic costs of transport: We used the same motorized treadmill, flow rates, and
sample rates to measure energy metabolism during sustained running, but the treadmill
was level instead of inclined. Gerbils were tested at speeds of 0.6 km/h to 3.8 km/h, in
page 9
increments of about 0.5 km/h. Speeds were presented in random order, and we
attempted to obtain 10 min of steady running at each speed. Some animals failed to run
steadily at some speeds, especially the lowest and highest speeds, but most individuals
performed well across a substantial speed range. Usually, gerbils were rested for at
least 20 min between speeds; they always resumed exploratory behavior within 5 min
after the end of a running bout (often, immediately after the tread was stopped).
Because steadily running animals usually adapted quickly to speed changes (more
rapidly than if they were accelerated from rest), we often made measurements at two
speeds without an intervening rest period. Reference readings of O2 and CO2 content
were obtained immediately before and after each running bout.
Basal metabolic rate: Captive Mongolian gerbils do not have a strong circadian activity
cycle and exhibit activity during both night and day (Lerwill, 1974; Sun and Jing, 1984).
We measured BMR at night. At approximately 17:00 h, following a 4-6 h fast, animals
were placed in 1.5 L Plexiglas metabolism chambers supplied with air at 620 ml/min
STP. The chambers were held at 30 ± 0.3 °C (well within the species’ thermal neutral
zone of 26-38 °C; Wang et al., 2000) in an environmental cabinet. About 100 ml/min of
excurrent air was scrubbed of CO2 and dried, then passed through a two-channel
Applied Electrochemistry S-3A/2 oxygen analyzer that allowed simultaneous
measurements on two animals. Flow rates, temperature, and oxygen concentration
were recorded every 4 sec, and a computer-controlled solenoid obtained 3-min
reference readings every 42 min until animals were removed at approximately 08:00 h
the following morning. Accordingly, the duration of fasting was at least 19 h at the end
of measurements. We used the lowest 10-min continuous average V. O2 to represent
BMR (see above).

page 10
Gas exchange calculations: In all respirometry systems, mass flow controllers were
upstream of metabolism chambers and air was supplied under positive pressure.
Nevertheless, differences in plumbing and gas handling necessitated use of different
equations to compute V. O2 for treadmill tests and BMR measurements, and during
voluntary exercise. For treadmill tests and BMR, we absorbed CO2 prior to O2
measurements and calculated V. O2 as:
V. O2 (ml/min) = V
. . (FiO2 - FeO2)/(1- FeO2) (1)
where V. is flow rate (ml/min STP) and FiO2 and FeO2 are the fractional O2
concentrations in incurrent and excurrent air, respectively (FiO2 was 0.2095 and FeO2
was always > 0.205). For voluntary exercise, we did not remove CO2 as required for
Eqn. 1 (to avoid the large volumes of soda lime or frequent scrubber changes that
otherwise would be necessary for these long-duration tests) and calculated V. O2 as:
V. O2 (ml/min) = V
. . (FiO2 - FeO2)/(1- FeO2 . (1 - RQ)) (2)
where RQ is the respiratory quotient (V. CO2/V
. O2). Based on preliminary data and
previous measurements (Chappell et al. 2004), we used a constant RQ of 0.85. Use of
0.85 creates a 3% overestimate of V. O2 if the real RQ = 1.0 and a 2% underestimate of V
.
O2 if the real RQ = 0.7. We selected a conversion equation based on constant RQ instead
of using measured CO2 concentration in V. O2 calculations in order to minimize potential
errors caused by unequal response times of O2 and CO2 analyzers. This was
particularly important in our system because behavior and metabolism changed rapidly
and instantaneous conversions (Bartholomew et al., 1981) were necessary.
For the same reasons we also assumed a constant RQ of 0.85 to calculate V. CO2
for both voluntary exercise and treadmill tests:
V. CO2 (ml/min) = V
. . (FeCO2 - FiCO2)/ (1 - FeCO2 . (1-(1/RQ))) (3)
where FiCO2 and FeCO2 are the incurrent and excurrent fractional concentrations of
CO2, respectively. Given that FeCO2 was always < 0.0025, the value of RQ had very

page 11
little effect on calculated V. CO2 (the maximum error for real RQs between 0.7 and 1.0
was 0.2%).
Gas exchange validations and energy equivalence:
All mass flow controllers used in the study (for measurements of BMR, voluntary
exercise, and treadmill running) were calibrated against the same dry volume meter
(Singer DTM-115; American Meter Company, Horsham, PA). Once per week, CO2
analyzers were zeroed with room air scrubbed of CO2 (soda lime) and spanned against
a precision gas mixture (0.296% CO2 in air). Drift between calibrations was small (<1%
of the span gas concentration).
The wheel chambers used for voluntary running measurements were calibrated
using a nitrogen dilution procedure (Fedak et al. 1981). Briefly, we added a small,
precisely measured flow of hypoxic gas (180 ml/min, 14.25% O2, balance N2) to a flow
of 2300 ml/min of air through the chamber. The hypoxic gas was released at specific
locations within the chamber via a thin, flexible tube inserted through the airtight port
for the drinking tube. The depletion in O2 content relative to pure air was equivalent to
a V. O2 of 12.06 ml/min. We recorded excurrent gas concentrations and calculated V
. O2
with the same procedures used for animals. A series of such tests with hypoxic gas
released in different locations (including inside the running wheel itself and in the
extreme corners of the mouse cage) yielded V. O2 measurements that were always within
2.4% of the ‘real’ value of 12.06 ml/min, with a mean of 12.02 ml/min.
A similar procedure was used for the treadmill system. Experiments with a
100% N2 gas point source revealed no position effects (a constant low flow rate of N2
through a small-diameter tube yielded equal deflections in O2 concentration at all
positions used by gerbils within the chamber, at tread speeds typical of gerbil running).
Calculated V. O2 measurements were within 2-3% of values expected from flow rates of
air and N2 (Fedak et al. 1981).
page 12
We converted rates of oxygen consumption to rates of energy expenditure by
multiplying V. O2 by 20.1 J/ml O2, which is appropriate for a mixed diet (Schmidt-
Nielsen, 1997).
Sprint speed: Maximum sprint velocities (speeds that gerbils could sustain for at least 2
sec) were measured on a 1.4 m long, high-speed treadmill (Bonine and Garland, 1999).
A digital readout displayed treadmill velocity with a resolution of ± 0.03 km/h over the
speed range used by gerbils (up to 14.5 km/h). A gerbil was placed in a 12 cm-wide
channel formed by plastic walls suspended a few mm above the tread. When the
animal faced forward, the belt was started and rapidly accelerated for as long as the
animal matched its speed. Forward running was encouraged by the operator’s gloved
hand, and the trial was terminated when the animal no longer maintained position.
Runs lasted less than 1 minute. The highest attained velocity was read from the digital
readout, and a qualitative score of running performance was assigned. Data from
animals that refused to run were not used in analyses (see Results). Gerbils were tested
twice, once on each of two successive days, and each individual’s highest speed on
either day was used as its maximum sprint speed.
Morphology: Within 24 h of the end of BMR measurements, animals were euthanized
(CO2 inhalation), weighed, measured (snout-rump length, head length from nose to the
rear of the skull, head width at the ears, and hind foot lengths), and dissected. We
removed the brain, ventricles of the heart, lungs, liver, spleen, kidneys, stomach, small
intestine, large intestine, caecum, and testes. The ventricles were blotted to remove
blood, and the contents of the digestive tract were removed. The vas deferens,
epididymis, prostate, and seminal vesicles were collectively weighed and referred to as
‘other reproductive structures’. Organs were trimmed of fat, rinsed in physiological
saline, blotted dry, and weighed (± 0.0001 g; Denver Instruments XE-100; Denver,

page 13
Colorado). We removed and weighed the gastrocnemius muscles, and the remaining
musculoskeletal system (all skeletal muscles and bones except the head, tail, and feet)
was trimmed of fat and weighed. Organs were then dried to constant mass at 50 °C and
re-weighed.
Statistics. Because organ size, aerobic physiology, and locomotor performance are
influenced by body size and potentially by age, we included body mass and age (in
days) as covariates, or computed residuals from regressions on mass and age.
Metabolic and body mass data were log10-transformed prior to analysis; results are
presented in untransformed units (as mean ± SD unless otherwise noted). The
significance level α was 0.05 (2-tailed tests). Multiple simultaneous tests (such as in
large correlation tables) are at risk of inflated Type 1 error rates. To compensate, we
used two methods. First, we provide an adjusted α from a sequential Bonferroni
correction (Rice, 1989). Such corrections have been criticized as inappropriately
conservative (they may increase type II errors unacceptably, e.g. Nakagawa, 2004), so
we also used the q-value procedure developed to control false discovery rates (FDR;
Storey and Tibshirani, 2003; Storey, 2003). Values of π0 (the overall proportion of true
null hypotheses) and corresponding q-values were generated with the ‘Qvalue’ library
run in the R statistical package (The R Foundation for Statistical Computing) using the
‘Bootstrap’ option. Other analyses were performed using the t-test, regression and
GLM procedures in SPSS for the Macintosh (SPSS, Incorporated, Chicago, Illinois).
Results
Mean body mass of the 40 adult male gerbils was 67.7 ± 6.0 g (Table 1). Age at
sacrifice ranged from 92 to 174 days (mean 123 ± 22 days). The correlation between age
and body mass was marginally significant (mass = 57.6 + 0.082 * age, r2 = .095, F1,38 =
4.0, P = .053). Some individuals were not tested for all measured traits and a few
page 14
refused to perform in certain procedures (mainly sprinting or treadmill cost of transport
measurements).
Most of the measured traits, including both performance and morphological
measures, varied significantly with body mass, and several varied significantly with age
(Table 2). To compare the relative variability of different traits, we used residuals from
allometric equations (Garland, 1984). For variables that do not scale with mass or age,
the SD of residuals (from loge-transfomed data) is approximately equivalent to the CV
of untransformed data. For variables that show significant scaling, the SD of residuals
(from loge-transformed data) is equivalent to the CV of untransformed data after
removing variation related to age and mass (Lande, 1976; Garland, 1984). In our data
set, CV ranged from 2-3% for brain and musculoskeletal system to about 50% for
voluntary wheel-running times and distances (Table 2).
Basal and maximal metabolic rate: Because of equipment constraints at the beginning of the
study, not all animals could be tested for BMR, and a few gerbils did not attain low and
stable V. O2 during BMR measurements. BMR was independent of age but was positively
correlated with body mass, as would be expected (Table 2; BMR in ml O2/min = .00729 *
mass1.18; r2 = .338, F2,26 = 12.0, P = .0019; Fig. 1). For a gerbil of average mass (68.4 g in the
27 animals tested for BMR), the predicted BMR was 1.07 ml O2/min (1.05 ml O2/min for
the average mass of 67.7 g for all 40 gerbils in the study).
Maximal oxygen consumption during forced treadmill exercise (V. O2max) was
significantly correlated with both body mass and age, scaling positively with mass and
slightly negatively with age (Table 2). For a gerbil of the average age and mass in this
study, predicted V. O2max was 11.2 ml O2/min, and factorial aerobic scope (V
. O2max ÷
BMR) was 10.7. Measured aerobic scopes (N = 27) ranged from 5.29 to 15.2, averaging
10.1 ± 2.48.
page 15
RER at V. O2max averaged 0.975 ± 0.072 (range .83 –1.14) and was independent of
age and mass (P > .55 for both). However, RER was negatively correlated with V. O2max
(F1,38 = 6.4, P = .015), declining from a predicted 1.07 in a gerbil with V. O2max = 7 ml
O2/min to 0.96 in a gerbil with V. O2max = 12 ml O2/min. We did not measure V
. CO2
during BMR studies.
Sprint performance: Some gerbils refused to run on the high-speed treadmill or ran
poorly on one or both of the two days of testing. For 16 individuals with acceptable
tests on both days, speed declined by 17%, on average, from day 1 to day 2 (11.5 ± 2.02
and 9.57 ± 2.08 km/h, respectively; paired t-test; P = 0.0018). However, individual
performances were significantly repeatable between days, as indicated by Pearson’s r =
.506 (F1,14 = 4.82, 2-tailed P = .045) (Nespolo and Franco, 2007). For individuals that
performed acceptably on at least one day (N = 34, mean mass 68.2 ± 6.1 g), we used the
highest attained speed from either day ('sprint speed') in other analyses. Age and body
mass did not affect sprint speed (Table 2), and the mean maximum sprint speed was
10.8 ± 2.0 km/h (Table 1).
Behavior and metabolism during voluntary activity: Gerbils did not make extensive use of
the running wheels. Daily averages were 1.24 km and 83.3 min (Table 1), which yields a
mean running speed of 0.89 km/h. Neither body mass nor age predicted either
distance run or time spent running (Table 2). The majority of time spent running was at
low speeds (< 0.5 km/h, see Fig. 2a), but most of the distance covered during running
was at speeds between 0.5 and 1.5 km/h (Fig. 2b). Maximum voluntary speeds
averaged over 1, 2, and 5 min were tightly correlated (Fig. 3a; regressions forced
through the origin), with Vmax2 averaging 83% of Vmax1 (r2 = .993) and Vmax5
averaging 67% of Vmax1 (r2 = .985).

page 16
Average daily metabolic rates (ADMR; kJ/day) were strongly positively
correlated with body mass but independent of age (Table 2), and averaged about 1.6 X
BMR (Fig. 1). Minimum resting (non-fasted) metabolic rates in the wheels (RMR) were
slightly but significantly lower than BMR (0.945 ± 0.129 versus 1.07 ± .206 ml O2/min,
respectively; 2-tailed P = .0108, paired t-test; mean RMR mass 67.7 g; mean BMR mass
68.4 g).
The maximal voluntary V. O2 was always much lower than the V
. O2max elicited
during forced treadmill exercise (Fig. 1). For 1-min averages, maximal voluntary V. O2 (V
.
O2v1) was 45% of V. O2max (5.1 versus 11.3 ml/min, respectively; P < .0001, paired t-
test). Similar to the results for maximum voluntary speeds averaged across different
intervals, voluntary V. O2 averaged over 2- and 5- min intervals was tightly correlated
with V. O2v1 (Fig. 3b; r2 = .999 and .994, respectively), but slightly lower : V
. O2v2 was
96% of V. O2v1, and V
. O2v5 was 87% of V
. O2v1 (regressions forced through the origin).
Respiratory exchange ratios averaged over 24 h were independent of mass but
slightly negatively correlated with age (F1,39 = 7.2, r2 = .16, P = .011), declining from .96
at 90 days to .87 at 170 days. These values are consistent with the RER of .92 expected
from steady-state complete oxidation of the diet (caloric content: 59.4% carbohydrate,
28.4% protein, and 12.3% fat according to the manufacturer).
Forced and voluntary locomotor costs: Most gerbils performed sufficiently well during
forced treadmill locomotion and voluntary running to provide useable data on
metabolic costs of locomotion (statistically significant regressions of metabolic rate on
speed; N = 35 for forced exercise, N = 38 for voluntary exercise, N = 34 for both forced
and voluntary exercise). Gerbils used roughly comparable speed ranges in both
conditions, although mean speeds were considerably lower in voluntary exercise
(2.18±1.0 km/h in forced exercise vs. 0.73 ± 0.78 km/h in voluntary exercise, F1,3708 =
818, P < .0001; Fig. 4). In forced exercise, the minimum treadmill speed was 0.6 km/h
page 17
and the maximum speed was about 3.8 km/h. During voluntary exercise, animals
regularly used speeds lower than 0.6 km/h. The mean maximum instantaneous speed
(1.5-sec average) was 4.1 km/h and the mean highest 1-min average speed was 2.5
km/h.
Body mass was significantly positively correlated with V. O2 during both forced
and voluntary running (Table 2), but conversion of V. O2 to mass-specific power output
(kJ kg-1 h-1) eliminated the statistical significance of body mass (results not shown).
There was little overlap in metabolic costs of forced and voluntary running, either in
individuals or for pooled data (Fig. 4), despite fairly similar ambient temperatures (22-
24 °C for forced exercise; 24-28 °C for voluntary exercise). To avoid the confounding
influence of dissimilar numbers of data points among animals, particularly for
voluntary running, we calculated slopes and intercepts of the speed versus V. O2
regression for each individual and used these in most analyses. These regressions
describe the cost of transport (COT), and we refer to COT in treadmill exercise and
voluntary exercise as tCOT and vCOT, respectively.
Because aerobic metabolism might be expected to plateau as animals approach
their maximum aerobic speed, we used quadratic regressions to test for nonlinearity.
Linear components of quadratic regressions were significant for all animals during
forced exercise and for 32 of 38 individuals during voluntary locomotion. The
quadratic component was never statistically significant during forced exercise, but was
significant (P < .05) in 11 gerbils during voluntary locomotion, with a coefficient of –6.23
± 6.55 (mean ± SD; all significant quadratic coefficients were negative). Values of r2
were only slightly higher for quadratic than for linear regressions (.539 ± .140 versus
.525 ± .130 for voluntary running; .874 ± .106 versus .815 ± .116 for forced exercise).
Because speed-versus-power relations for most individuals -- even in voluntary exercise
-- did not have significant quadratic components, we used slopes and intercepts from
linear regressions for subsequent analyses.

page 18
Intercepts were independent of body mass and age (Table 2) and differed
significantly between forced and voluntary running (t33 = 11.6, P < .0001; paired t-test).
The intercept for forced running (75.8 ± 15.7 kJ kg-1 h-1) was almost twice that for
voluntary exercise (38.9 ± 3.4 kJ kg-1 h-1; Fig. 4). Body mass had a small but statistically
significant effect on the slope for forced running, but not for voluntary exercise (Table
2). Age was unrelated to slope for both forced and voluntary running. Mean slope (the
incremental cost of transport, or COTINC) was slightly higher during voluntary running
(19.5 ± 3.9 kJ kg-1 km-1) than during forced exercise (15.7 ± 7.2 kJ kg-1 km-1; t33 = 3.34, P =
.0022; paired t-test). Using mean values of slopes and intercepts, at 4.0 km/h, the
predicted power output was 18.5% higher for forced exercise (138.6 kJ kg-1 h-1) than for
voluntary exercise (116.9 kJ kg-1 h-1), as was the total cost of transport (COT; 34.65 kJ kg-
1 km-1 versus 29.23 kJ kg-1 km-1, respectively; Fig. 4).
We estimated maximal aerobic speed (MAS, the highest speed sustainable with
aerobic power production) from treadmill-elicited V. O2max and the tCOT and vCOT
slopes and intercepts. We assumed that MAS was the velocity at which the speed-
versus-V. O2 regression attained V
. O2max; hence, MAS = (V
. O2max – intercept)/slope. We
excluded unrealistically high forced-exercise MAS estimates for two individuals (MAS
> 15 km/h, much faster than maximum sprint speed). Despite differences in slopes and
intercepts, tCOT and vCOT converge at high running speeds (forced exercise has a
higher intercept but lower slope than voluntary running). Estimated MAS did not
differ significantly for forced and voluntary locomotion, averaging 8.03 ± 1.28 km/h (N
= 31, mean mass = 68.4 ± 6.2 g) in voluntary exercise and 7.82 ± 1.43 km/h (N = 34,
mean mass = 68.3 ± 6.2) in forced exercise (P = .605, paired t-test). Therefore, the
minimum cost of transport, which occurs at the highest aerobic speed (Taylor et al.,
1982), did not differ between forced and voluntary running, although at lower speeds,
absolute COT was lower in voluntary exercise than in forced exercise.

page 19
Relationships among metabolic and locomotor variables: Tests of interactions among
metabolic, locomotor, and morphological traits were based on multiple simultaneous
comparisons (Tables 3, 4, 5). Results are discussed in terms of the unadjusted α of .05,
and after corrections for Type I errors via Bonferroni and FDR procedures; the P value
distributions used to compute FDR are shown in Fig. 5.
Relationships among metabolic and locomotor performance variables (Table 3)
were sometimes intuitive, but often not. BMR was not significantly correlated with any
other metabolic or locomotor performance variable, including V. O2max. Estimates of
maximal aerobic running speeds (vMAS and tMAS) were correlated with COT slopes
and intercepts, and with V. O2max (all of which were used to compute MAS), but V
.
O2max was not correlated with other variables. As expected, the distance covered and
time spent in voluntary running were tightly correlated, and both were positively
correlated with ADMR. We found no statistical relationship between sprint speed and
any metabolic trait, but sprint speed was positively correlated with maximum
voluntary running speed and the intercept for voluntary running (vCOTint).
Correlations between BMR and aerobic scope, V. O2max and MAS, Vmax and distance,
distance and run time, COT slopes and intercepts, and incremental COT and MAS
remained significant after applying a q-value correction, and several remained
significant even with the conservative Bonferroni correction.
Morphology and performance: We found few significant relationships between organ sizes
and metabolic or locomotor performance (Table 4). Several behavioral and metabolic
variables – running distance and time, COT slope and intercept in voluntary running,
maximum voluntary running speed, and ADMR – were statistically independent of all
morphological traits. Only one organ mass (caecum) was correlated with V. O2max. The
highest voluntary V. O2 (V
. O2v1) was negatively correlated with stomach and small
intestine mass, but positively correlated with brain mass. Head dimensions and snout-

page 20
rump length were not correlated with performance limits (BMR, V. O2max, sprint speed).
BMR was negatively correlated with the mass of the testes, but not with any other
organ. The size of the musculoskeletal system was positively correlated with tCOT, but
was not correlated with any other performance or metabolic variable. Gastrocnemius
mass was not correlated with any performance or metabolic trait. After we applied a
Bonferroni or q-value correction, none of the correlations retained significance.
Summed organ mass (including visceral organs, testes and other reproductive
structures, and brain) was not correlated with any locomotor or metabolic variable.
Correlations among morphological traits: The measured organs (wet mass) totaled 59.3 ±
3.5 % of body mass, with the musculoskeletal system comprising 45.1 ± 3.0 % of body
mass and the combined visceral organs, reproductive tissues, and brain comprising 14.3
± 1.0% of body mass. As fresh body mass included the contents of the digestive tract
(unmeasured, but probably several g for some individuals), the fractions of body mass
exclusive of digesta were somewhat higher than reported above.
Wet and dry organ masses were always highly correlated (r2 = .63 -.94; F > 65 and
P <.0001 in all cases). Consequently, relations among morphological traits were
qualitatively similar for wet and dry masses (Table 5); we discuss dry mass results here.
We found significant positive correlations among several visceral organs, notably those
involved with food, nutrient, and metabolic waste distribution and processing (heart,
liver, stomach, small intestine, large intestine, and kidney). The mass of the
musculoskeletal system was positively correlated with heart, liver, and kidney mass.
Testis mass was positively correlated with lung, liver, kidney, and spleen mass, but was
independent of the mass of other reproductive structures. Snout-rump length was
significantly related to head dimensions and the size of several visceral organs. Brain
mass, gastrocnemius mass, and hind foot length were not significantly correlated with

page 21
any other morphological trait, and q-value correction removed significance from all
correlations involving head dimensions and caecum mass.
Discussion
The four main goals of this study were to (1) determine the limits of aerobic metabolism
and sprint speed in Mongolian gerbils, and test for interactions among these limits; (2)
ascertain the extent to which voluntary locomotor behavior is constrained by
physiological performance limits; (3) compare energy costs of transport for voluntary
versus forced locomotion; and (4) test for associations between complex whole-animal
performance traits and the sizes of ‘subordinate’ effectors (visceral organs, brain, and
the musculoskeletal system). To put our results into an appropriate context, it is useful
to compare the locomotor and aerobic physiology of gerbils with that of other small
mammals.
Basal metabolic rates of our gerbils (1.05 ml O2/min for a 67.7 g animal) were
considerably lower than a previous measurement for M. unguiculatus (2.4 ml O2/min
for the same mass; Wang et al., 2000), and somewhat less than predicted by several
allometries for BMR in rodents. Back-transformation from log-log allometric
regressions can lead to errors (Hayes and Shonkwiler, 2006), so we make comparisons
with log10 values; i.e., our value of log10 BMR (ml O2/min) for a 67.7 g gerbil is 0.0212
and the Wang et al. (2000) value is 0.380. For the same mass and units, Hinds and Rice-
Warner (1992) predicted a log10 BMR of 0.164 in non-heteromyid rodents, and Bozinovic
(1992) estimated a log10 BMR of 0.152 from an analysis of 29 species, primarily from
South America. A recent study of 57 populations from 46 species (Rezende et al., 2004a)
predicted a log10 BMR of 0.225 for a gerbil-sized rodent, using a model that included
adjustments for phylogenetic relationships. The intraspecific mass exponent of 1.16 for
gerbil BMR was higher than the expected interspecific scaling exponent of
approximately 0.75, but the 95% confidence interval (.469 – 1.84) includes 0.75.

page 22
Our finding that RMR was slightly but significantly lower than BMR is puzzling,
as validation tests with steady-state nitrogen dilution indicated high accuracy in V. O2
measurements. However, it is possible that unexpectedly low RMR values may be
artifacts from a combination of poor mixing in the corners of the wheel enclosure’s
home cage (where gerbils often slept; unpublished data), coupled with position changes
and the instantaneous correction applied to gas exchange calculations. It is also
possible that despite the lack of a strong circadian activity cycle in captive gerbils
(Lerwill, 1974; Sun and Jing, 1984), we would have obtained lower BMR had we
measured it during the day instead of at night. However, most of the minimal RMR
occurred during the day (25 of 40). The results nevertheless indicate that temperatures
in the wheel enclosures (25.1 ± 0.96 °C) were within or close to the thermal neutral zone
of gerbils (26-38 °C according to Wang et al., 2000).
In comparison with other small mammals, Mongolian gerbils are intermediate in
athletic ability. Exercise V. O2max in gerbils (11.2 ml O2/min for a 67.7 g animal; log10 =
1.049) is almost identical to the 11.3 ml O2/min (log10 = 1.053) predicted by a recently
compiled allometry for maximum running V. O2 in a wide size and taxonomic range of
mammals (Weibel et al., 2004). Given their low BMR and average V. O2max, gerbils have
a relatively large factorial aerobic scope for exercise (10.7). In comparison, equations for
rodent exercise V. O2max and BMR from Hinds and Rice-Warner (1992) give an
estimated scope of 6.5. If the Weibel et al. (2004) V. O2max estimate is substituted, the
estimated scope is 7.7 (all of these values are higher than most estimates of thermogenic
aerobic scopes: typically 5-6 in warm-acclimated rodents; e.g., Bozinovic, 1992).
Estimated maximal aerobic speeds (MAS) of gerbils during forced exercise (7.82
± 1.43 km/h, body mass = 67.7 g) are higher than the value of 4.88 km/h predicted from
the allometric equation for 39 species of mammals provided by Garland et al. (1988), but
within the range of variation for rodents in their sample (e.g., see their Fig. 3). Gerbils
were fairly slow sprinters, with maximum sprint speeds averaging 10.8 km/h,

page 23
compared to a mean of 13.4 km/h for 14 species of quadrupedal North American
rodents (8.9 – 112 g; Djawdan and Garland, 1988; see also Garland et al., 1988). Thus,
the MAS of gerbils is a fairly high percentage (75%) of maximum sprint speed. This is
roughly comparable to the MAS of 67% of a rather low sprint speed in one strain of
laboratory mice (Mus domesticus; 3.4 versus 5.1 km/h; Dohm et al., 1994, Girard et al.,
2001). However, the MAS of 5.45 km/h in deer mice (Peromyscus maniculatus) running
at 25 °C is only 41% of their sprint speed of 13.4 km/h (Djawdan and Garland, 1988;
Chappell et al., 2004). Across a broad range of mammals, sprint speeds typically
average 2-3-fold higher than MAS, and the two measures are generally uncorrelated
after controlling for the correlation of each with body mass (Garland et al., 1988).
Aerobic and sprint performance limits: In recent years there has been considerable
discussion of functional or evolutionary relations among performance traits, especially
the upper and lower limits to aerobic metabolism (a well-known example is the ‘aerobic
capacity’ model for the evolution of endothermy; Bennett and Ruben, 1979; Bennett,
1991), and trade-offs between sprint and aerobic performance that might affect
evolutionary responses to selection on speed or power output (e.g., Garland et al., 1988;
Garland, 1994; Vanhooydonck et al., 2001; Vanhooydonck and Van Damme, 2001; Van
Damme et al., 2002; Syme et al., 2005).
Results from a number of studies of the relationship between BMR and V. O2max in
birds and mammals do not reveal a clear pattern (Table 6). Part of the inconsistency
derives from use of dissimilar techniques for eliciting maximum V. O2: forced exercise
and acute cold exposure. The two methods usually do not necessarily yield the same
maximum V. O2 (e.g., Chappell and Bachman, 1995; Rezende et al., 2005), and in small
mammals the differences between V. O2max in cold and exercise are often enhanced by
cold acclimation (Hayes and Chappell, 1986; Chappell and Hammond, 2004; Rezende et
al., 2004b). Even if non-uniform methodologies are avoided or accounted for, there are

page 24
difficult interpretive issues in analyses of relationships between BMR and V. O2max (see
Hayes and Garland, 1995 for a review of the ‘aerobic capacity’ model).
In the present study, perhaps the most salient finding about the sprint and aerobic
physiology of gerbils was the paucity of significant correlations among V. O2max, BMR,
RMR, and sprint speed, as well as among other metabolic and locomotor traits (Table 3).
BMR was independent of V. O2max and RMR, and sprint performance was independent
of BMR, RMR, and V. O2max. The latter finding contrasts with a significant positive
correlation between sprint speed and V. O2max in a sample of 35 male laboratory mice
(Friedman et al., 1992). Factorial scope (a measure of the expandability of aerobic
power production; V. O2max/BMR), was independent of all other metabolic and
locomotor variables except the estimated maximal aerobic speed (MAS). An absence of
relationships among these traits might be expected if trait variance was low. However,
variance (CV) in gerbil aerobic limits (BMR and V. O2max; 8.8 and 16.2%; Table 2) was
similar to that observed in species with significant correlations among these indices
(e.g., deer mice: Hayes, 1989; Belding’s ground squirrels, Spermophilus beldingi: Chappell
and Bachman, 1995; house sparrows, Passer domesticus: Chappell et al., 1999). Variation
in sprint performance (18.7%) was of similar magnitude. These findings suggest that
enhanced sprint speed or increased aerobic exercise capacity in gerbils will not elicit
penalties such as burst-versus-endurance performance trade-offs or increased
maintenance costs (at least within the limits of trait variation in our study population).
Voluntary locomotor behavior: The Mongolian gerbils in this study ran considerably less
than several other rodent species that have been tested in the enclosed-wheel metabolic
chambers. The mean time spent running and distance covered by gerbils was 83 min
and 1.2 km/day, compared to 126 min and 3 km/day in deer mice Chappell et al.,
2004), 319 min and 4.9 km/day in random-bred control ( C ) lines of laboratory mice,
and 373 min and 8.6 km/day in lab mouse lines selected for high voluntary running

page 25
distance (S lines; Rezende et al., 2006). Gerbils also ran less than several species of
wild-caught rodents (least chipmunks Tamias minimus, Panamint kangaroo rats
Dipodomys panamintinus, golden-mantled ground squirrels Spermophilus lateralis, and
Belding’s ground squirrels, M. A. Chappell, unpublished data), although individual
variation was substantial. A possible caveat is that we used only male gerbils in the
present study. In some species (lab mice; Swallow et al., 1998; Koteja et al., 1999a,b;
Rezende et al., 2006) females run more extensively than males, although this is not
always the case (deer mice; Chappell et al. 2004).
Relationships between running speed and metabolic rate (e.g., Taylor et al., 1982)
indicate that although high speeds require correspondingly high rates of energy
expenditure, they result in the lowest absolute cost of transport (the energy necessary to
move a given mass a given distance, independent of speed). Accordingly, the most
economical running speed that avoids problems of extensive anaerobic power
production should be the maximal aerobic speed (MAS). Free-living golden-mantled
ground squirrels (Spermophilus saturatus) appear to minimize transport costs by
preferentially traveling at speeds close to their MAS (Kenagy and Hoyt, 1988; 1989), but
our gerbils did not do this in running wheels. MAS in gerbils is about 8 km/h, while
voluntary running speeds in the wheel enclosures (1-minute averages) were strongly
biased towards speeds < 1 km/h, rarely reached 3 km/h, and never reached 4 km/h, or
50% of MAS (Figs. 3, 4). Even the highest instantaneous speeds (from 1.5-sec sampling
intervals) did not exceed 60% of MAS. Absence of sprinting (speeds > MAS) and
extensive use of low and intermediate speeds were also characteristic of voluntary
locomotion in deer mice (Chappell et al., 2004), laboratory house mice (Girard et al.,
2001; Rezende et al. 2006), and several species of wild rodents (unpublished data).

page 26
Most of the distance traveled by gerbils was accomplished at speeds < 2 km/h,
and the distributions of voluntary speeds and the distance-vs.-speed relationships in
gerbils (Fig. 2) are qualitatively similar to those for deer mice (Chappell et al., 2004).
The mean voluntary speed of gerbils (.90 km/h) was intermediate between that of C
lines of lab mice (.86 km/h) and both deer mice and S lines of lab mice (1.35 and 1.38
km/h, respectively), even though gerbils are two- to three-fold larger than these mice.
Perhaps coincidentally, the voluntary running distance in our study was similar to the
average daily movement reported for free-living Mongolian gerbils (1.2 - 1.8 km;
Naumov and Lobachev, 1975).
Consistent with the data on voluntary running speeds, voluntary 1-minute
maxima for oxygen consumption (V. O2v1) were always well below the aerobic capacity
of gerbils, averaging about 42% of V. O2max (Fig. 1). This is considerably less than
corresponding values for two other rodent species tested in the same enclosed wheel
respirometer. In deer mice running at 25 °C, V. O2v1 averaged 72% of V
. O2max (Chappell
et al., 2004), and in lab mice measured at similar temperatures, V. O2v1 averaged 70% -
80% of V. O2max (C and S lines, respectively; Rezende et al., 2005). As mentioned above,
some of the difference may be attributable to our use of male gerbils, because female
laboratory mice run longer and faster than males. Given that gerbils, as well as deer
mice and laboratory mice, voluntarily run well within their aerobic limits, the lack of
correlation between voluntary running behavior and V. O2max is not surprising.
Generally similar findings were reported for laboratory rats (Rattus norvegicus) by
Lambert et al. (1996): voluntary running performance in untrained rats could not be
predicted by results from treadmill tests of sprint speed or V. O2max, and even after
training there was no correlation between voluntary running and V. O2max. However,
we found a weak correlation between maximum treadmill-elicited sprint speed and
maximum voluntary speed (Table 3), and Friedman et al. (1992) reported consistent (but

page 27
not statistically significant) positive correlations between wheel running and V. O2max in
male laboratory mice.
Locomotor energetics and cost of transport: The generally linear relationship between
running speed and metabolic rate in gerbils undergoing forced exercise, and the
elevated intercept of the speed-versus-metabolism regression with respect to resting
metabolism (the 'postural cost' of locomotion; Taylor et al., 1970), are qualitatively very
similar to results from a broad range of species measured during treadmill locomotion
(Taylor et al., 1982). However, gerbils are economical runners: the slope (incremental
COT) for gerbils undergoing forced exercise (slope in kJ kg-1 km-1 = 15.7) was
substantially less than predicted by an allometric equation (slope = 25.1; Taylor et al.
1982, equation 8 transformed to kJ kg-1 km-1 using 20.1 J per ml O2). The slope for
gerbils performing voluntary exercise (slope = 19.5) was somewhat greater than for
forced exercise, but still less than the allometric prediction.
Perhaps of greater interest than the lower-than-predicted slopes is the lower
zero-speed intercept for voluntary running than for forced running (Fig. 4). Given that
BMR was about 18.7 kJ kg-1 h-1 and both forced and voluntary exercise were performed
at temperatures within or close to thermoneutrality (Wang et al., 2000), the 'postural
cost' for voluntary exercise is about 20 kJ kg-1 h-1 (108% of BMR), compared to about 57
kJ kg-1 h-1 (305% of BMR) for forced exercise. We presume that the 37 kJ kg-1 h-1
difference in postural costs (and the associated divergence in absolute costs of transport,
at least at low and moderate speeds) results from higher anxiety, fear or stress during
forced exercise than during voluntary exercise. If that conjecture applies universally,
then many published data on costs of transport – which are based almost exclusively on
forced running protocols – may be elevated above the 'true' (voluntary) running costs
experienced by animals under natural conditions. Conceivably the lower slopes
during forced exercise may also be an effect of stress, but there are many other factors

page 28
that differ between wheel and treadmill running (next paragraphs) that might account
for the difference.
Consistent with our results for gerbils, Rezende et al. (2006) found higher zero-
speed intercepts for forced than for voluntary exercise in laboratory mice. However,
much more data from a variety of species are needed to explore these issues
thoroughly, and at least two important caveats apply. First, our gerbils (and the mice
used by Rezende et al., 2006) were treadmill-tested without prior training and
conditioning. In most treadmill-based studies, animals were trained for extended
periods prior to measurements, such that stress during forced exercise might have been
ameliorated (e.g., Taylor et al, 1982 trained animals to run on a treadmill for "a period of
weeks to months"). For example, Taylor et al. (1982) used data from 62 treadmill-tested
species to generate allometric regressions for running costs. Their equation 7
(transformed to kJ kg-1 h-1 using 20.1 J per ml O2) predicts an intercept of 49.1 for a 67.7
g animal, which is less than our value of 75.8 in untrained gerbils during forced
exercise, but more than our value of 38.9 during voluntary exercise.
Second, regardless of the effects of training or stress, comparisons between wheel
and treadmill tests are potentially problematic for several reasons, as discussed in detail
in Chappell et al. (2004). In brief, (a) treadmill data are usually from steady-state
running at constant speeds while voluntary running in species thus far studied is
typically intermittent with variable speeds, (b) wheels have momentum that allows
‘coasting’ (Koteja et al., 1999a) but reduces acceleration, and (c) treadmill running is
normally on a level substrate whereas animals in wheels can change between level,
uphill, or downhill running. It could be argued that these factors are more likely to
influence the slope of the speed-versus-metabolic rate regression than its intercept.
However, our results, and similar data for deer mice (Chappell et al., 2004; unpublished
data) and for laboratory mice (Rezende et al., 2006) suggest that slopes (COTINC) do not
differ substantially between forced and voluntary locomotion.

page 29
Only a small fraction of the energy used daily by gerbils was spent on wheel
running. On average, incremental running costs (= daily run distance in km * COTINC)
were 6.7 ± 3.8% of average daily metabolic rate (ADMR). Surprisingly, that is almost
identical to the fraction of ADMR reported for deer mice that ran more than three times
as far per day (6.3%, Chappell et al., 2004), and is similar to fractional locomotor costs in
two strains of laboratory mice running 4X and 10X as far as gerbils (4.4% and 7.5% of
ADMR, respectively; Koteja et al., 1999b). The similarity in running costs as a
percentage of ADMR in mice and gerbils, despite large differences in running distance,
is probably due in part to the relatively low metabolic rates of gerbils when not using
wheels. Deer mice were frequently active (judged by high and variable V. O2) during
periods when no wheel-running occurred (Chappell et al., 2004); this was uncommon in
gerbils (unpublished data). Consequently, ADMR at 25 °C was only 50% higher in
gerbils than in deer mice (50.1 and 33.3 kJ/day, respectively) despite a 3-fold difference
in body mass; temperatures were within or close to thermoneutrality for both species.
Our animals also had considerably lower ADMR than was previously reported for
Mongolian gerbils at similar temperatures (89.4 kJ/day in 74.1 g animals housed in
large cages but without wheels at 25 °C). At that ADMR, our incremental running costs
would be 3.8% of daily energy use. Although low, all of these values are substantially
larger than the predicted ‘ecological cost of transport’ of 0.66% of ADMR for a 67.7 g
mammal (Garland, 1983).
Performance and subordinate morphological traits: The behavioral and physiological
capabilities of intact animals must reflect characteristics of their organs and tissues, and
a number of studies have shown that individual differences in performance are
correlated with variation in relative organ size. In endotherms, much of the work has
concerned BMR in birds, with particular interest in the role of central (visceral) support
organs versus peripheral effectors such as skeletal muscle. Several early papers that

page 30
examined intraspecific variation (e.g., Daan et al. 1990; Piersma et al., 1996) suggested
that BMR is largely determined by the metabolic output of visceral organs, but
subsequent studies of both mammals and birds have revealed little consistency in the
specific organs that correlate with BMR (Table 7; for a related study on frogs see
Steyermark et al., 2005). In one recent study of deer mice, individual organs were
largely uncorrelated to BMR, but the combined mass of visceral organs was positively
correlated to BMR while the opposite was true for musculoskeletal mass (Russell and
Chappell, 2006). A smaller group of intraspecific tests have explored morphological
correlations with the other extreme of aerobic performance, maximum V. O2 (Table 7; for
studies of lizards, snakes, and frogs see John-Alder, 1983; Garland, 1984; Garland and
Else, 1987; Garland and Bennett, 1990). Again, few consistencies are apparent, other
than an unsurprising positive relationship between muscle mass and exercise V. O2max
in two bird species. Few similar data are available for other performance traits in
mammals, such as sprint speed and jumping ability (Table 7).
Statistically significant correlations between whole-animal performance and
physiology, organ masses, and head, foot, and body linear dimensions were absent in
our male gerbils (Table 4, Fig. 5), despite considerable variance in both performance and
morphology. We were particularly surprised to find no relation between V. O2max and
either the peripheral effector organs primarily responsible for high rates of oxygen
consumption (the musculoskeletal system, which comprised 40-54% of total body mass)
or the central visceral organs most directly involved in oxygen uptake and delivery
(heart and lungs).
It is difficult to draw strong conclusions from an absence of correlative
associations between structure and function. Our results do not implicate the masses of
specific central or peripheral organs, or even pooled visceral or musculoskeletal organs,
as controlling factors for aerobic or sprinting performance. It is likely that traits we did
not measure (hematocrit, enzyme function, total limb dimensions, capillary geometry,

page 31
mitochondrial density, muscle fiber type, etc.) play crucial roles in setting performance
limits. It is also conceivable that our protocols for testing performance did not push
animal to their limits. There was no evidence for this, however, and the repeatability of
sprinting tests, as well as considerable experience with the techniques used to measure
sprint speed and V. O 2max convince us that our data are robust.
Relationships among organ sizes: Several of the correlations among body-mass corrected
organ sizes (Table 5) are intuitively consistent with integrated functions. For example,
many organs responsible for food, nutrient, and waste processing were positively
correlated (liver, stomach, intestine, kidney). Also, the size of the musculoskeletal
system, which is responsible for most aerobic power production, was positively
correlated with size of visceral organs responsible for oxygen delivery, nutrient
processing, and waste processing (heart, liver, and kidney, respectively). Testis size
correlated positively with several organs, but not with the size of other reproductive
structures or the musculoskeletal system. Interestingly, there were numerous
significant positive correlations among organ size, but only one significant negative
correlation (large intestine versus other reproductive tissues). That suggests gerbils
generally do not ‘trade-off’ mass allocations among visceral organs, or between visceral
organs and the musculoskeletal system. For example, a hypothetical conditioning
regime favoring increased proportional musculoskeletal mass would not necessarily be
expected to adversely affect digestive organs or reproductive structures, at least in
terms of organ size.
A recent report found considerably plasticity in the size of visceral organs
(particularly digestive organs) in Mongolian gerbils in response to changes in diet
quality (Liu and Wang, 2007). Compared to gerbils fed high-quality diets, animals
maintained for 14 days on a low-quality (high fiber) diet did not differ in body mass or
digestible energy intake, but the length and wet mass of the gut was significantly larger.

page 32
The authors did not measure muscle or musculoskeletal mass, but they ascribed
reduced carcass mass in animals on low-quality diets to loss of adipose tissue, rather
than to decreases in skeletal muscle mass.
Conclusions: We found no indication that aerobic capacity constrains voluntary
locomotor behavior in Mongolian gerbils, similar to results from two other small
mammals (Chappell et al., 2004; Rezende et al., 2006). Our data also do not support the
hypothesis that animals should preferentially run at near-maximal aerobic speeds in
order to minimize costs of transport (of course, food was available ad libitum in these
studies). Mechanistically, and of potential importance for evolution, we found no
evidence of trade-offs between capacities for sprinting and aerobic power production,
or of increased maintenance costs (BMR) in individuals with higher sprint or aerobic
performance. Thus, increased sprint speed or aerobic capacity would not be expected
to affect BMR. One possible reason for the lack of a trade-off between sprinting and
stamina-type locomotion is that gerbils are rather average in terms of both types of
performance, whereas trade-offs may be restricted to extreme performers (see Garland,
1994, pp. 268-270).
The generally linear relation between speed and metabolic rate in gerbils, and the
elevated zero-speed intercept relative to resting metabolism ('postural cost') resembled
that of other terrestrial runners. However, we found a difference in postural cost, and
hence absolute costs of transport at the speeds used by gerbils, between forced and
voluntary running: postural cost was higher during forced exercise. Our data revealed
no linkages between sprint and aerobic performance limits and the size of either central
or peripheral organs.
Our results are consistent with many other studies that have found weak
correlations between organismal performance (e.g., V. O2max) and putatively relevant
subordinate traits. They also bolster the conclusions of Garland and Huey (1987, p.

page 33
1407), who, in a critique of symmorphosis, wrote that "Some components within a
system may exhibit 'excessive construction' (Gans, 1979), whereas others constitute
limiting factors. Furthermore, given the vicissitudes of evolutionary change, factors
that are limiting (or in excess) may well differ among species (or populations)."
Acknowledgments: We are grateful to Leslie Karpinski, Scott A. Kelly, and Dr. Laura
McGeehan for gerbil care. The work was supported by U.C. Riverside academic senate
research awards, NSF IOB-0543429 (T. Garland, Jr.), and NSF IBN-0111604 (K. A.
Hammond and M. A. Chappell). W. Saltzman was supported in part by NIH grant
MH60728. We thank E. Hice and J. Urrutia in the UCR Biology machine shop for
constructing metabolism chambers and wheel enclosures. The comments of two
anonymous reviewers helped us improve the original version of the paper.

page 34
References
Ågren, G., Zhou, Q. and Zhong, W (1989). Ecology and social behavior of Mongolian
Gerbils, Meriones unguiculatus, at Xilinhot, Inner Mongolia, China. Animal
Behaviour 37, 11-27.
Alexander, R. McN. (2003). Principles of animal locomotion. Princeton University Press,
Princeton, NJ.
Autumn, K., Hsieh, S. T., Dudek, D. M., Chen, J., Chitaphan, C. and Full, R. J. (2006.)
Dynamics of geckos running vertically. J. Exp. Biol. 209, 260-272.
Bartholomew, G. A., Vleck, D. and Vleck, C. M. (1981). Instantaneous measurements of
oxygen consumption during pre-flight warm-up and post-flight cooling in
sphingid and saturnid moths. J. Exp. Biol. 90, 17-32.
Battley, P. F., Dekinga, A., Dietz M. W., Piersma, T, Tang, S. and Hulsman, K. (2001).
Basal metabolic rate declines during long-distance migratory flight in great knots.
Condor 103, 838-845.
Bejan, A. and Marden, J. H. (2006). Unifying constructal theory for scale effects in
running, swimming and flying. J. Exp. Biol. 209, 238-248.
Bennett, A. F. (1987). Inter-individual variability: an underutilized resource. In New
directions in ecological physiology (ed. M. E. Feder, A. F. Bennett, W. Burggren, and
R. B. Huey), pp 147-169. Cambridge, U.K.: Cambridge Univ. Press.
Bennett, A. F. (1991) The evolution of aerobic capacity. J. Exp. Biol. 160, 1-23.
Bennett, A. F. and Ruben, J. A. (1979). Endothermy and activity in vertebrates. Science
206, 649-654.
Bonine, K. E. and T. Garland, Jr. (1999). Sprint performance of phrynosomatid lizards,
measured on a high-speed treadmill, correlates with hindlimb length. J. Zool.
London 248, 255-265

page 35
Bozinovic, F. (1992). Scaling of basal and maximum metabolic rate in rodents and the
aerobic capacity model for the evolution of endothermy. Physiol. Zool. 65, 921-932.
Brandt, Y. and Allen, J. R. (2004). Persistence of individually distinctive display patterns
in fatigued side-blotched lizards (Uta stansburiana). Behav. Ecol. Sociobiol. 55, 257-
265.
Burness, G. P., Ydenberg, R. C. and Hochachka, P.W. (1998). Interindividual variability
in body composition and resting oxygen consumption rates in breeding tree
swallows, Tachycineta bicolor. Physiol. Zool. 71, 247-256.
Chappell, M. A. and Bachman, G. C. (1995). Aerobic performance in Belding's ground
squirrels, Spermopholis beldingi: variance, ontogeny, and the aerobic capacity model
of endothermy. Physiol. Zool. 68, 421-442.
Chappell, M. A., Bech, C. and Buttemer, W. A. (1999). The relationship of central and
peripheral organ masses to aerobic performance variation in house sparrows. J.
Exp. Biol. 202, 2269-2279.
Chappell, M. A. and Hammond, K. L. (2004). Maximal aerobic performance of deer
mice in combined cold and exercise challenges. J. Comp. Physiol. B. 174, 41-48.
Chappell, M. A., Garland, T., Jr., Rezende, E. L. and Gomes, F. R. (2004). Voluntary
running in deer mice: speed, distance, energy costs, and temperature effects. J. Exp.
Biol. 207, 3839-3854.
Daan, S., Masman, D. and Groenewold, A. (1990). Avian basal metabolic rates: their
association with body composition and energy expenditure in nature. Am. J.
Physiol. 259, R333-R340.
Dickinson, M. H., Farley, C. T. , Full, R. J., Koehl, M. A. R., Kram, R. and Lehman, S.
(2000). How animals move: an integrative view. Science 288, 100-106.
Djawdan, M. (1993). Locomotor performance of bipedal and quadrupedal heteromyid
rodents. Funct. Ecol. 7, 195-202.

page 36
Djawdan, M. and Garland, T., Jr. (1988). Maximal running speeds of bipedal and
quadrupedal rodents. J. Mammal. 69, 765-772.
Dohm, M., Hayes, J. P. and Garland, T., Jr. (2001). Quantitative genetics of maximal and
basal rates of oxygen consumption in mice. Genetics 159, 267-277
Dohm, M. R., Richardson, C. S. and Garland, T., Jr. (1994). Exercise physiology of wild
and random-bred laboratory house mice and their reciprocal hybrids. Am. J.
Physol. 276, R1098-R1108.
Domenici, P. and Blake, R. W. (1997). The kinematics and performance of fish fast-start
swimming. J. Exp. Biol. 200, 1165-1178.
Dutenhoffer, M. S. and Swanson, D. L. (1996). Relationship of basal to summit
metabolic rate in passerine birds and the aerobic capacity model for the origin of
endothermy. Physiol. Zool. 69, 1232-1254.
Fedak, M. A., Rome, L. and Seeherman, H. J. (1981). One-step nitrogen dilution
technique for calibration of open-circuit V. O2 measuring systems. J. Appl. Physiol.
51, 722-726.
Friedman, W. A., Garland, T., Jr. and Dohm, M. R. (1991) Individual variation in
locomotor behavior and maximal oxygen consumption in mice. Physiol. Behav. 52,
97-104.
Gans, C. (1979). Momentarily excessive construction as the basis for protoadaptation.
Evolution 33, 227-233.
Garland, T., Jr. (1983). Scaling the ecological cost of transport to body mass in terrestrial
mammals. Am. Nat. 121, 571-587
Garland, T., Jr., (1984). Physiological correlates of locomotory performance in a lizard:
an allometric approach. Am. J. Physiol. 274, R806-R815.
Garland, T., Jr. (1994). Quantitative genetics of locomotor behavior and physiology in a
garter snake. In Quantitative genetic studies of behavioral evolution (ed. C. R. B.
Boake), pp. 251-277. Chicago, USA: University of Chicago Press.

page 37
Garland, T., Jr. and Else, P. L. (1987). Seasonal, sexual, and individual variation in
endurance and activity metabolism in lizards. Am. J. Physiol. 252, R439-R449.
Garland, T., Jr. and Bennett, A. F. (1990). Quantitative genetics of maximal oxygen
consumption in a garter snake. Am. J. Physiol. 259 (Regulatory Integrative Comp.
Physiol. 28), R986-992.
Garland, T., Jr. and Carter, P. A. (1994). Evolutionary physiology. Annu. Rev. Physiol. 56,
579-621.
Garland, T., Jr. and Huey, R. B. (1987). Testing symmorphosis: does structure match
functional requirements? Evolution 41, 1404-1409.
Garland, T., Jr. and Janis, C. M. (1993). Does metatarsal/femur ratio predict maximal
running speed in cursorial mammals? J. Zool. 229, 133-151.
Garland, T., Jr., Geiser, F. and Baudinette, R. V. (1988). Comparative locomotor
performance of marsupial and placental mammals. J. Zool., Lond. 215, 505-522.
Garland, T., Jr., Gleeson, T. T., Aronovitz, B. A., Richardson, C. S. and Dohm, M. R.
(1995). Maximal sprint speeds and muscle fiber composition of wild and
laboratory house mice. Physiol. Behav. 58, 869-876.
Girard, I., McAleer, M. W., Rhodes, J. S. and Garland, T., Jr. (2001). Selection for high
voluntary wheel-running increases intermittency in house mice (Mus domesticus).
J. Exp. Biol. 204, 4311-4320.
Gleeson, T. T. and Harrison, J. M. (1988). Muscle composition and its relation to sprint
running in the lizard Dipsosaurus dorsalis. Am. J. Physiol. 255 (Regulatory Integrative
Comp. Physiol. 24), R470-R477.
Hammond, K. A., Chappell, M. A., Cardullo, R. A., Lin, R. S. and Johnsen, T. S. (2000).
The mechanistic basis of aerobic performance variation in red junglefowl. J. Exp.
Biol. 203, 2053-2064.

page 38
Harris, M. A. and Steudel, K. (2002). The relationship between maximum jumping
performance and hind limb morphology/physiology in domestic cats (Felis
silvestris catus). J. Exp. Biol. 205, 3877-3889.
Hayes, J. P. and Chappell, M. A. (1986). Effects of cold acclimation on maximum oxygen
consumption during cold exposure and treadmill exercise in deer mice, Peromyscus
maniculatus. Physiol. Zool. 59, 473-481.
Hayes, J. P., Garland, T., Jr. and Dohm, M. R. (1992). Individual variation in metabolism
and reproduction of Mus: are energetics and life history linked? Func. Ecol. 6, 5-14.
Hayes, J. P. and Garland, Jr., T. (1995). The evolution of endothermy: testing the
aerobic capacity model. Evolution 49, 836-847.
Hayes, J. P. (1989). Field and maximal metabolic rates of deer mice (Peromyscus
maniculatus) at low and high altitudes. Physiol. Zool. 62, 732-744.
Hayes, J. P. and Shonkwiler, J. S. (2006). Allometry, antilog transformations, and the
perils of prediction on the original scale. Physiol. Biochem. Zool. 79, 665-674.
Hayssen, V. and Lacy, R. C. (1985). Basal metabolic rates in mammals: Taxonomic
differences in the allometry of BMR and body mass. Comp. Biochem. Physiol. 81A,
741-754.
Hinds, D. S. and Rice-Warner CN (1992) Maximum metabolism and aerobic capacity in
Heteromyid and other rodents. Physiol. Zool. 65,188-214
Husak, J. F. (2006). Does survival depend on how fast you can run or how fast you do
run? Functional Ecology 20, 1080-1086.
Irschick, D. J. and Garland, T. Jr. (2001). Integrating function and ecology in studies of
adaptation: investigations of locomotor capacity as a model system. Ann. Rev. Ecol.
Syst. 32, 367-396.
Irschick, D. J., Herrel, A., Vanhooydonck, B., Huyghe, K. and Van Damme, R. (2005).
Locomotor compensation creates a mismatch between laboratory and field estimates

page 39
of escape speed in lizards: a cautionary tale for performance-to-fitness studies.
Evolution 59, 1579-1587.
John-Alder, H. B. (1983). Effects of thyroxin supplementation on metabolic rate and
aerobic capacity in a lizard. Am. J. Physiol. 244 (Regulatory Integrative Comp. Physiol.
13), R659-R666.
Kemi, O. J., Loennechen, J. P., Wisløff, U. and Ellingsen, Ø. (2002). Intensity-controlled
treadmill running in mice: cardiac and skeletal muscle hypertrophy. J. Appl.
Physiol. 93, 1301-1309.
Kemp, T. J., Bachus, K. N. , Nairn, J. A. and Carrier, D. R. (2005). Functional trade-offs in
the limb bones of dogs selected for running versus fighting. J. Exp. Biol. 208, 3475-
3482.
Kenagy G. J. and Hoyt, D.F. (1988). Energy cost of walking and running gaits and
their aerobic limits in golden-mantled ground squirrels. Physiol. Zool. 61, 34-40.
Kenagy G. J. and Hoyt D. F. (1989). Speed and time-energy budget for locomotion in
golden-mantled ground squirrels. Ecology 70, 1834-1839
Kohlsdorf, T., James, R. S., Carvalho, J. E., Wilson, R. S., Dal Pae-Silva, M. and Navas,
C. A. (2004). Locomotor performance of closely related Tropidurus species:
relationships with physiological parameters and ecological divergence. J. Exp. Biol.
207, 1183-1192.
Kolok, A. S. (1999). Interindividual variation in the prolonged locomotor performance
of ectothermic vertebrates: a comparison of fish and herpetofaunal methodologies
and a brief review of the recent fish literature. Can. J. Fisheries Aquatic Sci. 56, 700-
710.
Konarzewski, M. and Diamond, J. M. (1995). Evolution of basal metabolic rate and
organ masses in laboratory mice. Evolution 49, 1239-1248.
Koteja, P. (1987). On the relation between basal and maximal metabolic rate in
mammals. Comp. Biochem. Physiol. A. 87, 205-208.

page 40
Koteja, P. (1996). Limits to the energy budget in a rodent, Peromyscus maniculatus: does
gut capacity set the limit? Physiol. Zool. 69, 994-1020.
Koteja, P., Garland, T., Sax, J. K, Swallow, J. G. and Carter, P. A. (1999a) Behaviour of
house mice artificially selected for high levels of voluntary wheel running. Animal
Behaviour 58,1307-1318.
Koteja, P., Swallow, J. G., Carter, P. A. and Garland, T., Jr. (1999b) Energy cost of wheel-
running in house mice: implications for coadaptation of locomotion and energy
budgets. Physiol. Biochem. Zool. 72, 238-249.
Lambert, M. I., Van Zyl, C., Jaunky, R., Lambert, E. V. and Noakes, T. D. (1996). Tests
of running performance do not predict subsequent spontaneous running in rats.
Physiol. Behav. 60, 171-176.
Lande, R. (1976). Natural selection and random genetic drift in phenotypic evolution.
Evolution 30, 314-334.
Lerwill, C. J. (1974). Activity rhythms of golden hamsters (Mesocricetus auratus) and
Mongolian gerbils (Meriones unguiculatus) by direct observations. J. Zool., London
174, 520-523.
Liu, Q.-S. and Wang, D.-H. (2007). Effects of diet quality on phenotypic flexibility of
organ size and digestive function in Mongolian gerbils (Meriones unguiculatus). J.
Comp. Physiol. B 177, 509-518.
MacMillen, R. E. and Hinds, D. S. (1992). Standard, cold-induced, and exercise-induced
metabolism of rodents. In Mammalian energetics: interdisciplinary views of
metabolism and reproduction (ed. T. E. Tomasi and T. H. Horton), pp 16-33. Ithaca,
New York, USA: Comstock Publishing Associates.
Meerlo, P., Bolle, L., Visser, G. H., Masman, D. and Daan, S. (1997). Basal metabolic rate
in relation to body composition and daily energy expenditure in the field vole,
Microtus agrestis. Physiol. Zool. 70, 362-369.

page 41
Miles, D. B. (1994). Covariation between morphology and locomotory performance in
sceloporine lizards. In Lizard Ecology: Historical and Experimental Perspectives (ed.
L. J. Vitt and E. R. Pianka), pp. 207-259. Princeton: Princeton University Press.
Nakagawa, S. (2004). A farewell to Bonferroni: the problems of low statistical power
and publication bias. Behav. Ecol. 15,1044-1045.
Naumov, N. P. and Lobachev, V. S. (1975). Ecology of the desert rodents of the USSR
(jerboas and gerbils). In Rodents in Desert Environments (ed. I. Prakash and Ghosh,
C. K.), pp. 465-598. The Hague: Dr. W. Junk BV Publishers.
Nespolo, R. F. and Franco, M. (2007). Whole-animal metabolic rate is a repeatable trait: a
meta-analysis. Journal of Experimental Biology 210, 2000-2005.
Odell, J. P., Chappell, M. A. and Dickson, K. A. (2003). Morphological and enzymatic
correlates of aerobic and burst performance in different populations of Trinidadian
guppies Poecilia reticulata. J. Exp. Biol. 206, 3707-3718.
Oufiero, C. E. and Garland, T., Jr. (2007). Evaluating performance costs of sexually
selected traits. Functional Ecology. In press.
Pasi, B. M. and Carrier, D. R. (2003). Functional trade-offs in the limb muscles of dogs
selected for running vs. fighting. J. Evol. Biol. 16, 324-332.
Perry, G., LeVering, K., Girard, I. and Garland, T., Jr. (2004). Locomotor performance
and social dominance in male Anolis cristatellus. Anim. Behaviour 67, 37-47.
Piersma, T., Bruinzeel, L., Drent, R., Kersten, M., Van der Meer, J. and Wiersma, P.
(1996). Variability in basal metabolic rate of a long-distance migrant shorebird
(red knot Calidris canutus) reflects shifts in organ size. Physiol. Zool. 69, 191-217.
Rezende, E. L., Swanson, D. L., Novoa, F. F. and F. Bozinovic, F. (2002). Passerines
versus nonpasserines: so far, no statistical differences in avian energetics. J. Exp.
Biol. 205, 101–107.

page 42
Rezende, E. L., Bozinovic, F. and Garland, Jr., T. (2004a). Climatic adaptation and the
evolution of basal and maximum rate of metabolism in rodents. Evolution 58, 1361-
1374.
Rezende, E. L., Chappell, M. A. and Hammond, K. A. (2004b). Cold-acclimation in
Peromyscus: temporal effects and individual variation in maximum metabolism
and ventilatory rates. J. Exp. Biol. 207, 295-305.
Rezende, E. L., Chappell, M. A. Gomes F. R, Malish, J. L. and Garland, T., Jr. (2005).
Maximal metabolic rates during voluntary exercise, forced exercise, and cold
exposure in house mice selectively bred for high wheel-running. J. Exp. Biol. 208,
2447-2458.
Rezende, E. L., Kelly, S. A., Gomes F. R, Chappell, M. A. and Garland, T., Jr. (2006).
Effects of size, sex, and voluntary running speeds on costs of locomotion in lines of
laboratory mice selectivity bred for high well-running activity. Physiol. Biochem.
Zool. 79, 83-99.
Rice, W. (1989). Analyzing tables of statistical tests. Evolution 43, 223-225.
Russell, G. A., and Chappell, M. A. (2006). Is BMR repeatable in deer mice? Organ
mass correlates and the effects of cold acclimation and native altitude. J. Comp.
Physiol. B. 177, 75-87.
Saltzman , W., Ahmed, S., Fahimi, A., Wittwer, D.J. and Wegner, F.H. (2006). Social
suppression of female reproductive maturation and infanticidal behavior in
cooperatively breeding Mongolian gerbils. Horm. Behav. 49, 527-537.
Schmidt-Nielsen, K. (1972). Locomotion: energetic cost of swimming, flying and
running. Science 177, 222–228
Schmidt-Nielsen, K. (1997). Animal Physiology: adaptation and environment. 5 ed.
Cambridge: Cambridge University Press.
Schwenkter, V. (1963). The gerbil. A new laboratory animal. Ill. Vet. 6: 5-9.
page 43
Sinervo, B. and Losos, J. B. (1991). Walking the tight rope: a comparison of sprint
performance among populations of Sceloporus occidentalis. Ecology 72, 1225-1233.
Sinervo, B., Miles, D. B. , Frankino, W. A., Klukowski, M. and DeNardo, D. F. (2000).
Testosterone, endurance, and Darwinian fitness: Natural and sexual selection on
the physiological bases of alternative male behaviors in side-blotched lizards.
Hormones and Behavior 38, 222-233.
Sparti, A. (1992). Thermogenic capacity of shrews (Mammalia, Soricidae) and its
relationship with basal rate of metabolism. Physiol. Zool. 65, 77-96.
Speakman, J. R. and McQueenie, J. (1996). Limits to sustained metabolic rate: the link
between food intake, basal metabolic rate, and morphology in reproducing mice,
Mus musculus. Physiol. Zool. 69, 746-769.
Steyermark, A. C., Miamen, A. G., Feghahati, H. S. and Lewno, A. W. (2005).
Physiological and morphological correlates of among-individual variation in
standard metabolic rate in the leopard frog Rana pipiens. J. Exp. Biol. 208, 1201-1208.
Storey, J. D. and Tibshirani, R. (2003). Statistical significance for genome-wide
experiments. Proc. Nat. Acad. Sci. USA 100, 9940-9445.
Storey, J. D. (2003). The positive false discovery rate: A Bayesian interpretation and the
q-value. Annal. Stat. 31,2013-2035.
Sun, R. Y. and Jing, S. L. (1984). Relation between average daily metabolic rate and
resting metabolic rate of the Mongolian gerbil (Meriones unguiculatus). Oecologia 65,
122-124.
Swallow, J. G., Garland, T., Jr., Carter, P. A., Zhan, W. Z. and Sieck G. C. (1998). Effects
of voluntary activity and genetic selection on aerobic capacity in house mice (Mus
domesticus). J. Appl, Physiolo. 84, 69-76.
Syme, D. A., Evashuk, K., Grintuch, B., Rezende, E. L. and Garland, T., Jr. (2005).
Contractile abilities of normal and “mini” triceps surae muscles from mice (Mus

page 44
domesticus) selectively bred for high voluntary wheel running. J. Appl. Physiol. 99,
1308-1316.
Taylor, C. R., Schmidt-Nielsen , K. and Raab, J. L. (1970) . Scaling of the energetic cost
of running to body size in mammals. Am. J. Physiol. 219, 1104-1107.
Taylor C. R., Heglund, N. and Maloiy, G. M. O. (1982). Energetics and mechanics of
terrestrial locomotion. I. Metabolic energy consumption as a function of speed and
body size in birds and mammals. J. Exp. Biol. 97, 1-21.
Tucker, V. A. (1975). The energetic cost of moving about. Am. Scientist 63, 413-419.
Van Damme, R., Wilson, R. S. , Vanhooydonck, B. and Aerts, P. (2002). Performance
constraints in decathletes. Nature 415, 755-756.
Vanhooydonck, B. and Van Damme, R. (2001). Evolutionary trade-offs in locomotor
capacities in lacertid lizards: are splendid sprinters clumsy climbers? J. Evol. Biol.
14, 46-54.
Vanhooydonck, B., Van Damme, R. and Aerts, P. (2001). Speed and stamina trade-off in
lacertid lizards. Evolution 55, 1040-1048.
Vanhooydonck, B., Herrel, A. Y. , Van Damme, R. and Irschick, D. J. (2005). Does
dewlap size predict male bite performance in Jamaican Anolis lizards? Funct. Ecol.
19, 38-42.
Vézina, F., Jalvingh, K. M., Dekinga, A., & Piersma, T. (2006) Acclimation to different
thermal conditions in a northerly wintering shorebird is driven by body mass-
related changes in organ size. J. Exp. Biol. 209, 3141 - 3154.
Wainwright, P. C., Bellwood, D. R. and Westneat, M. W. (2002). Ecomorphology of
locomotion in labrid fishes. Environ. Biol. Fishes 65, 47-62.
Wang, D. H., Wang, Y. S. and Wang, Z. W. (2000). Metabolism and thermoregulation in
the Mongolian gerbil Meriones unguiculatus. Acta Their. 45, 183-192.
Weibel, E.R. (1984). The Pathway for Oxygen. Cambridge: Harvard University Press.

page 45
Weibel, E.R. and Taylor, C. R., eds. 1981. Design of the mammalian respiratory system.
Respiration Physiology 44, 1-164.
Weibel, E.R., Taylor, C. R. and Hoppeler, H. (1991). The concept of symmorphosis: a
testable hypothesis of structure-function relationship. Proc. Nat. Acad. Sci. USA
88,10357-10361.
Weibel, E.R., Bacigalupe, L. D., Schmitt, B. and Hoppeler, H. (2004). Allometric scaling
of maximal metabolic rate in mammals: muscle aerobic capacity as determinant
factor. Respir. Physiol. Neurobiol. 140, 115-132.

page 46
Table 1. Descriptive statistics of physiological, behavioral, and morphological variables in Mongolian gerbils. Abbreviations: BMR: basal metabolic rate; RMR: resting metabolic rate V
. O2max:
maximum oxygen consumption; RER: respiratory exchange ratio at V. O2max; V
. O2v1: maximum 1-
min average oxygen consumption during voluntary running; Vmax1: maximum 1-min average speed during voluntary running; ADMR: average daily metabolic rate; Drun: distance traveled in 24 h; Trun: time spent running in 24 h; SRL: snout-rump length; foot: mean hind foot length; headW: head width; headL: head length: SI: small intestine; LI: large intestine: repro: other reproductive tissues (spermatic cord, prostate, etc.); GN: gastronemius muscle complex; motor: musculoskeletal system (less head, tail, and feet).
Variable Units Range Mean, SD N body mass g (live mass) 52.3 – 78.9 67.7 ± 6.0 40 BMR ml O2/min .75 –1.45 1.07 ± .21 27 RMR ml O2/min .70 – 1.22 .935 ± .116 40 V. O2max ml O2/min 9.14 – 15.3 11.3 ± 1.30 40
RER (ratio) .69 –1.31 .97 ± .12 38 sprint speed km/h 6.97 – 14.5 10.8 ± 1.98 34 V. O2v1 ml O2/min 3.9 – 7.10 5.11 ± .73 40
Vmax1 km/h 1.53 – 3.86 2.20 ± .47 40 ADMR ml O2/min 1.35 – 2.13 1.73 ± .16 40 distance km/day 285 – 4953 1237 ± 887 40 time min/day 21.7 – 206.9 88.3 ± 38.7 40 SRL mm 104 - 137 118 ± 8.0 40 foot mm 22.0 – 29.2 27.0 ± 1.3 40 headL mm 35.0 – 42.0 38.1 ± 1.4 40 headW mm 18.0 – 22.0 19.9 ± 0.8 40 heart g (wet mass) .180 - .313 .237 ± .037 40 lungs g (wet mass) .488 - .907 .674 ± .097 40 liver g (wet mass) 2.34 – 4.02 3.20 ± .42 40 kidney g (wet mass) .521 - .743 .625 ± .064 40 spleen g (wet mass) .0393 - .139 .0608 ± .0166 40 stomach g (wet mass) .327 - .571 .451 ± .057 40 SI g (wet mass) .362 - .760 .514 ± .087 40 caecum g (wet mass) .225 - .591 .328 ± .077 40 LI g (wet mass) .162 - .472 .331 ± .075 40 testes g (wet mass) .74 – 1.18 1.02 ± .10 40 repro g (wet mass) .50 – 1.75 1.26 ± .27 40 brain g (wet mass) .82 – 1.03 .943 ± .052 40 GN g (wet mass) .82 – 1.47 1.17 ± .16 37 motor g (wet mass) 24.4 – 38.3 31.6 ± 3.20 40

page 47
Table 2. Allometry of measured traits with body mass and age, from regressions of log10-transformed variables. Values for CV are the SD of residuals in regressions of loge-transformed data, which approximates CV (see text). Abbreviations: vCOTint and vCOTslp = intercept and slope of voluntary cost of transport; tCOTint and tCOTslp = intercept and slope of treadmill COT; other abbreviations, units, and sample sizes as in Table 1. P values < .05 are boldfaced.
Variable Constant ± SE
Mass coefficient ± SE
Mass P Age coefficient ± SE
Age P R2 F, P CV, %
BMR -4.98 ± 1.50 1.22 ± .36 .0027 -.00069 ± .00153 .65 .319 5.63, .010 16.2
RMR -.770 ± .386 .458 ± .217 .042 -.000815 ± .00038 .037 .158 3.47, .042 11.2
V. O2max .107 ± .697 .631 ± .171 .00071 -.00279 ± .00068 .00021 .386 11.6, .00012 8.8
sprint 3.08 ± 1.63 -.164 ± .394 .68 -.00026 ± .00159 .87 .008 .12, .89 18.7
V. O2v1 -.147 ± 1.05 .398 ± .258 .13 .00076 ± .00103 .47 .099 2.03, .15 13.2
RER .707 ± .843 .064 ± .47 .89 .0014 ± .0007 .068 .100 1.94, .16 8.2
Vmax1 -.65 ± 1.37 .982 ± .336 .0059 .00083 ± .0013 .54 .232 5.57, .00765 17.3
vCOTint 1.66 ± .31 -.118 ± .171 .49 .072 ± .083 .39 .03 .48, .62 3.8
vCOTslp 1.50 ± .70 -.278 ± .389 .48 .146 ± .188 .44 .02 .43, .66 8.5
tCOTint 3.50 ± .98 -.624 ± .521 .24 -.238 ± .272 .39 .08 1.46, .25 11.6
tCOTslp -2.93 ± 1.39 1.63 ± .74 .034 .541 ± .385 .17 .21 4.49, .019 16.6
ADMR -2.19 ± .56 .679 ± .138 <.0001 -.00104 ± .00055 .065 .399 12.3, <.0001 7.1
Drun -.45 ± 4.37 1.93 ± 1.07 .079 -.00032 ± .0043 .94 .09 1.77, .19 54.9
Trun -.75 ± 3.88 1.42 ± .95 .14 -.00179 ± .0038 .64 .06 1.11, .34 48.8
SRL 1.18 ± .17 .131 ± .042 .00363 .00713 ± .0216 .0022 .456 15.1, <.0001 4.9
foot 2.02 ± .33 .307 ± .080 .00515 -.00016 ± .00032 .61 .30 7.57, .0018 4.1
headL 2.80 ± .27 .145 ± .064 .030 .0479 ± .033 .16 .217 5.13; .011 3.3
headW 2.39 ± .30 .223 ± .070 .00297 -.0700 ± .037 .065 .237 5.58; .0077 3.6
heart -2.76 ± .39 1.142 ± .217 < .0001 .0185 ± .112 .17 .457 15.6; <.0001 11.5
lungs -2.20 ± .38 1.099 ± .208 <.0001 .00445 ± .107 .97 .456 15.5; < .0001 4.6
liver -1.12 ± .37 .818 ± .205 .00030 .061 ± .105 .56 .347 9.8; .00038 4.6
kidney -1.55 ± .29 .575 ± .159 .00089 .140 ± .082 .094 .374 11.0; .0002 3.54
spleen -2.04 ± .77 .204 ± .426 .64 .209 ± .219 .35 .041 .79; .46 9.5
stomach -1.50 ± .39 .293 ± .216 .18 .295 ± .111 .011 .251 6.20; .0047 4.8
SI -1.61 ± .52 .315 ± .289 .28 .352 ± .149 .023 .202 4.7; .016 6.5
caecum -2.62 ± .67 1.36 ± .37 .00074 -.177 ± .19 .36 .269 6.8; .0031 8.3
LI -1.70 ± .76 .009 ± .422 .98 .571 ± .217 .012 .172 3.86; .030 9.4
testes -1.30± .27 .670 ± .151 <.0001 .0405 ± .078 .61 .391 11.9, <.0001 3.4
repro -2.75 ± .73 1.207 ± .403 .0048 .302 ± .207 .153 .293 7.68; .0016 9.0
brain -.568 ± .166 .348 ± .092 .00054 -.0452 ± .047 .344 .280 7.20; .0023 2.1
GN -1.46 ± 49 .910 ± .266 .00166 -.0672 ± .125 .595 .257 5.89; .0063 5.3
motor -.119 ± .218 .909 ± .121 <.0001 -.0217 ± .062 .728 .690 30.6; <.0001 2.8

page 48
Table 3. Pairwise Pearson correlations (see Table 1 for sample sizes) among performance variables (based on residuals from regressions on body mass and age). Abbreviations: vCOT int and vCOT slope: intercept and slope, respectively, for costs of transport in voluntary running; tCOT int and tCOT slope: same but for forced treadmill running; vMAS: estimated maximum aerobic speed in voluntary locomotion; tMAS: same but for forced treadmill running; other abbreviations as in Table 1. In each cell, the top value is r and the bottom value is P; correlations with nominal P <.05 are boldfaced. After Bonferroni adjustment, P values < .0005 remain significant. The positive FDR statistic π0 = .726 indicates that P values <= .0062 remain significant (indicated by asterisks*).
RMR V. O2max scope V
. O2v1 ADMR sprint vCOT
int vCOT
slp tCOT
int tCOT
slp vMAS tMAS Vmax1 Drun Trun
BMR .047 -.101 -.762 .023 -.099 -.128 .223 -.299 .083 .042 .177 -.128 -.026 .086 .052 .817 .615 <.0001* .908 .623 .533 .263 .130 .699 .845 .377 .552 .899 .671 .796
RMR -.170 -.143 -.312 .565 .216 .196 -.042 -.246 .027 -.128 -.167 -.29 -.09 -.094 .293 .478 .0498 .00015* .219 .238 .804 .148 .874 .451 .361 .069 .58 .562
V. O2max .496 -.109 .136 -.002 .058 -.021 .014 -.066 .501 .501 .119 .180 .182
.0086 .502 .403 .991 .728 .901 .935 .709 .0013* .0025* .465 .265 .260
scope -.217 .056 .138 .005 .163 -.001 -.279 .109 .503 .004 -.050 .033 .276 .781 .503 .980 .417 .997 .187 .587 .012 .984 .806 .872
V. O2v1 -.101 -.094 -.125 .160 -.304 .173 -.236 -.202 .307 .004 -.039
.534 .599 .453 .339 .080 .327 .154 .251 .054 .980 .811
ADMR .146 .436 -.170 -.376 .146 .172 .069 .074 .383 .361 .412 .0062* .309 .028 .411 .301 .698 .650 .015 .022
sprint .381 -.100 .300 .092 .095 -.179 -.353 -.183 -.214 .031 .587 .101 .624 .606 .334 .041 .300 .224
vCOT -.543 -.064 -.070 .444 .136 -.041 .269 .045 int .00043* .727 .704 .0052* .457 .805 .102 .789
vCOT -.096 .107 -.864 -.084 -.131 -.320 -.041 slope .603 .558 <.0001* .649 .431 .050 .805
tCOT -.643 .129 .346 -.418 -.208 -.166 int <.0001* .481 .045 .014 .237 .348
tCOT -.135 -.851 .144 .106 -.012 slope .462 <.0001* .418 .552 .948
vMAS .289 .088 .259 .038 .109 .601 .117 .819
tMAS .042 .084 .180 .813 .639 .307
Vmax1 .628 .403 <.0001* .0098
Drun .798 <.0001*
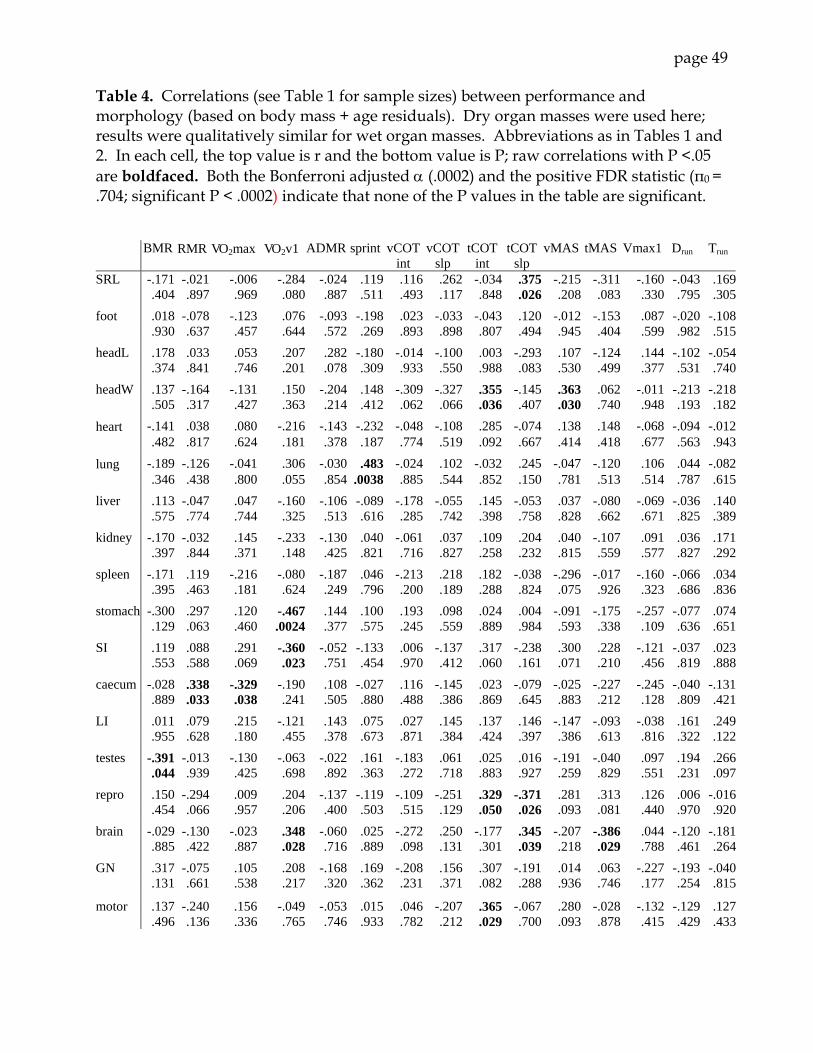
page 49
Table 4. Correlations (see Table 1 for sample sizes) between performance and morphology (based on body mass + age residuals). Dry organ masses were used here; results were qualitatively similar for wet organ masses. Abbreviations as in Tables 1 and 2. In each cell, the top value is r and the bottom value is P; raw correlations with P <.05 are boldfaced. Both the Bonferroni adjusted α (.0002) and the positive FDR statistic (π0 =
.704; significant P < .0002) indicate that none of the P values in the table are significant.
BMR RMR V O2max V O2v1 ADMR sprint vCOT int
vCOT slp
tCOT int
tCOT slp
vMAS tMAS Vmax1 Drun Trun
SRL -.171 -.021 -.006 -.284 -.024 .119 .116 .262 -.034 .375 -.215 -.311 -.160 -.043 .169 .404 .897 .969 .080 .887 .511 .493 .117 .848 .026 .208 .083 .330 .795 .305
foot .018 -.078 -.123 .076 -.093 -.198 .023 -.033 -.043 .120 -.012 -.153 .087 -.020 -.108 .930 .637 .457 .644 .572 .269 .893 .898 .807 .494 .945 .404 .599 .982 .515
headL .178 .033 .053 .207 .282 -.180 -.014 -.100 .003 -.293 .107 -.124 .144 -.102 -.054 .374 .841 .746 .201 .078 .309 .933 .550 .988 .083 .530 .499 .377 .531 .740
headW .137 -.164 -.131 .150 -.204 .148 -.309 -.327 .355 -.145 .363 .062 -.011 -.213 -.218 .505 .317 .427 .363 .214 .412 .062 .066 .036 .407 .030 .740 .948 .193 .182
heart -.141 .038 .080 -.216 -.143 -.232 -.048 -.108 .285 -.074 .138 .148 -.068 -.094 -.012 .482 .817 .624 .181 .378 .187 .774 .519 .092 .667 .414 .418 .677 .563 .943
lung -.189 -.126 -.041 .306 -.030 .483 -.024 .102 -.032 .245 -.047 -.120 .106 .044 -.082 .346 .438 .800 .055 .854 .0038 .885 .544 .852 .150 .781 .513 .514 .787 .615
liver .113 -.047 .047 -.160 -.106 -.089 -.178 -.055 .145 -.053 .037 -.080 -.069 -.036 .140 .575 .774 .744 .325 .513 .616 .285 .742 .398 .758 .828 .662 .671 .825 .389
kidney -.170 -.032 .145 -.233 -.130 .040 -.061 .037 .109 .204 .040 -.107 .091 .036 .171 .397 .844 .371 .148 .425 .821 .716 .827 .258 .232 .815 .559 .577 .827 .292
spleen -.171 .119 -.216 -.080 -.187 .046 -.213 .218 .182 -.038 -.296 -.017 -.160 -.066 .034 .395 .463 .181 .624 .249 .796 .200 .189 .288 .824 .075 .926 .323 .686 .836
stomach -.300 .297 .120 -.467 .144 .100 .193 .098 .024 .004 -.091 -.175 -.257 -.077 .074 .129 .063 .460 .0024 .377 .575 .245 .559 .889 .984 .593 .338 .109 .636 .651
SI .119 .088 .291 -.360 -.052 -.133 .006 -.137 .317 -.238 .300 .228 -.121 -.037 .023 .553 .588 .069 .023 .751 .454 .970 .412 .060 .161 .071 .210 .456 .819 .888
caecum -.028 .338 -.329 -.190 .108 -.027 .116 -.145 .023 -.079 -.025 -.227 -.245 -.040 -.131 .889 .033 .038 .241 .505 .880 .488 .386 .869 .645 .883 .212 .128 .809 .421
LI .011 .079 .215 -.121 .143 .075 .027 .145 .137 .146 -.147 -.093 -.038 .161 .249 .955 .628 .180 .455 .378 .673 .871 .384 .424 .397 .386 .613 .816 .322 .122
testes -.391 -.013 -.130 -.063 -.022 .161 -.183 .061 .025 .016 -.191 -.040 .097 .194 .266 .044 .939 .425 .698 .892 .363 .272 .718 .883 .927 .259 .829 .551 .231 .097
repro .150 -.294 .009 .204 -.137 -.119 -.109 -.251 .329 -.371 .281 .313 .126 .006 -.016 .454 .066 .957 .206 .400 .503 .515 .129 .050 .026 .093 .081 .440 .970 .920
brain -.029 -.130 -.023 .348 -.060 .025 -.272 .250 -.177 .345 -.207 -.386 .044 -.120 -.181 .885 .422 .887 .028 .716 .889 .098 .131 .301 .039 .218 .029 .788 .461 .264
GN .317 -.075 .105 .208 -.168 .169 -.208 .156 .307 -.191 .014 .063 -.227 -.193 -.040 .131 .661 .538 .217 .320 .362 .231 .371 .082 .288 .936 .746 .177 .254 .815
motor .137 -.240 .156 -.049 -.053 .015 .046 -.207 .365 -.067 .280 -.028 -.132 -.129 .127 .496 .136 .336 .765 .746 .933 .782 .212 .029 .700 .093 .878 .415 .429 .433
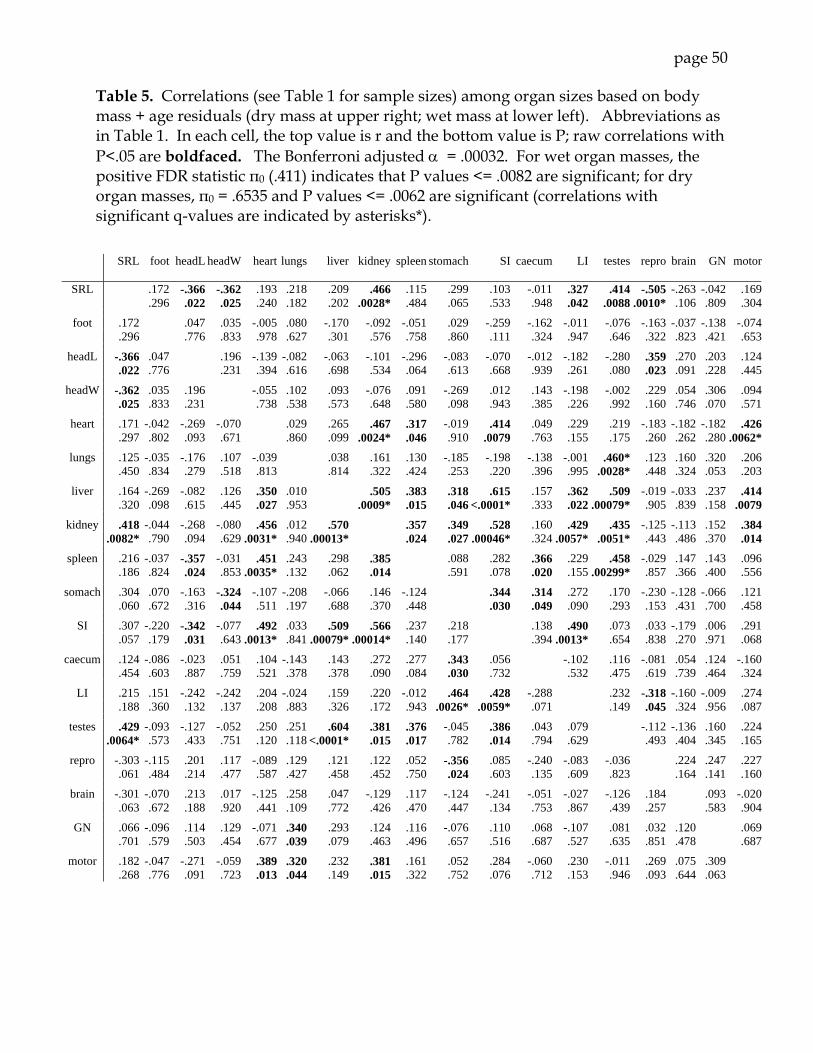
page 50
Table 5. Correlations (see Table 1 for sample sizes) among organ sizes based on body mass + age residuals (dry mass at upper right; wet mass at lower left). Abbreviations as in Table 1. In each cell, the top value is r and the bottom value is P; raw correlations with P<.05 are boldfaced. The Bonferroni adjusted α = .00032. For wet organ masses, the positive FDR statistic π0 (.411) indicates that P values <= .0082 are significant; for dry organ masses, π0 = .6535 and P values <= .0062 are significant (correlations with significant q-values are indicated by asterisks*).
SRL foot headL headW heart lungs liver kidney spleen stomach SI caecum LI testes repro brain GN motor
SRL .172 -.366 -.362 .193 .218 .209 .466 .115 .299 .103 -.011 .327 .414 -.505 -.263 -.042 .169 .296 .022 .025 .240 .182 .202 .0028* .484 .065 .533 .948 .042 .0088 .0010* .106 .809 .304
foot .172 .047 .035 -.005 .080 -.170 -.092 -.051 .029 -.259 -.162 -.011 -.076 -.163 -.037 -.138 -.074 .296 .776 .833 .978 .627 .301 .576 .758 .860 .111 .324 .947 .646 .322 .823 .421 .653
headL -.366 .047 .196 -.139 -.082 -.063 -.101 -.296 -.083 -.070 -.012 -.182 -.280 .359 .270 .203 .124 .022 .776 .231 .394 .616 .698 .534 .064 .613 .668 .939 .261 .080 .023 .091 .228 .445
headW -.362 .035 .196 -.055 .102 .093 -.076 .091 -.269 .012 .143 -.198 -.002 .229 .054 .306 .094 .025 .833 .231 .738 .538 .573 .648 .580 .098 .943 .385 .226 .992 .160 .746 .070 .571
heart .171 -.042 -.269 -.070 .029 .265 .467 .317 -.019 .414 .049 .229 .219 -.183 -.182 -.182 .426 .297 .802 .093 .671 .860 .099 .0024* .046 .910 .0079 .763 .155 .175 .260 .262 .280 .0062*
lungs .125 -.035 -.176 .107 -.039 .038 .161 .130 -.185 -.198 -.138 -.001 .460* .123 .160 .320 .206 .450 .834 .279 .518 .813 .814 .322 .424 .253 .220 .396 .995 .0028* .448 .324 .053 .203
liver .164 -.269 -.082 .126 .350 .010 .505 .383 .318 .615 .157 .362 .509 -.019 -.033 .237 .414 .320 .098 .615 .445 .027 .953 .0009* .015 .046 <.0001* .333 .022 .00079* .905 .839 .158 .0079
kidney .418 -.044 -.268 -.080 .456 .012 .570 .357 .349 .528 .160 .429 .435 -.125 -.113 .152 .384 .0082* .790 .094 .629 .0031* .940 .00013* .024 .027 .00046* .324 .0057* .0051* .443 .486 .370 .014
spleen .216 -.037 -.357 -.031 .451 .243 .298 .385 .088 .282 .366 .229 .458 -.029 .147 .143 .096 .186 .824 .024 .853 .0035* .132 .062 .014 .591 .078 .020 .155 .00299* .857 .366 .400 .556
somach .304 .070 -.163 -.324 -.107 -.208 -.066 .146 -.124 .344 .314 .272 .170 -.230 -.128 -.066 .121 .060 .672 .316 .044 .511 .197 .688 .370 .448 .030 .049 .090 .293 .153 .431 .700 .458
SI .307 -.220 -.342 -.077 .492 .033 .509 .566 .237 .218 .138 .490 .073 .033 -.179 .006 .291 .057 .179 .031 .643 .0013* .841 .00079* .00014* .140 .177 .394 .0013* .654 .838 .270 .971 .068
caecum .124 -.086 -.023 .051 .104 -.143 .143 .272 .277 .343 .056 -.102 .116 -.081 .054 .124 -.160 .454 .603 .887 .759 .521 .378 .378 .090 .084 .030 .732 .532 .475 .619 .739 .464 .324
LI .215 .151 -.242 -.242 .204 -.024 .159 .220 -.012 .464 .428 -.288 .232 -.318 -.160 -.009 .274 .188 .360 .132 .137 .208 .883 .326 .172 .943 .0026* .0059* .071 .149 .045 .324 .956 .087
testes .429 -.093 -.127 -.052 .250 .251 .604 .381 .376 -.045 .386 .043 .079 -.112 -.136 .160 .224 .0064* .573 .433 .751 .120 .118 <.0001* .015 .017 .782 .014 .794 .629 .493 .404 .345 .165
repro -.303 -.115 .201 .117 -.089 .129 .121 .122 .052 -.356 .085 -.240 -.083 -.036 .224 .247 .227 .061 .484 .214 .477 .587 .427 .458 .452 .750 .024 .603 .135 .609 .823 .164 .141 .160
brain -.301 -.070 .213 .017 -.125 .258 .047 -.129 .117 -.124 -.241 -.051 -.027 -.126 .184 .093 -.020 .063 .672 .188 .920 .441 .109 .772 .426 .470 .447 .134 .753 .867 .439 .257 .583 .904
GN .066 -.096 .114 .129 -.071 .340 .293 .124 .116 -.076 .110 .068 -.107 .081 .032 .120 .069 .701 .579 .503 .454 .677 .039 .079 .463 .496 .657 .516 .687 .527 .635 .851 .478 .687
motor .182 -.047 -.271 -.059 .389 .320 .232 .381 .161 .052 .284 -.060 .230 -.011 .269 .075 .309 .268 .776 .091 .723 .013 .044 .149 .015 .322 .752 .076 .712 .153 .946 .093 .644 .063
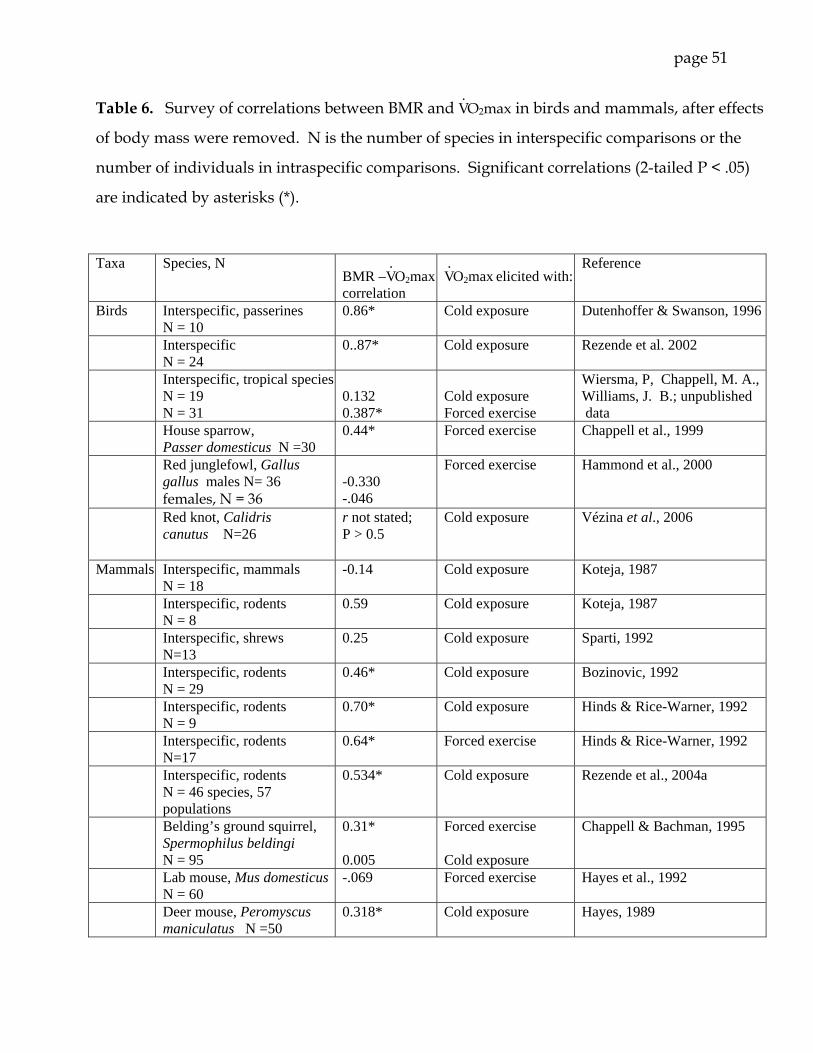
page 51
Table 6. Survey of correlations between BMR and V. O2max in birds and mammals, after effects
of body mass were removed. N is the number of species in interspecific comparisons or the
number of individuals in intraspecific comparisons. Significant correlations (2-tailed P < .05)
are indicated by asterisks (*).
Taxa Species, N BMR –V
. O2max
correlation V. O2max elicited with:
Reference
Birds Interspecific, passerines N = 10
0.86* Cold exposure Dutenhoffer & Swanson, 1996
Interspecific N = 24
0..87* Cold exposure Rezende et al. 2002
Interspecific, tropical speciesN = 19 N = 31
0.132 0.387*
Cold exposure Forced exercise
Wiersma, P, Chappell, M. A., Williams, J. B.; unpublished data
House sparrow, Passer domesticus N =30
0.44* Forced exercise Chappell et al., 1999
Red junglefowl, Gallus gallus males N= 36 females, N = 36
-0.330 -.046
Forced exercise Hammond et al., 2000
Red knot, Calidris canutus N=26
r not stated; P > 0.5
Cold exposure Vézina et al., 2006
Mammals Interspecific, mammals N = 18
-0.14 Cold exposure Koteja, 1987
Interspecific, rodents N = 8
0.59 Cold exposure Koteja, 1987
Interspecific, shrews N=13
0.25 Cold exposure Sparti, 1992
Interspecific, rodents N = 29
0.46* Cold exposure Bozinovic, 1992
Interspecific, rodents N = 9
0.70* Cold exposure Hinds & Rice-Warner, 1992
Interspecific, rodents N=17
0.64* Forced exercise Hinds & Rice-Warner, 1992
Interspecific, rodents N = 46 species, 57 populations
0.534* Cold exposure Rezende et al., 2004a
Belding’s ground squirrel, Spermophilus beldingi N = 95
0.31* 0.005
Forced exercise Cold exposure
Chappell & Bachman, 1995
Lab mouse, Mus domesticusN = 60
-.069 Forced exercise
Hayes et al., 1992
Deer mouse, Peromyscus maniculatus N =50
0.318* Cold exposure Hayes, 1989

page 52
Table 7. Survey of correlations between whole-animal aerobic and locomotor traits and
subordinate morphological traits in birds and mammals, after effects of body mass were
removed statistically. Plus-signs (+) indicate significant (P < 0.05) positive correlations;
minus-signs (-) indicate significant negative correlations, and 0 indicates no significant
correlation. Note that the various studies did not all measure the same organs.
Taxa Species Trait Suborganismal correlates Reference Birds Interspecific BMR Heart, kidney + Daan et al., 1990 Red knot, Calidris
canutus BMR Lean body mass + Piersma et al., 1996
great knot, Calidris tenuirostris
BMR Flight muscle, intestine + Battley et al., 2001
Tree swallow, Tachycineta bicolor
BMR Kidney + Intestine -
Burness et al., 1998
House sparrow, Passer domesticus
BMR Kidney, liver, gonad + leg and pectoralis muscle + Intestine, heart 0
Chappell et al., 1999
Red junglefowl, Gallus gallus
BMR Spleen + (females)
Lung, lung, stomach, caecum + (males )
Hammond et al., 2000
House sparrow V. O2max
leg and pectoralis muscle + (adults) heart + (juveniles) other visceral organs 0
Chappell et al., 1999
Red junglefowl V. O2max
Heart, leg and pectoralis muscle +; caecum - other visceral organs 0 (males)
large intestine, hematocrit + other visceral organs, muscle 0 (females)
Hammond et al., 2000
mammals Laboratory mouse, Mus domesticus
RMR Kidney, liver, heart, intestine + Konarzewsky & Diamond, 1995
Laboratory mouse RMR Digestive organs + Speakman & McQueenie, 1996
Field vole, Microtus agrestis
BMR Heart + Meerlo et al., 1997
Deer mouse, Peromyscus maniculatus
BMR No organ mass correlates Koteja, 1996
Deer mouse BMR Combined visceral organs + Musculoskeletal system -
Russell & Chappell, 2007
Wild mouse, Mus musculus, laboratory mouse, crosses
V. O2max
Heart + Liver, gastrocnemius, hematocrit 0
Dohm et al., 1994
Laboratory mouse X wild mouse
Sprint speed
Gastrocnemius mass 0 Muscle fiber type 0
Garland et al., 1995
Domestic cat, Felis domesticus
jumping Limb length + Muscle mass 0
Harris & Steudel, 2002

page 53
Figure legends:
Fig. 1. Aerobic performance in relation to body mass in Mongolian gerbils. The upper
and lower limits to oxygen consumption are shown (basal metabolic rate, BMR over 10
min, and maximal oxygen consumption during forced exercise, V. O2max over 1 min,
respectively), along with two measures of aerobic performance during voluntary activity:
average daily metabolic rate (ADMR, the 24-hour average of oxygen consumption) and
the highest 1-min average of voluntarily-attained V. O2 (V
. O2m1).
Fig. 2. Distributions of voluntary running behavior in 40 Mongolian gerbils, each
measured over ~23.5 h. Data are 1-minute averages separated by 3-minute gaps (to
avoid autocorrelation; see text). A: frequency distribution time spent running at various
speeds. B: distance traveled at various speeds. The bin size is 0.1 km/h for both.
Fig. 3. Effect of averaging interval on maximal values of running speed (A) and oxygen
consumption (B) in 40 Mongolian gerbils during voluntary wheel running. Dashed lines
indicate regressions of 2- and 5-minute averages (unfilled and filled circles, respectively)
against 1-minute averages (regressions were forced through the origin). Slopes are
fractions of 1-minute values; for example, a slope of .834 indicates 83.4% of the 1-minute
value. The solid line shows a slope of 1.0 (equivalent X and Y values).
Fig. 4. Forced and voluntary running energetics in Mongolian gerbils (pooled data from
40 individuals). The open circles and dashed regression line show values from forced
treadmill exercise, with each point representing one individual at one speed. The solid

page 54
circles and solid regression line show values from voluntary exercise. Regression
coefficients and r2 values are means from individuals (not from pooled data). Points
from voluntary exercise are 1-min averages separated by 3-min intervals to avoid
autocorrelation (see text). For comparison, the maximum power output in forced
exercise is about 196 kJ Kg-1 h-1.
Fig. 5. Distributions of P values in relation to the π0 statistic (the overall proportion of
true null hypotheses: Storey and Tibshirani 2003; Storey 2003) for the correlations in
Tables 3-5. The bin size is .05; π0 is shown as dashed lines. A random set of P-values
would produce a flat histogram with all bins showing a relative frequency close to 1.0;
the presence of non-null hypotheses (i.e., significant tests after accounting for Type 1
errors) is indicated by high relative frequencies in the left-most bin. Values of π0 were
computed with the R program ‘QVALUE’.

50 60 70 80
Body mass (g)
16
10
5
3
2
1
0.6
.
VO2max
VO2m1
ADMR
BMR
2.0 . mass.410
.736 . mass.458
.140 . mass.600
.0073 . mass1.18
Figure 1:

Time spent running4 0
3 0
2 0
1 0
0
A.
Distance travelledB.3
2
1
00 1 2 3
Runn ing speed , km / h
Figure 2:

4 5 6 7
7
6
5
4
3
.955; r2 = .999
.867; r2 = .994
B2 3 4
.834; r2 = .993
.674; r2 = .985
A
3
2
1
maximum 1-min speed (km/h) maximum 1-min VO2 (ml O2/ min)
Figure 3:
.
.
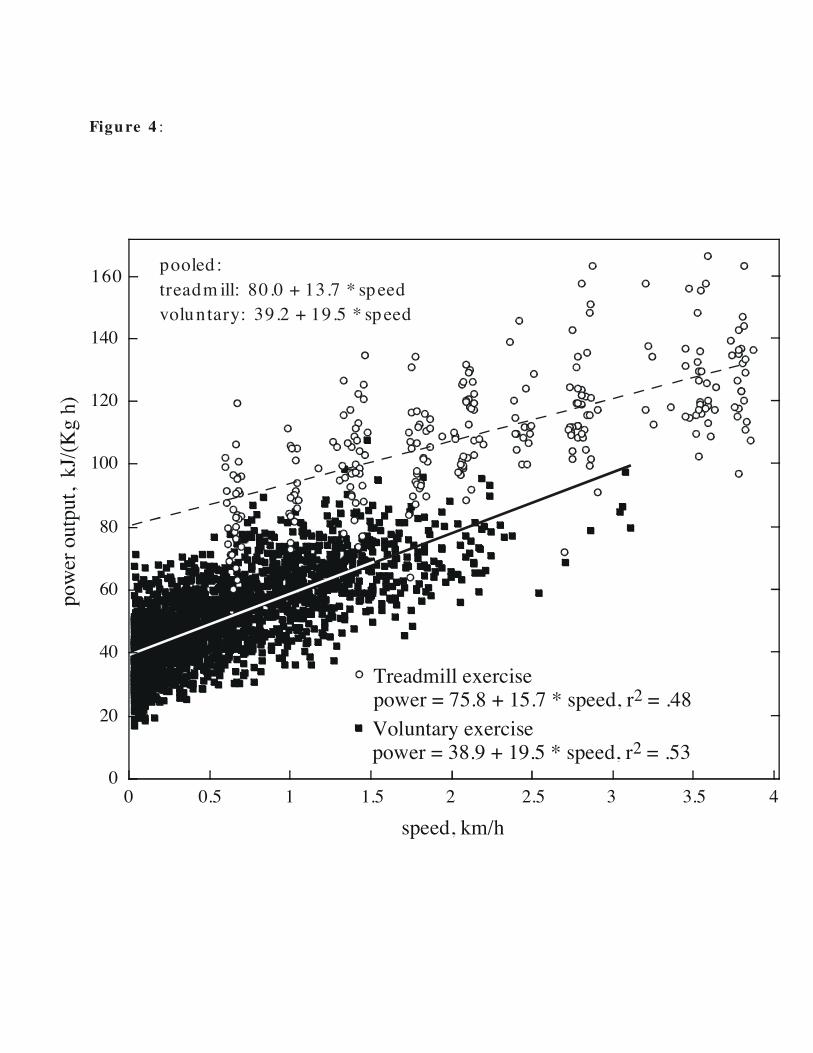
Voluntary exercisepower = 38.9 + 19.5 * speed, r2 = .53
Treadmill exercisepower = 75.8 + 15.7 * speed, r2 = .48
0
20
40
60
80
100
120
140
160
0 0.5 1 1.5 2 2.5 3 3.5 4
speed, km/h
pooled :treadm ill: 80.0 + 13.7 * speedvoluntary: 39.2 + 19.5 * speed
Figu re 4 :

4
3
2
1
0
Table 3N = 108, π0 = .726
Table 4N = 288, π0 = .704
4
3
2
1
0
Table 5 (wet mass)N = 153, π0 = .326
4
3
2
1
0
P-value0 0.1 0.2 0.3 0.4 0.5 0.6 0.7 0.8 0.9 1.0
Table 5 (dry mass)N = 153, π0 = .635
4
3
2
1
0
P-value0 0.1 0.2 0.3 0.4 0.5 0.6 0.7 0.8 0.9 1.0
Figure 5: