mark a. c managing automotive dealer performance … · managing automotive dealer ... and customer...
TRANSCRIPT
____________________________________________________________________________________________________________________
Mark Colosimo prepared this case under the supervision of Dr. Ratna Babu Chinnam and Dr. Kenneth Chelst for the Global Executive Track (GET) PhD in Industrial Engineering at
Wayne State University. Wayne State University GET cases are developed solely as the basis for class discussion. Cases are not intended to serve as endorsements, sources of primary
data, or illustrations of effective or ineffective engineering / management.
Copyright © 2013 Wayne State University. To order copies or request permission to reproduce materials, go to http://engineering.wayne.edu/ise/doctor/. No part of this publication
may be reproduced, stored in a retrieval system, or transmitted in any form or by any means—electronic, mechanical, photocopying, recording, or otherwise—without the permission
of Wayne State University.
GLOBAL EXECUTIVE PHD TRACK DEPARTMENT OF INDUSTRIAL & SYSTEMS ENGINEERING
COHORT 2010
REV: MAY 29, 2012
MARK A. COLOSIMO
Managing Automotive Dealer Performance through Scorecards
As the general manager at Universal Motors for dealership network development, executives
continually pressure Tobias on the need to compare dealers consistently. They desire to see a
single overall score that compares all of the dealership’s operations, performance, and viability
across the country. Currently, various people throughout the organization utilize different data
and different techniques in a desire to manage dealer performance. There are also many
experienced individuals that consider themselves experts about how dealerships should be
managed and run in his organization, at dealerships, and elsewhere outside his company.
Tobias knows a consistent methodology in assessing past data is vital in providing
recommendations to the dealer. Dealers are typically millionaires that have invested heavily in
the business and want to improve only if and when it makes sense, so Tobias knows that it
requires a persuasive process to impart proper knowledge to obtain change. In the simplest
terms, OEMs want to sell cars and dealers want to make more profit through their
product/service offerings.1 He has seen cases where sometimes these objectives are aligned and
sometimes they are not.
Having a well thought-through process that is data-driven is Tobias’ goal. He would also like
the ability to provide case studies, real-life results, and correlations with desired outcomes to add
credibility to his solution. Additionally, arming OEM field representatives2 with the right tools to
discuss dealers’ operations will be very helpful in making an impact on sales and profitability
performance. This would also help Tobias to estimate differences in geographical areas and to
identify required additional investments and actions from the manufacturer to improve brand
sales performance.
Tobias has thought that a “scorecard” would be appropriate to delineate the key elements that
relate to a single overall dealer performance score. In his mind, it provides a quick/simple
overview for OEM executives, it helps compare dealers on a relative basis in the field, and it
provides dealers with a high level score that can be “drilled down” to find areas where
opportunities may exist. His feeling is that a single overall metric could meet the desires of
executives and provide a hierarchy of elements that would “roll up” to this single score, allowing
further analysis into the details to be possible to determine the potential causes for good scores,
average scores, or bad scores. He could also rank, compare, and show changes in a single score
to explain how dealers relate overall. This would provide consistency and allow actions to be
1 Dealers can generate revenue and achieve greater profit margins on areas outside of new vehicle sales, such as pars
and service, and therefore may focus efforts and investment in these departments 2 The field force at the OEM is in place to be the touch point of the OEM with the dealer on a regular basis. They
meet regularly, reviewing operations, identifying improvements and programs, and discussing inventory purchases.
Managing Automotive Dealer Performance through Scorecards Colosimo, Mark A.
_____________________________________________________________________________________________________________________
2
taken to impact the score through a common knowledge amongst the field staff of the
manufacturer and the dealers.
The challenge for Tobias, however, is in creating such a scorecard. There are many data
elements that exist for each dealership department that are from a variety of business units
around the OEM organization.3 Dealer performance, financial, and customer satisfaction data all
come from different sources and would be a challenge to blend and communize, given that many
outside suppliers gather and store the information.4 He would the scorecard to be “balanced and
fair” and not seem to favor certain dealers (e.g., due to size or location of the dealership, metrics
can easily be skewed) or the manufacturer.5
Beyond accessing the data, the number of “elements” that could actually be utilized for the
analysis is overwhelming to Tobias. He is unsure where to even start in reviewing the data and
prioritizing the inputs into the scoring methodology as he does not know what really “matters” to
the business that can also be controlled by the dealers. He does believe that he will want some
sub-scores to demonstrate the performance of individual dealer departments (e.g. new vehicle or
service) and/or different OEM departments (e.g. customer loyalty, financial viability), but is
unsure how to create this. Having this score will allow him to provide more specific analysis on
where a dealer may be lacking or succeeding.
If he could put this scorecard together in a logical format, have OEM management agree, and
have dealers accept the results, Tobias would be seen as a hero in the organization. He has been
having trouble in the past in communicating key outcomes with management and this would
provide an opportunity to show that he can do the job. He must, however, provide this within a
month and cannot wait for a long, drawn out analysis to be conducted before presenting his
recommendation to his superiors.
Background on Dealer Performance Measurement
How to manage dealer performance in a summary fashion has been desired and researched but
not consistently or definitively applied. Universal Motors directors consistently want to create
reports with many data elements to be as comprehensive as possible with all of the data available
(see Exhibit A). The issues arise however on what the important factors to consider are and what
will actually impact the performance of dealers to derive better sales performance and dealer
3 Dealership departments include new vehicle, used vehicle, service, body shop, parts, finance and insurance, and
accessories. Dealerships may or may not have all of these, but most have only some. Data is accumulated by the
manufacturer for the dealerships of their brand but can be compiled and managed in various places throughout the
organization. 4 There are many companies that interact with dealer data through an in-house system at the dealership, a service to
pull data from these systems, or a warehouse of data provided by yet another supplier or the OEM. 5 Larger throughput (sales) dealers will typically have an advantage of being able to create enough profit to cover all
of the fixed costs in the dealership (rent, building, infrastructure, etc.). Also, depending on the market, many of
these fixed cost factors can play a role in what customers can pay. Some dealers are considered “low overhead” and
suggest that they pass their lower costs on to the customer, whereas a dealer with higher overhead may have higher
fixed costs that they may attempt to cover with higher prices. Lower cost dealers can then generate higher volumes
or sell at a higher price to generate greater profits, whereas high overhead dealers must sell at a higher price to cover
their expenses.
Managing Automotive Dealer Performance through Scorecards Colosimo, Mark A.
_____________________________________________________________________________________________________________________
3
health.6 On the OEM side, various personnel have different opinions on what is important.
Some OEM personnel may suggest that they know what is important and refuse to consider any
more than a certain number of pre-identified items or KPIs (Key Performance Indicators). It is
then challenging for someone like Tobias to gain consensus on what the items are that are most
relevant to dealers when querying other stakeholders.
Beyond the creation of a comprehensive scorecard, other metrics have also been employed
historically at a summary level to identify the performance of dealerships. To look at the
performance of the sales department of dealerships, most manufacturers utilize “sales
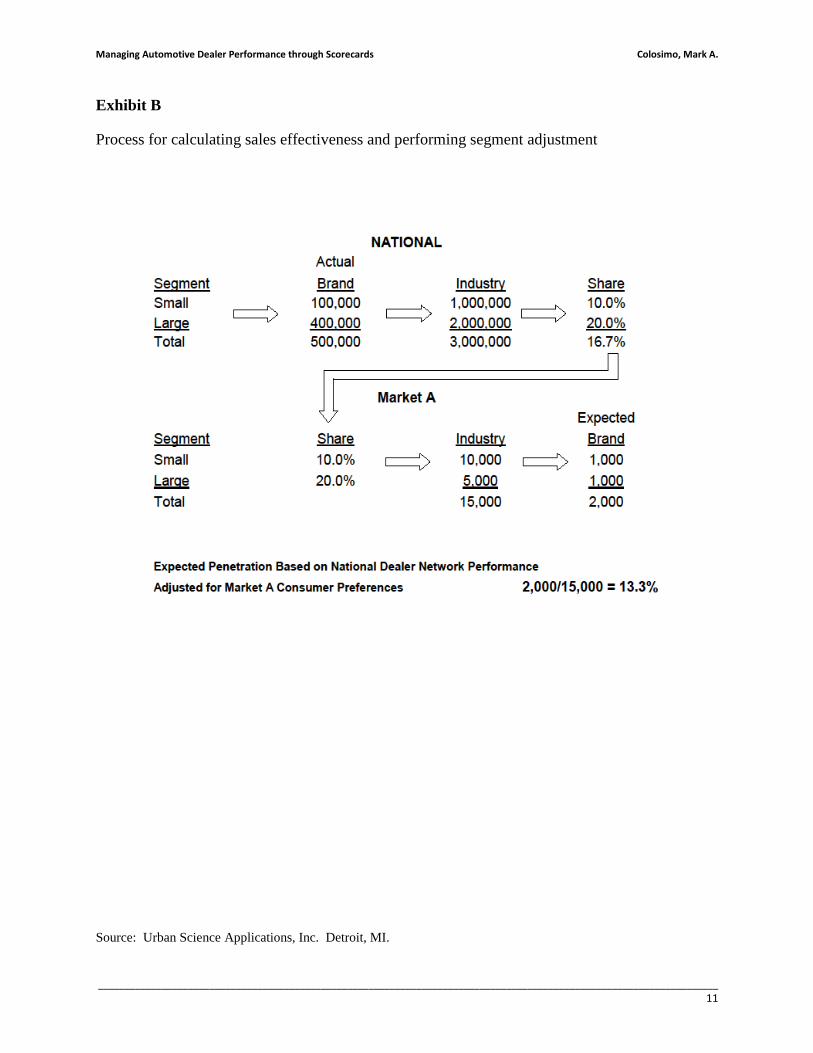
effectiveness” to identify the penetration or obtaining of an expected amount of sales. This
expected amount of sales is based upon a process called segment adjustment (see Exhibit B),
which is intended to take a step beyond market share only to identify the amount of expected
sales based upon a comparison average while considering the preferences for vehicles of people
in the area local to the dealership. Consider, for example, the differences in demand for pickup
trucks in Texas versus New York City or the desire for a convertible in Arizona versus Alaska.
Although there will be someone that will purchase each in these very differing areas, the
demands are likely to be different overall. Due to this, someone like Tobias must estimate the
amount of each vehicle a dealer would “expect” to sell based upon local demands rather than
simply applying a broader average.
This sales effectiveness metric is just one of many measurements of performance that are
utilized. Service penetration7 for the service department is another example or parts inventory
turn rate for the parts department are all summary statistics that are commonly utilized to
determine the overall performance of that department. Individually, these may or may not
appropriately represent success or failures of individual departments. One criticism has been that
the metrics only focus on the goals of the manufacturer and do not support the dealer’s
objectives. Yes, both the manufacturers and the dealers want to make money (in the form of
profit) but the same actions may not correspond to that result for both parties.
It may be counterintuitive at first, but selling more vehicles, despite increasing total revenues,
may not always increase profits. The effort required to be placed on an additional sale, beyond a
certain level, may actually reduce profit margins and even actual profit dollars (law of
diminishing returns). Since it is more difficult and requires more additional investment through
advertising, sales staff, inventory, etc., overall profit margins for the dealership would actually
decrease with each additional sale (beyond a certain level). Potentially even worse, increases in
investment necessary to achieve these additional sales may be greater than the resulting
sales/profits obtained through the effort (see Exhibit C). Due to this misalignment of objectives,
dealers and manufacturers are often trying to achieve slightly different goals, which have
different drivers to be managed. This is a key challenge for Tobias.
In designing the components of the scorecard, Tobias has a desire to interact with dealers to
obtain input in what should be included. He does realize that he cannot rely on them totally, as
that will result in a scorecard that will be applicable to the business of making money in a
dealership and not necessarily for selling more vehicles. He also knows that the KPIs included
6 Dealer health is usually characterized by the profitability and liquidity (cash availability) of the operation.
7 The number of unique service customers that visit a dealership for service relative to the opportunity, typically
measured by the vehicles in operation in that dealer’s local area
Managing Automotive Dealer Performance through Scorecards Colosimo, Mark A.
_____________________________________________________________________________________________________________________
4
in the scorecard may differ by region or type of area and would like to complete his assessment
to align with these considerations. This scorecard will not be the single access point to solve all
of the dealer or OEM problems, but it should provide some comparative guidance on where
dealers stand relative to desired outcomes.
Despite the method utilized to provide recommendable actions, Tobias feels that dealers will
want something that is simple and useful. If the information can be quickly accessed and easily
applied to their operation to see quantifiable results, the likelihood that it will be successful is
much greater. If it is too complicated to understand or does not relate to their objectives, dealers
will never use the information. The manufacturer will then have a metric to utilize internally for
comparison, but it will not assist in driving change.
When the final result is obtained, despite the usefulness of the data to the business, Tobias knows
that dealers will question all metrics. Scorecards and other summary numbers or information can
cause concern as it is can errantly be used for more significant purposes, since they are
considered simple and in comprehensive. Many such scores have been applied in legal situations
such as in the determination of which dealers to terminate or which to select for a new dealership
(see Exhibit D). Therefore, each score must be fully supported by rationale that is explainable
and justified. This justification process, however, is typically bypassed or poorly completed, as
the initiative to have a scoring device is typically and suddenly urgent and the time to validate
procedures is lacking.
Typical Ways to Manage Dealers
In order to manage the dealer network, manufacturers have a hierarchy of personnel that contact,
interact with, and oversee the operations of dealers in a particular area. Since dealerships are
established and contracted to run the business independently, effectively buying the product,
vehicles, from the manufacturer, there are certain criteria that must be followed to maintain the
franchise.8 The manufacturer must be certain that these agreements are followed and that the
practices at these customer facing brick-and-mortar locations are properly representing the brand.
The people in the manufacturer’s organization that consistently meet with dealers to review any
issues are typically called area managers or field representatives. They will review performance,
product ordering, any manufacturer initiatives, incentives, and other day-to-day topics. They are
critical to being able to have consistent manufacturer-dealer communication and to assist in
obtaining the objectives of the manufacturer through their stores. These people are the target
users of the scorecard in being able to translate numbers into action. Tobias understands the
importance of providing this “tool” to field personnel and dealers to directly assist in these
discussions.
Beyond the metrics that a field representative can provide, one activity that can provide
assistance on the performance of the operation is the employment of dealer consultants. Dealer
8 This includes the Dealer Sales and Service agreement which outlines that a minimum level of performance must be
maintained, as determined by the manufacturer. Of course, if dealers disagree, they can challenge the calculation in
court or choose not to take the franchise. There are also other facility requirements concerning signage, size,
capacity, and other program-based initiatives that the dealer must follow to maintain the franchise, depending on the
individual brand’s agreement.
Managing Automotive Dealer Performance through Scorecards Colosimo, Mark A.
_____________________________________________________________________________________________________________________
5
consultants can visit dealerships and thoroughly assess their individual actions, beyond just what
the data shows. They are typically people that have worked with or at dealerships for many
years and can provide steps to repair issues found in the dealer’s performance data. Tobias
knows that scorecards and metrics can only do so much to provide places to focus attention or to
drive improvement. To actually make change, some interaction with the dealer through
consultants, OEM field representatives, or others is required.
Many documents and systems have been created in an attempt to resemble a comprehensive
overview of the performance of dealerships. These reports are usually very busy and are based
upon the input of many, hence its data-intensive qualities. Ford, for example, had created a
“1984” report (see Exhibit A) by which field people were to assist dealers in managing their
operations through having all key elements on one document. Field representatives may be able
to decipher some of the information and are trained to know as much as possible; however,
dealers can easily be overwhelmed with too much data. Therefore, Tobias desires a medium to
assist in the translation and transfer of information that both parties can understand, utilize, and
respect.
Changes in the Marketplace
As the information age has expanded and grown, more data has been available and accessible by
dealers and OEMs. This provides an opportunity to Tobias in obtaining his objective. Dealers
have had systems to capture data and run the business for years and many still use older UNIX-
based machines. However, with new metrics, more access to data, and cheaper storage and
transfer capabilities, the time has come where data across the entire dealership operation is
available and useful for analysis. Additionally, there is a desire to combine departments on the
OEM side to mirror a dealer’s operation to assist in the management of dealership operations
more directly. This again allows for the sharing and transfer of data to create a dealer data
warehouse or repository to assist in having a holistic view, rather than an attempt parsed by
department. Tobias may have the opportunity to discuss his scorecard with many departments in
bringing together a comprehensive piece that has not been created previously.
By having the data in a combined, accessible location, more knowledge can be obtained through
the complete “360 degree view” of the dealership. Previously, each department could be
assessed by data type, such as new vehicle data for satisfaction, or service performance. Now,
dealers can see financial, performance, and opportunity data with actionable recommendations to
make improvements in areas that they are lacking. Additionally, new metrics and forms of data
mining can be applied to assist in determining what the best ways to run the business are in order
to obtain the greatest change of success, all of which provides an avenue to avoid the large
generic summary reports from years past.
It is just as vital to the manufacturer to have successful dealers as it is for the dealer to succeed.
Dealer viability was a key issue in the recent economic downturn in the United States that
resulted in many, even successful, dealerships closing their doors. Tobias knows that profitable
dealerships provide the manufacturer good local representation, an opportunity for their dealers
to invest further, and an attractive option for new owners to their brand for the return on
investment that can be achieved. Also, once a dealership closes, downtime for sales, breaking of
Managing Automotive Dealer Performance through Scorecards Colosimo, Mark A.
_____________________________________________________________________________________________________________________
6
relationships with customers, or a search for a new owner has to take place, all of which costs the
time or ability of being able to sell from that location.
Given that these potential changes can substantially impact a location or market, adjustments to
any scorecard that is created is required. Tobias requires a consistent process by which the
proper goals can still be achieved, while making adjustments that make sense for the current
time, and are simple enough to explain to a dealer and how it would impact them. Therefore, the
process may require not just an initial creation methodology but also a maintenance or repair
schedule to ensure continued applicability of the results.
The Real Manufacturer Goal versus Individual Actions
Despite the many actions, programs, and investments manufactures make in an attempt to sell
more vehicles, the underlying initiatives and their procedures for implementation lack
collaborative direction. Making investors happy through greater profits, driven by vehicle and
parts sales, are the true objectives of automotive manufacturers, as well as many other public
companies. In each case, Tobias knows there must be a link between goal achievement and the
investments made in these areas, if improvements are to be achieved.
His challenge is that manufactures do not align individual actions in an attempt to obtain certain
outcomes. There is no cause and effect relationship, since most decisions are experience-based
rather than data-based. Even when data-involved processes, such as scorecards, are involved,
experience still trumps the usage and application of metrics, again causing a lack of association
between inputs and outputs.
Based upon his research, Tobias has found that most scorecards that are in place are typically
created from the minds of company experts, executives, or others with experience in working
with dealership operations. Typically, dealers are not involved in this process and are given the
result rather than providing input into the outcome. There is typically a desire to limit the
number of factors or this analysis to many within the manufacturer’s organization and outside
would understand. Some manufacturers he interviewed followed a process by which each level
of the company from top executives to field representatives have provided input on the metrics
used and have stated what they feel is good, average, or poor (typically seen through a green,
yellow, and red color-coding approach) numerically for different KPI values. These values,
however, were not necessarily linked to any potential outcome, other than a specific initiative
with which one metric may be associated. Still, no one was certain if achieving a “good” result
on the scorecard or even within individual metrics or dealership departments would provide a
desirable result of higher sales or higher dealership profitability.
On the other hand, Tobias knows that the process to define a score must be easily understood.
Using too much “black box” analysis or statistics can cause those that provide or receive the
assessment to not believe in the results. There must either be substantial case study support that
Tobias can find within his organization or at least reasonable process that can be described to
outline how the numbers are generated. Even simple measures, such as those involved in
calculating dealer performance (“sales effectiveness”) can seem difficult to some dealers. They
obviously come from a variety of backgrounds and experience; therefore, attention must be given
Managing Automotive Dealer Performance through Scorecards Colosimo, Mark A.
_____________________________________________________________________________________________________________________
7
to ensure that most people whether business or metric savvy or not, can understand the process
and the resulting scores.
Tobias is very sensitive to the fact that a lack of real-life examples to support scoring
methodology will cause any process to falter. Until it can be shown that increasing one metric
can have some tangible impact or outcome, dealer and field representatives will be tentative
about using it. If they do not use it, the manufacturer can track scores as much as they prefer, but
having an impact to achieve positive results will not be possible.
Summary
Tobias needs to create the best possible scorecard in a very short period of time. He knows of
many KPIs that are typically used in the industry and, given his short time frame, has decided to
focus on those to drive his development (see Exhibit E). Tobias must be careful to meet the
objectives of all teams including legal, upper management, and tactical management, to ensure
that this is valuable to as many people as possible. He does not have a great deal of data at this
time and would like to focus more on the process of determining how to create the scorecard
rather than the actual numbers. How can he incorporate which KPIs to use in a consistent
process or methodology that covers all dealerships? Each dealer functions differently due to
location, competition, owner, etc. and these factors must be balanced and handled properly.
Also, dealers will have their own deficiencies that must be taken into account once the scorecard
is created. How can the variance in outcomes be monitored and managed to improve
performance and/or assist in adjusting the scorecard in the future?
Tobias must do the best he can to create the best scorecard he can in the time allotted. For now,
he must find ways to point to areas of concern and potential improvement while maintaining the
integrity of a scoring system to use comparatively across the dealer network. Often, these types
of projects are expected by OEM personnel without fully understanding the scope of “doing it
right.” In this case, time is limited and a different result or recommendation may be provided if
additional time or funding would be possible. Still, assumptions can be stated and further
improvements can be recommended based upon future results of this project and changing
economic or company situation.
Managing Automotive Dealer Performance through Scorecards Colosimo, Mark A.
_____________________________________________________________________________________________________________________
8
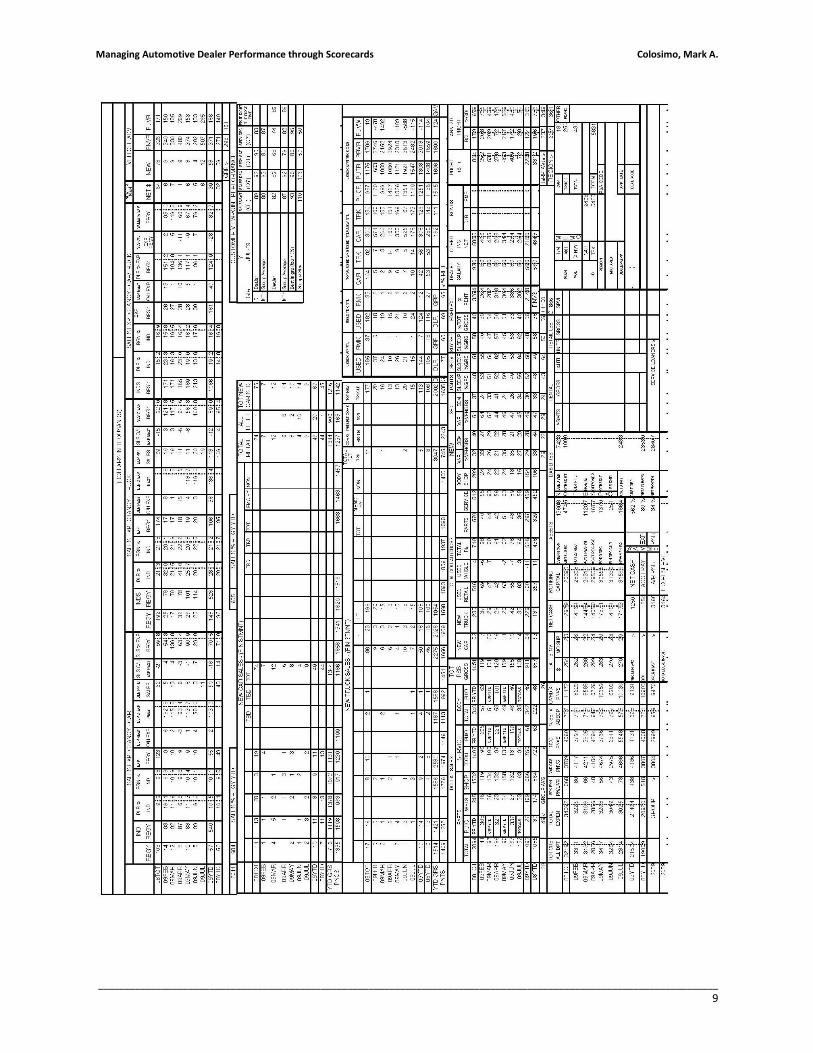
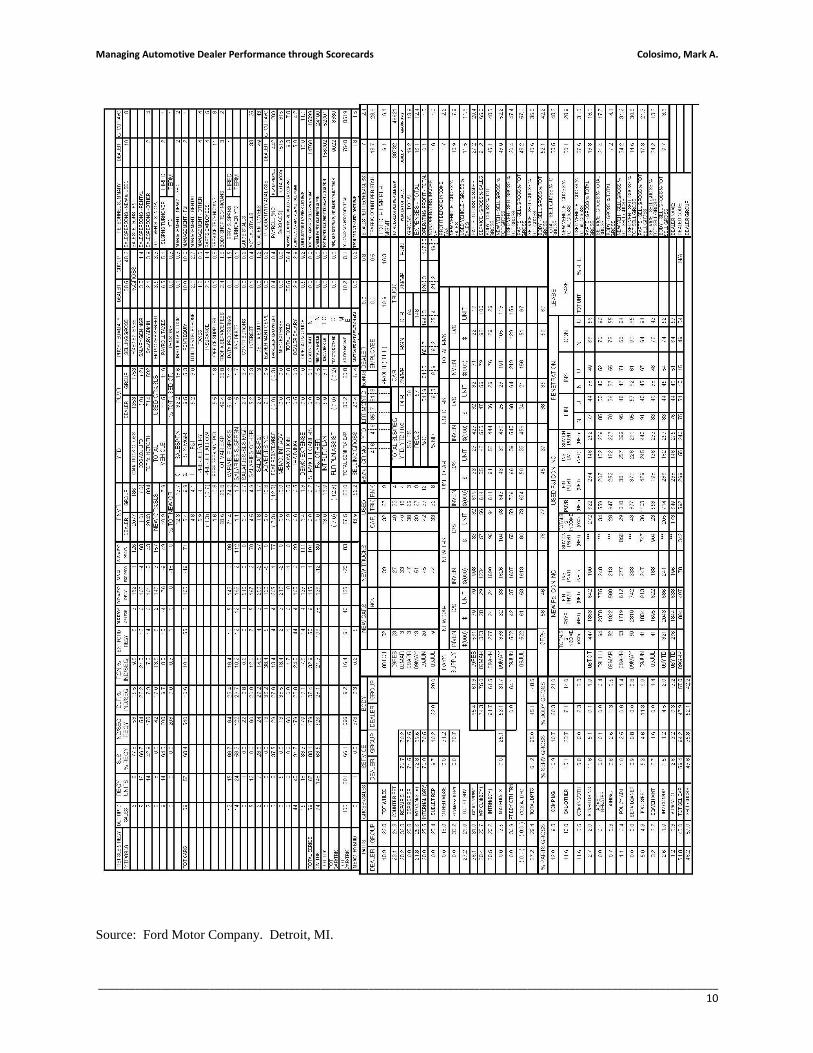
Exhibit A
Typical Dealer Management Documents
These documents are created by a vehicle manufacturer as a summary of the operations of an
individual dealership. Field personnel would use these to review any and all data relative to the
dealer’s sales performance and profitability. There is a great deal of information here, but what
is actually important? Where would assessments of this document begin? Obviously, much
training and experience is necessary to provide an acceptable evaluation, much of which is now
absent due to the elimination of automotive positions with expensive but skilled people.
Managing Automotive Dealer Performance through Scorecards Colosimo, Mark A.
_____________________________________________________________________________________________________________________
9
Managing Automotive Dealer Performance through Scorecards Colosimo, Mark A.
_____________________________________________________________________________________________________________________
10
Source: Ford Motor Company. Detroit, MI.
Managing Automotive Dealer Performance through Scorecards Colosimo, Mark A.
_____________________________________________________________________________________________________________________
11
Exhibit B
Process for calculating sales effectiveness and performing segment adjustment
Source: Urban Science Applications, Inc. Detroit, MI.
Managing Automotive Dealer Performance through Scorecards Colosimo, Mark A.
_____________________________________________________________________________________________________________________
12
Exhibit C
Law of Diminishing Marginal Returns
Sometimes also referred to as the law of variable proportions, this "law" is really a
generalization economists make about the nature of technology when it is possible to combine
the same factors of production in a number of different proportions to make the same product.
The law states:
When increasing amounts of one factor of production are employed in production along with a
fixed amount of some other production factor, after some point, the resulting increases in output
of product become smaller and smaller.
(That is, first the marginal returns to successive small increases in the variable factor of
production turn down, and then eventually the overall average returns per unit of the variable
input start decreasing.) Since the law assumes that the available quantity of at least one factor of
production is fixed at a given level and that technological knowledge does not change during the
relevant period, the law of diminishing returns normally translates into a statement about the
short-run choice of production possibilities facing a firm (since in the longer run it is virtually
always possible for the firm to acquire more of the temporarily "fixed" factor -- building an
additional factory building, buying additional land, installing additional machines of the same
kind, installing newer and more advanced machinery, and so on.)
A simple example of the workings of the law of diminishing returns comes from gardening. A
particular twenty by twenty garden plot will produce a certain number of pounds of tomatoes if
the gardener just puts in the recommended number of rows and plants per row, waters them
appropriately and keeps the weeds pulled. If the gardener varies this approach by adding a pound
of fertilizer to the topsoil, but otherwise does everything the same, he can increase the number of
pounds of tomatoes the garden plot yields by quite a bit (notice the amount of land is being held
fixed or constant). If he adds two pounds of fertilizer (rather than just one), probably he can get
still more tomatoes per season, but the increase in tomatoes harvested by going from one pound
to two pounds of fertilizer is probably smaller than the increase he gets by going from zero
pounds to one (diminishing marginal returns). Applying three pounds of fertilizer may still
increase the harvest, but perhaps by only a very little bit over the yields available using just two
pounds. Applying four pounds of fertilizer turns out to be overdoing it -- the garden yields fewer
tomatoes than applying only three pounds because the plants begin to suffer damage from root-
burn. And five pounds of fertilizer turns out to kill nearly all the plants before they even flower.
Another similar example of diminishing returns in an industrial setting might be a widget factory
that features a certain number of square feet of work space and a certain number of machines
inside it. Neither the space available nor the number of machines can be added to without a long
delay for construction or installation, but it is possible to adjust the amount of labor on short
notice by working more shifts and/or taking on some extra workers per shift. Adding extra man-
hours of labor will increase the number of widgets produced, but only within limits. After a
certain point, such things as worker fatigue, increasing difficulties in supervising the large work
force, more frequent breakdowns by over-utilized machinery, or just plain inefficiency due to
Managing Automotive Dealer Performance through Scorecards Colosimo, Mark A.
_____________________________________________________________________________________________________________________
13
overcrowding of the work space begin to take their toll. The marginal returns to each successive
increment of labor input get smaller and smaller and ultimately turn negative.
The law of diminishing returns is significant because it is part of the basis for economists'
expectations that a firm's short-run marginal cost curves will slope upward as the number of units
of output increases. And this in turn is an important part of the basis for the law of supply's
prediction that the number of units of product that a profit-maximizing firm will wish to sell
increases as the price obtainable for that product increases.
Source: Dr. Paul Johnson, the University of Auburn
http://www.auburn.edu/~johnspm/gloss/diminishing_returns_law_of
Managing Automotive Dealer Performance through Scorecards Colosimo, Mark A.
_____________________________________________________________________________________________________________________
14
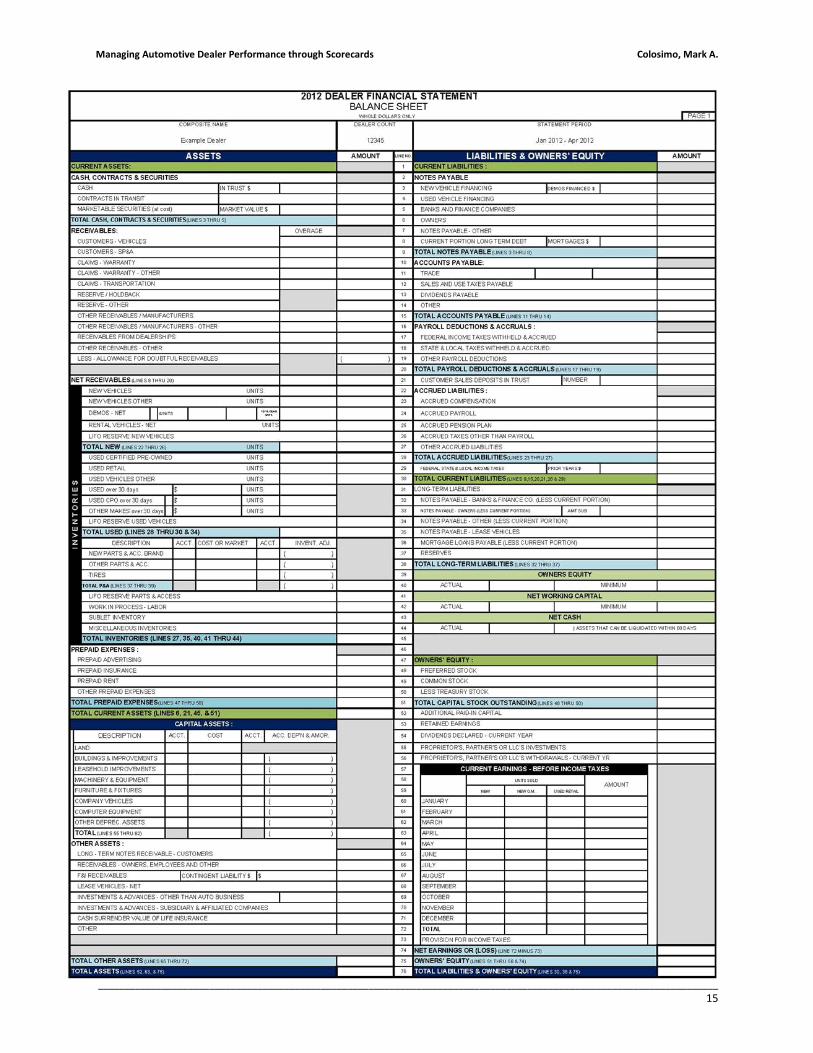
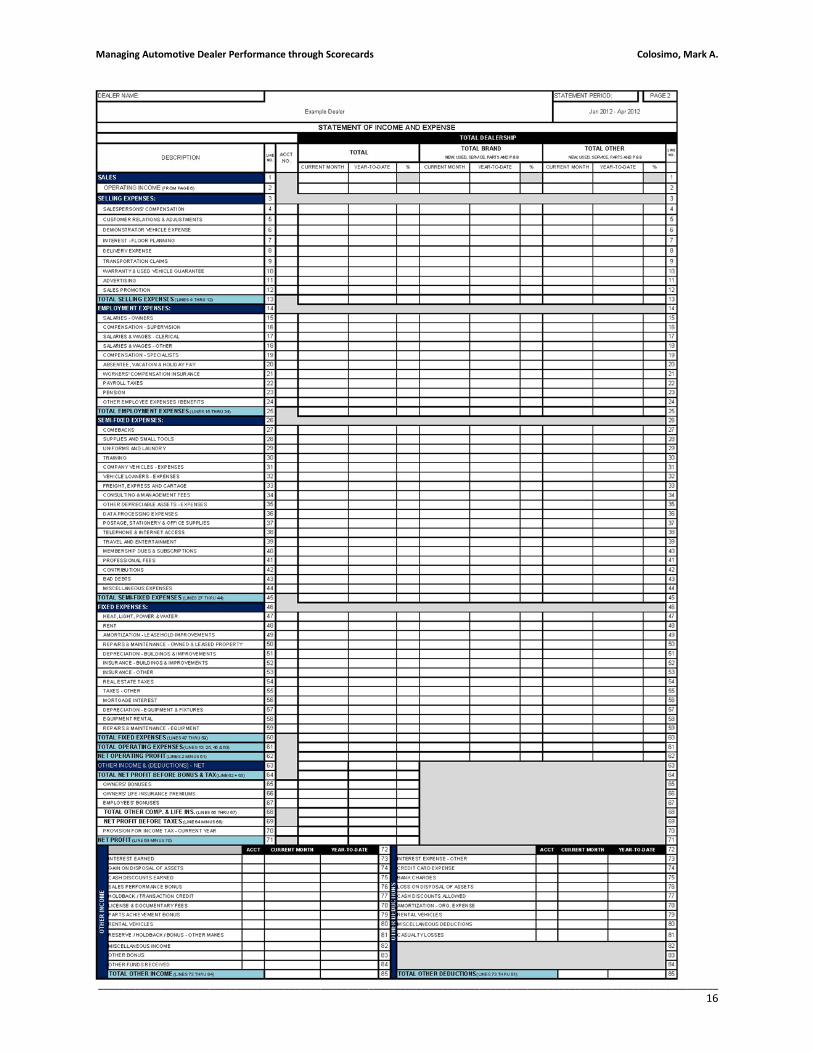
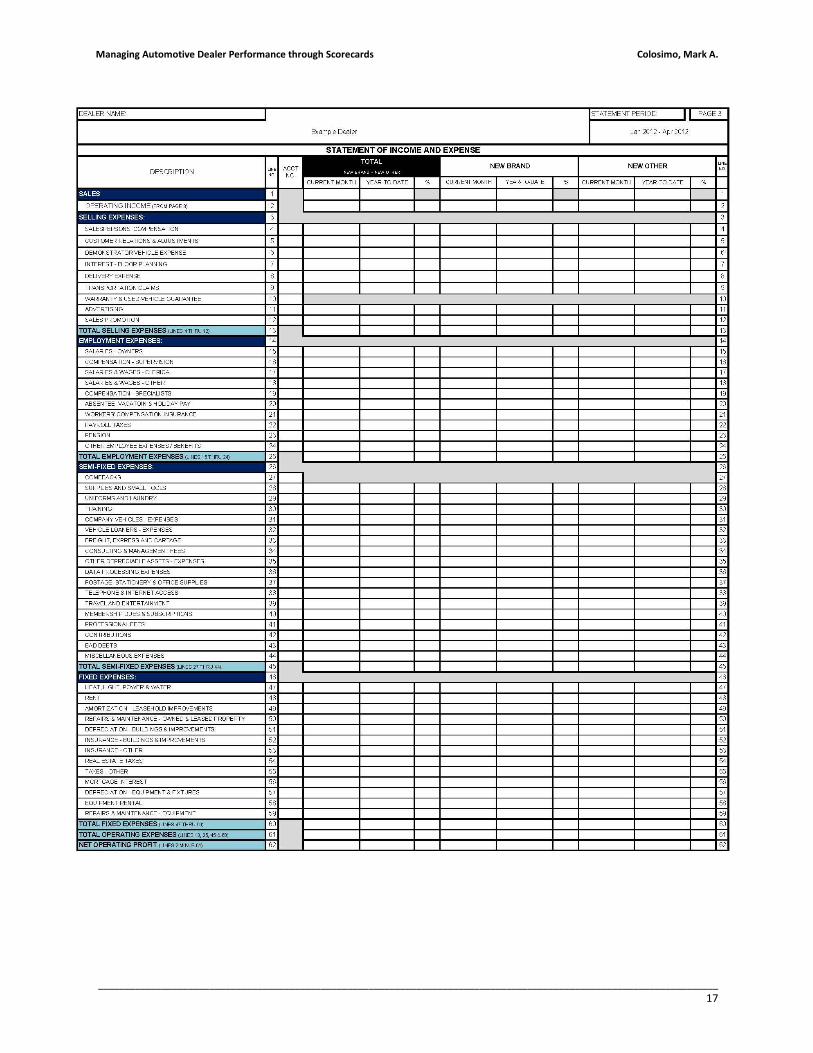
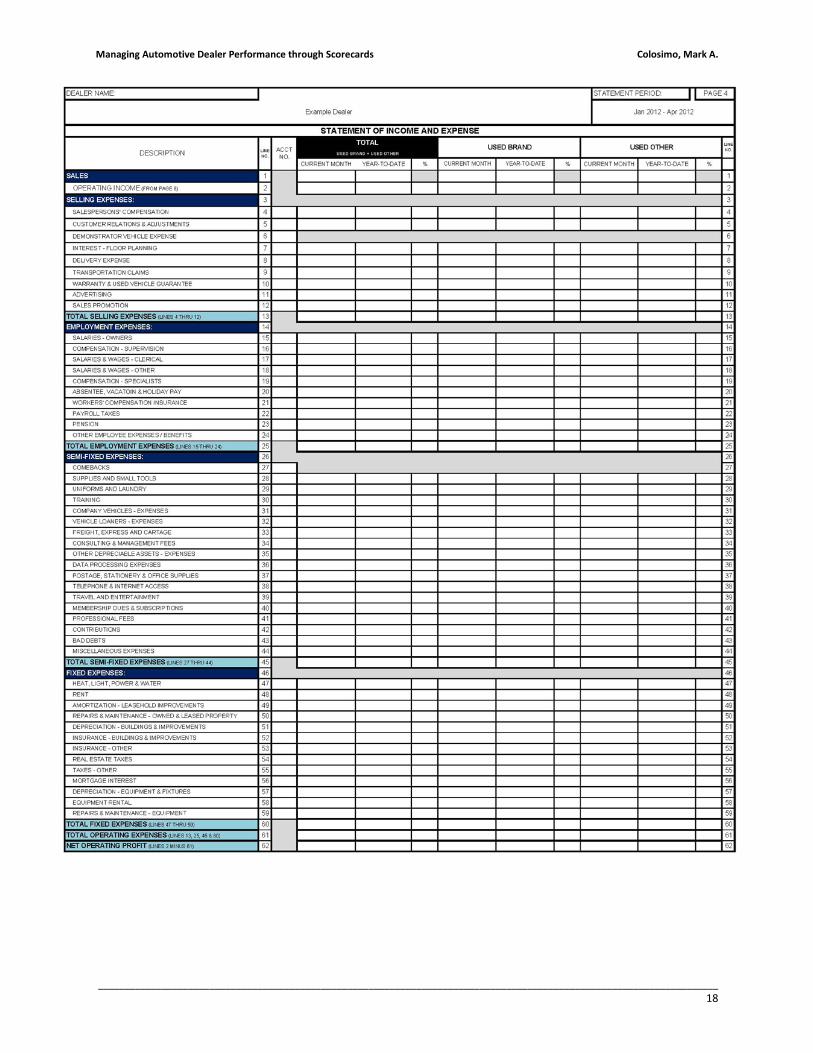
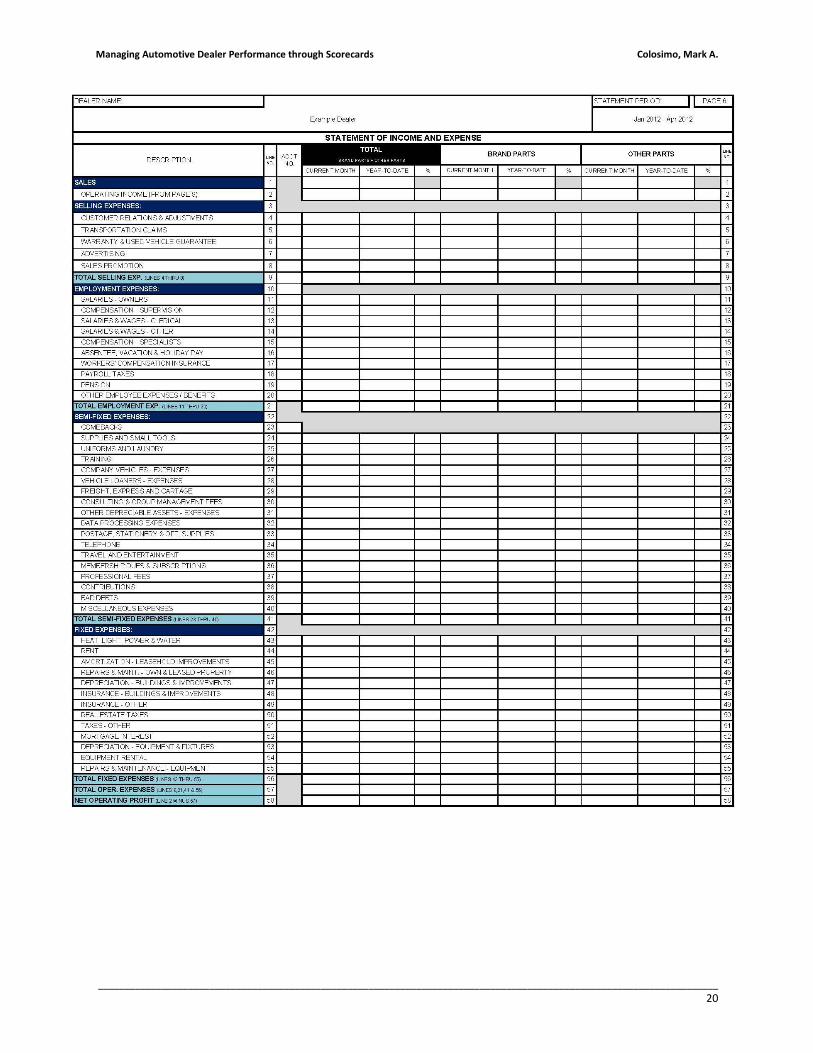
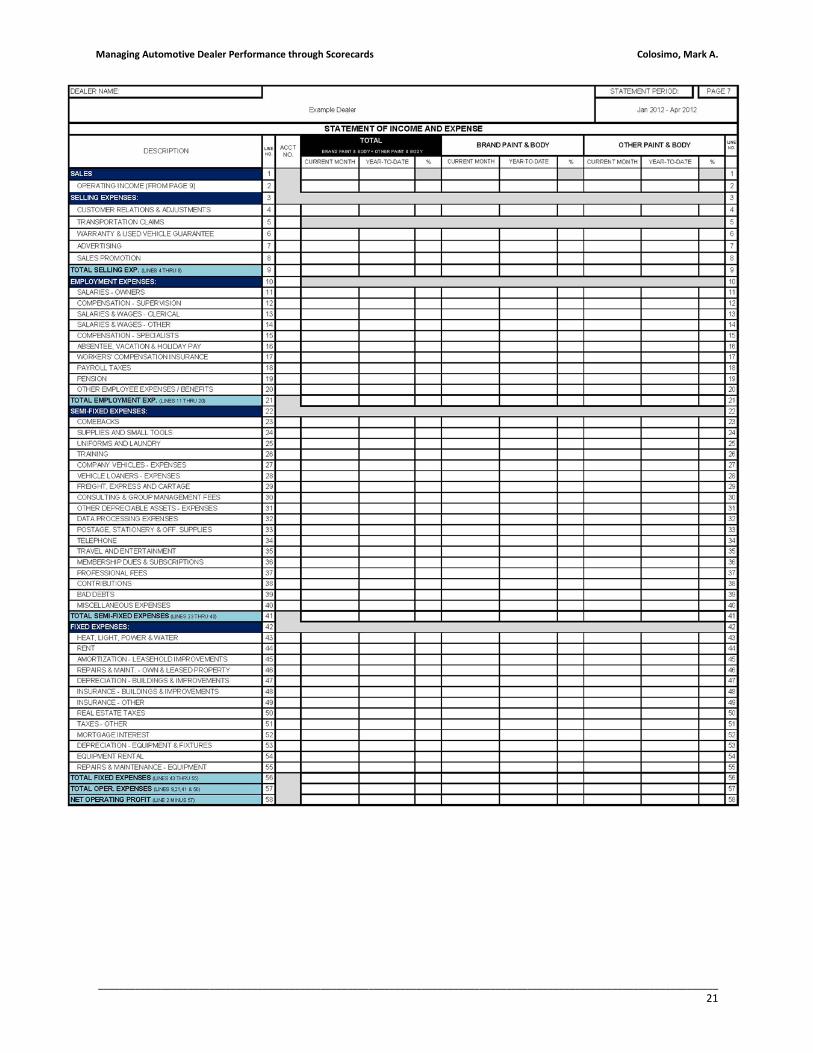
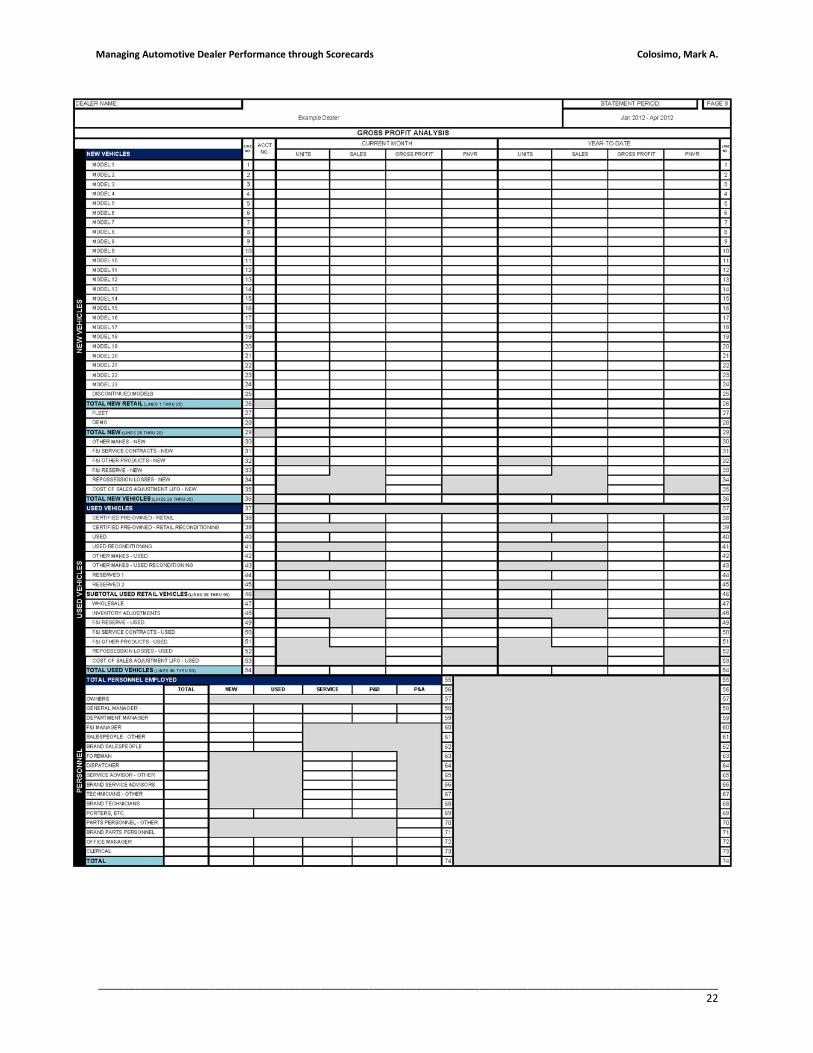
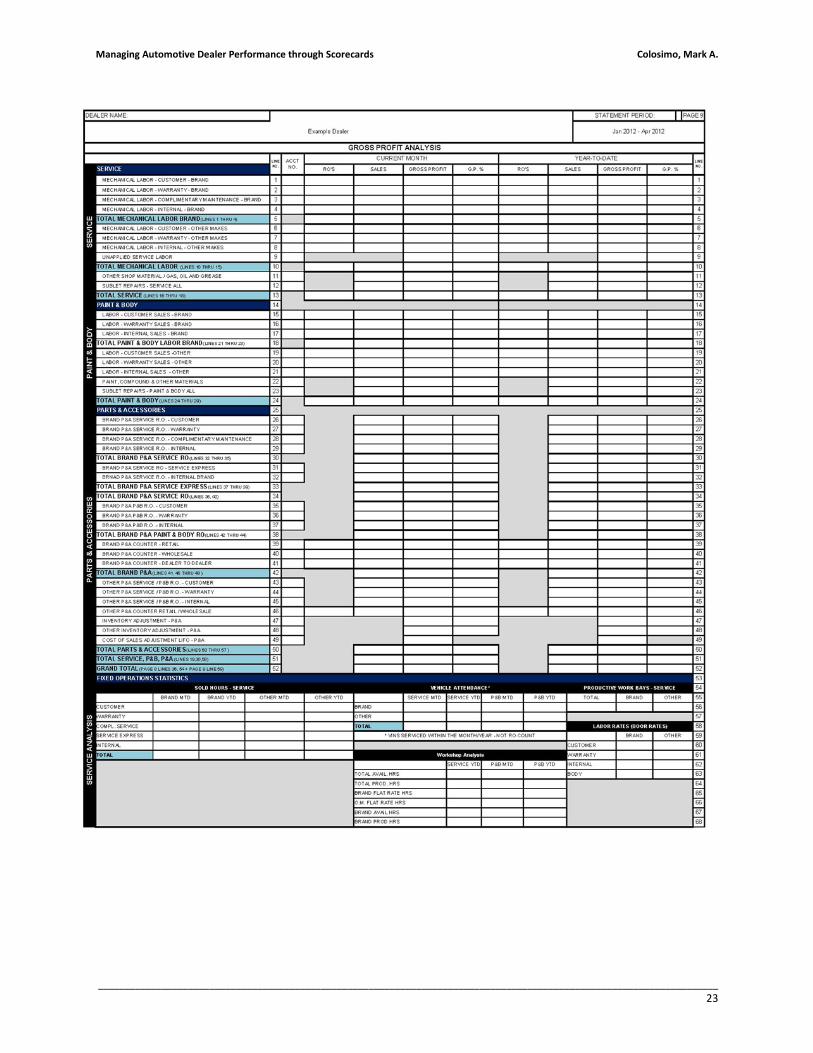
Exhibit D
Sample dealer financial statement layout
These are the typical pages seen in the financial statement of a dealer. The data is provided from
the DMS (Dealer Management System) at the dealership to the manufacturer, who creates these
well organized, consistent statements.
Managing Automotive Dealer Performance through Scorecards Colosimo, Mark A.
_____________________________________________________________________________________________________________________
15
Managing Automotive Dealer Performance through Scorecards Colosimo, Mark A.
_____________________________________________________________________________________________________________________
16
Managing Automotive Dealer Performance through Scorecards Colosimo, Mark A.
_____________________________________________________________________________________________________________________
17
Managing Automotive Dealer Performance through Scorecards Colosimo, Mark A.
_____________________________________________________________________________________________________________________
18

Managing Automotive Dealer Performance through Scorecards Colosimo, Mark A.
_____________________________________________________________________________________________________________________
19
Managing Automotive Dealer Performance through Scorecards Colosimo, Mark A.
_____________________________________________________________________________________________________________________
20
Managing Automotive Dealer Performance through Scorecards Colosimo, Mark A.
_____________________________________________________________________________________________________________________
21
Managing Automotive Dealer Performance through Scorecards Colosimo, Mark A.
_____________________________________________________________________________________________________________________
22
Managing Automotive Dealer Performance through Scorecards Colosimo, Mark A.
_____________________________________________________________________________________________________________________
23
Managing Automotive Dealer Performance through Scorecards Colosimo, Mark A.
_____________________________________________________________________________________________________________________
24
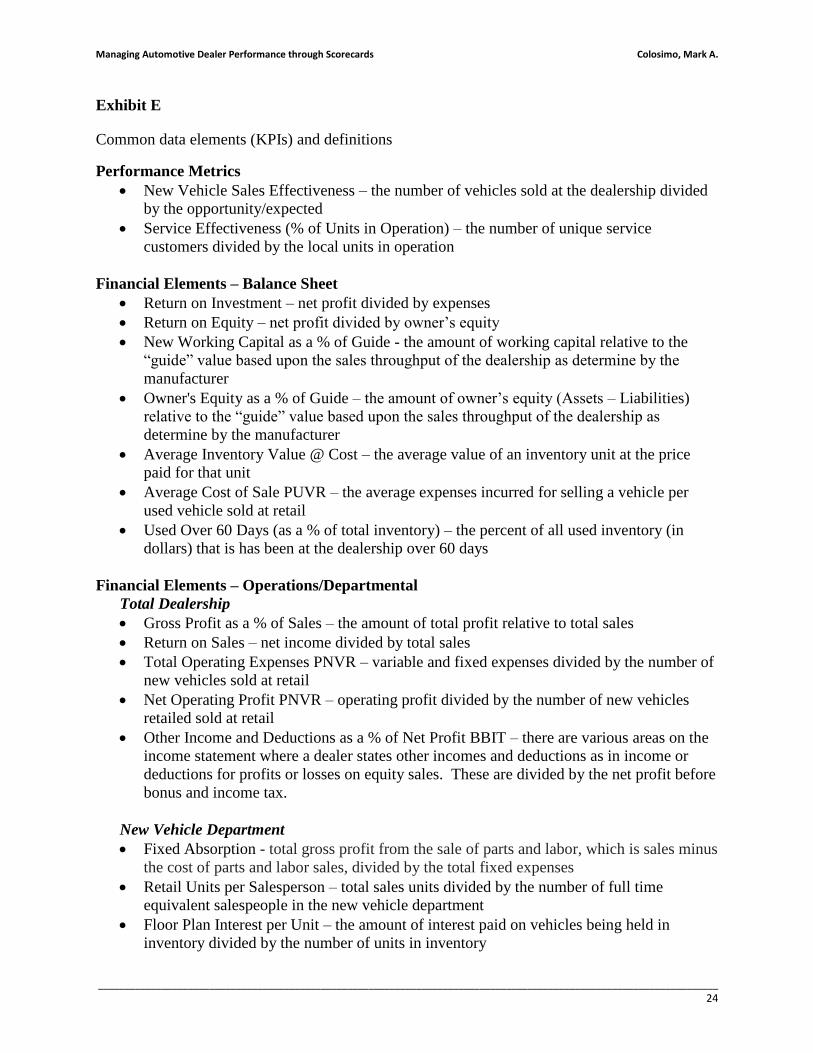
Exhibit E
Common data elements (KPIs) and definitions
Performance Metrics
New Vehicle Sales Effectiveness – the number of vehicles sold at the dealership divided
by the opportunity/expected
Service Effectiveness (% of Units in Operation) – the number of unique service
customers divided by the local units in operation
Financial Elements – Balance Sheet
Return on Investment – net profit divided by expenses
Return on Equity – net profit divided by owner’s equity
New Working Capital as a % of Guide - the amount of working capital relative to the
“guide” value based upon the sales throughput of the dealership as determine by the
manufacturer
Owner's Equity as a % of Guide – the amount of owner’s equity (Assets – Liabilities)
relative to the “guide” value based upon the sales throughput of the dealership as
determine by the manufacturer
Average Inventory Value @ Cost – the average value of an inventory unit at the price
paid for that unit
Average Cost of Sale PUVR – the average expenses incurred for selling a vehicle per
used vehicle sold at retail
Used Over 60 Days (as a % of total inventory) – the percent of all used inventory (in
dollars) that is has been at the dealership over 60 days
Financial Elements – Operations/Departmental
Total Dealership
Gross Profit as a % of Sales – the amount of total profit relative to total sales
Return on Sales – net income divided by total sales
Total Operating Expenses PNVR – variable and fixed expenses divided by the number of
new vehicles sold at retail
Net Operating Profit PNVR – operating profit divided by the number of new vehicles
retailed sold at retail
Other Income and Deductions as a % of Net Profit BBIT – there are various areas on the
income statement where a dealer states other incomes and deductions as in income or
deductions for profits or losses on equity sales. These are divided by the net profit before
bonus and income tax.
New Vehicle Department
Fixed Absorption - total gross profit from the sale of parts and labor, which is sales minus
the cost of parts and labor sales, divided by the total fixed expenses
Retail Units per Salesperson – total sales units divided by the number of full time
equivalent salespeople in the new vehicle department
Floor Plan Interest per Unit – the amount of interest paid on vehicles being held in
inventory divided by the number of units in inventory
Managing Automotive Dealer Performance through Scorecards Colosimo, Mark A.
_____________________________________________________________________________________________________________________
25
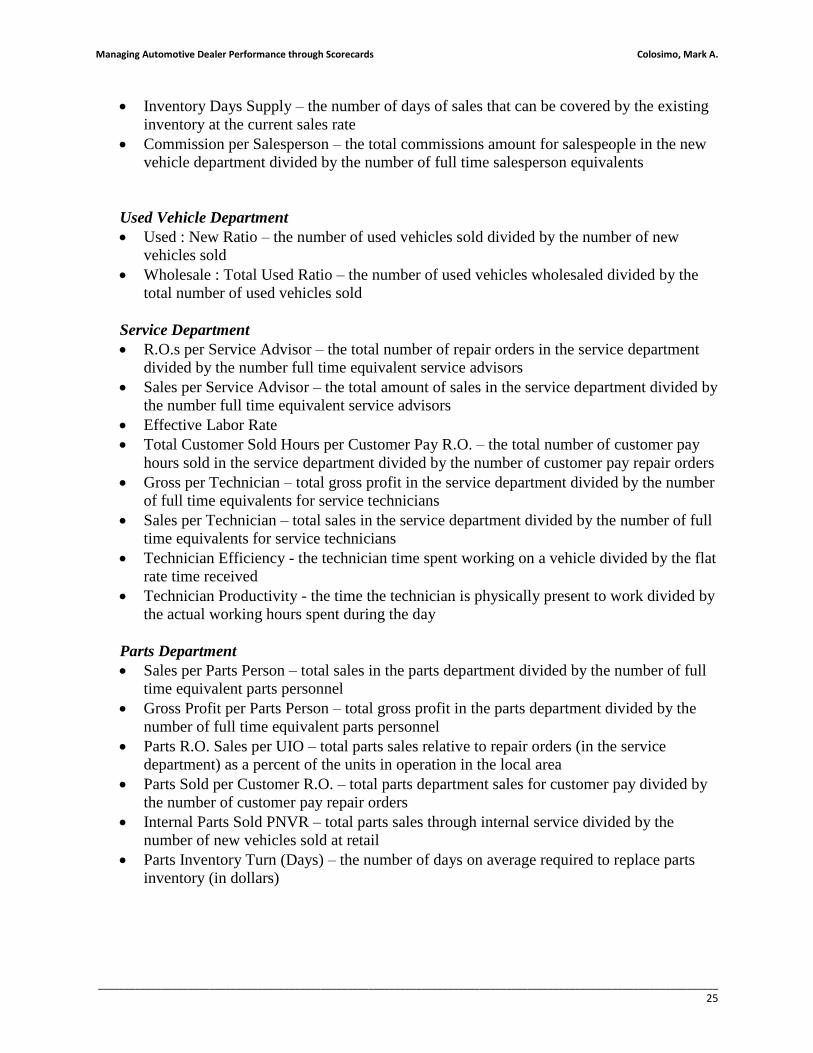
Inventory Days Supply – the number of days of sales that can be covered by the existing
inventory at the current sales rate
Commission per Salesperson – the total commissions amount for salespeople in the new
vehicle department divided by the number of full time salesperson equivalents
Used Vehicle Department
Used : New Ratio – the number of used vehicles sold divided by the number of new
vehicles sold
Wholesale : Total Used Ratio – the number of used vehicles wholesaled divided by the
total number of used vehicles sold
Service Department
R.O.s per Service Advisor – the total number of repair orders in the service department
divided by the number full time equivalent service advisors
Sales per Service Advisor – the total amount of sales in the service department divided by
the number full time equivalent service advisors
Effective Labor Rate
Total Customer Sold Hours per Customer Pay R.O. – the total number of customer pay
hours sold in the service department divided by the number of customer pay repair orders
Gross per Technician – total gross profit in the service department divided by the number
of full time equivalents for service technicians
Sales per Technician – total sales in the service department divided by the number of full
time equivalents for service technicians
Technician Efficiency - the technician time spent working on a vehicle divided by the flat
rate time received
Technician Productivity - the time the technician is physically present to work divided by
the actual working hours spent during the day
Parts Department
Sales per Parts Person – total sales in the parts department divided by the number of full
time equivalent parts personnel
Gross Profit per Parts Person – total gross profit in the parts department divided by the
number of full time equivalent parts personnel
Parts R.O. Sales per UIO – total parts sales relative to repair orders (in the service
department) as a percent of the units in operation in the local area
Parts Sold per Customer R.O. – total parts department sales for customer pay divided by
the number of customer pay repair orders
Internal Parts Sold PNVR – total parts sales through internal service divided by the
number of new vehicles sold at retail
Parts Inventory Turn (Days) – the number of days on average required to replace parts
inventory (in dollars)