marine water quality statistics - united nations · 2019-05-31 · marine water quality –status...
TRANSCRIPT

Marine Water Quality StatisticsTopics 1.3.3 Marine Water Quality of the Basic Set of Environment Statistics of the FDES 2013
Jillian Campbell and Rachel Kosse, UN Environment
Manual on the Basic Set of
Environment Statistics of
the FDES 2013

1. Statistics in Topic 1.3.3 Marine Water Quality
Nutrients and chlorophyll➢ Concentration level of nitrogen➢ Concentration level of phosphorous
➢ Concentration level of chlorophyll A
Organic Matter➢ Biochemical oxygen demand (BOD)➢ Chemical oxygen demand (COD)
Pathogens➢ Concentration levels of faecal coliforms
in recreational marine waters
Metals (e.g., mercury, lead, nickel, arsenic, cadmium)
➢ Concentration levels in sediment and marine water
➢ Concentrations levels in marine organisms
Organic contaminants (e.g., PCBs, DDT, pesticides, furans, dioxins, phenols, radioactive waste)
➢ Concentration levels in sediment and marine water
➢ Concentration levels in marine organisms
Physical and chemical characteristics➢ pH/acidity/alkalinity➢ Temperature
➢ Total suspended solids (TSS)
➢ Salinity➢ Dissolved oxygen
➢ Density
Coral bleaching➢ Area affected by coral bleaching
Plastic waste and other marine debris➢ Amount of plastic waste and other debris in
marine waters
Red tide➢Occurrence➢ Impacted area
➢ Duration
Oil pollution➢ Area of oil slicks➢ Amount of tar balls

2.Introduction/ Relevance
Marine water quality statistics are essential to make progress on improving the ocean environment
Current resources to develop marine water quality statistics include:➢The Global Manual on Ocean Statistics - supports tracking progress for SDG indicators
14.1.1a, 14.1.1b, 14.2.1, and 14.5.1 including: a review of existing resources and a guide to implementing methods.
➢The GESAMP Guidelines for the monitoring and assessment of plastic litter and microplastics in the ocean – including data requirements and study design recommendations
➢The Regional Seas Programmes – coordinated sustainable management at the regional level and 22 indicators for oceans
Marine water quality statistics can be improved by:➢Forming a greater link between freshwater quality monitoring and marine water
quality
➢ Increasing in situ monitoring
➢Establishing a greater understanding of uncertainties related to modelled marine water quality data

3. Definitions and description of the statistics Marine water quality – status of ocean water in a certain area (e.g., water
column, on shorelines, etc.).
Marine pollution – harmful substances negatively impacting marine water quality
Marine litter – any persistent, manufactured or processed solid material discarded, disposed of or abandoned in the marine and coastal environment (GPA 1995)
categorized by size including:mega-litter, macro-litter, meso-litter, mirco-litter (specifically known as microplastics) and nano-litter.
Coastal eutrophication – occurs following an imbalance in nutrient concentration in a certain area.
Ocean acidification/warming – results of increased carbon emissions from human activities
@Bo Eide https://flic.kr/p/cVy8L3

3A. Definition of statistics
Index of Coastal Eutrophication (ICEP) – a way to determine risk level of a specific area to eutrophication based on land use and estimating how much runoff will be delivered by rivers to coastal waters.
Marine litter - identified and measured within various areas including shorelines, sea surface and water column, seafloor, marine biota and particular considerations for microplastics. The statistics to match the monitoring location include: plastic debris washed on beaches, plastic debris on the sea surface and in the water column, plastic debris on the seafloor and plastic ingested by biota (GESAMP 2019).
Each of the Statistics in Topic 1.3.3 Marine Water Quality from slide 1 are further elaborated in this section
@Lawrence Hislop http://www.grida.no/resources/1123

4.International sources and recommendations
4A. Classifications and groupings
GESAMP Classification for Marine Litter➢Provide a collective overview of marine plastic litter including details on
how to develop measurements over time and analyse what the measurements can mean in terms of marine water quality
UNEP Classification for Coastal Eutrophication➢An expert working group coordinated by UNEP classified coastal
eutrophication in terms of a monitoring framework that described aspects of coastal eutrophication including nitrogen, phosphate, silica, chlorophyll A and other water quality parameters
• UNECE Classification of Marine Water Quality➢The Readings in International Environmental Statistics from 1990
established standard statistical classifications across disciplines and evaluates marine water quality according to six groups: metals, organochlorines, other contaminants, oxygen regime in bottom water, eutrophication in surface waters and radioactivity
• Ecosystem-based Management under SDG indicator 14.2.1➢forms of management that stem from scientific knowledge of the
ecosystem health, factors impacting that health and human interaction with the ecosystem

4B. Reference to international statistical recommendations, frameworks and standards
GESAMP (2019). Guidelines or the monitoring and assessment of plastic litter and microplastics in the ocean (Kershaw P.J., Turra A. and Galgani F. editors), (IMO/FAO/UNESCO-IOC/UNIDO/WMO/IAEA/UN/UNEP/UNDP/ISA Joint Group of Experts on the Scientific Aspects of Marine Environmental Protection). Rep. Stud. GESAMP No. 99, 130p https://environmentlive.unep.org/media/docs/marine_plastics/une_science_dvision_gesamp_reports.pdf
UN Environment (2018). Global Manual on Ocean Statistics. Towards a definition of indicator methodologies. Nairobi (Kenya): UN Environment. 46 pp. plus four appendices. https://uneplive.unep.org/media/docs/statistics/egm/global_manual_on_ocean_statistics_towards_a_definition_of_indicator_methodologies.pdf
UN Economic Commission for Europe (1993). Readings in International Environment Statistics. New York, NY. https://unstats.un.org/unsd/envaccounting/ceea/archive/Framework/classification_in_environment.pdf

4C. Sources of global and regional environment statistics and indicators series
Provides a brief description and link to various databases, articles, books and maps that all maintain data relevant to marine water quality statistics
Data collection for these sources occurs in various ways, with popular methods including:
➢Citizen science beach clean-ups
➢Academic research – analysis of litter from beach clean-ups, study of biota for marine debris ingestion
➢Modelling marine litter
➢Satellite remote sensing detection and monitoring of marine pollution
@Lawrence Hislop http://www.grida.no/resources/1121
Hafeez et al. 2018 DOI: 10.5772/intechopen.81657

5. Data collection and sources of data
Statistical unit – concentration or area
Data collection processes are currently specific to individual studies
Efforts exist to harmonize data collection for improved methodologies to allow for coordinated global databases
➢Also seek to improve collaboration between nations, regions, institutions and the levels of data collection
Currently marine water quality data originates from national monitoring programs, academic research and research institutions.
➢Methods span sampling water, sediments and biota; land-based modelling; beach clean-ups and remote sensing data
Three main forms of monitoring:➢Land-based modelling – consolidates various land use and population
statistics to estimate nutrient loads entering rivers
➢In situ monitoring – directly sampling coastal or marine areas
➢Remote sensing – monitors indicators for nutrient pollution and marine litter based on satellite imagery
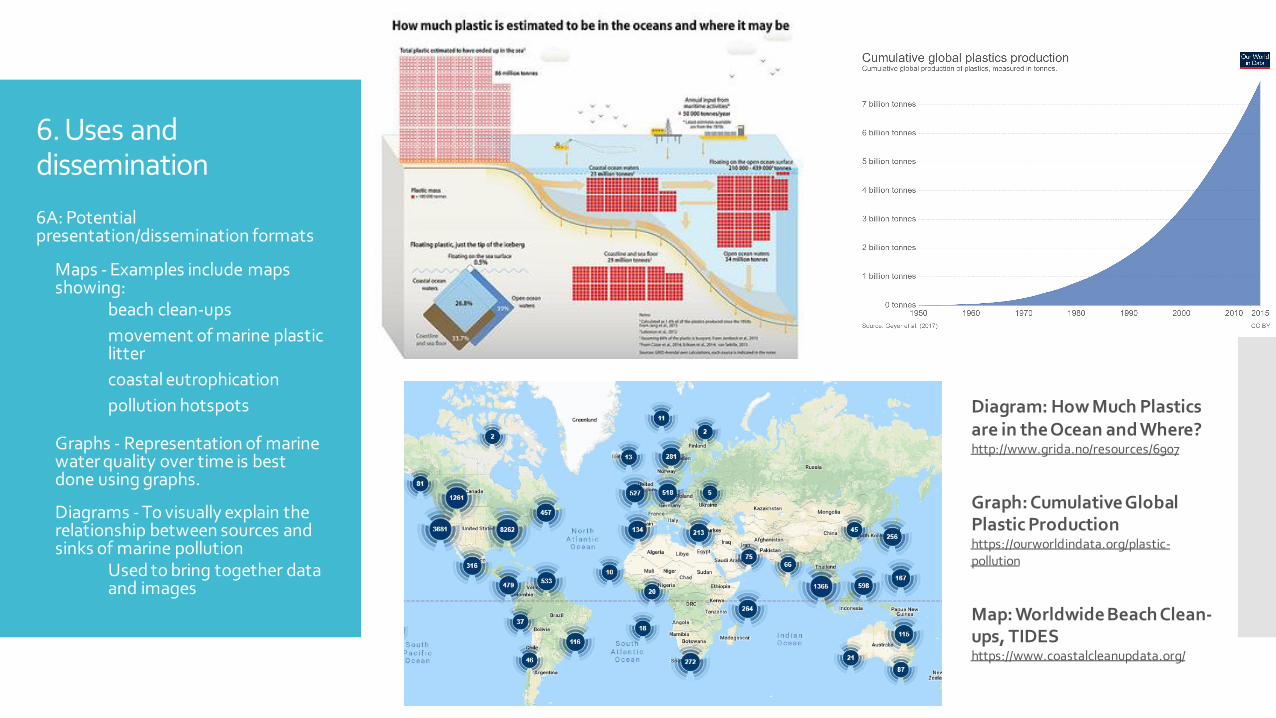
6. Uses and dissemination
6A: Potential presentation/dissemination formats
Maps - Examples include maps showing:
➢ beach clean-ups
➢movement of marine plastic litter
➢ coastal eutrophication
➢ pollution hotspots
Graphs - Representation of marine water quality over time is best done using graphs.
Diagrams - To visually explain the relationship between sources and sinks of marine pollution
➢ Used to bring together data and images
Diagram: How Much Plastics are in the Ocean and Where?http://www.grida.no/resources/6907
Graph: Cumulative Global Plastic Productionhttps://ourworldindata.org/plastic-pollution
Map: Worldwide Beach Clean-ups, TIDEShttps://www.coastalcleanupdata.org/

6B. SEEA accounts/ tables that use these statistics
SEEA Central Framework includes ‘Water emissions account’ in which several statistics are traced through economic sectors to the ocean, including:
➢BOD/COD
➢Suspended solids
➢Nitrogen and Phosphorus
SEEA Experimental Ecosystem Accounting includes a water quality aspect in the condition account
➢Coastal and marine ecosystems are introduced as specific types

6C. Commonly used indicators that incorporate these statistics
National reporting agencies often have requirements to test bathing water quality
Marine Information System for Europe host indicators on heavy metals, chlorophyll-a, total nitrogen and phosphorus etc.
Regional Seas Indicators include the statistics in various ways
TWAP Indicators include the statistics in various ways

6D. SDG indicators that incorporate these statistics
14.1.1 “Index of Coastal Eutrophication (ICEP) and marine litter” ➢ICEP and chlorophyll a A (FDES 1.3.3.a.3), plastic waste and other marine debris
(FDES 1.3.3.h)
14.2.1 “Proportion of national exclusive economic zones managed using ecosystem-based approaches”
➢Exclusive economic zones (EEZ) using ecosystem-based approaches can be informed from these environmental statistics as a way to determine the success of the management.
14.3.1 “Average marine acidity (pH) measured at agreed suite of representative sampling stations”
➢pH/alkalinity/acidity (FDES 1.3.3.f.1), other physical statistics (FDES 1.3.3.f) and coral bleaching (FDES 1.3.3.g)
14.4.1 “Proportion of fish stocks within biologically sustainable levels”➢Physical statistics (FDES 1.3.3.f), nutrients (FDES 1.3.3.a ), red tides (FDES 1.3.3.i)
and oil pollution (FDES 1.3.3.j)
14.5.1 “Coverage of protected areas in relation to marine areas.” ➢The environmental statistics can serve to identify hotspots or problem areas that
need to be prioritized as a protected area.

Thank youJillian Campbell
Chief Statistician
UN Environment
Skype: jillian.campbell39 --- Twitter: @jillstats
Web: https://environmentlive.unep.org/statistics
Manual on the Basic Set of
Environment Statistics of
the FDES 2013