marine terminal management training program jacksonville, fl
TRANSCRIPT
Marine Terminal Management Training ProgramJacksonville, FL
Trends in Container Terminal Design
October 26, 2010
Paul Starr, PE, CEng Vice President Halcrow
Vijay Agrawal, Sr. Port Analyst and Planner, AECOM

Introduction
• Container terminal design trend
• Factors driving the trend
• Planning and engineering of a terminal
– Number of berths, water depth
– Land usage
– Site elevation
– Infrastructure
October 29, 2010 Page 2

Container terminal design trend
North America
Historically operating at low density
and high labor cost
Due to growing environmental concerns
pressure to operate with
• Fewer air emissions
• Higher density
Automation has been slow but growing
• Perceived inefficiency of the first systems
• Resistance of organized labor
• Capital cost of implementation
October 29, 2010 Page 3

Container terminal design trend
North America
APMT Terminal in Norfolk, VA leading
the trend
• ASCs with manual shuttle carriers
• 50% increase in avg QC productivity
• Ports America Concession at
Port of Oakland with similar scheme
Strong interest in hybrid RTGs
• Reduce pollution
• Increase fuel savings
• Battery and flywheel-based
Tandem 40 Quay Cranes arrived in
Deltaport, Vancouver
October 29, 2010 Page 4

Container terminal design trend
Asia
High density, low labor cost (RTG + tractors)
Low but growing environmental concern
Trending towards semi-automation
• Overhead bridge crane system at Singapore
• Automated RTGs – Toshima terminal in Japan
• Double cantilever RMGs at Pusan and Shanghai
Early adapters of Tandem-40 cranes
October 29, 2010 Page 5

Container terminal design trend
Europe
Medium density, high labor cost
(straddle carrier based)
High environmental concerns
Moderately strong union
Pioneer of highly automated terminals
• Robotic AGVs + ASCs
• Dual hoist cranes (2nd hoist automated)
October 29, 2010 Page 6
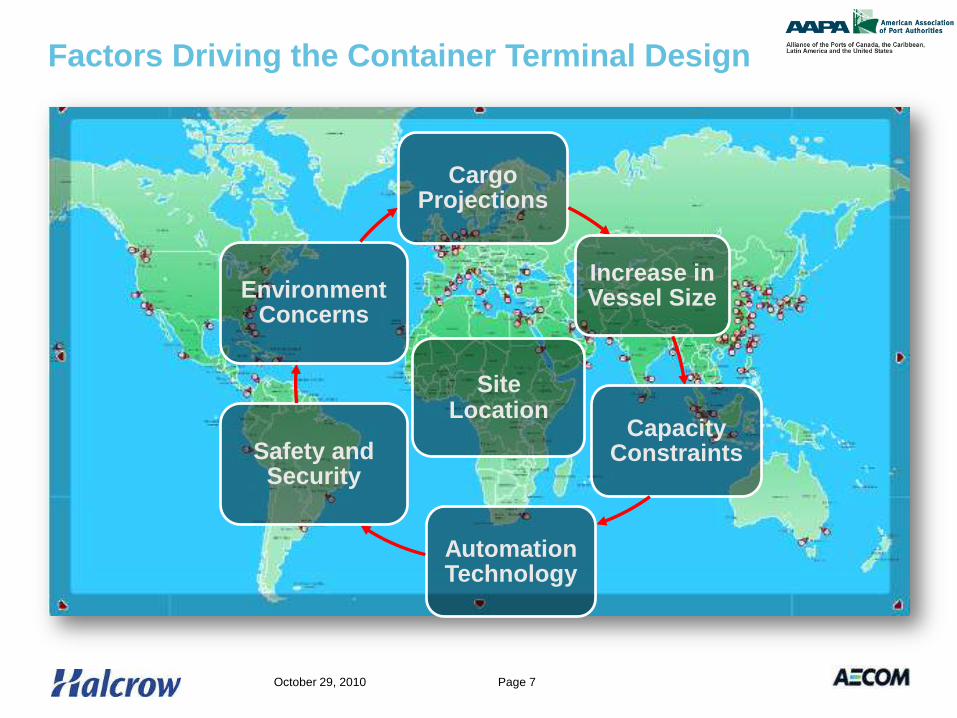
Factors Driving the Container Terminal Design
Cargo Projections
Increase in Vessel Size
Capacity Constraints
Automation Technology
Safety and Security
Environment Concerns
Site Location
October 29, 2010 Page 7

North America Container Port Traffic (TEUs)
October 29, 2010 Page 8

North America Container Port Traffic (% of total)
October 29, 2010 Page 9

Length Distribution of Recently Built Container Vessels
(Panamax or larger)
October 29, 2010 Page 10

Draft Distribution of Recently Built Container Vessels
(Panamax or larger)
October 29, 2010 Page 11

Storage Density at Top North America Ports
October 29, 2010 Page 12
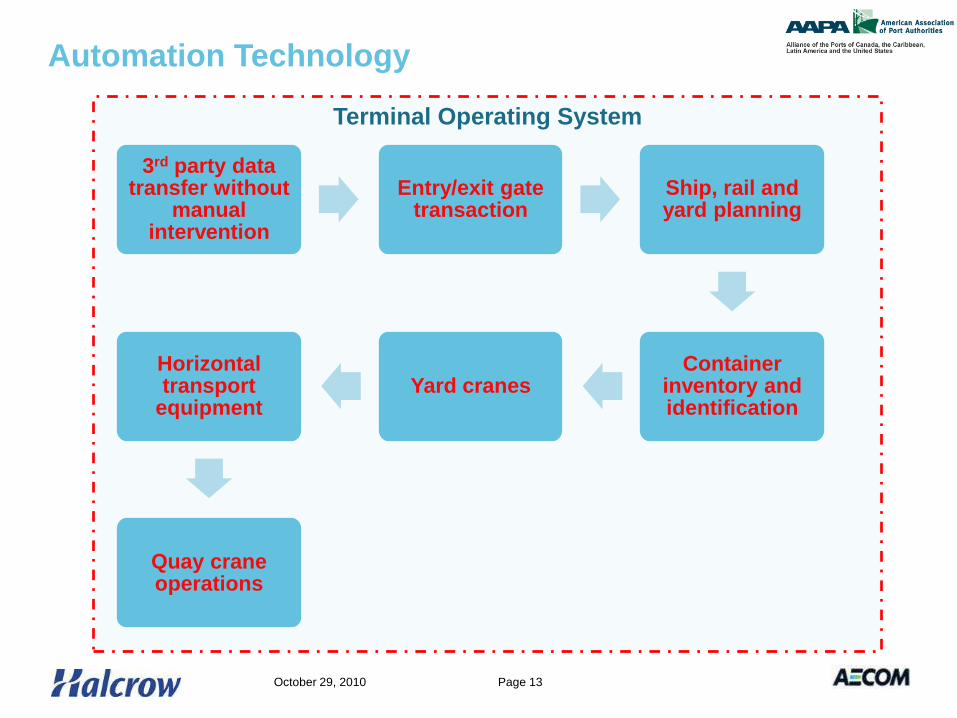
Automation Technology
3rd party data transfer without
manual intervention
Entry/exit gate transaction
Ship, rail and yard planning
Container inventory and identification
Yard cranesHorizontal transport
equipment
Quay crane operations
October 29, 2010 Page 13
Terminal Operating System

Safety and Security
• Security
– Street truckers cannot
access containers directly
– Fewer terminal personnel
– Computer control and
recording of all container
movement
– Automated scanning of
cargo while in the CY
Safety
• Fewer people = fewer people
getting hurt
• No need for trucks to drive
underneath yard cranes
October 29, 2010 Page 14
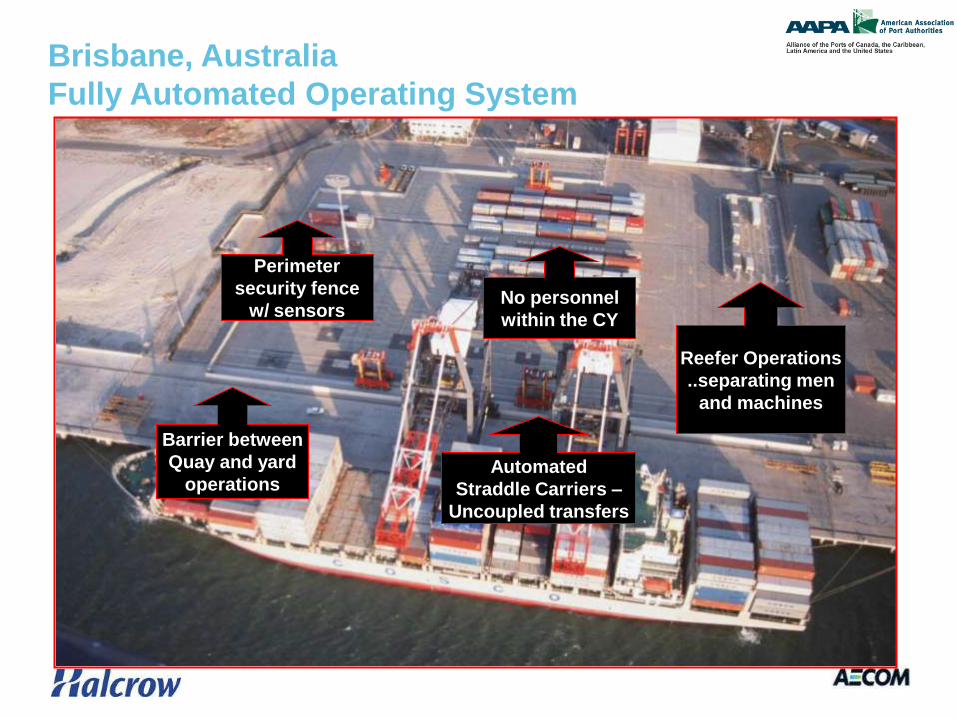
Brisbane, Australia
Fully Automated Operating System
Automated
Straddle Carriers –
Uncoupled transfers
No personnel
within the CY
Perimeter
security fence
w/ sensors
Reefer Operations
..separating men
and machines
Barrier between
Quay and yard
operations

Environmental Concerns
October 29, 2010 Page 16

And…..Site Location… Location… Location
• Green field or brown field?
• Relocation of existing tenants
• Excavation vs. dredging
• Environmental mitigation
• Terminal access and utilities
October 29, 2010 Page 17
All Deep Sea Lifts
Lifts by Water Lifts by Land
by Barge by Ocean
Transshipment Deep Relay
by Rail by Road
Loads Empties

1. Waterside Infrastructure
Planner’s Concerns
Throughput across the
berth
Size of vessels (length, draft and beam)
Type of quay cranes (mobile,
gantry etc.) -Moves/ hour
Berth occupancy
Number of berths
October 29, 2010 Page 18

1. Waterside Infrastructure
Engineer’s Concerns
Berth alignment
Type of berth structure
(bulkhead, wharf, pier etc.)
Amount of Dredging
Material to be dredged –
Rock, sand, clay?
Environmental impacts – for
permitting
October 29, 2010 Page 19

October 29, 2010 Page 20
Dames Point Container Terminal, Jacksonville
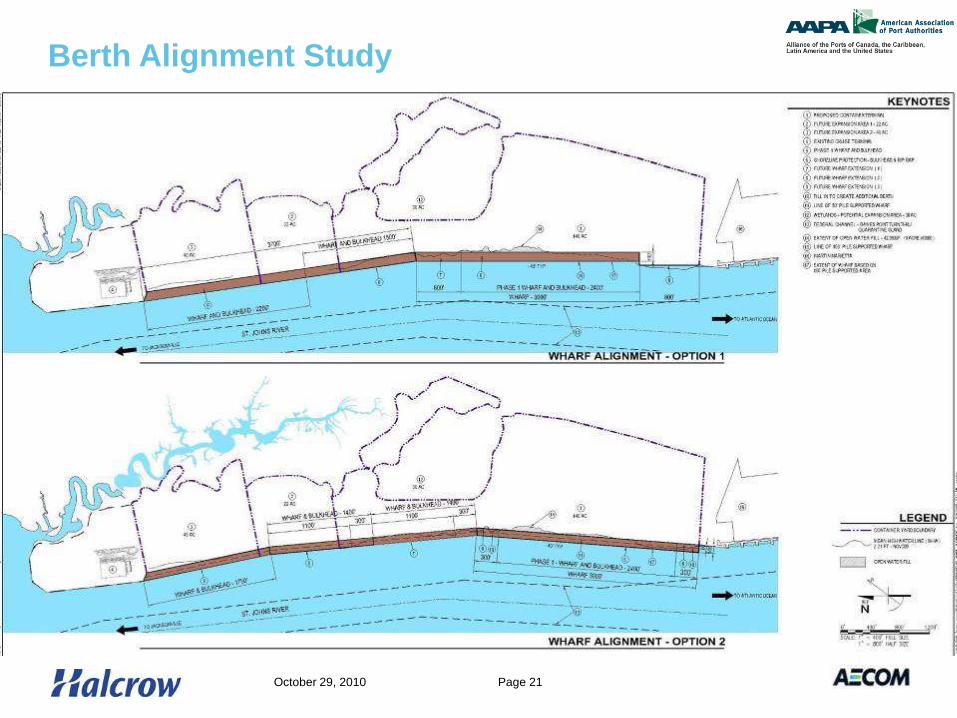
Berth Alignment Study
October 29, 2010 Page 21
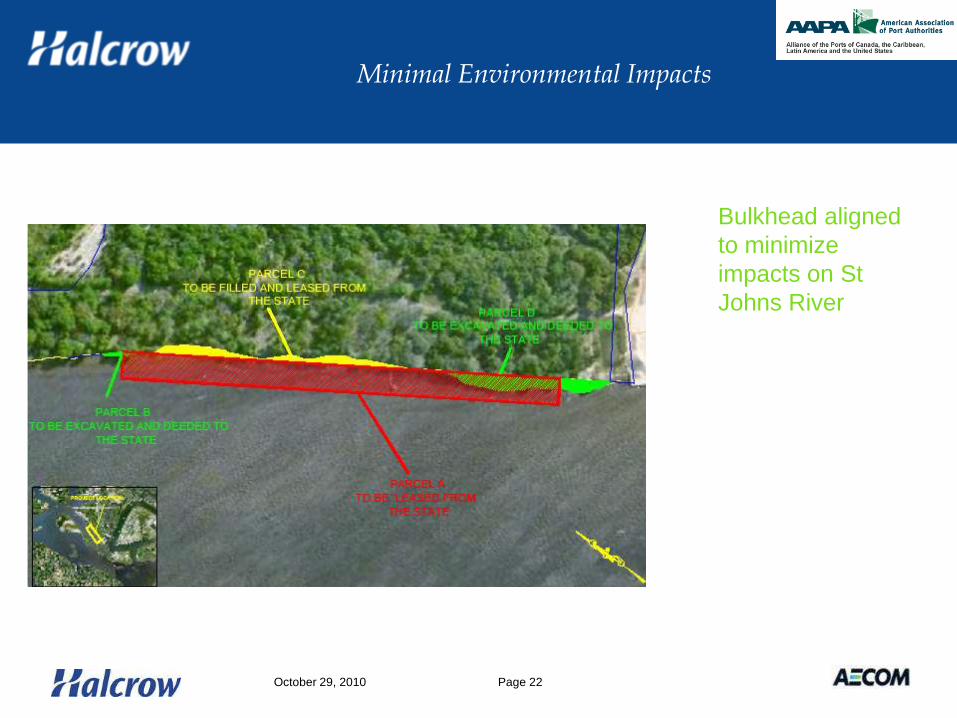
Minimal Environmental Impacts
Bulkhead aligned
to minimize
impacts on St
Johns River
October 29, 2010 Page 22

Site fill required
Pre-constructionCut and fillFinal gradesTotal fill = 460,000 m3
October 29, 2010 Page 23

Dredging
Solution was to dredge at the same time of bulkhead construction
October 29, 2010 Page 24

Temporary and permanent spoil cells
October 29, 2010 Page 25

Modified Cell XY
Dredge concept
was to allow
muds to flow
into a channel
and be pumped
over to Bartram
Island
October 29, 2010 Page 26
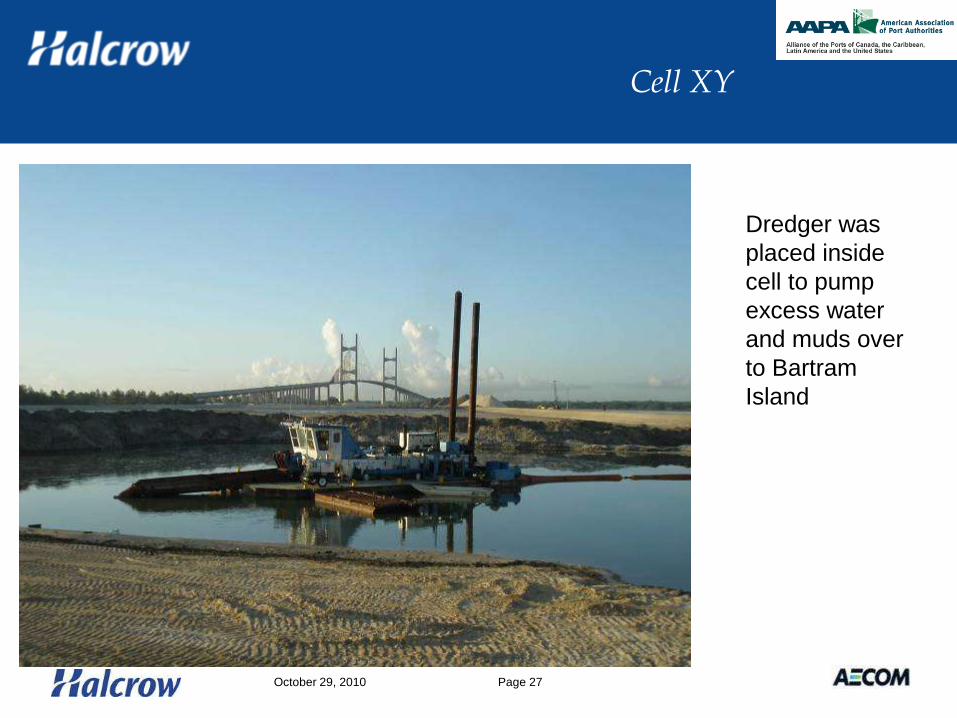
Cell XY
Dredger was
placed inside
cell to pump
excess water
and muds over
to Bartram
Island
October 29, 2010 Page 27

Sand dredged
into cells on
Dames Point
was very good
quality
Cell XY
October 29, 2010 Page 28

Bartram Island
…and muds
that separated
out were
pumped over to
Bartram Island
via a
submerged
pipeline
October 29, 2010 Page 29

Construction activities
August 2007
Dredging and
bulkhead
construction
scheduled in
parallel
By September,
dredging,
bulkhead and
civil works
concurrent
October 29, 2010 Page 30

2. Land Usage
Planner’s ConcernsType of
container handling
equipment
Parallel or perpendicular
stacks
Height and width of stacks
Number of gates and
length of queue lanes
Interface with Rail
October 29, 2010 Page 31

Plus….Terminal Layout Needs to Account for
Productivity Capacity Service reliabilityFlexibility for
increased velocity or capacity
Flexibility for expansion
Startup riskSuitability for robotic
operation
Flexibility to respond to odd
operating situations
Maintainability and durability
Capital Cost LaborEntry and exit gate
locations
Location of any on-terminal queuing
locations
Width of traffic aisles
Location of private vehicle parking
Procedure for transporting
personnel to and from work locations
October 29, 2010 Page 32

Case Study: West Basin Container Terminal
B100B102
B108
B106

Terminal Layouts (RTG Cases)
Option A Option B
October 29, 2010 Page 34

ASC Layouts Left ASC with Straddle Carriers; Right: ASCs with terminal tractors
Option C Option D
October 29, 2010 Page 35

Container Yard Capacity and Equipment Fleet
October 29, 2010 Page 36
-
200,000
400,000
600,000
800,000
1,000,000
1,200,000
1,400,000
1,600,000
1,800,000
2,000,000
A B C D
TEU
pe
r Ye
ar o
n B
10
6-1
08
Option
Berth capacity per WBCT (832k lifts * 1.8 = 1.5M TEU/yr)
October 29, 2010 Page 36
Option A Option B Option C Option D
Dock Crane Truck Truck Strad Truck
Stevedoring RTG + Top Pick Top Pick ASC ASC
Gate RTG + Top Pick RTG + Top Pick ASC ASC
Intermodal Yard RMG RMG RMG RMG
CY Support for IY Stv Top Pick Stv Top Pick Gate ASC Stv ASC
IY Transfer Eqmnt Terminal Tractor Terminal Tractor Terminal Tractor Terminal Tractor
Berth 100 Berth100 RTG Berth100 RTG Gate ASC Stv ASC
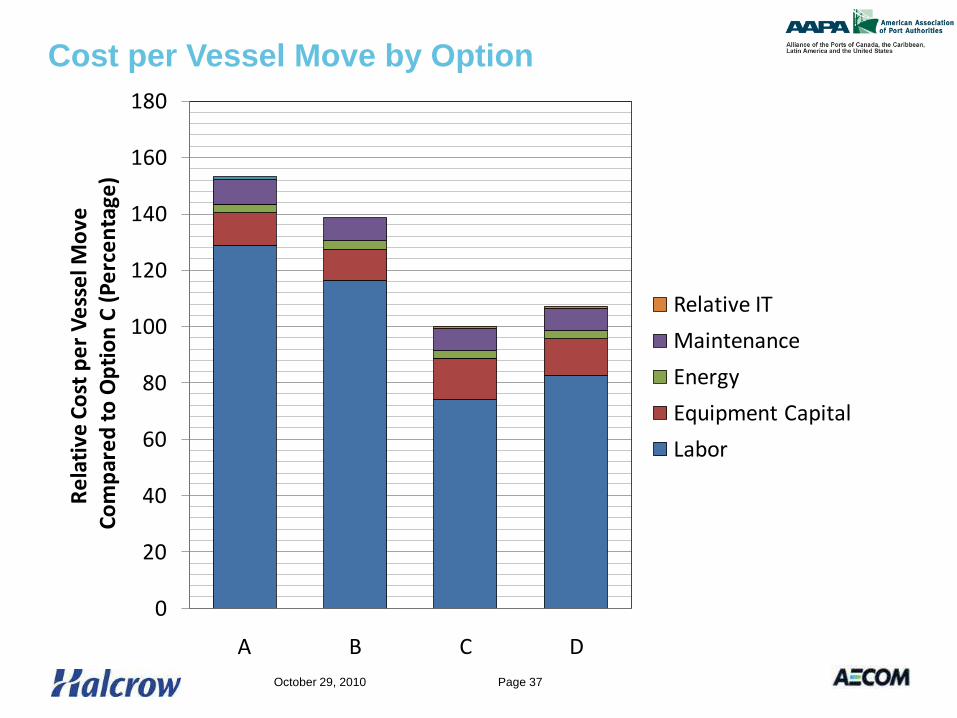
Cost per Vessel Move by Option
October 29, 2010 Page 37
0
20
40
60
80
100
120
140
160
180
A B C D
Re
lati
ve C
ost
pe
r V
ess
el M
ove
C
om
par
ed
to
Op
tio
n C
(P
erc
en
tage
)
Relative IT
Maintenance
Energy
Equipment Capital
Labor

Freeport Bahamas – Transhipment Terminal
Parallel RMGs with Strads
Straddle Carrier
with Container
RMG Rows parallel to
the quay
October 29, 2010 Page 38

2. Land Usage
Engineer’s Concerns
• Geotechnical information of site (suitability for pavements and building foundations)
• Topography of site – cut and fill
• Environmental impacts – for permitting (wetlands?)
• Storm water drainage
• Tide levels
• Flooding (storm surges, hurricanes, heavy rain)
October 29, 2010 Page 39

Minimal Environmental Impacts
Yellow –
Freshwater
wetlands impacts
3 acres of impact
Red – saltwater
wetlands impacts
0.4 acres of impact
October 29, 2010 Page 40

Minimal Environmental Impacts
October 29, 2010 Page 41

3. Infrastructure Connectivity
Planner’s Concerns
• Access to main roads
• Access to rail
• Connection to local utility providers– Terminal demands (power, lighting, sewer,
water)
• Intensity of traffic flows
October 29, 2010 Page 42

Road Access and Queuing Capacity
October 29, 2010 Page 43

Rail Access and Bottlenecks
October 29, 2010 Page 44
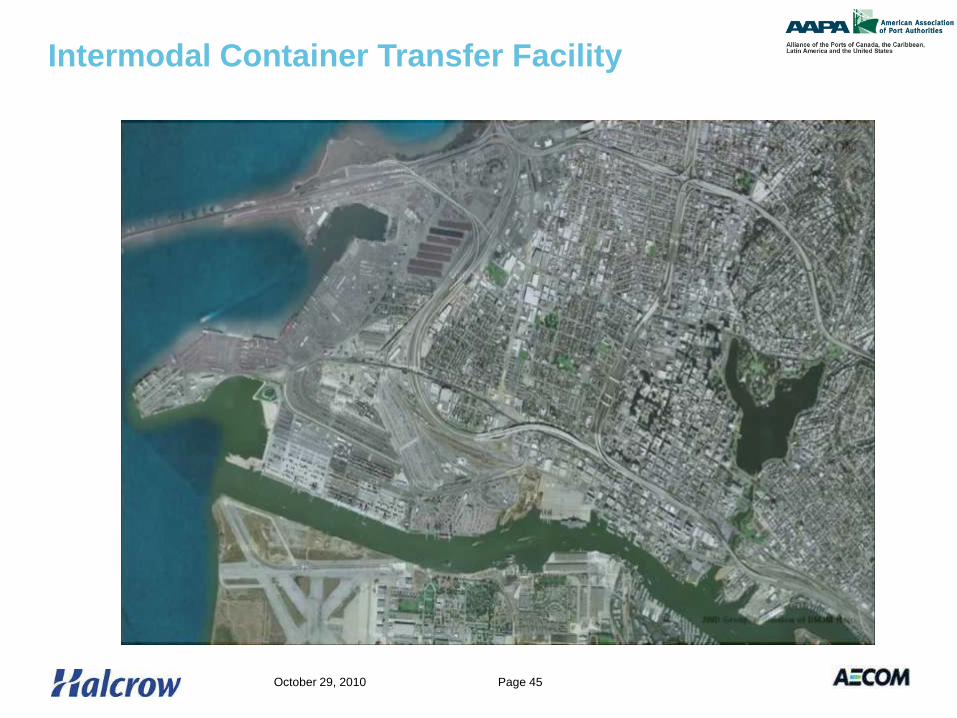
Intermodal Container Transfer Facility
October 29, 2010 Page 45

3. Infrastructure Connectivity
Engineer’s Concerns
• Traffic studies (impact on local traffic) – solutions?
• Power demands – substation, direct service, voltage etc.
• Sewer – gravity, force main, pump stations etc.
• Water – potable, fire mains, irrigation (local service, wells, salt water etc.)
• Telephones and data
• Permitting
October 29, 2010 Page 46

Site Access
October 29, 2010 Page 47
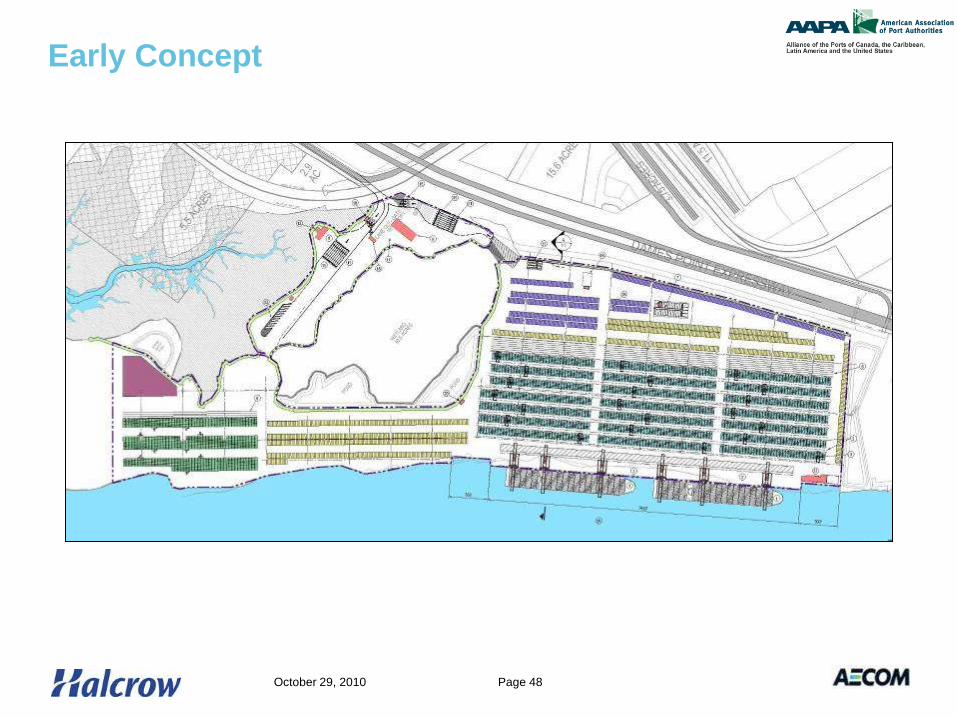
Early Concept
October 29, 2010 Page 48

Final Layout
October 29, 2010 Page 49

Summary of Container Terminal Design Trends
• Longer and deeper container vessels
• Automation of processes and equipment
• Densification of storage
• Sustainable and environmentally friendly
October 29, 2010 Page 50
Questions or comments?