marine money japan ship finance forum€¦ · marine money japan ship finance forum . contents 1....
TRANSCRIPT

Current Situation in Shipbuilding -World and Japan-
Masashi Terakado
The Shipbuilders’ Association of Japan
May 12th, 2016
Marine Money Japan
Ship Finance Forum
Contents
1. Current Situation and Projection on Seaborne Trade
2. World Shipbuilding Industry
3. Advantages of Japanese Shipbuilders
4. Measures on International Regulations
1
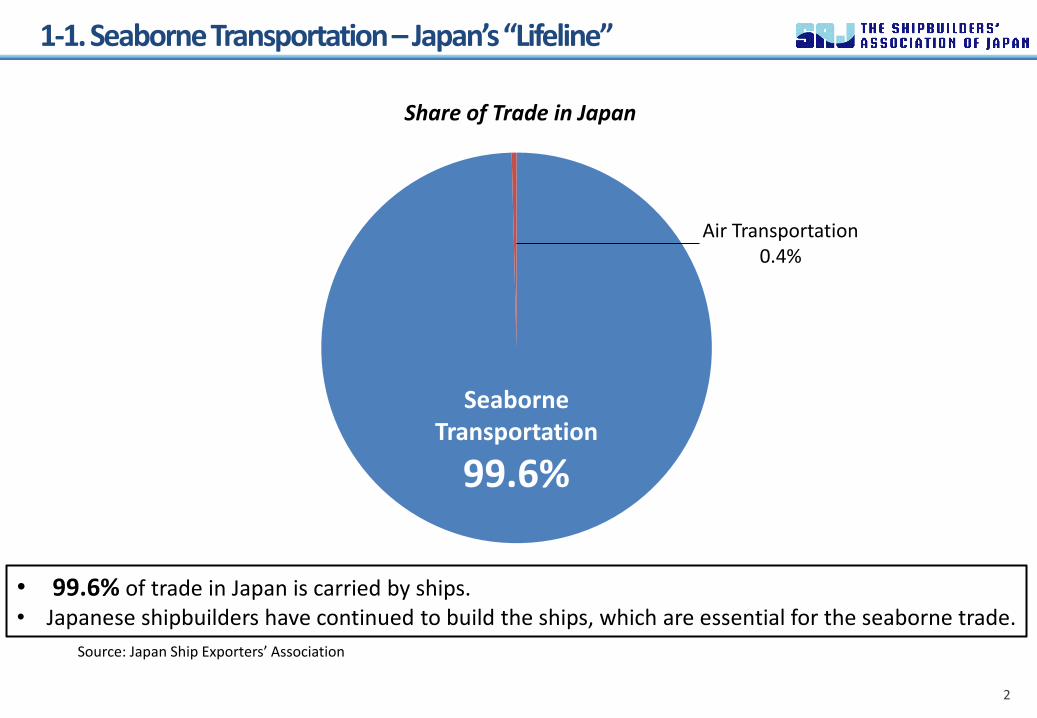
1-1. Seaborne Transportation – Japan’s “Lifeline”
2
• 99.6% of trade in Japan is carried by ships. • Japanese shipbuilders have continued to build the ships, which are essential for the seaborne trade.
Share of Trade in Japan
Seaborne Transportation
99.6%
Air Transportation 0.4%
Source: Japan Ship Exporters’ Association

1-2. World Seaborne Trade
3
Source: Clarkson
0
2
4
6
8
10
12
86 90 95 00 05 10 15
(Bill.Ton)
Iron Ore
Coal
Grain
Container
Crude Oil
Oil Products
Other Cargo
Iron Ore
Coal
Grain
Crude Oil
Container
Oil Products
Other Cargo
1986 2015 86/15
Iron Ore 0.3 1.4 5.2%
Coal 0.3 1.2 5.2%
Grain 0.2 0.4 3.0%
Container 0.2 1.7 8.4%
Crude Oil 1.0 1.9 2.1%
Oil Products 0.4 1.0 3.5%
Other Cargo 1.4 3.2 3.0%
Total 3.7 10.8 3.7%
Contents
1. Current Situation and Projection on Seaborne Trade
2. World Shipbuilding Industry
3. Advantages of Japanese Shipbuilders
4. Measures on International Regulations
4

2-1. History of World Shipbuilding Industry
5
0
20
40
60
80
100
120
65 70 75 80 85 90 95 00 05 10 15
(Mill.GT) World Completions (1965-2015)
Japan Korea Europe China Others
Japan: Largest Market Share 1967-1999
Oil Crisis (1973&1979)
1975 34.2
mil. gt
2011 101.8 mil. gt
Rise in Korea 1995-
Rise in China 2005-
Bankruptcy of Lehman Brothers
(2008)
suffering situation again
suffering situation
Completion Data: IHS

2-2. Oversupply of Fleet
6
GAP
100
150
200
250
300
90 91 92 93 94 95 96 97 98 99 00 01 02 03 04 05 06 07 08 09 10 11 12 13 14 15
Index (1990=100) Index Comparison between Seaborne Trade and Fleet
Seaborne Trade FleetSource: Clarkson

2-3. Problems in Shipbuilding Industry - Overcapacity and Oversupply
7
Imbalance of supply & demand
Low newbuilding price level
Unsustainable business
Government intervention
Distortion
of market Imbalance of
supply and demand
Low freight
price level
Unsustainable business
Incentive to
buy newbuilding
Additional fleet
Additional capacity
Shipbuilding Shipping
Bad Cycle in Shipbuilding and Shipping

Contents
1. Current Situation and Projection on Seaborne Trade
2. World Shipbuilding Industry
3. Advantages of Japanese Shipbuilders
4. Measures on International Regulations
8

3-1. Completions by Shiptype of Japan, Korea, China (2015)
9
39%
5% 6% 5% 6% 20% 19%
8%
52% 56%
83%
38% 19%
34%
49% 31% 30%
12%
27% 37%
37%
3% 12% 9%
29% 24% 10%
0%
20%
40%
60%
80%
100%
BC CONT Tanker LNGC Offshore Other Total
Other
China
Korea
Japan
9%
39%
31%
10%
5% 6%
48%
21%
15%
1%
3% 10%
BC
CONT
Tanker
LNGC
Offshore
Other[値]
6%
6%
1%
[値]
11%
Japan Korea China
World Completion share by shiptype
Source: IHS

3-2. Contracts (Orders) of Export Ship in Japan
10
71%
16%
13%
Share of Contracts in 2014
Share of Contracts in 2015
14.6
12.3 12.1
26.8
19.5
14.0
26.6
24.7
19.4
5.7
11.2
9.0 8.1
14.6 14.8
22.2
0
5
10
15
20
25
30
00 01 02 03 04 05 06 07 08 09 10 11 12 13 14 15
(Mill.GT)
Bulker Tanker Others
45%
34%
21%
Bulker Tanker OthersSource: Japan Ship Exporters’ Association
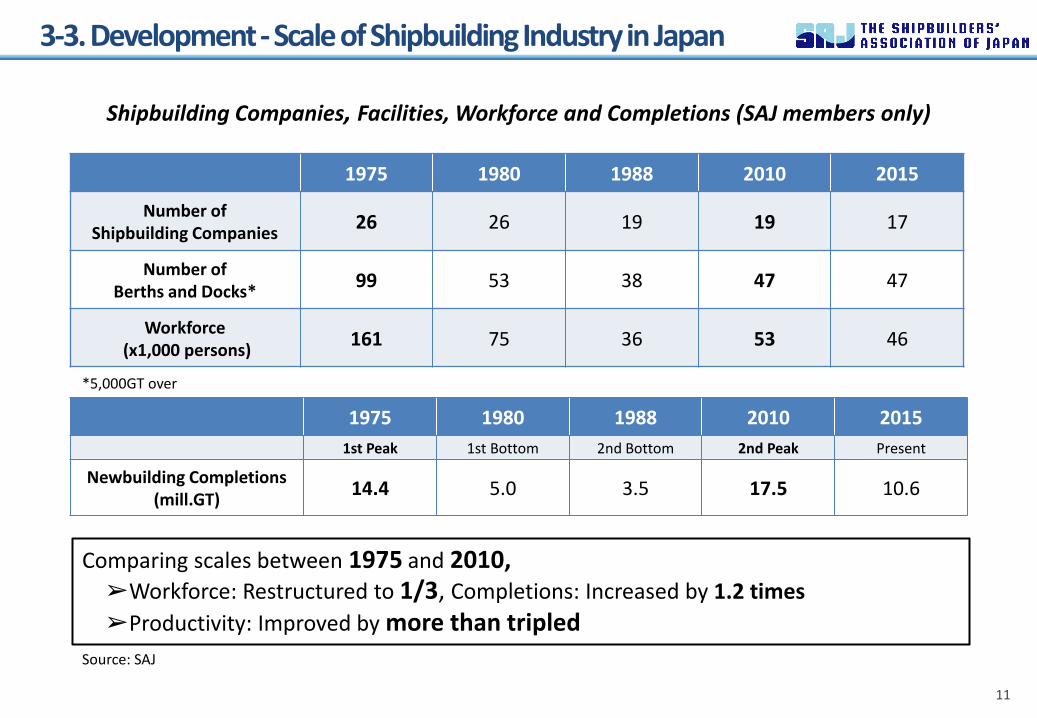
3-3. Development - Scale of Shipbuilding Industry in Japan
11
Comparing scales between 1975 and 2010, ➢Workforce: Restructured to 1/3, Completions: Increased by 1.2 times
➢Productivity: Improved by more than tripled
1975 1980 1988 2010 2015
Number of Shipbuilding Companies
26 26 19 19 17
Number of Berths and Docks*
99 53 38 47 47
Workforce (x1,000 persons)
161 75 36 53 46
Shipbuilding Companies, Facilities, Workforce and Completions (SAJ members only)
1975 1980 1988 2010 2015
1st Peak 1st Bottom 2nd Bottom 2nd Peak Present
Newbuilding Completions (mill.GT)
14.4 5.0 3.5 17.5 10.6
*5,000GT over
Source: SAJ

3-4. Comparison among Shipbuilding Industries of Japan, Korea, China
12
Productivity* Technology
Facility Capacity (Mill.CGT)
Workforce (10,000 persons)
Productivity (CGT per person)
Quality/ Performance
Research/ Development
Scale of Workforce
Japan 6.3 5 126
[100] ◎ ○ △
Korea 11.7 11 106 [84]
○ ○ ◎
China 19.7 49 40
[32] △ △ ○
*Numbers in 2012 adopted for comparison

3-5. Japan’s Orderbook Share by Nationality of Shipowner
13
37%
4%
4%
3% 2% 1%
41%
8%
End of December, 2015: Total 43.1 mill.GT
JAPAN CHINESE TAIPEI GREECE US SINGAPORE BERMUDA UNCONFIRMED OTHERS
Source: IHS
3-6. Maritime Cluster of Japan
14
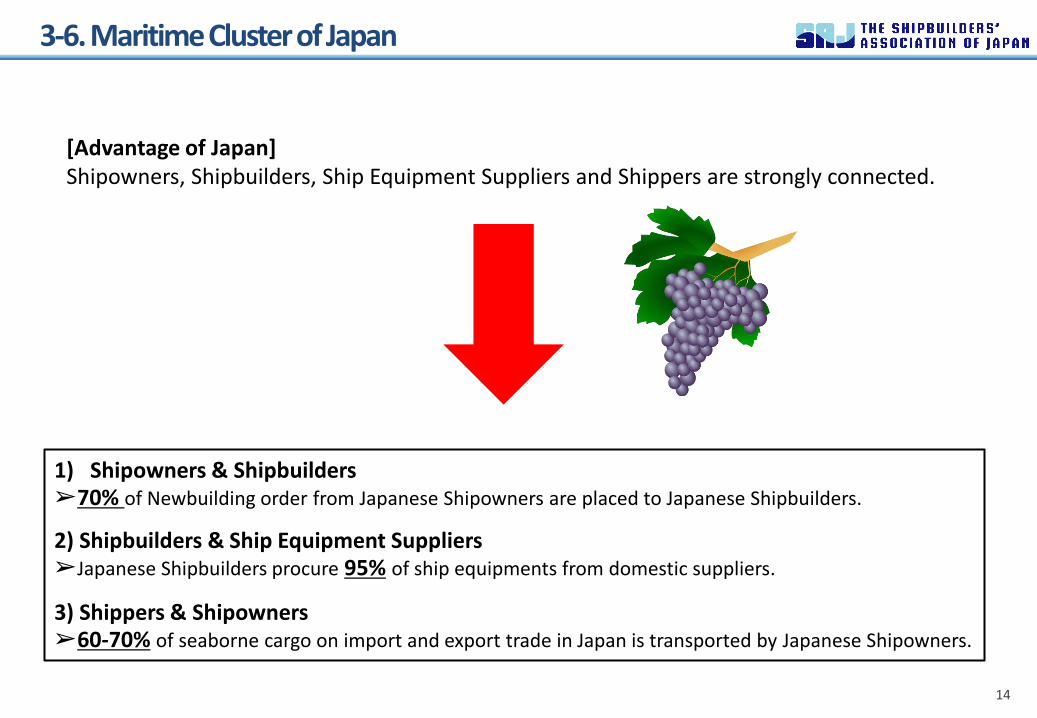
[Advantage of Japan] Shipowners, Shipbuilders, Ship Equipment Suppliers and Shippers are strongly connected.
1) Shipowners & Shipbuilders ➢70% of Newbuilding order from Japanese Shipowners are placed to Japanese Shipbuilders.
2) Shipbuilders & Ship Equipment Suppliers ➢Japanese Shipbuilders procure 95% of ship equipments from domestic suppliers.
3) Shippers & Shipowners ➢60-70% of seaborne cargo on import and export trade in Japan is transported by Japanese Shipowners.
3-7. Newbuilding Requirement (SAJ2015)
15
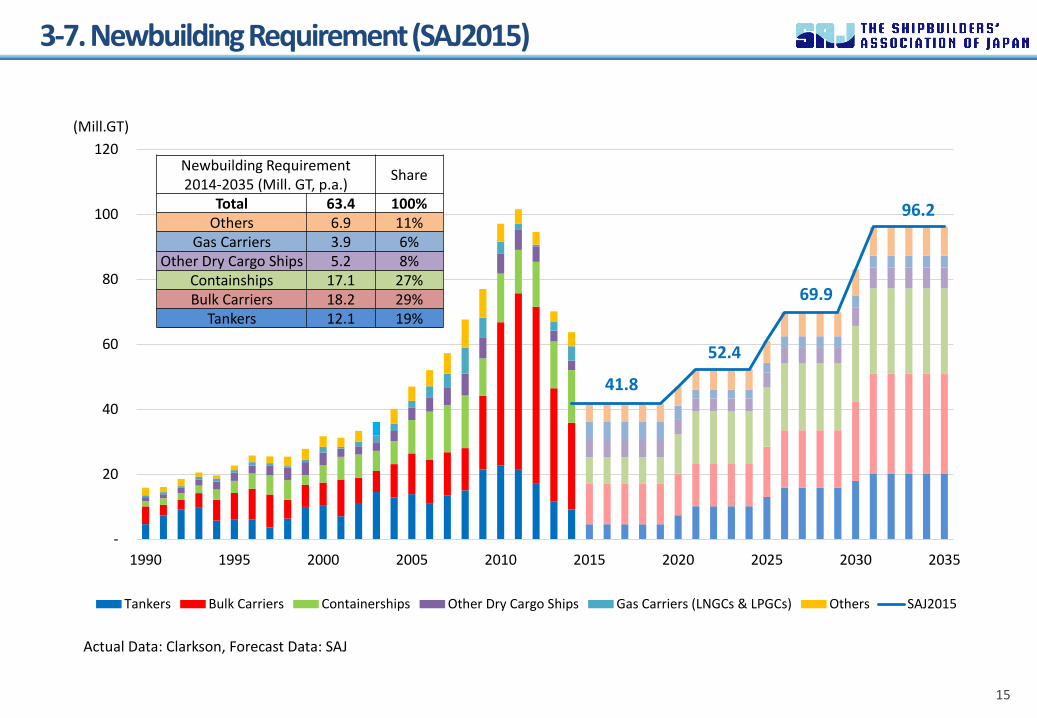
41.8
52.4
69.9
96.2
-
20
40
60
80
100
120
1990 1995 2000 2005 2010 2015 2020 2025 2030 2035
(Mill.GT)
Tankers Bulk Carriers Containerships Other Dry Cargo Ships Gas Carriers (LNGCs & LPGCs) Others SAJ2015
Newbuilding Requirement 2014-2035 (Mill. GT, p.a.)
Share
Total 63.4 100% Others 6.9 11%
Gas Carriers 3.9 6% Other Dry Cargo Ships 5.2 8%
Containships 17.1 27% Bulk Carriers 18.2 29%
Tankers 12.1 19%
Actual Data: Clarkson, Forecast Data: SAJ

3-8. Current Situation and Projection in the Shipbuilding Industry
16
Summary
• The seaborne trade is projected to increase worldwide along with the world population growth.
• A number of existing aged vessels are expected to be demolished steadily.
➢The two factors above will create newbuilding demand.
• The point is “Who’s the one to build the vessels?”
➢Advantages of Japanese Shipbuilders
1) Productivity
2) Technology
3) Maritime Cluster

Contents
1. Current Situation and Projection on Seaborne Trade
2. World Shipbuilding Industry
3. Advantages of Japanese Shipbuilders
4. Measures on International Regulations
17

4-1. IMO Regulations and Newbuilding Contracts
18
0.0
1.0
2.0
3.0
4.0
5.0
4 5 6 7 8 9 101112 1 2 3 4 5 6 7 8 9 101112 1 2 3 4 5 6 7 8 9 101112 1 2 3 4 5 6 7 8 9 101112 1 2 3 4 5 6 7 8 9 101112 1 2 3
2011 2012 2013 2014 2015
(fiscal year)
Contracts of Export Ship (2011-2015)
Others
Cargo Ship
Tanker
Bulk Carrier
Average
(Mill.GT)
New Common Structural Rules for vessels contracted
on or after July 1st, 2015
New Noise Code for vessels contracted
on or after July 1st, 2014
Tier III NOx regulation for vessels started to build
on or after January 1st, 2016
Source: Japan Ship Exporters’ Association
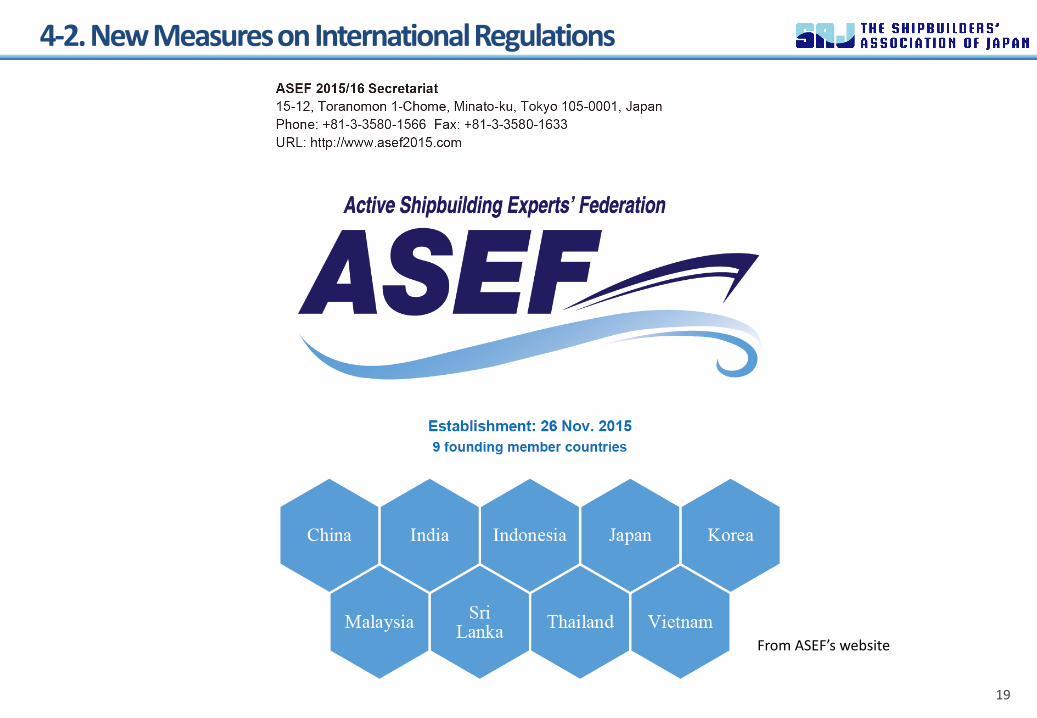
4-2. New Measures on International Regulations
19
From ASEF’s website

4-3. New Measures on International Regulations
20
From ASEF’s website
21
Thank you for your attention!
15-12, Toranomon 1-Chome, Minato-Ku, Tokyo, 105-0001, Japan TEL: +81-(0)3-3580-1563