marine & cargo practice p&i review 2019
TRANSCRIPT

P&I Review 2019MARINE & CARGO PRACTICE


Contents f Overview by Mark Cracknell ...........................................................................................1
f Insights by John Trew .....................................................................................................3
f P&I Club Profiles ............................................................................................................4
The American Club .........................................................................................................5
Britannia ........................................................................................................................6
Gard ..............................................................................................................................7
The Japan Club ...............................................................................................................8
The London Club ............................................................................................................9
North of England P&I Association Limited .....................................................................10
Shipowners ..................................................................................................................11
Skuld ...........................................................................................................................12
Standard ......................................................................................................................13
Steamship Mutual ........................................................................................................14
The Swedish Club .........................................................................................................15
The United Kingdom Club ....................................................................................................16
West of England ...........................................................................................................17
f Comparative Analysis of the Clubs ................................................................................18
f Maritime Autonomous Surface Ships Raise Questions ..................................................23
f Marsh JLT Specialty’s P&I Digital Services .....................................................................25
f About Marsh JLT Specialty’s Marine & Cargo Practice ....................................................28

1 • P&I Review 2019
MARK CRACKNELLHead of P&I
As Andrew Bardot’s tenure as the first International Group (IG) CEO, with a mandate beyond the mere coordination of meetings, comes to an end, the IG secretariat welcomes the arrival of new CEO Nick Shaw. Andrew skilfully guided the IG through a flurry of international convention and regulation, which culminated in the IMO Global Sulphur Cap 2020. Having helped the IG clubs support their members through a barrage of change, he has set the stage for a period of relative stability.
With very little in the way of new convention or regulation on the
horizon, Nick will have time to consider tasks that can transform
the organisation. One must surely be how to make the IG a
more effective decision-making body. Much has been said, and
written, about the value of the IG to the shipping industry and
to the vital interests of global trade of the mutual P&I system.
While we do not intend to repeat any of that here, we do offer
our support for the proposition. In our opinion, the areas where
the IG could be more effective fall into two main categories: the
tactical and the strategic.
In the first category we place issues such as the scope and
limits of cover ordinarily afforded by the P&I clubs. Some of the
deficiencies in club cover that trouble our clients seem to be
simply a failure to keep abreast of the pace of events.
Sulphur capsAn example is the potential for the imposition of fines for
exceeding sulphur caps for bunker fuel. There can, of course, be
a moral hazard when it comes to cover for fines. However, where
a fine arises as a result of differences between two recognized
authorities in the measurement of the sulphur content of fuel,
it seems egregious that there should be any question of cover
when a ship owner has loaded fuel — accepting in good faith
the representations of a first competent body in respect of that
sulphur content — but faces a fine when a subsequent authority
disputes the earlier findings.
Club directors’ time is valuable
Club managers could and should have discretion to make a
determination that the member has or has not done everything
reasonably possible to avoid such a penalty. If, in the opinion of
club managers, the member has acted in good faith and could
not reasonably have taken steps to avoid a fine, cover should
be afforded. This is a practical as well as a technical and moral
imperative. Such cases likely will be numerous in the future. It is
not the most effective use of club directors’ time to be asked to
deliberate on such matters.
Passenger coverAnother issue, with potentially greater financial consequences
for those concerned, is the limit on cover for liability toward
passengers. An ever-increasing number of new generation
modern cruise ships now have a requirement under the EU
Passenger Liability Regulations (PLR) to provide certification for a
sublimit in excess of the USD2 billion for passengers cover. Non-
compliance with PLR is not an option. The clubs insuring these
vessels under the current arrangements are only able to provide
the necessary certification (in excess of the USD2 billion) with the
support of additional reinsurance.
A mutual risk
The USD2 billion sublimit would have been more than adequate
to meet the PLR requirement of the largest passenger vessels
operating when it was first established; today it falls short. And
what seems to be a mutual P&I risk is being transferred from
the mutual pooling system to commercial insurers, among
whom there is fairly limited capacity for this exposure on the
terms required. As a result, those underwriters with the required
appetite are able to benefit from a seller’s market.
Success story
Whereas a decade or so ago the number of clubs that would
accept cruise business could be counted on the fingers of
one hand, that is no longer the case. Nearly every P&I club
either already writes cruise business or has expressed a strong
interest in doing so. This is because the passenger shipping,
and particularly cruise, is a “success story” of the shipping
industry and so a growth area for the clubs. At the same time, the
cruise operators have shown themselves to be committed and
responsible contributors to the mutual P&I system.
International Group - Change at the helm
Marsh • 2
The law of unintended consequences
Today, an unintended outcome of the original decision to place
a cap on passenger cover (at a level vastly in excess of any
regulatory requirement for it when the cap was introduced),
is that some of the cruise industry’s most successful operators
are now effectively being penalized by the P&I system as a
consequence of their growth. This results from a requirement
to pay for the very expensive “top up” reinsurance that enables
their clubs to issue PLR certification for some of their ships, which
seems contradictory to the fundamental principles of the mutual
(not for profit) P&I system.
Part of the system
If it is accepted that the cruise industry is part of the mutual P&I
system, as it very clearly is today, then it seems reasonable that
the P&I system should not discriminate against the industry; nor
should it needlessly operate counter to the industry’s needs.
There is an easy solution here, which is to remove the passenger
sublimit so that USD3 billion limit of cover for personal injury
claims applies howsoever those claims may arise. The clubs could
then provide PLR certification for all of today’s cruise fleet (and
what is envisaged for several years) without the need to engage
commercial reinsurance markets.
Easier said than done
Most of the club managers appear to support this change, at least
according to the conversations we have had. Most believe it’s
simply a fair solution to an unforeseen, but easily manageable,
structural deficiency in the current arrangements. Some are
also worried about the potential for damage to the reputation
and standing of the IG, in the very remote eventuality of a large
passenger claim where club cover could fall short of the PLR
compensation requirement.
The challenge is the IG decision-making process. Every club has
the same vote, and while the required two thirds of the majority
may be moving towards a consensus for this change, dissenters
have plenty of opportunity to establish roadblocks.
Fewer clubsOur 2018 P&I Market Review considered the number of P&I clubs,
focusing on the financial and competitive efficiencies that would
come from having fewer clubs. We made the case that there
should be no more than eight P&I clubs. We argued that, through
the better use of the substantial amounts of capital already
contributed by ship owners to their P&I clubs, efficiencies could
be achieved. In the simplest terms, the report discussed the
potential to increase the per-club retention in a way that would
allow the abolishment of the International Group Agreement
(IGA), bringing benefits all round.
Alternatively, if the remaining clubs chose to operate the mutual
P&I system exactly according to the current structure, an
estimated USD1 billion+ of surplus capital could be returned to
members; a happy choice for club members to make.
Eight is great
Either way, we expect the additional benefit of quicker, more
effective decision making.
Eight remaining clubs, if not actually completely homogenous,
would naturally have more common ground on most issues than
is currently the case as the opportunity for individual directors
to dominate small clubs would be reduced. Some would say
one size does not fit all. I say, why not, if a smaller number of
larger clubs level up to the highest current standard? Moreover,
assuming that in this brave new world the remaining eight clubs
are the most successful of the current crop of thirteen, market
intelligence indicates the necessary majority would be able to
move forward quickly and decisively on issues such as the limit of
cover available for passenger claims.
General increases?
A smaller group of better capitalised clubs would end the
discussion around a requirement to increase P&I rates. Even
with the current clubs, the idea that this is necessary seems
incorrect (except perhaps in a couple of cases at the lower end
of the tonnage scale). The supposed justification appears limited
to relative comparisons of capital strength, mostly made by the
clubs themselves about each other. In absolute terms there is not
much to report. The majority are quick to point to their AAA S&P
capital strength ratings, which are unlikely to be diminished by
holding P&I rates at their present level, or even reducing them.
Despite the reported and much bemoaned overall reduction in
free reserves and recorded combined ratios mostly worsening
during the 2019 P&I financial reporting season, capital adequacy
(as shown in Solvency II filings) once again improved for the clubs
as a whole.
Time for a change. Will anyone rise to the challenge?

About John Trew
With over 35 years, John started his career with Ellerman City Liners, working on one of their Mediterranean trades. In 1985,
he moved to Tindall Riley, managers of the Britannia P&I club. In 2018, he retired as Chairman of Tindall Riley before joining
Marsh JLT Specialty as a Special Advisor.
With deep expertise in the maritime industry, John was instrumental in developing new insurance policies for ship owners.
Most notably, he led the launch of the hull policy ‘Marianne’ with Allianz and the Small Ships Facility, Carina. In addition,
he wrote Britannia’s Guide to Oil Pollution Legislation. John is a qualified barrister.
JOHN TREWSpecial Advisor
In last year’s P&I Market Review, I wrote about the challenges that shipowners and charterers often face when trying to compare and evaluate the 13 clubs in the IG. Brokers, and the clubs themselves, all produce tables showing headline comparative figures: tonnage, premium, claims, net ratio and free reserves. That provides a lot of information, but is it the whole story?
And what do the clubs have to say about themselves? Each
club has a different way of presenting itself, but a review of their
marketing material shows that they all position themselves in
a similar way: strong finances, exceptional service, a first class
membership and a strong commitment to mutuality. Are they all
so very similar?
Given our relationship with all 13 clubs, Marsh JLT Specialty is
ideally positioned to dig deeper. Not only do we have the data
needed to assess their rating models and overall finances, but our
team has considerable experience of working with the clubs.
While it is tempting to rank clubs into a table, thereby identifying
the best performers, this approach is ultimately unhelpful. Many
shipowners are members of clubs that they feel are ‘right for
them’. Paying what they perceive to be a ‘fair deal’ and receiving
a proactive service from claims handlers they know and trust is
far more important to them than knowing where their club ranks
based on a standardised set of criteria. Their only real concern
may be the prospect of unbudgeted supplementary calls.
Furthermore, it has become customary for some brokers to
analyse the whole P&I market in their annual reports. This is not
helpful as it ignores the differences between the clubs and the
real choice available to shipowners. Despite their marketing
material, the clubs are not a cohesive, homogeneous group that
need to take ‘collective’ action. While some clubs might arguably
need to reconsider their rates, others do not. Likewise, the extent
to which clubs are over-capitalised needs to be assessed at an
individual club level, not in the aggregate.
In this context I offer a short overview of each club, providing
information on their recent performance, their client offering
and what challenges lie ahead. Looking at the profiles, you can
see how different they are; while some are flourishing, others
find themselves in choppier waters. Some are investing in new
technology, developing online digital platforms to provide
members with a variety of data relating to ports and areas where
their ships may be trading. Clubs without plans to develop these
tools may be left behind.
3 • P&I Review 2019

P&I Club Profiles
Marsh • 4

5 • P&I Review 2019
Highlights
Distribution of Tonnage Consolidated Income & Expenditure
Year ending 31 December (USD '000)
2017 2018 2019
GWP 104,183 98,673 96,977
RI Premiums (14,168) (24,194) (22,546)
Change in UPR, Unbilled Assessments & RPs
5,310 (284) (1,026)
Recovery from US Oil Spill Liability Trust Fund
4,264 0 0
NET CALLS 99,589 74,195 73,405
Net Incurred Claims (70,761) (36,302) (45,905)
Expenses (37,744) (40,300) (39,805)
UNDERWRITING RESULT (8,916) (2,407) (12,305)
Investment Income & Exchange 6,951 8,049 6,383
Unrealised Investment Income (Net of gains & losses)
(2,948) 525 (6,911)
Investment Return 8,574 (528)
Tax (79) 29 444
OVERALL RESULT (4,992) 14,770 (12,389)
Total Balance Available (Total Assets less RI recoveries)
280,836 271,886 256,949
Outstanding Net Claims Liabilities (Gross Claims less RI)
(171,706) (145,465) (143,006)
Free Reserves (Total Members Equity)
51,418 57,614 45,225
Total Tonnage (m) 16.5 16.6 20.7
NET LOSS RATIO 71.05% 48.93% 62.54%
COMBINED NET RATIO 108.95% 103.24% 116.76%
The American Club S&P Rating BBB- (STABLE)
-1%Net Premium
-22%Free Reserves
117%CNR
25%Total Tonnage
26%Net Claims
While the American Club benefits from an
alphabetical ordering, in terms of tonnage,
net premium, free reserves, and its S&P rating
it would not rank quite so high. It enjoys a loyal
following and its tonnage again grew at the 2019 renewal. Joe
Hughes, Chairman and CEO, has huge experience and is a strong
advocate for the club and its benefits.
The club has diversified in recent years with its fixed premium P&I
facility for smaller ships, Eagle Ocean, in which the club takes a
modest line.
The hull book has been running at a loss but, assuming a stable
claims environment, a hardening of rates should turn the book
into profit. The club’s reserves reduced last year as a result of
poor investment results, but the managers advise these have now
substantially recovered. The club has not produced an underwriting
surplus for the last five years and its vulnerability to the effects of the
investment markets may be a cause for concern going forward.
A club, perhaps, for the few rather than the many.
1%
Europe & Middle East
North America
Asia
Rest of World
Tankers
Bulk carriers
General cargo/containerpassenger/RoRo
Tugs/barges/small craft
Entered tonnage by area of management
Members' tonnage by vessel types
54%
24%
21%
9%
35%
40%
16%
John Trew says...

Marsh • 6
Highlights
Consolidated Income & ExpenditureDistribution of Tonnage
Year ending 20 February (USD '000)
2017 2018 2019
GWP 225,854 208,147 204,415
RI Premiums (64,748) (55,757) (61,683)
NET CALLS 161,106 152,390 142,732
Net Incurred Claims (130,268) (93,552) (119,599)
Expenses (25,719) (25,666) (28,649)
SURPLUS/(DEFICIT) 5,119 33,172 (5,516)
Investment Income & Exchange 32,122 48,626 (2,643)
Unrealised Investment Income (Net of gains & losses)
(3,406)
Tax (889) (1,183) (1,137)
SURPLUS/(DEFICIT) 32,946 80,615 (9,296)
Total Balance Available (Total Assets less RI recoveries)
1,176,564 1,174,559 1,123,046
Outstanding Net Claims Liabilities (Gross Claims less RI)
(775,651) (721,179) (714,454)
Free reserves excluding Boudicca
379,342 429,957 390,661
Boudica Adjustment (see Boud Adj below)
221,700 211,600 196,900
601,042 641,557 587,561
Total Tonnage (m) 115.4 125.9 130.9
NET LOSS RATIO - EXCLUDING BOUDICCA
80.86% 61.39% 83.79%
NET COMBINED RATIO - EXCLUDING BOUDICCA
96.82% 78.23% 103.86%
Britannia
1%
Asia
Europe
Scandinavia
Americas
Middle East
Australasia
Bulk Carriers
Tankers
Containers
General cargo
Other
Entered tonnage by area of management
Ship by type (% of total)
33.9%
2%0.4%
3.7%
15.5%
44.5%
29%
32%
5%
33%
S&P Rating A (STABLE)
-6%Net Premium
-8%Free Reserves
104%CNR
4%Total Tonnage
28%Net Claims
For decades, Britannia has been a byword of
strength and stability – it continues to stand out
from the crowd by virtue of its excellent finances.
The club has expanded and enhanced its regional
office network, and a shift of resources to the East is appropriate
given the profile of its membership. Opening an office in Greece was
a major move for a club that in the 1980s boasted only two Greek
members. Britannia’s reserves may be considered a strength or
weakness, according to your point of view. The club has not had an
unbudgeted supplementary call for over 40 years and it has given
back over USD85million by way of capital distributions since 2017.
That is, for them, a major selling point. It will be interesting to see
whether their decision to abandon general increases from the 2020
renewal starts a trend.
Britannia has spurned ‘diversity’ and never put so much as a small toe
into fixed P&I or marine and energy business. They will undoubtedly
look at the recent experiences of Standard and Skuld and feel justified
in their approach. Nonetheless, tonnage growth has consistently
eluded the club and it is unlikely that new and expanded offices will
significantly change it. In terms of owned tonnage, the club would
stand fifth in a league table, with Skuld fast catching up. In respect
of total tonnage, they would stand seventh. If their focus is not on
growth – which is a perfectly valid strategy – it may not matter.
John Trew says...

7 • P&I Review 2019
Highlights
Distribution of Tonnage Consolidated Income & Expenditure
1%
Asia
Rest of Europe
Norway
Greece
Germany
Americas
Other
Tanker
Bulk/OBO
Container
MOU
Gas Carriers
Other Dry Cargo
Car Carriers
O�shore vessels
Passenger & Cruise
By domicile of tonnage
By vessel type
26%
21%
16%
10%
9%
15%
6%
5%3%
16%
7%
27%
3%
32%
3%
Gard S&P Rating A+ (STABLE)
6%Net Premium
-7%Free Reserves
117%CNR
2%Total Tonnage
12%Net Claims
Year ending 20 February (USD '000)
2017 2018 2019
Gross earned premium 767,364 681,244 734,916
RI Premiums (150,181) (134,172) (153,708)
Change in UPR, Unbilled Assessments & RPs
1,395 1,659 2,084
NET CALLS 618,578 548,731 583,292
Net Claims (493,045) (479,232) (537,093)
Expenses (94,392) (89,540) (144,696)
SURPLUS/(DEFICIT) 31,141 (20,041) (98,497)
Investment Income & Exchange 8,920 36,254 37,855
Unrealised Investment Income 94,744 107,547 (47,045)
Tax (8,909) (8,918) 18,659
SURPLUS/(DEFICIT) 125,896 114,842 (89,028)
Other comprehensive (675) (1,148)
TOTAL COMPREHENSIVE INCOME/(LOSS)
114,167 (90,176)
Total Balance Available (Total Assets less ri)
2,750,391 2,612,144 2,586,158
Outstanding Net Claims Liabilities
(1,249,629) (1,199,205) (1,277,886)
Free Reserves 1,134,862 1,249,030 1,158,853
Total Tonnage (m) 306 308.3 314.5
NET LOSS RATIO 79.71% 87.33% 92.08%
COMBINED NET RATIO 94.97% 103.65% 116.89%
In many ways, Gard looks to be unstoppable.
When applied to active records, the Marsh JLT
Specialty Rating Engine regularly shows their
underwriting to be competitive and their reserving
to be realistic. While some of their competitors have attempted
to develop similar models, no one has successfully replicated it.
Therefore, it is perhaps not surprising that their tonnage (240m gt)
is so much greater than their nearest rival (UK club, 131m gt.
This year, however, Gard reported its first loss in 10 years (USD53m).
This was largely due to a failed IT project that required them to
write off USD40m of already capitalised costs – an amount almost
equivalent to the American club’s entire free reserves. Secondly,
despite an increase in written premium on the hull and energy book,
the year saw a loss of USD37m (against a profit of USD22m in the
previous year). This was driven by a sharp increase in claims, totalling
USD199m (USD77m previous year). One claim exceeded USD35
million, representing almost half the total increase in claims for the
year. Gard recognises that its premium rating in this sector needs to
be increased. Notwithstanding these developments, the club retains
an A+ (stable) S&P rating and will be reducing its estimated total call
(ETC) for the 10th year in a row.
John Trew says...

Marsh • 8
Highlights
Consolidated Income & ExpenditureDistribution of Tonnage
2%2%
Panama
Japan
Marshall Islands
Liberia
Singapore
Others
Bahamas
Korea
Hong Kong
Bulk Carriers
Tankers
Container Ships
Car Carriers
LPG, LNG Tankers
Entered tonnage by ships registry
Entered tonnage by type
55%
8%
1%
6%
5%
5%
2% 2%
17%
8%
6%
14%
14%
53%
Others
General cargo ships
Japan Club (POSITIVE)BBB+S&P Rating
-7%Net Premium
5%Free Reserves
99%CNR
3%Total Tonnage
4%Net Claims
Year ending 31 March (USD '000)
2017 2018 2019
GWP 209,115 201,515 189,836
RI Premiums (49,132) (50,681) (42,351)
Change in UPR, Unbilled Assessments & RPs
12,011 12,726 3,895
NET CALLS 171,994 163,560 151,380
Net Incurred Claims (127,432) (118,248) (123,140)
Expenses (25,441) (27,863) (26,854)
SURPLUS/(DEFICIT) 19,121 17,449 1,386
Investment Income & Exchange 4,942 (1,706) 20,962
Unrealised Investment Income 0
Other Special Gains 19
Other Special Losses (18) (5) (15)
Tax (6,713) (4,536) (6,279)
SURPLUS/(DEFICIT) AFTER TAX 17,332 11,202 16,073
Surplus balance after appropriation
11 11
Unappropriated surplus, ending balance
11,213 16,084
Total Balance Available (Total Asset, as ri netted off)
626,834 646,160 643,569
Net Outstanding Claims Liabilities
(293,292) (306,324) (306,148)
Free Reserves 208,423 226,524 237,876
Total Tonnage (m) 91.50 93.70 96.30
NET LOSS RATIO 74.09% 72.30% 81.34%
COMBINED NET RATIO 88.88% 89.33% 99.08%
JPIA has had a successful year in which claims
have reduced and free reserves have increased.
As a result, the club’s S&P rating has strengthened
slightly to BBB+ with a ‘positive’ outlook.
Service levels have reportedly improved over the last few years and
the London office has expanded. However, this is still predominantly
a club for Japanese owners and it would benefit from a more
international approach in order to reach a wider audience.
Many brokers do not report in much detail on JPIA, but as the
market in Japan evolves, there will be an increased focus on what
the club has to offer and how it compares to other IG clubs.
Although that will undoubtedly be a challenge for JPIA, it can also be
viewed as a considerable opportunity for both the club and its very
loyal membership.
John Trew says...

9 • P&I Review 2019
Highlights
Distribution of Tonnage Consolidated Income & Expenditure
Bulk Carriers
Tankers
Containers
Gas carriers
General cargo
Southern Europe
Asia
Northern Europe
Americas
Entered ship types
Regional spread of members
54%
17%
3% 3%
23%
12%
33%
52%
3%
4%Net Premium
-13%Free Reserves
140%CNR
7%Total Tonnage
24%Net Claims
Year ending 20 February (USD '000)
2017 20187 2019
GWP 104,002 102,258 104,896
RI Premiums (19,927) (20,817) (19,347)
Change in provision for UPR (1,365) (954) (1,560)
NET CALLS 82,710 80,487 83,989
Net Incurred Claims (69,472) (83,902) (104,019)
Expenses (11,542) (12,655) (13,644)
SURPLUS/(DEFICIT) 1,696 (16,070) (33,674)
Investment Income & Exchange 11,083 22,951 13,887
Unrealised Investment Income 14,778 (874) (5,711)
Tax (252) (225) (301)
SURPLUS/(DEFICIT) 27,305 5,782 (25,799)
Total Balance Available (Total Assets less RI)
409,333 433,755 409,355
Outstanding Net Claims Liabilites (206,284) (219,059) (223,945)
Free reserves 188,012 194,642 168,843
Total Tonnage (m) 54.1 56.1 60.0
NET LOSS RATIO 83.99% 104.24% 123.85%
COMBINED NET RATIO 97.95% 119.97% 140.09%
The London Club S&P Rating BBB (NEGATIVE)
The London club has not had a good year. Its
technical underwriting result has continued to
deteriorate due to increased claims and declining
premium. Its reserves have fallen by USD27m to
USD168m. On top of that, the club was downgraded by S&P to BBB-.
The managers imply in their statements that this can be attributed
to S&P’s new Insurers’ Rating Methodology. However, this new
methodology applied to all the clubs rated by S&P and two of them
(JPIA and Swedish) achieved an upgrade. The truth is that the
London club needs a few good years to get back on track.
Avoiding further erosion of its premium and capital base must be
priorities for the future.
John Trew says...

Marsh • 10
Highlights
Consolidated Income & ExpenditureDistribution of Tonnage
Asia Pacific
Greece
Other European
Scandinavia
Middle East
North America
UK
Bulk Carriers
Tankers
Containers
Others
Entered GT by Geographical Region
Entered GT by Ship Type
36%8%
6%3%
17%
19%
11%
10%
21%
40%
29%
-7%Net Premium
3%Free Reserves
105%CNR
6%Total Tonnage
-7%Net Claims
Year ending 20 February (USD '000)
2017 2018 2019
GWP 420,040 367,981 339,597
RI Premiums (92,096) (68,176) (58,043)
Net Change in provisions for Unearned Premiums
2,015 6,468 1,764
NET CALLS 329,959 306,273 283,318
Net Claims (246,013) (243,994) (227,138)
Expenses (75,698) (77,410) (71,411)
SURPLUS/(DEFICIT) 8,248 (15,131) (15,231)
Investment Income & Exchange 14,199 19,129 20,040
Unrealised Investment Income 16,130 9,851 17,590
Tax (1,621) (926) (469)
SURPLUS/(DEFICIT) 36,956 12,923 21,930
Exchange differences on translation of foreign operations
7,612 (5,547)
Net other comprehensive income not to be reclassified to profit or loss
(723) (3,755)
TOTAL COMPREHENSIVE INCOME FOR THE YEAR, NET OF TAX
19,812 12,628
Total Balance Available (Total Assets less RI)
1,220,747 1,223,052 1,209,061
Net outstanding claims liabilites (612,936) (643,412) (621,584)
Free reserves 430,775 450,462 463,037
Total Tonnage (m) 190.0 195.0 207.0
NET LOSS RATIO 74.56% 79.67% 80.17%
COMBINED NET RATIO 97.50% 104.94% 105.38%
S&P Rating A (STABLE)North of England
North continues to perform well. If it were to be
judged solely on its marketing, following a major
rebranding exercise, it would be the leader of
the pack. They have just launched a new digital
platform called GlobeView, which provides
members with port index information, sanctions updates, selected
weather reports, and maritime threats and incidents.
The club remains committed to diversification, largely through its
fixed premium subsidiary, Sunderland Marine, which contributed
USD11m to the club’s results. North has just announced that
Sunderland will be the vehicle for a new, small ships (up to 10,000 gt)
fixed premium P&I product. Certificates, Blue Cards, and guarantees
will be issued by North, thereby easing any regulatory issues.
North’s tonnage – both owned and chartered – has shown steady
year-over-year growth over the past 5 years. Call income has fallen
steadily over the last four years, and the underwriting deficit in
2018/19 of USD60.8m suggests a potential vulnerability should
claims increase further and investment results deteriorate. The club
produced an investment return (net of fees) of 2.45% across its
portfolio. This was a reasonable performance, but, as North explains:
“not one which is sufficient on its own to subsidise current rating
levels in the longer term.” The annual report and accounts suggest
that the managers feel a need to increase their premium base, so an
increase is to be expected at the next renewal
Paul Jennings, the current CEO at North, is also the chairman of the
International Group and has the unenviable job of juggling two ever
more demanding roles.
John Trew says...

11 • P&I Review 2019
Highlights
Distribution of Tonnage Consolidated Income & Expenditure
1.6%
Harbour
Barges
Passenger
O�shore
Fishing
Cargo
SE Asia & Far East
Europe
Central andSouth America
Middle East
North America
Australia, NZ andSouth Pacific
Africa
Total entered vessels by type
Entered Vessels by Region
28%7%
6%4%
14%
20%
9%
12%
3.9%4.6%
10.7%
10.4%
19.6%
49.2%
Yacht
Tanker
Year ending 31 December (USD '000)
2017 2018 2019
GWP 228,585 217,832 228,391
RI Premiums (27,365) (29,314) (29,644)
Change in UPR (167) (1,883) (3,750)
NET CALLS 201,053 186,635 194,997
Net Claims (149,087) (136,165) (151,038)
Expenses (49,164) (48,709) (52,156)
SURPLUS/(DEFICIT) 2,802 1,761 (8,197)
Investment Income & Exchange 11,726 47,442 (28,754)
Unrealised Investment Income (236)
Tax 135 (1,518) (714)
SURPLUS/(DEFICIT) 14,663 47,685 (37,901)
Total Balance Available (Total Assets)
719,655 776,696 759,025
Outstanding net claims liabilites (329,975) (342,723) (356,157)
Free reserves 294,041 341,726 303,825
Total Tonnage (m) 25.4 25.5 27.3
NET LOSS RATIO 74.15% 72.96% 77.46%
COMBINED NET RATIO 98.61% 99.06% 104.20%
4%Net Premium
-11%Free Reserves
104%CNR
7%Total Tonnage
11%Net Claims
Shipowners S&P Rating A (STABLE)
Shipowners (SOP) continues to flourish. It suffered
the heaviest investment losses of any club in the
2018/19 policy year (in percentage terms), but
seems to have largely clawed those back in the
first half of 2019. The fixed premium market that suddenly blossomed
around five or six years ago – both inside and outside the Group –
has to some extent settled down and SOP has done well to maintain –
and slightly increase – its market share.
Maintaining premium levels against market competitions has
probably been a struggle, and last year’s deficit, also due to increased
claims, was disappointing. However, a combined net ratio of 104% is
better than the results achieved by some of their larger peers.
It would be instructive to have a breakdown of how their tonnage
is split between mutual and fixed. This would enable members and
brokers to evaluate the performance of each sector of the membership.
John Trew says...

Marsh • 12
Highlights
Consolidated Income & ExpenditureDistribution of Tonnage
4%
Premiums distributed by region
Premiums distributed by vessel type
28%
7%
19%21%
10%
14% 13%
15% 12%
22%
Asia
Rest of Europe
Americas
Norway
Nordic countriesexcl. Norway
Germany
Greece
Bulk carriers
O�shore
Tanker
Gas/Chemical Tanker
General cargo
Others
Utilized
8%
Passenger
11%
7%
6%
Year ending 20 February (USD '000)
2017 2018 2019
GWP 403,235 412,739 401,621
RI Premiums (71,636) (57,363) (56,070)
NET CALLS 331,599 355,376 345,551
Net Claims (229,143) (251,580) (244,577)
Expenses (88,510) (92,244) (92,937)
SURPLUS/(DEFICIT) 13,946 11,552 8,037
Investment Income & Exchange 4,365 (2,485) 13,799
Unrealised Investment Income 33,966 48,630 (10,680)
Tax (1,712) (166) (458)
Distribution to members (9,580)
SURPLUS/(DEFICIT) 50,565 47,951 10,697
Total Balance Available (Total Assets, as RI netted off)
1,000,465 1,070,091 1,040,143
Outstanding claims liabilites (507,194) (527,741) (528,971)
Free reserves 394,075 442,026 452,723
Owned Tonnage (m) 85.00 90.00 89.00
NET LOSS RATIO 69.10% 70.79% 70.78%
COMBINED NET RATIO 95.79% 96.75% 97.67%
-3%Net Premium
2%Free Reserves
98%CNR
-1%Total Tonnage
-3%Net Claims
S&P Rating A (STABLE)Skuld
Skuld has built a loyal book of business and is
highly regarded for the quality of its ancillary
products. In July 2019 it ceased the Lloyd’s
operation of Skuld’s syndicate 1897. This does not
mean that Skuld has given up writing hull but, rather, that it will in
future underwrite all its hull and offshore energy business on Skuld’s
corporate paper.
Skuld’s model will therefore be similar going forward. Its current
total mutual P&I premium (excluding charterers fixed premium) is
estimated to account for just 45% of the club’s total premium income.
Skuld has always been transparent in the way its accounts are
presented and it is hoped that this will continue in the way that the
hull book is presented going forward.
John Trew says...

13 • P&I Review 2019
Highlights
Distribution of Tonnage Consolidated Income & Expenditure
1%
Greece
NordicRegion
Rest of Europe
Asia
Japan
Italy
Canada
Singapore
Switzerland
USA
Turkey
Rest of World
Germany
South Korea
Monaco
Tankers
Container andgeneral cargo
Dry bulk
O�shore
Passenger and ferry
Other
Country of management - owned tonnage
Ship type by owned tonnage
12%
10%
10%
9%
8%
12%
24%
30%
31%
7%
6%
4%
5%
5%
5%
5%
6%
4%4%
2%
Year ending 20 February (USD '000)
2017 2018 2019
GWP 338,800 334,300 386,400
RI Premiums (77,000) (80,800) (80,700)
NET CALLS 261,800 253,500 305,700
Net Claims (200,800) (232,300) (274,100)
Expenses (43,500) (45,700) (81,100)
SURPLUS/(DEFICIT) 17,500 (24,500) (49,500)
Investment Income & Exchange 19,200 36,400 23,600
Unrealised Investment Income 3,500 14,200 (12,000)
Tax 1,000 4,900 (7,400)
SURPLUS/(DEFICIT) 41,200 31,000 (45,300)
Total Balance Available (Total Assets less RI)
1,058,600 1,143,400 1,178,000
Outstanding net claims liabilites (554,200) (578,000) (618,800)
Free reserves 430,500 461,500 434,700
Total Tonnage (m) 150.0 159.0 155.0
NET LOSS RATIO 76.70% 91.64% 89.66%
COMBINED NET RATIO 93.32% 109.66% 116.19%
21%Net Premium
3%Free Reserves
116%CNR
-3%Total Tonnage
18%Net Claims
Standard S&P Rating A (STABLE)
Like Skuld, Standard waved goodbye to its Lloyd’s
Syndicate in 2019. The syndicate wrote marine
and energy business, predominantly, for Club
members. The chairman’s statement in Standard’s
2018/19 annual report and financial statements
contrasts this disappointing result with the absorption of the Strike
Club into the Standard Club with effect from 1 February 2019.
This resulted in over USD18m being added to the Club’s consolidated
funds and largely offset the negative impact of the Syndicate’s
closure. The Strike Club does not bring a large amount of premium
income, but it does increase the Standard Club’s diversity.
Standard Club also had a difficult claims year in 2018/19, with one
of the highest combined net ratios in the IG (119%). With owned P&I
premium falling over the last five years, this will put pressure on the
club to increase rates at the coming renewal.
The club’s reserves, however, remain strong, despite the impact felt
from closure of the Syndicate.
Standard’s arrangement with Tokio Marine & Fire has been
successful, but it remains to be seen whether the model remains valid
in the market. The new venture with Chinese insurer Ping An further
demonstrates an active growth strategy.
There has been some concern expressed about the re-privatisation of
its managers, Charles Taylor, and the involvement of a private equity
firm. However, we believe this should be a positive development
because it allows the managers to concentrate on their overall business
strategy, without having to focus too much on their share price.
John Trew says...

Marsh • 14
Highlights
Consolidated Income & ExpenditureDistribution of Tonnage
3%
Far East
Europe
North America
Middle East andIndian Subcontinent
Latin America
Bulk carrier
Tanker
Container
Cruise and ferry
General cargo
Others
Gross tonnage by area
Gross Tonnage by vessel type
40%
37%
16%
5%
6%
12%
23%
19%
37%
2%
Year ending 20 February (USD '000)
2017 2018 2019
GWP 305,642 295,318 306,661
RI Premiums (56,033) (52,089) (50,522)
NET CALLS 249,609 243,229 256,139
Net Claims (168,455) (241,369) (246,358)
Expenses (39,219) (40,570) (41,623)
SURPLUS/(DEFICIT) 41,935 (38,710) (31,842)
Investment Income & Exchange 14,310 27,234 12,852
Unrealised Investment Income 13,801 17,379 (6,312)
Tax (77) (225) (236)
Other income (1,464)
SURPLUS/(DEFICIT) 69,969 5,678 (27,002)
Total Balance Available (Total Assets less ri)
1,099,166 1,136,872 1,123,168
Outstanding claims liabilites (562,557) (589,661) (827,408)
Free reserves 510,290 515,968 467,049
Total Tonnage (m) 151.3 158.6 160.1
NET LOSS RATIO 67.49% 99.24% 96.18%
COMBINED NET RATIO 83.20% 115.92% 112.43%
5%Net Premium
-9%Free Reserves
112%CNR
1%Total Tonnage
2%Net Claims
S&P Rating A (STABLE)Steamship Mutual
Steamship Mutual is a large, diverse club with
a distinct style. They have produced successful
results in recent years, with no general increases
for five years and capital returns to members in
the last three years. In fact, like Britannia, they could be accused of
having been over-reserved, with a solvency capital ratio of 243% in
2018 (Britannia was 244%). This ratio has now reduced to 219%,
partly as a result of the policy of returning funds to members.
Steamship Mutual is the latest club to open an office in Japan.
They are currently strengthening their team and will provide yet more
choice for Japanese shipowners. They are realistic about the time
needed to establish a firm foothold, but confident that they have
something different to offer.
John Trew says...

15 • P&I Review 2019
Highlights
Distribution of Tonnage Consolidated Income & Expenditure
The Swedish Club
-5%Net Premium
-5%Free Reserves
103%CNR
-1%Total Tonnage
-12%Net Claims
S&P Rating A- (STABLE)
Container
Bulker
Tanker
Other
2%
54%
18%
26%
20%
39%
37%
4%
Asia
Southern Europe
North Europe
Middle East
Gross tonnage by area
Gross Tonnage by vessel type
Year ending 31 December (USD '000)
2017 2018 2019
GWP 163,181 151,020 143,265
RI Premiums (36,401) (35,475) (34,647)
Change in UPR, Unbilled Assessments & RPs
3,751 1,971 2,579
NET CALLS 130,531 117,516 111,197
Net Claims (102,961) (100,323) (88,720)
Change in other technical provisions and Refunds and P&I discounts
(1,209) (2,289)
Expenses (25,439) (24,831) (23,859)
SURPLUS/(DEFICIT) 2,131 (8,847) (3,671)
Investment Income & Exchange (2,116) 23,672 128
Unrealised Investment Income 3,532 3,985 (6,051)
Appropriations: change in safety reserve
(23,091) 7,181
Tax on result for the year (797) (1,095) 1,297
SURPLUS/(DEFICIT) 2,750 (5,376) (1,116)
Total Balance Available (Total Assets less RI)
441,110 456,272 468,218
Outstanding net claims liabilites (188,244) (184,513) (166,255)
Free reserves 194,115 213,472 203,838
Total Tonnage (m) 71 83 82
NET LOSS RATIO 78.88% 85.37% 79.79%
COMBINED NET RATIO 98.37% 107.53% 103.30%
The Swedish Club was upgraded by S&P
from BBB+ to A-(stable) – though they are
characteristically modest about the fact in their
annual report. The Swedish Club strikes a different
tone to most of the clubs in their report and accounts, focusing on
individual interviews to convey their corporate messages.
The marine and energy business is a core segment of the club’s
offering, and now accounts for nearly 40% of its business by gross
written premium. The Swedish Club has always seen itself as slightly
different from the rest, and that trait continues strongly under the
leadership of Lars Rhodin.
John Trew says...

Marsh • 16
Highlights
Consolidated Income & ExpenditureDistribution of Tonnage
Year ending 20 February (USD '000)
2017 2018 2019
Gross premium earned 376,170 361,793 322,398
RI Premiums (81,082) (65,119) (64,860)
NET CALLS 295,088 296,674 257,538
Net Claims (273,619) (225,700) (250,941)
Operating expenses (51,310) (42,751) (43,654)
Other income 83
SURPLUS/(DEFICIT) (29,841) 28,223 (36,974)
Investment Income & Exchange 44,274 43,870 5,529
Unrealised Investment Income
Tax (417) (207) (950)
SURPLUS/(DEFICIT) 14,016 71,886 (32,395)
Total Balance Available (Total Assets less ri)
1,301,470 1,485,060 1,364,162
Outstanding net claims liabilites (710,739) (831,128) (841,436)
Free reserves excl Hybrid 465,069 536,948 504,553
Free reserves Inc Hybrid 564,509 636,948 504,553
Total Tonnage (m) 239 239 244
NET LOSS RATIO 92.72% 76.08% 97.44%
COMBINED NET RATIO 110.11% 90.49% 114.36%
-13%Net Premium
-21%Free Reserves
114%CNR
2%Total Tonnage
11%Net Claims
S&P Rating A (STABLE)The United Kingdom Club
Europe, Middle Eastand Africa (EMEA)
Asia Pacific
Americas
Bulk carrier
Tankers
Gas
Container
Other
Cruise Ship
Regional breakdown of owned entries by premium
Trade type
54%36%
10%
13%
6%
28%
13%
35%
5%
The UK Club is entering a new era of leadership –
even as it celebrates its 150th anniversary – with
the appointment of Andrew Taylor as Chairman.
The UK Club had a difficult claims year in 2018/19,
the additional cost of which increased the combined ratio for the
financial year to 114%. However, the stand-out news was the
repayment of the hybrid capital in August 2018 and the maintenance,
nonetheless, of S&P’s A (stable) rating. This is a major step forward
and closes a difficult story for the club.
The UK Club has a significant chartered book and their overall
combined tonnage is now the second largest of any IG club.
They have stayed resolutely monoline in their business model,
at the same time as the management company, Thomas Miller,
has continued to grow and diversify.
John Trew says...

17 • P&I Review 2019
Highlights
Distribution of Tonnage Consolidated Income & Expenditure
1.1% 1.7%
Europe
Asia
Middle East/Africa
Americas
Bulk carriers
Tankers
Container vessels
General cargo
Ferries andpassenger liners
Specialist vesselsand misc
Entered tonnage by area of management
Entered tonnage by vessel type
39.7%
7.2%
48.0%
5.1%
18.4%
10.1%
30.3%
38.4%
3%Net Premium
-1%Free Reserves
114%CNR
11%Total Tonnage
0%Net Claims
West of England S&P Rating A- (STABLE)
Year ending 20 February (USD '000)
2017 2018 2019
GWP 221,849 213,797 219,726
RI Premiums (40,172) (37,496) (38,646)
NET CALLS 181,677 176,301 181,080
Net Claims (123,772) (169,143) (169,668)
Expenses (34,688) (35,392) (37,438)
SURPLUS/(DEFICIT) 23,217 (28,234) (26,026)
Investment Income & Exchange 20,082 21,227 28,601
Unrealised Investment Income (4,326) - -
Tax (1,998) (1,210) (3,251)
SURPLUS/(DEFICIT) 36,975 (8,217) (676)
Total Balance Available (Total Assets less RI)
732,539 769,659 754,186
Outstanding claims liabilites (396,489) (428,788) (408,795)
Free reserves 306,512 308,533 306,373
Total Tonnage (m) 110 120 133
NET LOSS RATIO 68.13% 95.94% 93.70%
COMBINED NET RATIO 87.22% 116.01% 114.37%
The West of England also has a relatively new
helmsman in Tom Bowsher, who has been in the
job for just two years following the retirement of
Peter Spendlove. The club appears to have put
on a considerable amount of chartered tonnage recently, taking its
overall tonnage (133m gt) to just over Britannia’s. However, their
net premium income has not risen dramatically and they suffered a
second bad claims year, with a CNR of 114% (116% in 2017/18).
The question for the West is whether its considerable growth over
the last five years (81m gt in 2014; 133m gt in 2019) has been
matched by sufficient premium growth – and whether the claims
deterioration can be put down to bad luck or something else. What
is incontestable is that their solvency ratio has grown from 211% in
2018 to 237% in 2019, well above the IG average.
Following its rebranding and new leadership strategy, the West will
certainly be one to watch.
John Trew says...

Comparative Analysis of the Clubs
Marsh • 18

19 • P&I Review 2019
Group Excess Reinsurance Rates US$ rate per GT (Full Cover)
TANKER (DIRTY) TANKER (CLEAN) DRY PASSENGER
2000 0.3953 0.1773 0.1453 0.2762
2001 0.3953 0.1773 0.1453 0.2762
2002 0.4859 0.2364 0.1984 0.3782
2003 0.6723 0.3268 0.2857 0.6841
2004 0.6399 0.3128 0.2752 0.7329
2005 0.6385 0.3041 0.2677 0.7476
2006 0.6799 0.3201 0.2851 0.8006
2007 0.6797 0.3187 0.2837 1.3714
2008 0.7300 0.3498 0.3196 1.4985
2009 0.8079 0.3667 0.3695 1.6026
2010 0.7554 0.3335 0.3867 1.5654
2011 0.7038 0.3055 0.3709 1.4780
2012 0.6515 0.2798 0.3561 1.3992
2013 0.7565 0.3245 0.4942 3.1493
2014 0.7963 0.3415 0.5203 3.7791
2015 0.7317 0.3138 0.4888 3.7791
2016 0.6567 0.2816 0.4537 3.5073
2017 0.5955 0.2675 0.4114 3.3319
2018 0.5845 0.2626 0.4038 3.2707
2019 0.5747 0.2582 0.3971 3.2161
USD
per
GT
0.0
0.5
1.0
1.5
2.0
2.5
3.0
3.5
4.0
PassengerDryTanker (Clean)Tanker (Dirty)
20192018201720162015201420132012201120102009200820072006200520042003200220012000

Marsh • 20
General Increase History %P&I CLUB 2008 2009 2010 2011 2012 2013 2014 2015 2016 2017 2018 2019
American 20.0 29.0 4.2 2.0 5.0 10.0 10.0 4.5 2.5 0.0 0.0 0.0
Britannia 23.9 12.5 5.0 5.0 5.0 16.51 2.51 2.5 2.5 0.0 0.0 0.0
Gard 10.0 15.0 0.0 0.0 5.0 5.0 5.0 2.5 2.5 0.0 0.0 0.0
Japan 20.0 21.2 12.5 10.0 3.0 5.0 7.5 3.0 3.0 0.0 0.0 0.0
London 17.5 15.0 5.0 5.0 5.0 12.5 10.0 6.0 5.0 0.0 0.0 0.0
North 17.5 17.5 5.0 3.0 5.0 15.0 7.5 4.8 2.5 0.0 0.0 0.0
Shipowners 10.0 10.0 5.0 0.0 0.0 5.0 5.0 0.02 0.02 0.02 0.0 0.02
Skuld 7.5 15.0 5.0 N/A N/A N/A N/A N/A N/A N/A N/A N/A
Standard 15.0 15.0 3.0 3.5 5.0 7.5 12.5 5.0 2.5 0.0 0.0 0.0
Steamship 15.0 17.5 5.0 0.0 5.0 7.5 10.0 0.0 0.0 0.0 0.0 0.0
Swedish 15.0 15.0 2.5 2.5 5.0 7.5 7.5 2.5 0.0 0.0 0.0 0.0
UK 17.5 12.5 5.0 5.0 3.0 7.5 10.0 6.5 2.5 0.0 0.0 0.0
West 15.0 19.2 5.0 5.0 5.0 7.5 7.5 2.5 0.0 0.0 0.0 5.0
GROUP AVERAGE3 15.7 16.5 4.8 3.4 4.3 8.9 7.9 3.3 1.9 0.0 0.0 0.4
1. But 10.49% after application of 2013 cash alleviation (Britannia members will start 2014 renewal from a rate with a built-in increase of an additional 4.82%). 2. Inclusive of XSRI adjustment3. Skuld is excluded from the average from 2011 onwards as GI abandoned
Supplementary Call History (P&I)
2013 2014 2015 2016 2017 2018 2019
Ori
gin
al
(%)
Cu
rren
t (%
)
Ori
gin
al
(%)
Cu
rren
t (%
)
Ori
gin
al
(%)
Cu
rren
t (%
)
Ori
gin
al
(%)
Cu
rren
t (%
)
Ori
gin
al
(%)
Cu
rren
t (%
)
Ori
gin
al
(%)
Cu
rren
t (%
)
Ori
gin
al
(%)
Cu
rren
t (%
)
American 0 0 0 0 0 0 0 0 0 0 0 0 0 0
Britannia 45 45 45 37.5 45 40 45 45 45 452 45 453 45 45
Gard (of AC) 25 15 25 15 25 15 25 0 25 0 25 12.5 0^ 0
Japan 40 40 40 20 40 30 40 40 40 40 40 40 40 40
London 0 0 0 0 0 0 0 0 0 0 0 0 0 0
North 0 0 0 0 0 0 0 -5 0 0 0 0 0 0
SOP 0 0 0 0 0 0 0 0 0 0 0 0 0 0
Skuld 0 0 0 0 0 -2.5 0 -2.5 0 0 0 04 0 0
Standard 0 0 0 0 0 0 0 -5 0 -5 0 0 0 0
SSM 0 0 0 0 0 -10 0 -10 0 0 0 05 0 0
Swedish 0 0 0 0 0 0 0 0 0 -3 0 -4 0 0
UK 0 0 0 -2.5 0 -3 0 0 0 0 0 0 0 0
West1 35 35 35 35 35 35 35 35 35 35 0 0 0 0
Forecasted Deferred/Additional CallGreen: Waiver of budgeted deferred call/return of premiumRed: Unbudgeted Supplementary Call
1. Calculated excluding the allocation to XSRI.
2. A capital distribution of USD20m as at 9 May 2017 and a further US$10m as at 17th October 2017 to be paid to Members with ships on risk has been approved by the board. This is instead of a reduction in the deferred call for the 2016 policy.
3. A capital distribution of USD20m as at 23rd May 2018 and a further US$10m as at 16th October 2018 to be paid to Members with ships on risk has been approved by the board.
A further Capital Distribution of USD15 million to mutual P&I Members with ships on risk at midnight (BST) on 15 October 2019
4. US$5m return based on the percentage of Individual member's five year statistical contribution.
5. 10% return of premium for P&I mutual entries in the 2018 policy year in respect of vessels whose entries are renewed for the 2019 policy year.
21 • P&I Review 2019
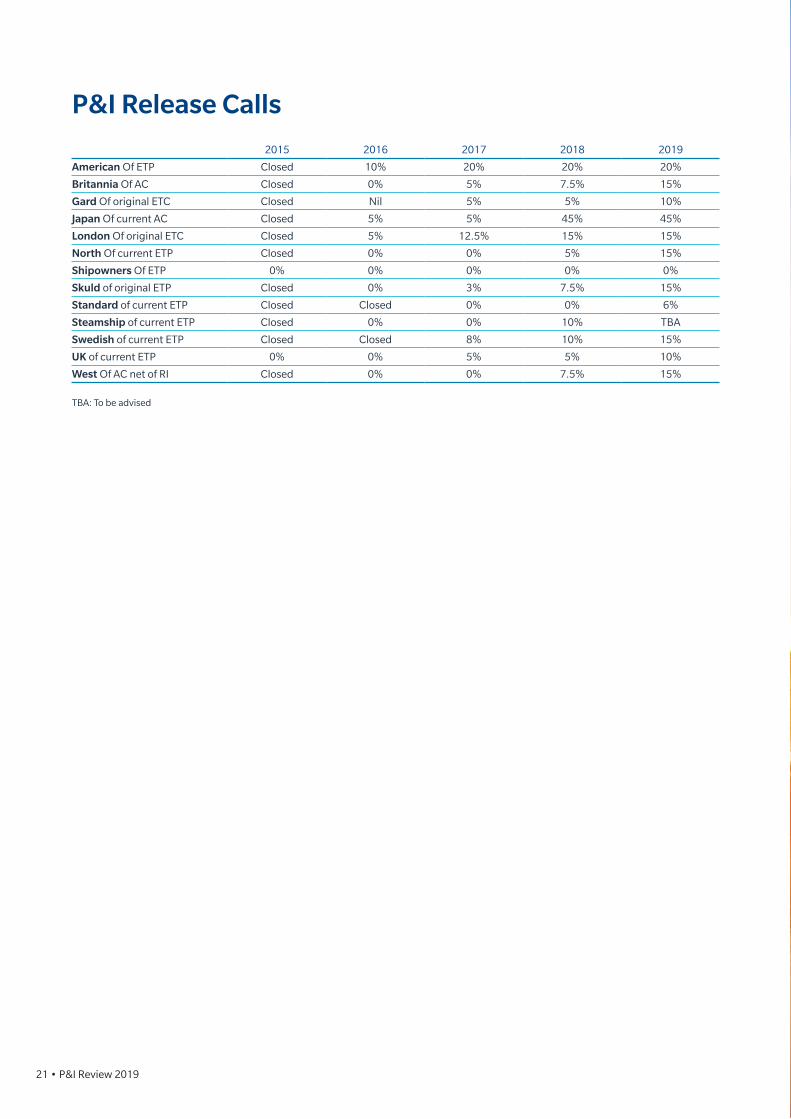
P&I Release Calls
2015 2016 2017 2018 2019
American Of ETP Closed 10% 20% 20% 20%
Britannia Of AC Closed 0% 5% 7.5% 15%
Gard Of original ETC Closed Nil 5% 5% 10%
Japan Of current AC Closed 5% 5% 45% 45%
London Of original ETC Closed 5% 12.5% 15% 15%
North Of current ETP Closed 0% 0% 5% 15%
Shipowners Of ETP 0% 0% 0% 0% 0%
Skuld of original ETP Closed 0% 3% 7.5% 15%
Standard of current ETP Closed Closed 0% 0% 6%
Steamship of current ETP Closed 0% 0% 10% TBA
Swedish of current ETP Closed Closed 8% 10% 15%
UK of current ETP 0% 0% 5% 5% 10%
West Of AC net of RI Closed 0% 0% 7.5% 15%
TBA: To be advised

Marsh • 22

23 • P&I Review 2019
When Maritime Professional Expect Autonomous AdoptionSOURCE: NAUTILUS FEDERATION 2018
Maritime Autonomous Surface Ships Raise Questions Are fully autonomous vessels a dream or a reality? What could they mean in terms of P&I cover and P&I rates? Or are they too far in the future to be a real concern?
79%
14%
3%
3%
16%
56%
19%
10%
Autonomous ships commonly deployed in
merchant shipping
First autonomous
ship expected
Next 10 year
11-20 years
More than 20 years
Never
Undertake the most basic search for “autonomous ships” in
Google and you’ll receive in excess of 5 million results. Narrow
it down by adding in the word ‘insurance’ and you will still be
wading through more than 1 million sources.
Regardless of your position on autonomous shipping, it is, like
blockchain, a hot topic within the maritime industry and one
that will in some way impact us. The question is whether we will
actually see fully autonomous vessels in the near future, and to
what degree will they affect the P&I industry.
With the YARA BIRKELAND due to launch as early as 2020 and
the Shipowners Club rolling out its Maritime Autonomous
Vessel Liability Insurance policy this year, it could be argued that
the Autonomous Age is dawning. One of the most optimistic
predictions on the subject comes from Rolls-Royce Marine –
sold in 2018 to Kongsberg Gruppen and a joint venture partner
in the YARA BIRKELAND – which suggests that that by 2030
autonomous ships will be a common sight on the oceans.
The diagram opposite from the Nautilus Institute, a federation
for marine professionals, suggests the commonplace use of
autonomous vessels in international shipping trade is about 20
years from now. And Søren Skou, chief executive of Maersk, has
been quoted as saying: ‘I don’t expect we will be allowed to sail
around with 400-metre-long container ships weighing 200,000
tonnes without any human beings on board’.
One major hurdle to rolling out autonomous vessels is a change
to the current regulatory framework that International Group
Clubs require their members to follow to ensure their vessels
remain in a seaworthy condition and remain within cover.
The process began in 2018 when the International Maritime
Organization (IMO) Maritime Safety Committee (MSC) started
a two-year scoping exercise to identify the extent to which they
may need to amend the regulatory framework to enable the safe
operation of automated vessels.
BEN DILLONP&I Specialist

Marsh • 24
The size of the problem becomes apparent when looking at a
few regulations that rely on the human element to ensure the
seaworthiness of a vessel:
• The ISM Code (in particular Article 6.2) requiring shipowners
to “ensure that each ship is manned with qualified, certificated
and medically fit seafarers”.
• SOLAS Chapter V Regulation 5, stating that all ships must be
“sufficiently and efficiently manned”.
• The United Nations Law of the Sea Convention, Article 94,
requiring that each ship must be in the charge of a master ‘who
possess appropriate qualifications, in particular in seamanship,
navigation, communications and marine engineering’.
Add to this the predicted pecuniary cost of a fully automated
vessel eroding a shipping company's profitability and the
prospect of fully automated, clean fuelled ships seems no more
than a pipe dream and their effect on the P&I industry nullified by
commercial considerations. This is, of course, before the various
and increasingly powerful health and safety executives have had
their say.
More likely appear to be vessels as identified by the survey
carried out by the Nautilus Federation in 2018, which highlighted
that 80% of the those maritime professionals surveyed thought
autonomous shipboard systems on board manned ships would
be the safest route to the implementation of autonomous
technology in shipping.
So where does this leave us? Although we now have a fixed
premium cover through the Shipowners Club for maritime
autonomous vessels, and projects such as the YARA BIRKELAND
continue to be trialled domestically, internationally traded fully
autonomous vessels appear to be decades in the future.
That said, if and when we see the roll out of fully autonomous
seagoing vessels and when international maritime regulations
are altered to fit their risk profile, cost savings should follow. With
manned ships, the 'human element' has largely been reported
as a major cause of all maritime casualties, and we are told that
people-related claims represent in excess of 30% of the overall
cost of P&I claims. Therefore, removing the human element
through the use of fully autonomous vessels should present
savings in terms of the cost of claims, not only in terms of crew
claims, but all claims involving human error. As a result, clubs
should be able to offer significantly reduced premium due to the
reduced risk.

25 • P&I Review 2019
Our P&I PortalThe Marsh JLT Specialty P&I Portal is a comprehensive, user friendly online platform which consolidates information about the
P&I market, including the advice and guidance published by the P&I clubs and is strengthened by our own P&I market knowledge
and insights.
The Marsh JLT Specialty P&I Portal is available online to subscribers, and provides:
• Broker’s Notes: Traditionally a hard copy booklet first produced by Marsh more than 20 years ago, the online version of Broker’s
Notes provides a varied range of technical information about the P&I market, including a brief overview of P&I and associated covers,
details of the International Conventions that govern ship owners’ liability and information about the P&I clubs themselves, such
general increase histories, claims abatement policies and current release calls.
• Club Comparisons: Includes a brief
summary of the key financial indicators
for each of the clubs and enables
subscribers to make comparisons
between P&I clubs based on a range of
financial data points.
• Risk Map: Accessible via a dashboard
the ever growing compendium of P&I
circulars displays the geographical
location of the topic under report with
an easy to use search tool by club, topic
or date, or keyword.

Marsh • 26
• Reports: Marsh Market Advisors,
providing specific thought leadership,
plus information on the most recent
International Group Pool claims, a
summary of the product offerings of
the fixed premium P&I insurers and
an index to the P&I club rule books.
• Limit of Liability Calculator:
Allows subscribers to calculate vessel
exposure according to International
Convention.

27 • P&I Review 2019
The Marsh JLT Specialty Rating EngineThe Marsh JLT Specialty Rating Engine, a proprietary P&I
premium modelling tool available via your normal Marsh contact,
helps clients to navigate what many see as a paradox of the
modern P&I market:
How is it possible that the collective surplus funds of the International Group clubs have risen exponentially in recent years while most club members are told that due to “costs” their business only breaks even (or worse)?
Our Rating Engine provides a forensic analysis of P&I club
underwriting costs and claims reserving, enabling us to restate
our clients’ P&I loss records through an objective methodology,
while calculating fair rates for our clients’ P&I entries.
The Marsh JLT Specialty Rating Engine:
• Is a unique P&I premium modelling tool that has been built
using insurance industry standard actuarial and analytical
techniques.
• Provides a reliable independent analysis of all components of
a P&I premium.
• Is customisable according to individual P&I club rating
structures.
• Enables true comparisons between the premiums charged
by different P&I clubs.
• Provides a technically sound challenge to P&I club pricing.
• Empowers negotiations.

Marsh • 28
Our Global Marine & Cargo Practice
We provide an international service, risk management, and placement proposition for international and regional ship owners from anywhere in the world. By combining international expertise with local delivery, we offer every client the personal and flexible service of an accessible team backed by the high level skills, broad experience and market intelligence.
720Marsh JLT Specialty has 720 marine colleagues
working on ports, shipping, shipyards,
suppliers, traders and cargo risks.
Our London P&I Team placed over 166 million
tonnes of fleet P&I cover globally in 2018.
26
18%
In 26 countries with local marine and
cargo expertise.
Our London P&I Team handled 18%
of the IG Tonnage.
USD4+bn
166m gt 11%
Handling over USD4+bn in premium
and accessing capacity in all the world’s
insurance markets.
Our London P&I Team handled 11%
of the IG Premium.
P&I SPECIALIS T S AT M ARSH JLT SPECIALT Y'S LONDON OFFICEJohn Trew, Nick Boyle, Samantha Brandon, Ben Dillon, Debbie Starling, Adam Starling, Ryan Witchard, Aanchal Kumar, Gillian Birrell, Mark Sumsion,
Matthew Cramp, Mark Thurston, Mark Cracknell. Not present: Alexander Millar and Hugh Hallett.

For further information, please contact your local Marsh office or visit our website at marsh.com
MARK CRACKNELLHead of P&I Global Marine & Cargo Practice +44 (0)20 7558 [email protected]
Services provided in the United Kingdom by Marsh JLT Specialty, a trading name of Marsh Ltd and JLT Specialty Limited (together “MMC”). Marsh Ltd is authorised and regulated by the
Financial Conduct Authority for General Insurance Distribution and Credit Broking (Firm Reference No. 307511). JLT Specialty Ltd is a Lloyd’s Broker, authorised and regulated by the
Financial Conduct Authority for General Insurance Distribution and Credit Broking (Firm Reference No. 310428).
It is not legal advice and is intended only to highlight general issues relating to its subject matter. Whilst every effort has been made to ensure the accuracy of the content of this document,
no MMC entity accepts any responsibility for any error, or omission or deficiency. The information contained within this document may not be reproduced. If you are interested in utilising
the services of MMC you may be required by/under your local regulatory regime to utilise the services of a local insurance intermediary in your territory to export insurance and (re)
insurance to us unless you have an exemption and should take advice in this regard.
Copyright © 2019 Marsh Ltd All rights reserved.
October 2019 280990