marin county employees’ retirement association
TRANSCRIPT

Marin County Employees’
Retirement Association
Actuarial Valuation Report
as of June 30, 2015
Produced by Cheiron
April 6, 2016

TABLE OF CONTENTS
Section Page
Letter of Transmittal ........................................................................................................................ i
Foreword ......................................................................................................................................... ii
Section I Executive Summary .................................................................................................1
Section II Assets .....................................................................................................................18
Section III Liabilities ...............................................................................................................25
Section IV Contributions..........................................................................................................28
Appendices
Appendix A Membership Information .......................................................................................38
Appendix B Statement of Current Actuarial Assumptions and Methods ..................................78
Appendix C Summary of Plan Provisions ..................................................................................86
Appendix D Glossary ...............................................................................................................100
Appendix E Member Contribution Rates .................................................................................102

i
April 6, 2016
Board of Retirement
Marin County Employees’ Retirement Association
1 McInnis Parkway, Suite 100
San Rafael, CA 94903-2764
Dear Members of the Board:
At your request, we have conducted an actuarial valuation of the Marin County Employees’
Retirement Association (MCERA, the Plan, the Fund) as of June 30, 2015. This report
contains information on the Plan’s assets and liabilities and discloses the employer and
employee contribution levels. Your attention is called to the Foreword in which we refer to
the general approach employed in the preparation of this report.
The purpose of this report is to present the results of the annual actuarial valuation of
MCERA. This report is for the use of MCERA and its auditors in preparing financial reports
in accordance with applicable law and accounting requirements. Any other user of this report
is not an intended user and is considered a third party.
Cheiron’s report was prepared for MCERA for the purposes described herein and for the use
by the plan auditor in completing an audit related to the matters herein. Other users of this
report are not intended users as defined in the Actuarial Standards of Practice, and Cheiron
assumes no duty or liability to such other users.
To the best of our knowledge, this report and its contents have been prepared in accordance
with generally recognized and accepted actuarial principles and practices which are
consistent with the Code of Professional Conduct and applicable Actuarial Standards of
Practice set out by the Actuarial Standards Board. Furthermore, as credentialed actuaries, we
meet the Qualification Standards of the American Academy of Actuaries to render the
opinion contained in this report. This report does not address any contractual or legal issues.
We are not attorneys and our firm does not provide any legal services or advice.
Sincerely,
Cheiron
Robert T. McCrory, FSA, EA, FCA, MAAA Graham A. Schmidt, ASA, EA, FCA, MAAA
Principal Consulting Actuary Consulting Actuary

MARIN COUNTY EMPLOYEES’ RETIREMENT ASSOCIATION
ACTUARIAL VALUATION REPORT AS OF JUNE 30, 2015
FOREWORD
ii
Cheiron has performed the actuarial valuation of the Marin County Employees’ Retirement
Association as of June 30, 2015. The valuation is organized as follows:
In Section I, the Executive Summary, we describe the purpose of an actuarial valuation,
summarize the key results found in this valuation, and disclose important trends;
The Main Body of the report presents details on the Plan’s
o Section II - Assets
o Section III - Liabilities
o Section IV- Contributions
In the Appendices, we conclude our report with detailed information describing plan
membership (Appendix A), actuarial assumptions and methods employed in the valuation
(Appendix B), a summary of pertinent plan provisions (Appendix C), a glossary of key
actuarial terms (Appendix D), and tables containing member contribution rates
(Appendix E)
Future results may differ significantly from the current results presented in this report due to such factors as the following: plan experience differing from that anticipated by the assumptions; changes in assumptions; and, changes in plan provisions or applicable law. In preparing our report, we relied on information supplied by the MCERA staff. This information
includes, but is not limited to, plan provisions, employee data, and financial information. We
performed an informal examination of the obvious characteristics of the data for reasonableness
and consistency in accordance with Actuarial Standard of Practice No. 23.

MARIN COUNTY EMPLOYEES’ RETIREMENT ASSOCIATION
ACTUARIAL VALUATION REPORT AS OF JUNE 30, 2015
SECTION I - EXECUTIVE SUMMARY
1
The primary purpose of the actuarial valuation and this report is to measure, describe, and
identify the following as of the valuation date:
The funded status of the Plan, Past and expected trends in the funding progress of the Plan, and Employer and employee contribution rates for Plan Year 2016-2017.
In the balance of this Executive Summary, we present (A) the basis upon which this year’s
valuation was completed, (B) the key findings of this valuation including a summary of all key
results, (C) an examination of the historical trends, and (D) the projected outlook for the Plan.
A. Valuation Basis
This valuation determines the employer contributions required for the employers’ fiscal years
beginning July 1, 2016. The employers are divided into three subgroups: the County of Marin
and related Special Districts, the Novato Fire Protection District, and the City of San Rafael.
The Plan’s funding policy is to collect contributions from the employers and employees equal to
the sum of:
The normal cost under the Entry Age Normal Cost Method,
Amortization of the Unfunded Actuarial Liability (UAL), and
The Plan’s expected administrative expenses.
Effective with the June 30, 2013 valuation, the UAL as of June 30, 2013 is amortized over a
closed 17-year period (15 years remaining as of June 30, 2015), except for the additional UAL
attributable to the outstanding unfunded actuarial loss from 2009, which is being amortized over
a separate closed period (currently 23 years).
Effective with the June 30, 2014 valuation, any new sources of UAL due to actuarial gains and
losses or method changes are amortized over a closed 24-year period, with a 5-year ramp up
period at the beginning of the period, a 4-year ramp down at the end of the period, and 15 years
of level payments as a percentage of payroll between the ramping periods. This new amortization
method for gains and losses is similar to a 20-year amortization period with level payments as a
percentage of payroll, in conjunction with traditional 5-year asset smoothing.
Assumption changes are amortized over a closed 22-year period, with a 3-year ramp up period,
2-year ramp down period, and 17 years of level payments as a percentage of payroll.
This valuation was prepared based on the plan provisions shown in Appendix C. There have
been no changes in assumptions or plan provisions since the prior valuation.
Actuarial experience studies are performed every three years. This valuation was performed on
the basis of the economic and demographic assumptions and methods that were determined in

MARIN COUNTY EMPLOYEES’ RETIREMENT ASSOCIATION
ACTUARIAL VALUATION REPORT AS OF JUNE 30, 2015
SECTION I - EXECUTIVE SUMMARY
2
the Actuarial Experience Study as of June 30, 2014. A summary of the assumptions and methods
used in the current valuation is shown in Appendix B.
This valuation does not include any consideration of external liabilities (or related debt service
payments) incurred by the Plan sponsors outside of MCERA, such as those related to pension
obligation bonds.

MARIN COUNTY EMPLOYEES’ RETIREMENT ASSOCIATION
ACTUARIAL VALUATION REPORT AS OF JUNE 30, 2015
SECTION I - EXECUTIVE SUMMARY
3
B. Key Findings of this Valuation
Below we present Tables I-1 and I-2 which summarize the key results of the valuation with
respect to assets and liabilities for the Plan as a whole, contributions by the main valuation
subgroups, and overall membership. The results are presented and compared for both the
current and prior plan year.
Worth noting in the key findings:
Overall experience was reasonably close to that anticipated by the Plan’s
assumptions, reflecting typical levels of fluctuations in assets and liabilities, and there
were no unexpected changes which significantly affected costs.
Asset returns were more than 2% lower than expected, for a market return of
approximately 5%, reducing the funded status of the Plan.
As a result of lower than expected asset returns, the Plan’s funded ratio, the ratio of
market assets over actuarial liability, decreased from 84.3% last year to 83.7% as of
June 30, 2015.
However, the overall contribution rate for MCERA as a whole still declined slightly,
as a result of the phase-in of prior years’ actuarial gains.
Table I-1
Marin County Employees' Retirement Association
Summary of Key Valuation Results
(in millions)
Valuation Date June 30, 2014 June 30, 2015
Actuarial Liability 2,362.8$ 2,469.1$
Market Value of Valuation Assets 1,992.1 2,066.2
Unfunded Actuarial Liability 370.6$ 402.8$
Funded Ratio 84.3% 83.7%
Net Employer Contribution Rate
County of Marin 26.86% 26.50%
Novato Fire Protection District 50.90% 48.69%
City of San Rafael 60.67% 60.96%
Total MCERA 32.63% 32.22%

MARIN COUNTY EMPLOYEES’ RETIREMENT ASSOCIATION
ACTUARIAL VALUATION REPORT AS OF JUNE 30, 2015
SECTION I - EXECUTIVE SUMMARY
4
Item June 30, 2014 June 30, 2015 % Change
Actives 2,533 2,609 3.0%
Current Inactives 638 653 2.4%
Retired Members 2,868 2,939 2.5%
Total Members 6,039 6,201 2.7%
Ratio of Retired Members to Active Members 113.2% 112.6%
Active Member Payroll (FYE 2014/2015) 222,930,923$ 231,589,074$ 3.9%
Average Pay per Active 88,011$ 88,765$ 0.9%
Table I-2
Membership Total
The key results of the June 30, 2015 actuarial valuation are as follows:
The actuarially determined employer contribution rate decreased for the County from
26.86% to 26.50% of payroll, and Novato from 50.90% to 48.69%. The actuarially
determined employer contribution rate for San Rafael slightly increased from 60.67% to
60.96%. Although the Plan experienced overall actuarial losses on assets and liabilities
during the year, these were for the most part offset by cost decreases resulting from the
phase-in of prior gains, and higher than expected payroll growth due to expansion in the
active workforce.
As described above, the Plan’s funded ratio, the ratio of assets over actuarial liability,
decreased from 84.3% last year to 83.7% as of June 30, 2015.
The Unfunded Actuarial Liability (UAL) is the excess of the Plan’s actuarial liability
over the Market Value of Assets. The Plan experienced an increase in the UAL from
$370.6 to $402.8 million. This increase in UAL was primarily due to lower than expected
investment returns.
During the year ending June 30, 2015, the return on Plan assets was 4.99% on a market
value basis net of investment expenses, as compared to the 7.25% assumption. Our
calculation of this rate of return assumes that external cash-flows (i.e., benefit payments,
contributions, and administrative expenses) all occur on average mid-year. The use of this
simplifying assumption may result in a return that is slightly different from that provided
by the investment consultant.

MARIN COUNTY EMPLOYEES’ RETIREMENT ASSOCIATION
ACTUARIAL VALUATION REPORT AS OF JUNE 30, 2015
SECTION I - EXECUTIVE SUMMARY
5
Overall Plan membership and the number of active numbers increased compared to last
year. There were 265 new hires and rehires during 2014-2015 and the total active
population increased from 2,533 to 2,609. The number of members in pay status and
deferred status increased from 3,506 to 3,592. Total projected payroll increased from
$222,930,923 to $231,589,074.
Assets and Liabilities
Table I-3 below presents the assets, liabilities, Unfunded Actuarial Liability, and funding
ratios as of June 30, 2015 for each of the three main subgroups. For this Table, we have
shown the results using just the Market Value of Assets, since as of the June 30, 2014
valuation, MCERA no longer uses a smoothed asset value to determine the contribution rates
and funded status.
Item County Novato San Rafael
Actuarial Liability
Actives 616.6$ 54.1$ 133.7$
Current Inactives 77.2 2.1 20.5
Retired Members 1,097.9 109.6 357.3
Total Actuarial Liability 1,791.7$ 165.8$ 511.5$
Market Value Assets 1,548.1$ 147.5$ 370.7$
Unfunded Actuarial Liability 243.6$ 18.4$ 140.8$
Funded Ratio - Market Value 86.4% 88.9% 72.5%
Inactive-Only Funded Ratio 65.6% 67.4% 73.9%
Table I-3
Assets & Liabilities
(in millions)
The Inactive-Only Funded Ratio shown in Table I-3 is intended to present a point of
comparison. For example, a funded ratio of 65.6% or more is required just to fund the
liabilities of the inactive County members: those currently retired, disabled, terminated with
vested benefits, and their beneficiaries. We note that the funded ratio for San Rafael has
fallen slightly below the Inactive-Only Funded Ratio for the current valuation.

MARIN COUNTY EMPLOYEES’ RETIREMENT ASSOCIATION
ACTUARIAL VALUATION REPORT AS OF JUNE 30, 2015
SECTION I - EXECUTIVE SUMMARY
6
Changes in Employer Contributions
Table I-4 below summarizes the impact of actuarial experience and other changes on the
employer contribution rate.
Item Total County Novato San Rafael
FYE 2016 Net Employer Contribution Rate 32.63% 26.86% 50.90% 60.67%
Expected change in amortization from prior changes ( 0.59%) ( 0.57%) ( 2.28%) ( 0.29%)
Change due to asset loss 0.31% 0.29% 0.58% 0.39%
Change due to demographic (gains)/losses 0.09% 0.13% 0.16% 0.01%
Change due to salary gains ( 0.07%) ( 0.07%) 0.06% ( 0.13%)
Change due to effect of payroll on amortization ( 0.15%) ( 0.14%) ( 0.73%) 0.31%
Total change from current year's changes 0.18% 0.21% 0.07% 0.58%
FYE 2017 Net Employer Contribution Rate 32.22% 26.50% 48.69% 60.96%
Table I-4
Employer Contribution Reconciliation
A review of the changes in the employer contribution rate from the prior valuation reveals that
Plan experience during the year – including demographic and salary changes, as well as asset
experience – resulted in a net increase in the overall employer contribution rate of 0.18% of pay
(the total of the last four rows in the table above) before changes from prior years are taken into
account:
Asset experience produced an investment loss.
The 5% return, compared to the 7.25% assumption, resulted in a loss which increased the
contribution rate by 0.31% of pay in the current year. The amortization payment for this
year’s investment losses will continue to be phased-in over the next four years, resulting
in similar increases in the employer contribution rates in those years.
Demographic experience was close to expected for all three groups.
The demographic experience of the Plan – rates of retirement, death, disability, and
termination – was close to that predicted by the actuarial assumptions in aggregate. There
was a small increase in contribution rate for the County (0.13%), Novato (0.15%), and
San Rafael (0.01%) due to demographics, primarily due to higher than expected
post-retirement COLAs. As with the investment losses, these losses will continue to be
phased-in over the next four years.

MARIN COUNTY EMPLOYEES’ RETIREMENT ASSOCIATION
ACTUARIAL VALUATION REPORT AS OF JUNE 30, 2015
SECTION I - EXECUTIVE SUMMARY
7
Changes in salaries and payroll reduced the contribution rates.
Salary increases for returning members were lower than expected for San Rafael, which
reduced the contribution rate by 0.13% of pay. Salary increases for returning members
were higher than expected for Novato, which increased the contribution rate by 0.06% of
pay.
Longer service County employees had a lower increase in salary than expected while
returning new hires had a higher increase; the overall payroll for returning County
employees increased more than expected. The liability is more sensitive to salary changes
in older employees, because they are closer to retirement and have larger benefits. As a
result salary gains from older employees were larger than salary losses from younger
employees, and the County contribution rate decreased by 0.07% of pay.
However, the higher than expected overall payroll growth for County and Novato meant
that the UAL must be amortized over a larger than expected payroll base, which
decreased the contribution rate by 0.14% and 0.73%, respectively. Conversely, the lower
than anticipated overall payroll for San Rafael increased the contribution rate by 0.31%.
The net impact of salaries and payroll was a reduction in the contribution rate of 0.21%
for County and 0.67% for Novato, and an increase in the contribution rate of 0.18% for
San Rafael.
In addition to gains and losses from the Plan experience during the year, there was an expected
change in amortization due to the phase-in of prior UAL gains. This reduced the contribution rate
by 0.57%, 2.28% and 0.29% for County, Novato, and San Rafael, respectively. A full description
of the prior year changes can be seen in Table IV-2 of this report.

MARIN COUNTY EMPLOYEES’ RETIREMENT ASSOCIATION
ACTUARIAL VALUATION REPORT AS OF JUNE 30, 2015
SECTION I - EXECUTIVE SUMMARY
8
Changes in UAL
The Unfunded Actuarial Liability (UAL) for MCERA increased by $32.2 million, from $370.6
million to $402.8 million. Table I-5 below presents the specific components of the change in the
UAL.
Experience Total County Novato San Rafael
1. Unfunded actuarial liability, 6/30/2014 370.6$ 217.8$ 16.7$ 136.2$
2. Expected change in unfunded actuarial liability (15.2) (10.4) (1.2) (3.6)
3. Unfunded change due to unexpected contributions (4.6) (4.6) (0.5) 0.4
4. Unfunded increase due to investment loss 44.8 33.5 3.2 8.0
5. Unfunded change due to demographic (gains) / losses 17.9 15.5 (0.2) 2.5
6. Unfunded change due to salary (gains) / losses (10.7) (8.2) 0.3 (2.8)
7. Total change in unfunded actuarial liability 32.2$ 25.8$ 1.7$ 4.6$
8. Unfunded actuarial liability, 6/30/2015 402.8$ 243.6$ 18.4$ 140.8$
Table I-5
Change in Unfunded Actuarial Liability
(in millions)
The return on the market assets used to compute the UAL and the employer contribution rates
was 4.99% during the 2014-15 plan year. We see in Table I-5 that the investment returns lower
than the assumed rate of 7.25% increased the UAL by $44.8 million. This was in addition to
liability experience (rows 5 and 6 above) - primarily from higher than expected salaries and
COLAs - that increased the UAL by $7.2 million. The overall dollar amount of contributions
were slightly higher than expected, based on differences in actual versus projected payroll and
the one year delay in the implementation of contribution rates, which reduced the UAL by $4.6
million (row 3).
All of the above combined with the expected UAL reduction ($15.2 million) produced an overall
increase of $32.2 million in the UAL last year.

MARIN COUNTY EMPLOYEES’ RETIREMENT ASSOCIATION
ACTUARIAL VALUATION REPORT AS OF JUNE 30, 2015
SECTION I - EXECUTIVE SUMMARY
9
Plan Risk
One of the most important measures of a plan’s risk is the ratio of plan assets to payroll. Table
I-6 below shows the ratios of assets to active member payroll for each of the three main
subgroups within MCERA.
County Novato San Rafael
Active Member Payroll 190,078,368 9,059,897 32,450,809
Assets (Market Value) 1,548,074,101 147,452,561 370,720,882
Ratio of Assets to Payroll 8.14 16.28 11.42
Ratio with 100% Funding 9.43 18.30 15.76
Table I-6
Asset to Payroll Ratio as of June 30, 2015
This ratio indicates the sensitivity of the Plan to the returns earned on assets. We note in the table
that assets are currently over 8 times covered payroll for the County; the ratio is over 11 for San
Rafael, and over 16 for Novato. As funding improves and the Plan reaches 100% funding, the
ratio of asset to payroll will increase: to over 9 times payroll for the County, almost 16 for San
Rafael, and over 18 for Novato.
To appreciate the impact of the ratio of assets to payroll on the contribution rate, consider the
situation for a new plan with almost no assets. Even if the assets suffer a bad year of investment
returns, the impact on the plan cost is nil, because the assets are so small.
On the other hand, consider the situation for the County. Suppose MCERA’s assets lose 10% of
their value in a year. Since they were assumed to earn 7.25%, there is an actuarial loss of 17.25%
of plan assets. Based on the current ratio of asset to payroll (814%) for the County, that means
the loss in assets is about 140% of active County payroll (814% of the 17.25% loss).
There is only one source of funding to make up for this loss: contributions. Consequently,
barring future offsetting investment gains, the County employers would have to make up the
asset loss in future contributions. In this example of a one year loss of 10%, this shortfall will
eventually require an additional amortization payment in the vicinity of 9.0% of payroll if
amortized over the 24-year period adopted under the new funding policy.
As the plan matures and becomes better funded, the ratio of assets to payroll will increase. When
assets are 943% of pay for the County, the 10% loss discussed above will translate to a loss of
163% of payroll, which when amortized over the 24-year period adopted under the new funding
policy, will increase the employer contribution rate by 10.5% of member pay on average.
Therefore, the plan is likely to become more sensitive to market variation in the future than it is
today.

MARIN COUNTY EMPLOYEES’ RETIREMENT ASSOCIATION
ACTUARIAL VALUATION REPORT AS OF JUNE 30, 2015
SECTION I - EXECUTIVE SUMMARY
10
The expected contribution volatility is higher for San Rafael and Novato, due to their higher
relative number of Safety members, who receive higher benefits relative to their payroll. A 10%
loss for San Rafael would currently translate to a loss of 197% of pay, which would require an
average of a 12.7% amortization payment. The same loss for Novato would translate to a loss of
281% of pay, requiring an 18.1% of pay average payment. If the Plan were fully funded, these
losses would results in amortization payments of 17.6% and 20.4% for San Rafael and Novato,
respectively.

MARIN COUNTY EMPLOYEES’ RETIREMENT ASSOCIATION
ACTUARIAL VALUATION REPORT AS OF JUNE 30, 2015
SECTION I - EXECUTIVE SUMMARY
11
C. Historical Trends
Despite the fact that for most retirement plans the greatest attention is given to the current
valuation results and in particular the size of the current Unfunded Actuarial Liability and the
employer contribution, it is important to remember that each valuation is merely a snapshot in
the long-term progress of a pension fund. It is more important to judge a current year’s valuation
result relative to historical trends, as well as trends expected into the future.
Assets and Liabilities
The chart below compares the Market Value of Assets (MVA) and Actuarial Value of Assets
(AVA) to the Actuarial Liabilities for the overall MCERA Plan. The percentage shown in the
table below the graph is the ratio of the Actuarial Value of Assets to the Actuarial Liability (the
funded ratio). The funded ratio is 83.7% as of June 30, 2015, and is slightly lower than the
84.0% funded ratio in 2008.
Valuation Year 2008 2009 2010 2011 2012 2013 2014* 2015
Funded Ratio 84.0% 72.1% 70.9% 72.1% 71.3% 75.1% 84.3% 83.7%
UAL (Billions) 0.28$ 0.52$ 0.56$ 0.55$ 0.59$ 0.54$ 0.37$ 0.40$
* Beginning in 2014, there is no smoothing of the asset value, thus AVA = MVA.
$0.0
$0.5
$1.0
$1.5
$2.0
$2.5
$3.0
2008 2009 2010 2011 2012 2013 2014 2015
Bil
lio
ns
Billions
Chart I-1: Assets and Liabilities
Actuarial Liability Assets-Smoothed Assets at Market Value

MARIN COUNTY EMPLOYEES’ RETIREMENT ASSOCIATION
ACTUARIAL VALUATION REPORT AS OF JUNE 30, 2015
SECTION I - EXECUTIVE SUMMARY
12
Contribution Trends
In the chart below, we present the historical trends for the MCERA contribution rates. The
employer contribution rates rose steadily from 2008 through 2013, as the investment losses from
2008-2009 were recognized in the smoothed value of assets. The average employee contribution
rates have stayed relatively stable, increasing slightly as the Plan’s economic and mortality
assumptions have changed.
0%
10%
20%
30%
40%
50%
60%
70%
2008 2009 2010 2011 2012 2013 2014 2015
Co
ntr
ibu
tio
ns
as
% o
f P
ay
roll
Valuation Year
Chart I-2: Marin County Employees’ Retirement Association
County Employer Rate County Employee Rate Novato Employer Rate
Novato Employee Rate San Rafael Empoyer Rate San Rafael Employee Rate
MARIN COUNTY EMPLOYEES’ RETIREMENT ASSOCIATION
ACTUARIAL VALUATION REPORT AS OF JUNE 30, 2015
SECTION I - EXECUTIVE SUMMARY
13
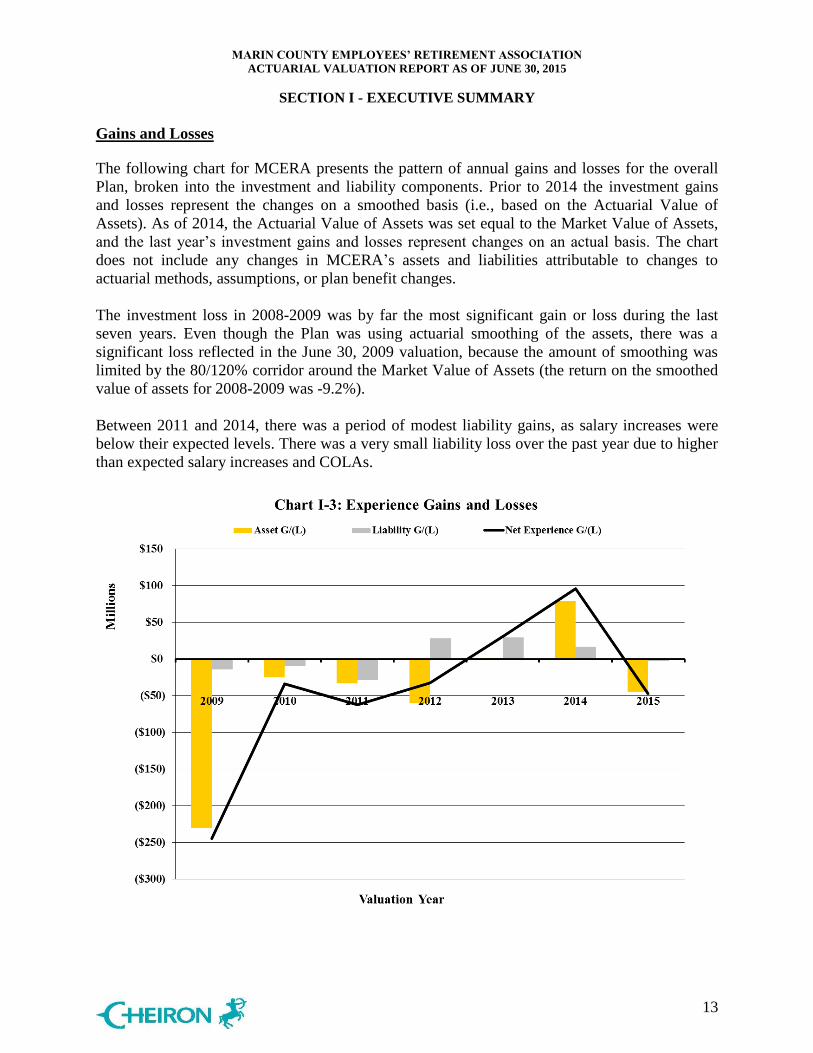
Gains and Losses The following chart for MCERA presents the pattern of annual gains and losses for the overall
Plan, broken into the investment and liability components. Prior to 2014 the investment gains
and losses represent the changes on a smoothed basis (i.e., based on the Actuarial Value of
Assets). As of 2014, the Actuarial Value of Assets was set equal to the Market Value of Assets,
and the last year’s investment gains and losses represent changes on an actual basis. The chart
does not include any changes in MCERA’s assets and liabilities attributable to changes to
actuarial methods, assumptions, or plan benefit changes.
The investment loss in 2008-2009 was by far the most significant gain or loss during the last
seven years. Even though the Plan was using actuarial smoothing of the assets, there was a
significant loss reflected in the June 30, 2009 valuation, because the amount of smoothing was
limited by the 80/120% corridor around the Market Value of Assets (the return on the smoothed
value of assets for 2008-2009 was -9.2%).
Between 2011 and 2014, there was a period of modest liability gains, as salary increases were
below their expected levels. There was a very small liability loss over the past year due to higher
than expected salary increases and COLAs.
MARIN COUNTY EMPLOYEES’ RETIREMENT ASSOCIATION
ACTUARIAL VALUATION REPORT AS OF JUNE 30, 2015
SECTION I - EXECUTIVE SUMMARY
14
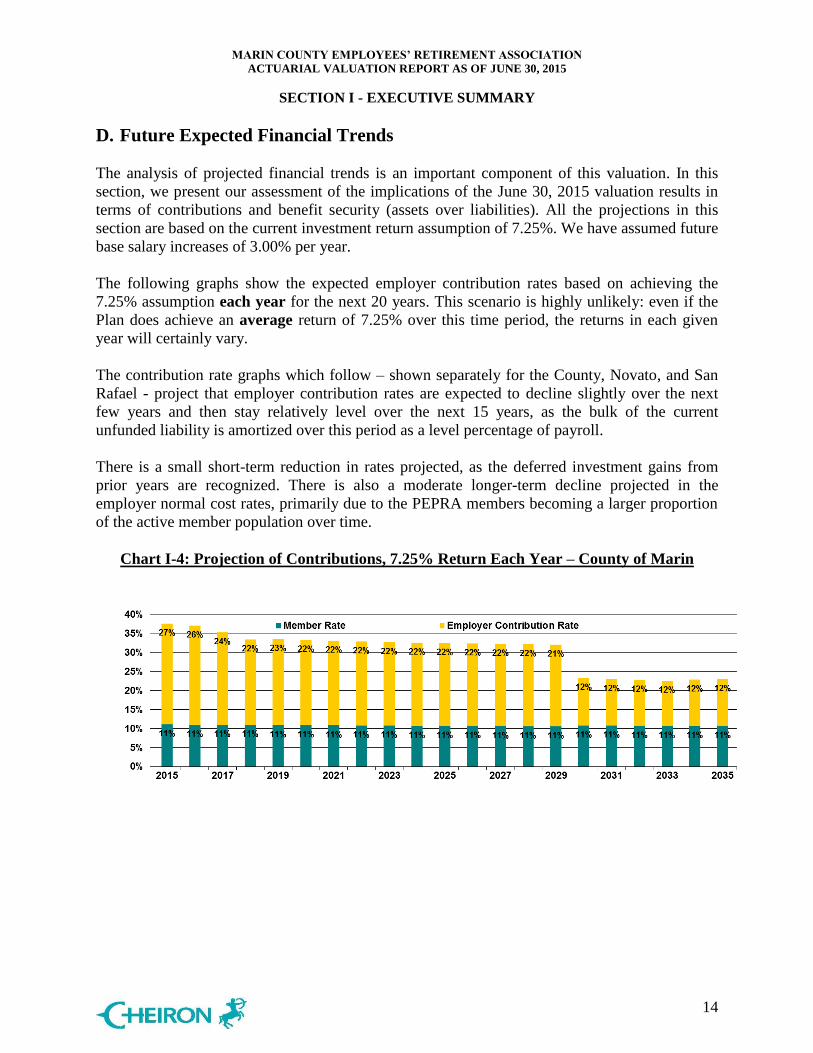
D. Future Expected Financial Trends
The analysis of projected financial trends is an important component of this valuation. In this
section, we present our assessment of the implications of the June 30, 2015 valuation results in
terms of contributions and benefit security (assets over liabilities). All the projections in this
section are based on the current investment return assumption of 7.25%. We have assumed future
base salary increases of 3.00% per year.
The following graphs show the expected employer contribution rates based on achieving the
7.25% assumption each year for the next 20 years. This scenario is highly unlikely: even if the
Plan does achieve an average return of 7.25% over this time period, the returns in each given
year will certainly vary.
The contribution rate graphs which follow – shown separately for the County, Novato, and San
Rafael - project that employer contribution rates are expected to decline slightly over the next
few years and then stay relatively level over the next 15 years, as the bulk of the current
unfunded liability is amortized over this period as a level percentage of payroll.
There is a small short-term reduction in rates projected, as the deferred investment gains from
prior years are recognized. There is also a moderate longer-term decline projected in the
employer normal cost rates, primarily due to the PEPRA members becoming a larger proportion
of the active member population over time.
Chart I-4: Projection of Contributions, 7.25% Return Each Year – County of Marin

MARIN COUNTY EMPLOYEES’ RETIREMENT ASSOCIATION
ACTUARIAL VALUATION REPORT AS OF JUNE 30, 2015
SECTION I - EXECUTIVE SUMMARY
15
Chart I-5: Projection of Contributions, 7.25% Return Each Year – Novato FPD
Chart I-6: Projection of Contributions, 7.25% Return Each Year – City of San Rafael
MARIN COUNTY EMPLOYEES’ RETIREMENT ASSOCIATION
ACTUARIAL VALUATION REPORT AS OF JUNE 30, 2015
SECTION I - EXECUTIVE SUMMARY
16
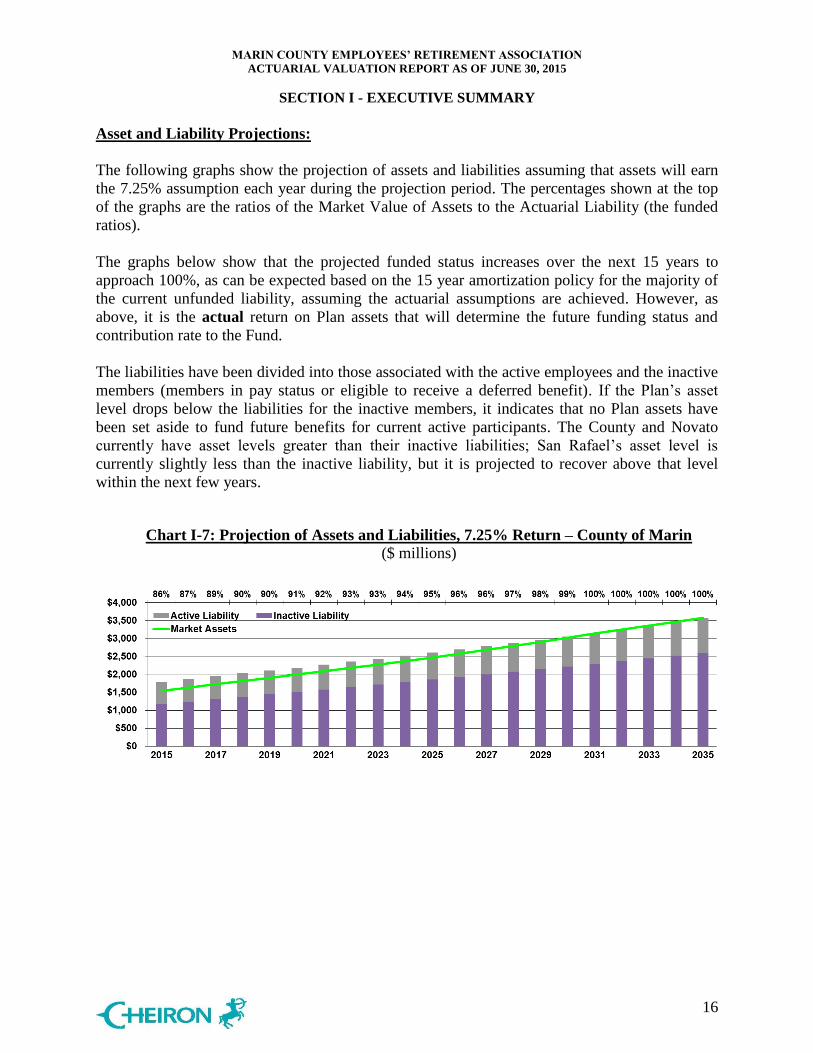
Asset and Liability Projections:
The following graphs show the projection of assets and liabilities assuming that assets will earn
the 7.25% assumption each year during the projection period. The percentages shown at the top
of the graphs are the ratios of the Market Value of Assets to the Actuarial Liability (the funded
ratios).
The graphs below show that the projected funded status increases over the next 15 years to
approach 100%, as can be expected based on the 15 year amortization policy for the majority of
the current unfunded liability, assuming the actuarial assumptions are achieved. However, as
above, it is the actual return on Plan assets that will determine the future funding status and
contribution rate to the Fund.
The liabilities have been divided into those associated with the active employees and the inactive
members (members in pay status or eligible to receive a deferred benefit). If the Plan’s asset
level drops below the liabilities for the inactive members, it indicates that no Plan assets have
been set aside to fund future benefits for current active participants. The County and Novato
currently have asset levels greater than their inactive liabilities; San Rafael’s asset level is
currently slightly less than the inactive liability, but it is projected to recover above that level
within the next few years.
Chart I-7: Projection of Assets and Liabilities, 7.25% Return – County of Marin
($ millions)

MARIN COUNTY EMPLOYEES’ RETIREMENT ASSOCIATION
ACTUARIAL VALUATION REPORT AS OF JUNE 30, 2015
SECTION I - EXECUTIVE SUMMARY
17
Chart I-8: Projection of Assets and Liabilities, 7.25% Return – Novato FPD
($ millions)
Chart I-9: Projection of Assets and Liabilities, 7.25% Return – City of San Rafael
($ millions)

MARIN COUNTY EMPLOYEES’ RETIREMENT ASSOCIATION
ACTUARIAL VALUATION REPORT AS OF JUNE 30, 2015
SECTION II - ASSETS
18
Pension Plan assets play a key role in the financial operation of the Plan and in the decisions the
Board may make with respect to future deployment of those assets. The level of assets, the
allocation of assets among asset classes, and the methodology used to measure assets will likely
impact benefit levels, employer contributions, and the ultimate security of participants’ benefits.
In this section, we present detailed information on Plan assets including:
Disclosure of Plan assets as of June 30, 2014 and June 30, 2015;
Statement of the changes in market values during the year;
An assessment of historical investment performance versus inflation; and,
An allocation of the assets between the employers and their valuation subgroups.

MARIN COUNTY EMPLOYEES’ RETIREMENT ASSOCIATION
ACTUARIAL VALUATION REPORT AS OF JUNE 30, 2015
SECTION II - ASSETS
19
Disclosure
The Market Value of Assets has replaced the smoothed Actuarial Value of Assets. The market
value represents “snap-shot” or “cash-out” values which provide the principal basis for
measuring financial performance from one year to the next. Market values, however, can
fluctuate widely with corresponding swings in the marketplace. Table II-1 on the next page discloses asset value as of June 30, 2014 and June 30, 2015.

MARIN COUNTY EMPLOYEES’ RETIREMENT ASSOCIATION
ACTUARIAL VALUATION REPORT AS OF JUNE 30, 2015
SECTION II - ASSETS
20
June 30, 2015 June 30, 2014
Cash and Cash Equivalents $ 43,288,323 $ 20,281,145
Collateral held for Securities Loaned 48,783,804 $ 77,707,689
Total Cash and Short Term Investments $ 92,072,127 $ 97,988,834
Receivables:
Contributions 5,274,370 4,675,463
Interest and Dividends 1,811,712 1,748,454
Due from Brokers for Securities Sold 1,554,594 2,847,839
Other Receivables 2,045,858 2,556,102
Total Receivables 10,686,534 11,827,858
Investments, at Fair Value:
Domestic Fixed Income 233,790,768 263,487,903
International Fixed Income 73,165,913 49,648,871
Domestic Equities 775,389,259 881,879,596
International Equities 476,353,273 445,366,793
Private Equity 158,919,340 117,393,450
Real Assets 102,000,000 0
Real Estate 206,737,016 219,506,364
Total Investments 2,026,355,568 1,977,282,977
Other Assets:
Capital Assets 6,406,474 6,879,909
Prepaid Insurance 456,433 767,155
Total Assets 2,135,977,136 2,094,746,733
Liabilities:
Accounts Payable and Accrued Expenses 1,661,533 1,461,498
Due to Brokers for Securities Purchased 3,315,677 6,177,642
Rental Security Deposits 329,220 750,895
Retiree Payroll Payable 2,246 16,116
Obligations Under Securities Lending Program 48,783,804 77,707,689
Total Liabilities 54,092,480 86,113,840
$ 2,081,884,656 $ 2,008,632,893
Table II-1
Statement of Assets at Market Value
Assets
Net Assets Held in Trust for Pension Benefits

MARIN COUNTY EMPLOYEES’ RETIREMENT ASSOCIATION
ACTUARIAL VALUATION REPORT AS OF JUNE 30, 2015
SECTION II - ASSETS
21
Changes in Market Value
The components of asset change are:
Contributions (employer and employee)
Benefit payments
Expenses (investment and administrative)
Investment income (realized and unrealized)
Table II-2 below shows the components of changes in the market value of assets during the fiscal
years ending June 30, 2014 and June 30, 2015.
Fiscal Year ending Fiscal Year ending
Additions June 30, 2015 June 30, 2014
Contributions
Employer's Contribution $ 72,867,357 $ 74,396,755
Members' Contributions 20,968,208 18,536,135
Total Contributions 93,835,565 92,932,890
Investment Income
Net Appreciation/(Depreciation) in
Fair Value of Investments 84,583,896 299,091,702
Interest and Dividends 16,836,187 13,063,532
Real Estate Operating Income, net 9,055,660 6,561,736
Other Investment Income 92,595 151,864
Total Investment Income/(Loss) 110,568,339 318,868,834
Investment Expenses (10,763,096) (10,035,631)
Net Investment Income/(Loss) 99,805,243 308,833,203
Securities Lending Activities
Securities Lending Income 250,330 245,507
Expenses from Securities Lending Activities 0 76,242
Net Securities Lending Income/(Loss) 250,330 169,265
Total Investment Income/(Loss) 100,055,573 309,002,468
Total Additions/(Declines) $ 193,891,138 $ 401,935,358
Table II-2
Changes in Market Values

MARIN COUNTY EMPLOYEES’ RETIREMENT ASSOCIATION
ACTUARIAL VALUATION REPORT AS OF JUNE 30, 2015
SECTION II - ASSETS
22
Fiscal Year ending Fiscal Year ending
Deductions June 30, 2015 June 30, 2014
Benefit payments 115,280,886 108,334,914
Refunds of Members' Contributions 703,867 1,007,947
Administrative Costs 3,668,546 3,462,021
Legal Costs & Litigation Settlement 482,923 531,581
Computer Expenses 333,364 371,548
Actuarial Expenses 169,790 138,695
Total Deductions 120,639,375 113,846,706
Net increase (Decrease) 73,251,763 288,088,652
Net Assets Held in Trust for Pension Benefits
Beginning of Year 2,008,632,893 1,720,544,241
End of Year 2,081,884,656 2,008,632,893
Approximate Return (Net of Investment
Expenses)*
5.0% 18.1%
Changes in Market Values (Continued)
Table II-2
*The approximate return is computed using an assumption that cash-flows occur mid-year, on average. This
calculation will not necessarily match the actual time- or money-weighted returns of the Fund.
MARIN COUNTY EMPLOYEES’ RETIREMENT ASSOCIATION
ACTUARIAL VALUATION REPORT AS OF JUNE 30, 2015
SECTION II - ASSETS
23
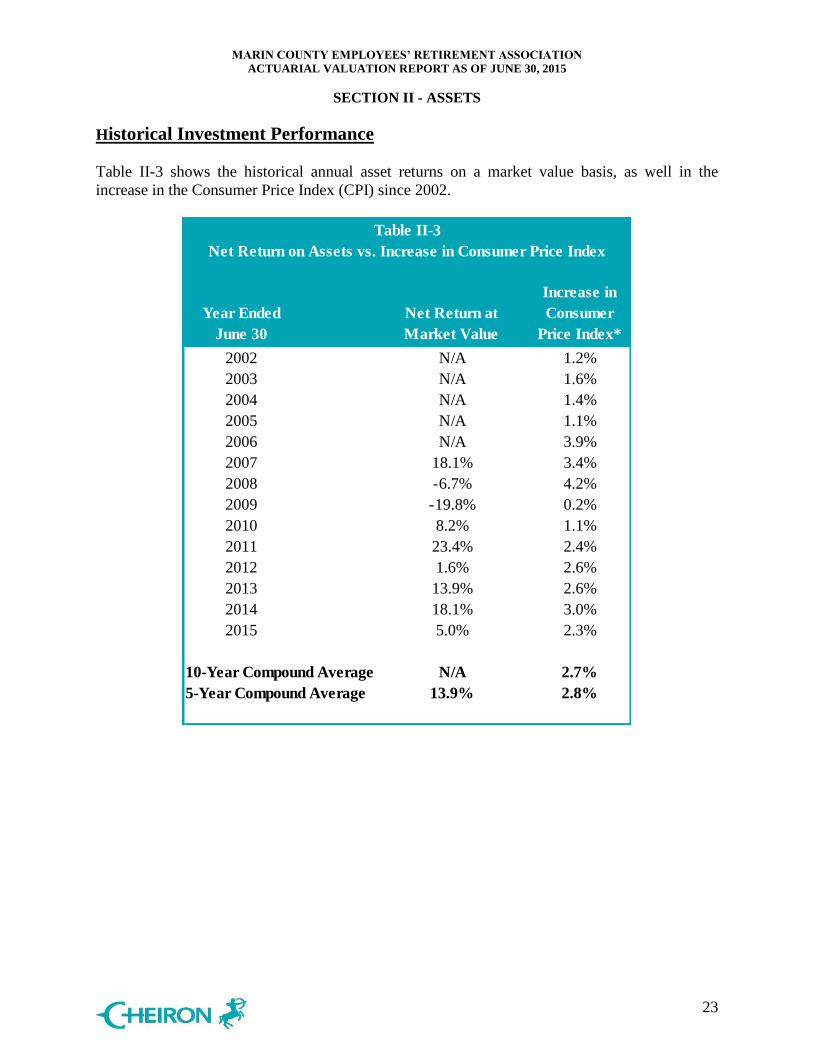
Historical Investment Performance
Table II-3 shows the historical annual asset returns on a market value basis, as well in the
increase in the Consumer Price Index (CPI) since 2002.
Table II-3
Net Return on Assets vs. Increase in Consumer Price Index
Year Ended
June 30
Net Return at
Market Value
Increase in
Consumer
Price Index*
2002 N/A 1.2%
2003 N/A 1.6%
2004 N/A 1.4%
2005 N/A 1.1%
2006 N/A 3.9%
2007 18.1% 3.4%
2008 -6.7% 4.2%
2009 -19.8% 0.2%
2010 8.2% 1.1%
2011 23.4% 2.4%
2012 1.6% 2.6%
2013 13.9% 2.6%
2014 18.1% 3.0%
2015 5.0% 2.3%
10-Year Compound Average N/A 2.7%
5-Year Compound Average 13.9% 2.8%
MARIN COUNTY EMPLOYEES’ RETIREMENT ASSOCIATION
ACTUARIAL VALUATION REPORT AS OF JUNE 30, 2015
SECTION II - ASSETS
24
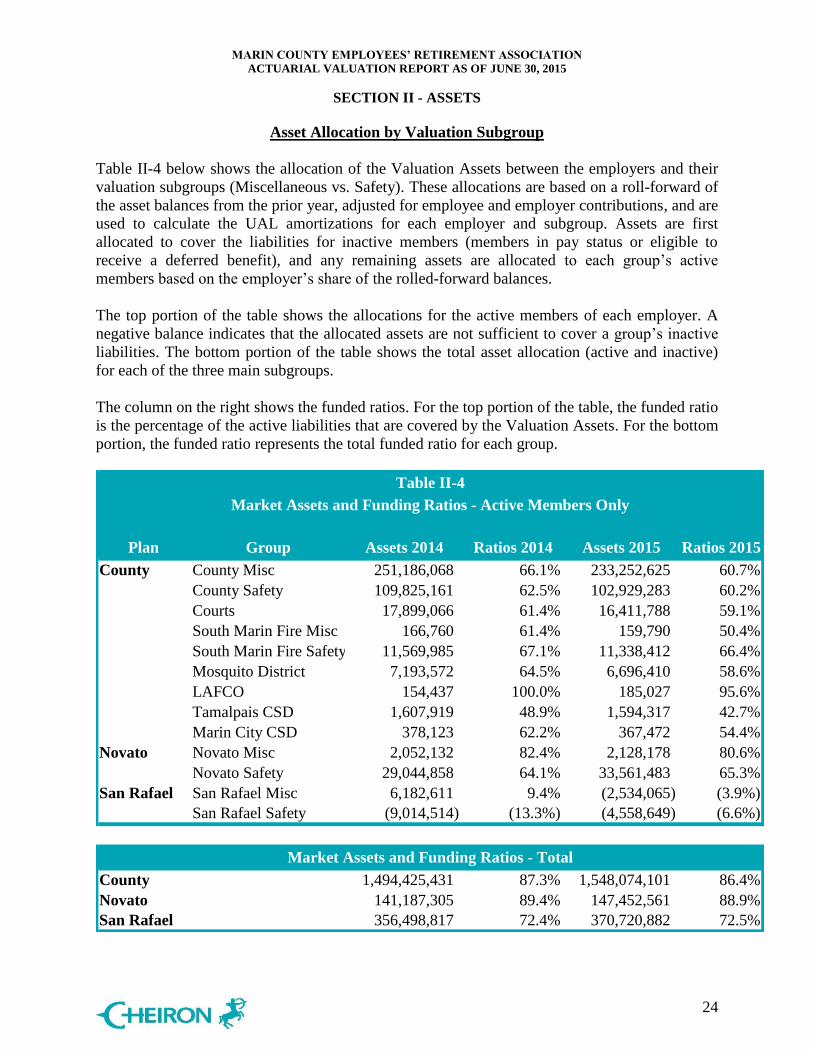
Asset Allocation by Valuation Subgroup
Table II-4 below shows the allocation of the Valuation Assets between the employers and their
valuation subgroups (Miscellaneous vs. Safety). These allocations are based on a roll-forward of
the asset balances from the prior year, adjusted for employee and employer contributions, and are
used to calculate the UAL amortizations for each employer and subgroup. Assets are first
allocated to cover the liabilities for inactive members (members in pay status or eligible to
receive a deferred benefit), and any remaining assets are allocated to each group’s active
members based on the employer’s share of the rolled-forward balances.
The top portion of the table shows the allocations for the active members of each employer. A
negative balance indicates that the allocated assets are not sufficient to cover a group’s inactive
liabilities. The bottom portion of the table shows the total asset allocation (active and inactive)
for each of the three main subgroups.
The column on the right shows the funded ratios. For the top portion of the table, the funded ratio
is the percentage of the active liabilities that are covered by the Valuation Assets. For the bottom
portion, the funded ratio represents the total funded ratio for each group.
Plan Group Assets 2014 Ratios 2014 Assets 2015 Ratios 2015
County County Misc 251,186,068 66.1% 233,252,625 60.7%
County Safety 109,825,161 62.5% 102,929,283 60.2%
Courts 17,899,066 61.4% 16,411,788 59.1%
South Marin Fire Misc 166,760 61.4% 159,790 50.4%
South Marin Fire Safety 11,569,985 67.1% 11,338,412 66.4%
Mosquito District 7,193,572 64.5% 6,696,410 58.6%
LAFCO 154,437 100.0% 185,027 95.6%
Tamalpais CSD 1,607,919 48.9% 1,594,317 42.7%
Marin City CSD 378,123 62.2% 367,472 54.4%
Novato Novato Misc 2,052,132 82.4% 2,128,178 80.6%
Novato Safety 29,044,858 64.1% 33,561,483 65.3%
San Rafael San Rafael Misc 6,182,611 9.4% (2,534,065) (3.9%)
San Rafael Safety (9,014,514) (13.3%) (4,558,649) (6.6%)
County 1,494,425,431 87.3% 1,548,074,101 86.4%
Novato 141,187,305 89.4% 147,452,561 88.9%
San Rafael 356,498,817 72.4% 370,720,882 72.5%
Market Assets and Funding Ratios - Active Members Only
Table II-4
Market Assets and Funding Ratios - Total

MARIN COUNTY EMPLOYEES’ RETIREMENT ASSOCIATION
ACTUARIAL VALUATION REPORT AS OF JUNE 30, 2015
SECTION III - LIABILITIES
25
In this section, we present detailed information on Plan liabilities.
Disclosure
Several types of liabilities are calculated and presented in this report. Each type is distinguished
by the people ultimately using the figures and the purpose for which they are using them. Note
that these liabilities are not applicable for settlement purposes, including the purchase of
annuities and the payment of lump sums.
Present Value of Future Benefits: Used for measuring all future Plan obligations,
represents the amount of money needed today to fully pay off all benefits of the Plan
both earned as of the valuation date and those to be earned in the future by current
plan participants, under the current Plan provisions and assumptions.
Actuarial Liability: Used for funding calculations, this liability is calculated taking
the Present Value of Future Benefits and subtracting the present value of future
Member Contributions and future Employer Normal Costs under an acceptable
actuarial funding method. The method used for this Plan is called the Entry Age
Normal (EAN) funding method.
Table III-1 on the next page shows the Present Value of Future Benefits and Table III-2 shows
the Actuarial Liability for each valuation subgroup for the current and prior valuations. The top
portion of each table shows the liabilities for the active members for each employer. The bottom
portion of the table shows the total liability (active and inactive) for each of the three main
subgroups.

MARIN COUNTY EMPLOYEES’ RETIREMENT ASSOCIATION
ACTUARIAL VALUATION REPORT AS OF JUNE 30, 2015
SECTION III - LIABILITIES
26
Plan Group 2014 2015
County County Misc Tier 1 23,397,709$ 18,677,510$
County Misc Tier 2 21,953,503 19,898,637
County Misc Tier 3 444,858,294 438,758,831
County Misc Tier 3A 33,798,864 35,212,634
County Misc Tier 4 19,947,283 25,334,260
County Misc Tier 5 (PEPRA) 20,534,625 40,743,812
County Safety Tier 1A 2,605,727 2,655,102
County Safety Tier 1B 0 0
County Safety Tier 2A 41,509,787 39,367,370
County Safety Tier 2B 216,017,176 208,730,502
County Safety Tier 3 (PEPRA) 4,667,666 14,100,816
Courts Tier 1 3,782,578 4,047,791
Courts Tier 2 727,796 244,448
Courts Tier 3 33,719,839 31,252,001
Courts Tier 4 1,113,669 1,024,694
Courts Tier 5 (PEPRA) 328,206 427,751
South Marin Fire Misc 457,934 512,875
South Marin Fire Safety Tier 1 18,383,770 16,494,329
South Marin Fire Safety Tier 2 12,791,285 14,371,195
South Marin Fire Safety Tier 2A 426,439 470,285
South Marin Fire Safety Tier 3A (PEPRA) 1,242,977 2,116,719
Mosquito District 16,643,783 16,679,780
LAFCO Tier 3 580,016 612,115
LAFCO Tier 7 0 0
Tamalpais CSD Tier 1 4,252,282 4,629,462
Tamalpais CSD Tier 2 (PEPRA) 218,339 249,033
Marin City CSD 1,096,474 1,155,076
Novato Novato Misc 3,923,103 4,092,551
Novato Safety Tier 1 61,586,845 67,177,177
Novato Safety Tier 2 4,533,498 5,013,844
Novato Safety Tier 3 (PEPRA) 1,781,103 2,277,839
San Rafael San Rafael Misc Tier 1 93,142,184 89,700,738
San Rafael Misc Tier 2 3,100,561 2,865,424
San Rafael Misc Tier 3 (PEPRA) 1,432,533 3,872,204
San Rafael Fire Tier 1 49,266,740 45,227,847
San Rafael Police Tier 1 52,123,804 55,628,044
San Rafael Fire Tier 2 6,143,757 6,994,821
San Rafael Police Tier 2 1,923,113 2,529,403
San Rafael Safety Tier 3 (PEPRA) 3,851,002 4,845,698
County 2,019,500,360$ 2,112,906,005$
Novato 181,914,864 190,324,310
San Rafael 570,314,414 589,477,776
Table III-1
Total Present Value of Benefits - Active and Inactive Members
Present Value of Benefits - Active Members Only

MARIN COUNTY EMPLOYEES’ RETIREMENT ASSOCIATION
ACTUARIAL VALUATION REPORT AS OF JUNE 30, 2015
SECTION III - LIABILITIES
27
Plan Group 2014 2015
County County Misc Tier 1 22,337,043$ 17,804,323$
County Misc Tier 2 17,931,828 16,378,517
County Misc Tier 3 324,272,419 326,644,981
County Misc Tier 3A 11,115,250 13,451,703
County Misc Tier 4 2,968,637 4,669,080
County Misc Tier 5 (PEPRA) 1,488,932 5,372,940
County Safety Tier 1A 2,605,727 2,655,102
County Safety Tier 1B 0 0
County Safety Tier 2A 28,034,319 26,653,510
County Safety Tier 2B 144,882,648 140,784,821
County Safety Tier 3 (PEPRA) 260,936 945,189
Courts Tier 1 3,553,552 3,824,247
Courts Tier 2 550,418 167,712
Courts Tier 3 24,456,079 23,130,014
Courts Tier 4 607,597 620,267
Courts Tier 5 (PEPRA) 0 46,303
South Marin Fire Misc 271,632 317,058
South Marin Fire Safety Tier 1 13,888,973 12,254,656
South Marin Fire Safety Tier 2 3,348,458 4,666,910
South Marin Fire Safety Tier 2A 0 29,743
South Marin Fire Safety Tier 3A (PEPRA) 0 134,388
Mosquito District 11,150,156 11,418,471
LAFCO Tier 3 154,437 193,636
LAFCO Tier 7 0 0
Tamalpais CSD Tier 1 3,288,771 3,713,084
Tamalpais CSD Tier 2 (PEPRA) 0 17,777
Marin City CSD 608,080 676,118
Novato Novato Misc 2,489,774 2,641,313
Novato Safety Tier 1 43,659,164 49,299,615
Novato Safety Tier 2 1,534,924 1,932,824
Novato Safety Tier 3 (PEPRA) 90,574 202,567
San Rafael San Rafael Misc Tier 1 65,037,281 64,045,189
San Rafael Misc Tier 2 357,547 486,959
San Rafael Misc Tier 3 (PEPRA) 69,702 283,412
San Rafael Fire Tier 1 33,242,132 29,623,909
San Rafael Police Tier 1 33,462,658 37,181,051
San Rafael Fire Tier 2 712,738 1,180,936
San Rafael Police Tier 2 264,375 453,593
San Rafael Safety Tier 3 (PEPRA) 194,224 454,564
County 1,712,220,231$ 1,791,709,527$
Novato 157,864,751 165,839,218
San Rafael 492,671,377 511,523,210
Total Accrued Liabilities - Active and Inactive Members
Table III-2
Actuarial Liabilities - Active Members Only

MARIN COUNTY EMPLOYEES’ RETIREMENT ASSOCIATION
ACTUARIAL VALUATION REPORT AS OF JUNE 30, 2015
SECTION IV - CONTRIBUTIONS
28
In the process of evaluating the financial condition of any pension plan, the actuary analyzes the
assets and liabilities to determine what level of contributions is needed to properly maintain the
funding status of the Plan. Typically, the actuarial process will use a funding technique that will
result in a pattern of contributions that are both stable and predictable.
For this Plan, the actuarial funding method used to determine the Normal Cost and the Unfunded
Actuarial Liability is the Entry Age Normal (EAN) cost method. There are three components to
the total contribution: the normal cost rate (employee and employer), the Unfunded Actuarial
Liability rate (UAL rate), and the administrative expense contribution.
The normal cost rate is determined in the following steps. First, an individual normal cost rate is
determined by taking the value, as of entry age into the Plan, of each member’s projected future
benefits. This value is then divided by the value, also at entry age, of the member’s expected
future salary producing a normal cost rate that should remain relatively constant over a member’s
career.
The total normal cost is computed by adding the expected dollar amount of each active
member’s normal cost for the current year. The total normal cost is adjusted with interest to the
middle of the year, to reflect the fact that the normal cost contributions are paid throughout the
year as member payroll payments are made. Finally, the total normal cost is reduced by the
expected contributions for each member and divided by the projected pay for each subgroup.
As of the prior valuation, the Unfunded Actuarial Liability (UAL) is the difference between the
EAN Actuarial Liability and the Market Value of Assets. The UAL payment is determined using
the following pieces:
The amount needed to fund the extraordinary UAL resulting from the 2008-2009
investment losses as a level percent of member payroll over a fixed period (23 years
remaining as of the current valuation, reduced from 24 years in the prior valuation);
The remaining UAL as of June 30, 2013 over a period of 17 years as a level percentage
of member payroll (15 years as of June 30, 2015); and,
Any subsequent unexpected change in the Unfunded Actuarial Liability after June 30,
2013 is amortized over 24 years (22 years for assumption changes) that includes a 5-year
phase-in/out (3 years for assumption changes) of the payments/credits for each annual
layer.
The administrative expenses are assumed to be $4.635 million per year as of June 30, 2015,
increasing at 3% per annum.

MARIN COUNTY EMPLOYEES’ RETIREMENT ASSOCIATION
ACTUARIAL VALUATION REPORT AS OF JUNE 30, 2015
SECTION IV - CONTRIBUTIONS
29
Table IV-1 below presents the calculation of employer contribution rates for each of the three main Plan groups, as well as a
comparison to the prior year rates.
Table IV-1
Development of the Net Employer Contribution Rates as of June 30, 2015 for FYE 2017
1. Total Normal Cost Rate 22.39% 35.58% 28.94% 22.49% 35.32% 29.20%
2. Member Contribution Rate 10.57% 13.51% 12.06% 10.72% 13.61% 12.15%
3. Employer Normal Cost Rate (1-2) 11.82% 22.07% 16.88% 11.77% 21.71% 17.06%
4. UAL Amortization 13.46% 24.39% 41.28% 13.86% 26.87% 40.85%
5. Administrative Expense Rate 1.22% 2.23% 2.80% 1.23% 2.32% 2.77%
6. Final Employer Contribution Rate (3+4+5) 26.50% 48.69% 60.96% 26.86% 50.90% 60.68%
San Rafael
June 30, 2015
County Novato San Rafael County
June 30, 2014
Novato

MARIN COUNTY EMPLOYEES’ RETIREMENT ASSOCIATION
ACTUARIAL VALUATION REPORT AS OF JUNE 30, 2015
SECTION IV - CONTRIBUTIONS
30
Table IV-2 below presents the calculation of the UAL payments for the Plan for this valuation.
Initial June 30, 2015 Remaining Current
Date Initial Amortization Outstanding Amortization Length of Phase In/Out Amortization
Type of Base Established Amount Years Balance Years Phase In/Out Percentage Amount
Charges / (Credits)
1. County - 2009 Extraordinary Loss 6/30/2009 $ 146,241,604 30 $ 156,459,015 23 N/A 100% $ 10,605,305
2. County - Initial UAL 6/30/2013 188,358,828 17 183,239,522 15 N/A 100% 16,536,384
3. County - (Gain)/Loss Base 6/30/2014 (223,502,748) 24 (235,998,430) 23 5 40% (7,376,318)
4. County - Assumption Changes 6/30/2014 99,117,401 22 103,668,295 21 3 67% 5,241,656
5. County - (Gain)/Loss Base 6/30/2015 36,267,023 24 36,267,023 24 5 20% 581,034
6. Novato - 2009 Extraordinary Loss 6/30/2009 14,765,994 30 15,797,645 23 N/A 100% 1,070,816
7. Novato - Initial UAL 6/30/2013 17,008,202 17 16,545,945 15 N/A 100% 1,493,183
8. Novato - (Gain)/Loss Base 6/30/2014 (22,114,107) 24 (23,350,471) 23 5 40% (729,838)
9. Novato - Assumption Changes 6/30/2014 6,230,650 22 6,516,725 21 3 33% 329,497
10. Novato - (Gain)/Loss Base 6/30/2015 2,876,813 24 2,876,813 24 5 67% 46,089
11. San Rafael - 2009 Extraordinary Loss 6/30/2009 34,997,031 30 37,442,157 23 N/A 100% 2,537,952
12. San Rafael - Initial UAL 6/30/2013 124,305,953 17 120,927,508 15 N/A 100% 10,913,059
13. San Rafael - (Gain)/Loss Base 6/30/2014 (54,710,285) 24 (57,769,049) 23 5 40% (1,805,618)
14. San Rafael - Assumption Changes 6/30/2014 30,608,707 22 32,014,081 21 3 67% 1,618,690
15. San Rafael - (Gain)/Loss Base 6/30/2015 8,187,631 24 8,187,631 24 5 20% 131,174
Total $ 402,824,411 $ 41,193,066
Table IV-2
Development of Amortization Payment
For the June 30, 2015 Actuarial Valuation
The single period equivalent amortization period - i.e., the length of time required to amortize the overall UAL as a level percentage of
payroll based on the total current amortization payment – is approximately 13 years.

MARIN COUNTY EMPLOYEES’ RETIREMENT ASSOCIATION
ACTUARIAL VALUATION REPORT AS OF JUNE 30, 2015
SECTION IV - CONTRIBUTIONS
31
Tables IV-3 through IV-6 presents the calculation of employer contribution rates for each employer and Tier.
Table IV-3
Development of the County Misc/Safety Member Contribution Rates as of June 30, 2015 for FYE 2017
County Misc
Tier 1
County Misc
Tier 2
County Misc
Tier 3
County Misc
Tier 3A
County Misc
Tier 4
County Misc
Tier 5 County Misc
A. Total Normal Cost Rate 20.12% 20.40% 19.42% 20.75% 19.51% 17.62% 19.29%
B. Member Contribution Rate (Excluding Admin Expense Load) 3.09% 9.13% 8.98% 9.66% 8.46% 8.76% 8.88%
C. Employer Normal Cost Rate (A-B) 17.03% 11.27% 10.44% 11.09% 11.05% 8.86% 10.41%
D. UAL Amortization Rate 11.47% 11.47% 11.47% 11.47% 11.47% 11.47% 11.47%
E. Administrative Expense Rate 1.37% 1.09% 1.05% 1.09% 1.08% 0.98% 1.05%
F. Net June 30, 2015 Contribution Rate (C+D+E) 29.87% 23.83% 22.96% 23.65% 23.60% 21.31% 22.93%
County Safety
Tier 2A
County Safety
Tier 2B
County Safety
Tier 3
County
Safety
County Misc
/ Safety
A. Total Normal Cost Rate 33.41% 32.11% 26.35% 31.69% 21.99%
B. Member Contribution Rate (Excluding Admin Expense Load) 14.50% 17.70% 12.91% 16.70% 10.58%
C. Employer Normal Cost Rate (A-B) 18.91% 14.41% 13.44% 14.99% 11.41%
D. UAL Amortization Rate 19.83% 19.83% 19.83% 19.83% 13.29%
E. Administrative Expense Rate 1.86% 1.65% 1.60% 1.67% 1.19%
F. Net June 30, 2015 Contribution Rate (C+D+E) 40.60% 35.89% 34.87% 36.49% 25.89%

MARIN COUNTY EMPLOYEES’ RETIREMENT ASSOCIATION
ACTUARIAL VALUATION REPORT AS OF JUNE 30, 2015
SECTION IV - CONTRIBUTIONS
32
Table IV-4
Development of the County Special Districts Contribution Rates as of June 30, 2015 for FYE 2017
South Marin
Fire Misc Tier
1
Tamalpais
CSD Tier 1
Tamalpais
CSD Tier 2
Marin City
CSD Tier 1
Mosquito
District Tier
1
LAFCO
Tier 3
A. Total Normal Cost Rate 29.13% 22.91% 15.70% 20.89% 23.69% 19.67%
B. Member Contribution Rate (Excluding Admin Expense Load) 14.07% 9.30% 7.85% 9.67% 9.60% 7.25%
C. Employer Normal Cost Rate (A-B) 15.06% 13.61% 7.85% 11.22% 14.09% 12.42%
D. UAL Amortization Rate 13.37% 20.37% 20.37% 9.24% 18.14% 10.53%
E. Administrative Expense Rate 1.37% 1.63% 1.36% 0.98% 1.55% 1.10%
F. Net June 30, 2015 Contribution Rate (C+D+E) 29.80% 35.61% 29.58% 21.44% 33.78% 24.05%
South Marin
Fire Safety
Tier 1
South Marin
Fire Safety
Tier 2
South Marin
Fire Safety
Tier 2A
South Marin
Fire Safety
Tier 3A
Special
Districts
Total
County
A. Total Normal Cost Rate 38.64% 40.89% 34.88% 33.57% 30.97% 22.39%
B. Member Contribution Rate (Excluding Admin Expense Load) 13.79% 12.82% 11.83% 16.79% 11.33% 10.57%
C. Employer Normal Cost Rate (A-B) 24.85% 28.07% 23.05% 16.78% 19.64% 11.82%
D. UAL Amortization Rate 11.27% 11.27% 11.27% 11.27% 12.99% 13.46%
E. Administrative Expense Rate 1.74% 1.89% 1.65% 1.35% 1.57% 1.22%
F. Net June 30, 2015 Contribution Rate (C+D+E) 37.86% 41.23% 35.97% 29.40% 34.20% 26.50%

MARIN COUNTY EMPLOYEES’ RETIREMENT ASSOCIATION
ACTUARIAL VALUATION REPORT AS OF JUNE 30, 2015
SECTION IV - CONTRIBUTIONS
33
Table IV-5
Development of the Courts and Novato Contribution Rates as of June 30, 2015 for FYE 2017
Courts Courts Courts Courts Courts Courts
Tier 1 Tier 2 Tier 3 Tier 4 Tier 5 Total
A. Total Normal Cost Rate 21.96% 15.23% 19.26% 21.49% 21.40% 19.52%
B. Member Contribution Rate (Excluding Admin Expense Load) 0.00% 7.48% 9.13% 10.65% 8.76% 8.68%
C. Employer Normal Cost Rate (A-B) 21.96% 7.75% 10.13% 10.84% 12.64% 10.84%
D. UAL Amortization Rate 16.59% 16.59% 16.59% 16.59% 16.59% 16.59%
E. Administrative Expense Rate 1.85% 1.17% 1.29% 1.32% 1.41% 1.32%
F. Net June 30, 2015 Contribution Rate (C+D+E) 40.40% 25.51% 28.01% 28.75% 30.64% 28.75%
Novato Misc Novato Safety Novato Safety Novato Safety Novato
Tier 1 Tier 1 Tier 2 Tier 3 Safety Novato
A. Total Normal Cost Rate 23.23% 37.49% 39.33% 26.21% 36.81% 35.58%
B. Member Contribution Rate (Excluding Admin Expense Load) 9.97% 13.92% 13.98% 13.11% 13.95% 13.51%
C. Employer Normal Cost Rate (A-B) 13.26% 23.57% 25.35% 13.10% 22.86% 22.07%
D. UAL Amortization Rate 7.24% 26.13% 26.13% 26.13% 26.13% 24.39%
E. Administrative Expense Rate 0.99% 2.39% 2.48% 1.89% 2.36% 2.23%
F. Net June 30, 2015 Contribution Rate (C+D+E) 21.49% 52.09% 53.96% 41.12% 51.35% 48.69%

MARIN COUNTY EMPLOYEES’ RETIREMENT ASSOCIATION
ACTUARIAL VALUATION REPORT AS OF JUNE 30, 2015
SECTION IV - CONTRIBUTIONS
34
Table IV-6
Development of the San Rafael Contribution Rates as of June 30, 2015 for FYE 2017
San Rafael
Misc Tier 1
San Rafael
Misc Tier 2
San Rafael
Misc Tier 3
San Rafael
Misc
A. Total Normal Cost Rate 27.22% 20.12% 16.09% 25.25%
B. Member Contribution Rate (Excluding Admin Expense Load) 11.98% 8.31% 8.76% 11.29%
C. Employer Normal Cost Rate (A-B) 15.24% 11.81% 7.33% 13.96%
D. UAL Amortization Rate 32.85% 32.85% 32.85% 32.85%
E. Administrative Expense Rate 2.31% 2.15% 1.93% 2.25%
F. Net June 30, 2015 Contribution Rate (C+D+E) 50.40% 46.81% 42.11% 49.06%
San Rafael
Fire Tier 1
San Rafael
Police Tier 1
San Rafael
Fire Tier 2
San Rafael
Police Tier 2
San Rafael
Safety Tier 3
San Rafael
Safety San Rafael
A. Total Normal Cost Rate 35.07% 33.61% 29.97% 34.15% 24.24% 32.94% 28.94%
B. Member Contribution Rate (Excluding Admin Expense) 13.44% 12.82% 11.28% 12.66% 12.91% 12.91% 12.06%
C. Employer Normal Cost Rate (A-B) 21.63% 20.79% 18.69% 21.49% 11.33% 20.03% 16.88%
D. UAL Amortization Rate 50.57% 50.57% 50.57% 50.57% 50.57% 50.57% 41.28%
E. Administrative Expense Rate 3.47% 3.43% 3.33% 3.47% 2.98% 3.40% 2.80%
F. Net June 30, 2015 Contribution Rate (C+D+E) 75.67% 74.79% 72.59% 75.53% 64.88% 74.00% 60.96%

MARIN COUNTY EMPLOYEES’ RETIREMENT ASSOCIATION
ACTUARIAL VALUATION REPORT AS OF JUNE 30, 2015
SECTION IV - CONTRIBUTIONS
35
The following table shows the contribution rates for the new benefit Tiers for those employers that did not have any active members in
those Tiers as of June 30, 2015. The Normal Cost rates for these Tiers are based on the pooled demographic profiles of the employers
with current active PEPRA members.
Table IV-7
Development of Contribution Rates for New Tiers with No Active Members as of June 30, 2015 for FYE 2017
South Marin South Marin Mosquito
Fire Misc Fire Safety District LAFCO
Tier 2 Tier 3 Tier 2 Tier 4
A. Total Normal Cost Rate 15.70% 26.21% 15.70% 17.52%
B. Member Contribution Rate (Excluding Admin Expense Load) 7.85% 13.11% 7.85% 8.76%
C. Employer Normal Cost Rate (A-B) 7.85% 13.10% 7.85% 8.76%
D. UAL Amortization Rate 13.37% 11.27% 18.14% 10.53%
E. Administrative Expense Rate 1.02% 1.17% 1.25% 0.93%
F. Net June 30, 2015 Contribution Rate (C+D+E) 22.24% 25.54% 27.24% 20.22%
Novato
Marin City Misc
CSD Tier 2 Tier 2
A. Total Normal Cost Rate 15.70% 15.70%
B. Member Contribution Rate (Excluding Admin Expense) 7.85% 7.85%
C. Employer Normal Cost Rate (A-B) 7.85% 7.85%
D. UAL Amortization Rate 9.24% 7.24%
E. Administrative Expense Rate 0.82% 0.73%
F. Net June 30, 2015 Contribution Rate (C+D+E) 17.91% 15.82%
MARIN COUNTY EMPLOYEES’ RETIREMENT ASSOCIATION
ACTUARIAL VALUATION REPORT AS OF JUNE 30, 2015
SECTION IV - CONTRIBUTIONS
36
Table IV-8 contains a comparison of the employer contribution rates for each employer and Tier
to the prior year rates, as well as the number of active members in each Tier as of June 30, 2015.

MARIN COUNTY EMPLOYEES’ RETIREMENT ASSOCIATION
ACTUARIAL VALUATION REPORT AS OF JUNE 30, 2015
SECTION IV - CONTRIBUTIONS
37
Plan Group # of Active Members 2014 2015
County County Misc Tier 1 16 30.44% 29.87%
County Misc Tier 2 54 24.35% 23.83%
County Misc Tier 3 967 23.42% 22.96%
County Misc Tier 3A 133 23.86% 23.65%
County Misc Tier 4 139 23.63% 23.60%
County Misc Tier 5 (PEPRA) 314 21.55% 21.31%
County Misc 1,623 23.47% 22.93%
County Safety Tier 1A 1 21.36% 20.78%
County Safety Tier 1B 0 N/A N/A
County Safety Tier 2A 63 39.11% 40.60%
County Safety Tier 2B 241 35.94% 35.89%
County Safety Tier 3 (PEPRA) 54 35.72% 34.87%
County Safety 359 36.47% 36.49%
County Misc/Safety 1,982 26.35% 25.89%
Courts Tier 1 3 38.50% 40.40%
Courts Tier 2 1 27.02% 25.51%
Courts Tier 3 88 25.96% 28.01%
Courts Tier 4 4 26.58% 28.75%
Courts Tier 5 (PEPRA) 6 28.18% 30.64%
Courts 102 26.64% 28.75%
South Marin Fire Misc 1 29.09% 29.80%
South Marin Fire Safety Tier 1 16 39.87% 37.86%
South Marin Fire Safety Tier 2 26 41.80% 41.23%
South Marin Fire Safety Tier 2A 1 34.41% 35.97%
South Marin Fire Safety Tier 3A (PEPRA) 6 26.89% 29.40%
Mosquito District 33 34.04% 33.78%
LAFCO Tier 3 2 27.10% 24.05%
LAFCO Tier 7 0 N/A N/A
Tamalpais CSD Tier 1 9 35.85% 35.61%
Tamalpais CSD Tier 2 (PEPRA) 2 29.47% 29.58%
Marin City CSD 5 20.97% 21.44%
Special Districts 101 34.71% 34.20%
Total County 2,185 26.86% 26.50%
Novato Novato Misc 8 21.67% 21.49%
Novato Safety Tier 1 54 54.40% 52.09%
Novato Safety Tier 2 7 56.32% 53.96%
Novato Safety Tier 3 (PEPRA) 6 45.28% 41.12%
Total Novato 75 50.90% 48.69%
San Rafael San Rafael Misc Tier 1 167 48.90% 50.40%
San Rafael Misc Tier 2 18 45.19% 46.81%
San Rafael Misc Tier 3 (PEPRA) 36 41.19% 42.11%
San Rafael Misc 221 48.24% 49.06%
San Rafael Fire Tier 1 41 75.64% 75.67%
San Rafael Police Tier 1 53 74.67% 74.79%
San Rafael Fire Tier 2 14 72.57% 72.59%
San Rafael Police Tier 2 5 76.20% 75.53%
San Rafael Safety Tier 3 (PEPRA) 15 66.40% 64.88%
San Rafael Safety 128 74.35% 74.00%
Total San Rafael 349 60.67% 60.96%
Table IV-8

MARIN COUNTY EMPLOYEES’ RETIREMENT ASSOCIATION
ACTUARIAL VALUATION REPORT AS OF JUNE 30, 2015
APPENDIX A - MEMBERSHIP INFORMATION
38
The data for this valuation was provided by MCERA as of June 30, 2015. Cheiron did not audit any of the data; however, it was reviewed to ensure that it complies with generally accepted actuarial standards. Data pertaining to active and inactive Members and their beneficiaries as of the valuation date
was supplied by the Plan Administrator on electronic media. As is usual in studies of this type,
Member data was neither verified nor audited.

MARIN COUNTY EMPLOYEES’ RETIREMENT ASSOCIATION
ACTUARIAL VALUATION REPORT AS OF JUNE 30, 2015
APPENDIX A - MEMBERSHIP INFORMATION
39
Participant Data as of June 30, 2015: County of Marin
Marin County Marin Special Districts Total County and
Miscellaneous Safety Total Miscellaneous Safety Total Special Districts
6/30/2014 6/30/2015 6/30/2014 6/30/2015 6/30/2014 6/30/2015 6/30/2014 6/30/2015 6/30/2014 6/30/2015 6/30/2014 6/30/2015 6/30/2014 6/30/2015
Active Participants
Number 1,556 1,623 341 359 1,897 1,982 166 154 49 49 215 203 2,112 2,185
Average Age 49.68 49.09 42.07 41.26 48.31 47.67 50.77 51.48 41.61 41.92 48.68 49.17 48.35 47.81
Average Service 11.00 10.63 11.90 11.03 11.16 10.70 12.60 13.26 7.58 7.65 11.45 11.90 11.19 10.81
Average Pay* $80,674 $81,673 $104,544 $102,469 $84,965 $85,440 $73,487 $74,676 $98,396 $103,369 $79,164 $81,602 $84,374 $85,083
Service Retired
Number 1,346 1,399 204 219 1,550 1,618 92 102 20 22 112 124 1,662 1,742
Average Age 72.21 72.25 63.43 63.55 71.05 71.07 66.93 67.08 61.05 61.88 65.88 66.16 70.70 70.72
Average Total Benefit* $33,374 $34,794 $66,037 $66,927 $37,673 $39,144 $36,958 $36,154 $67,734 $73,717 $42,454 $42,819 $37,995 $39,405
Beneficiaries
Number 256 243 64 62 320 305 8 8 10 9 18 17 338 322
Average Age 75.74 74.93 71.51 69.67 74.89 73.86 69.76 70.76 66.68 64.86 68.05 67.64 74.53 73.53
Average Total Benefit* $21,568 $22,723 $36,393 $38,665 $24,533 $25,964 $17,551 $18,026 $40,288 $40,435 $30,183 $29,890 $24,834 $26,171
Duty Disabled
Number 88 86 100 100 188 186 3 3 16 16 19 19 207 205
Average Age 65.24 65.68 61.98 61.88 63.51 63.64 60.83 61.83 63.42 64.42 63.01 64.01 63.46 63.67
Average Total Benefit* $35,099 $35,522 $47,598 $49,279 $41,747 $42,918 $21,038 $21,669 $50,272 $51,780 $45,656 $47,026 $42,106 $43,299
Ordinary Disabled
Number 32 29 6 7 38 36 3 3 1 1 4 4 42 40
Average Age 67.38 68.43 56.51 54.56 65.67 65.74 63.21 64.21 54.21 55.21 60.96 61.96 65.22 65.36
Average Total Benefit* $19,329 $20,345 $48,409 $47,175 $23,920 $25,562 $24,938 $25,437 $52,680 $54,260 $31,874 $32,643 $24,678 $26,270
Total In Pay
Number 1,722 1,757 374 388 2,096 2,145 106 116 47 48 153 164 2,249 2,309
Average Age 72.29 72.23 64.31 63.94 70.87 70.73 66.87 67.13 62.91 63.15 65.65 65.96 70.51 70.39
Average Total Benefit* $31,446 $32,922 $55,751 $57,506 $35,783 $37,369 $34,702 $34,252 $55,630 $59,759 $41,131 $41,718 $36,147 $37,678
Terminated Vested
Number 164 174 16 20 180 194 15 17 3 3 18 20 198 214
Average Age 50.68 50.95 49.33 42.88 50.56 50.12 49.77 48.23 48.85 49.85 49.61 48.47 50.47 49.97
Average Service 8.01 7.81 7.32 6.95 7.94 7.72 6.36 8.88 2.24 2.24 5.67 7.88 7.74 7.73
Transfers
Number 205 203 59 62 264 265 25 27 16 16 41 43 305 308
Average Age 50.61 50.38 45.64 45.39 49.50 49.21 49.62 50.01 44.53 45.53 47.63 48.34 49.25 49.09
Average Service 4.92 4.80 4.21 4.95 4.76 4.83 4.90 5.48 5.81 5.81 5.26 5.60 4.83 4.94
Total Inactive
Number 369 377 75 82 444 459 40 44 19 19 59 63 503 522
Average Age 50.64 50.65 46.43 44.78 49.93 49.60 49.68 49.32 45.21 46.21 48.24 48.38 49.73 49.45
Average Service 6.29 6.19 4.87 5.44 6.05 6.05 5.45 6.79 5.25 5.25 5.38 6.33 5.97 6.09
*All payroll and benefit figures shown are annual

MARIN COUNTY EMPLOYEES’ RETIREMENT ASSOCIATION
ACTUARIAL VALUATION REPORT AS OF JUNE 30, 2015
APPENDIX A - MEMBERSHIP INFORMATION
40
Participant Data as of June 30, 2015: County of Marin
Tier 1 Tier 2 Tier 3 Tier 3A Tier 4 Tier 5
Miscellaneous Miscellaneous Miscellaneous Miscellaneous Miscellaneous Miscellaneous
6/30/2014 6/30/2015 6/30/2014 6/30/2015 6/30/2014 6/30/2015 6/30/2014 6/30/2015 6/30/2014 6/30/2015 6/30/2014 6/30/2015
Active Participants
Number 20 16 61 54 1,036 967 141 133 121 139 177 314
Average Age 62.57 63.91 62.51 62.49 51.82 52.29 44.39 45.52 42.41 43.36 40.44 40.25
Average Service 32.31 32.56 16.63 17.09 13.97 14.77 4.44 5.51 1.79 2.38 0.82 1.47
Average Pay* $101,501 $104,155 $72,365 $72,918 $84,713 $86,589 $81,132 $85,251 $69,768 $75,948 $64,634 $67,915
Service Retired
Number 612 594 251 247 482 556 1 1 0 1 0 0
Average Age 76.55 76.94 76.08 76.61 64.70 65.32 64.29 65.29 0.00 60.47 0.00 0.00
Average Total Benefit* $42,040 $44,469 $20,295 $21,514 $29,208 $30,426 $20,852 $21,269 $0 $10,816 $0 $0
Beneficiaries
Number 183 164 42 44 31 35 0 0 0 0 0 0
Average Age 80.20 79.41 69.68 71.32 57.64 58.48 0.00 0.00 0.00 0.00 0.00 0.00
Average Total Benefit* $23,767 $25,838 $13,131 $13,468 $20,022 $19,765 $0 $0 $0 $0 $0 $0
Duty Disabled
Number 26 23 30 30 32 33 0 0 0 0 0 0
Average Age 72.01 72.17 63.29 64.29 61.56 62.42 0.00 0.00 0.00 0.00 0.00 0.00
Average Total Benefit* $39,352 $38,941 $27,074 $27,615 $39,167 $40,327 $0 $0 $0 $0 $0 $0
Ordinary Disabled
Number 12 11 12 11 8 7 0 0 0 0 0 0
Average Age 71.14 71.09 68.11 69.68 60.66 62.31 0.00 0.00 0.00 0.00 0.00 0.00
Average Total Benefit* $21,841 $23,176 $16,598 $17,334 $19,656 $20,630 $0 $0 $0 $0 $0 $0
Total In Pay
Number 833 792 335 332 553 631 1 1 0 1 0 0
Average Age 77.13 77.24 73.85 74.57 64.06 64.76 64.29 65.29 0.00 60.47 0.00 0.00
Average Total Benefit* $37,651 $40,155 $19,871 $20,860 $29,131 $30,243 $20,852 $21,269 $0 $10,816 $0 $0
Terminated Vested
Number 2 2 2 3 155 161 4 6 1 1 0 1
Average Age 72.35 73.35 56.00 60.50 50.79 50.88 36.96 41.83 35.20 36.20 0.00 58.67
Average Service 5.95 5.95 6.63 5.42 8.19 8.00 4.48 5.01 0.62 0.62 0.00 11.97
Transfers
Number 2 2 7 9 184 174 8 10 3 6 1 2
Average Age 57.86 58.86 59.57 58.43 50.44 50.54 46.87 47.54 50.20 42.30 35.19 30.26
Average Service 11.57 11.57 2.50 3.12 5.13 5.08 2.74 2.69 0.56 1.59 0.18 1.58
Total Inactive
Number 4 4 9 12 339 335 12 16 4 7 1 3
Average Age 65.10 66.10 58.78 58.95 50.60 50.70 43.57 45.40 46.45 41.43 35.19 39.73
Average Service 8.76 8.76 3.42 3.70 6.53 6.48 3.32 3.56 0.57 1.45 0.18 5.04

MARIN COUNTY EMPLOYEES’ RETIREMENT ASSOCIATION
ACTUARIAL VALUATION REPORT AS OF JUNE 30, 2015
APPENDIX A - MEMBERSHIP INFORMATION
41
Participant Data as of June 30, 2015: County of Marin
6/30/2014 6/30/2015 6/30/2014 6/30/2015 6/30/2014 6/30/2015 6/30/2014 6/30/2015 6/30/2014 6/30/2015
Active Participants
Number 1 1 68 63 0 0 255 241 17 54
Average Age 66.91 67.91 44.94 46.37 0.00 0.00 41.89 42.28 31.78 30.21
Average Service 29.30 30.30 11.50 11.91 0.00 0.00 12.68 12.96 0.94 0.99
Average Pay* $212,365 $214,061 $87,908 $92,847 $0 $0 $110,446 $111,338 $76,217 $72,051
Service Retired
Number 73 70 22 24 31 31 78 94 0 0
Average Age 71.53 72.19 62.86 63.69 61.01 61.98 56.96 57.61 0.00 0.00
Average Total Benefit* $71,855 $74,996 $41,417 $41,113 $91,175 $93,910 $57,546 $58,610 $0 $0
Beneficiaries
Number 50 45 7 7 4 4 3 6 0 0
Average Age 75.68 74.24 57.75 58.75 51.40 52.40 60.94 59.59 0.00 0.00
Average Total Benefit* $38,524 $39,803 $37,719 $38,473 $13,239 $13,636 $28,652 $47,042 $0 $0
Duty Disabled
Number 44 40 25 26 6 6 25 28 0 0
Average Age 71.42 71.82 54.54 55.91 59.01 60.01 53.53 53.61 0.00 0.00
Average Total Benefit* $46,953 $49,029 $36,343 $36,401 $100,758 $103,781 $47,230 $49,915 $0 $0
Ordinary Disabled
Number 1 1 2 2 0 0 3 4 0 0
Average Age 67.72 68.72 52.37 53.37 0.00 0.00 55.54 51.63 0.00 0.00
Average Total Benefit* $23,175 $23,870 $28,922 $29,501 $0 $0 $69,812 $61,839 $0 $0
Total In Pay
Number 168 156 56 59 41 41 109 132 0 0
Average Age 72.72 72.67 58.13 59.33 59.78 60.75 56.25 56.67 0.00 0.00
Average Total Benefit* $55,123 $57,858 $38,243 $38,329 $84,974 $87,523 $54,722 $56,338 $0 $0
Terminated Vested
Number 0 0 4 6 0 0 11 13 1 1
Average Age 0.00 0.00 47.71 38.87 0.00 0.00 45.06 43.69 55.44 56.44
Average Service 0.00 0.00 10.00 9.52 0.00 0.00 6.79 6.12 2.37 2.37
Transfers
Number 1 0 7 6 1 1 50 55 0 0
Average Age 56.97 0.00 42.19 41.37 60.08 61.08 45.61 45.55 0.00 0.00
Average Service 1.65 0.00 4.21 4.67 4.25 4.25 4.26 5.00 0.00 0.00
Total Inactive
Number 1 0 11 12 1 1 61 68 1 1
Average Age 56.97 0.00 44.20 40.12 60.08 61.08 45.51 45.19 55.44 56.44
Average Service 1.65 0.00 6.32 7.09 4.25 4.25 4.72 5.21 2.37 2.37
Safety
Tier 2B Tier 3
Safety
Tier 1A
Safety Safety
Tier 2A Tier 1B
Safety

MARIN COUNTY EMPLOYEES’ RETIREMENT ASSOCIATION
ACTUARIAL VALUATION REPORT AS OF JUNE 30, 2015
APPENDIX A - MEMBERSHIP INFORMATION
42
Participant Data as of June 30, 2015: Marin Special Districts
Court Tier 1 Court Tier 2 Court Tier 3 Court Tier 4 Court Tier 5 Marin City CSD
Miscellaneous Miscellaneous Miscellaneous Miscellaneous Miscellaneous Total Miscellaneous
6/30/2014 6/30/2015 6/30/2014 6/30/2015 6/30/2014 6/30/2015 6/30/2014 6/30/2015 6/30/2014 6/30/2015 6/30/2014 6/30/2015 6/30/2014 6/30/2015
Active Participants
Number 3 3 3 1 98 88 5 4 4 6 113 102 5 5
Average Age 57.23 58.23 60.65 47.60 51.26 52.22 46.30 49.50 50.11 49.30 51.40 52.08 48.65 49.65
Average Service 28.05 29.06 13.19 14.02 13.56 14.49 6.50 7.75 0.41 0.95 13.16 13.85 7.86 8.80
Average Pay* $131,247 $137,109 $57,883 $54,245 $69,731 $70,352 $59,297 $63,226 $47,618 $39,195 $69,805 $70,046 $54,757 $56,255
Service Retired
Number 16 16 10 11 41 49 0 0 0 0 67 76 0 0
Average Age 68.13 69.13 76.13 76.73 64.73 64.94 0.00 0.00 0.00 0.00 67.24 67.53 0.00 0.00
Average Total Benefit* $57,959 $59,697 $35,027 $34,203 $27,466 $27,085 $0 $0 $0 $0 $35,876 $34,981 $0 $0
Beneficiaries
Number 0 0 0 0 3 3 0 0 0 0 3 3 1 1
Average Age 0.00 0.00 0.00 0.00 63.99 64.99 0.00 0.00 0.00 0.00 63.99 64.99 79.31 80.31
Average Total Benefit* $0 $0 $0 $0 $15,096 $15,398 $0 $0 $0 $0 $15,096 $15,398 $23,619 $24,327
Duty Disabled
Number 0 0 0 0 0 0 0 0 0 0 0 0 0 0
Average Age 0.00 0.00 0.00 0.00 0.00 0.00 0.00 0.00 0.00 0.00 0.00 0.00 0.00 0.00
Average Total Benefit* $0 $0 $0 $0 $0 $0 $0 $0 $0 $0 $0 $0 $0 $0
Ordinary Disabled
Number 0 0 1 1 2 2 0 0 0 0 3 3 0 0
Average Age 0.00 0.00 67.71 68.71 60.96 61.96 0.00 0.00 0.00 0.00 63.21 64.21 0.00 0.00
Average Total Benefit* $0 $0 $13,045 $13,306 $30,885 $31,502 $0 $0 $0 $0 $24,938 $25,437 $0 $0
Total In Pay
Number 16 16 11 12 46 54 0 0 0 0 73 82 1 1
Average Age 68.13 69.13 75.37 76.06 64.51 64.84 0.00 0.00 0.00 0.00 66.94 67.32 79.31 80.31
Average Total Benefit* $57,959 $59,697 $33,028 $32,461 $26,808 $26,600 $0 $0 $0 $0 $34,573 $33,916 $23,619 $24,327
Terminated Vested
Number 0 0 0 1 13 14 0 1 0 0 13 16 0 0
Average Age 0.00 0.00 0.00 64.65 48.05 46.07 0.00 38.51 0.00 0.00 48.05 46.76 0.00 0.00
Average Service 0.00 0.00 0.00 14.91 6.41 8.64 0.00 6.14 0.00 0.00 6.41 8.87 0.00 0.00
Transfers
Number 0 0 2 2 19 21 1 1 0 0 22 24 0 0
Average Age 0.00 0.00 57.44 58.44 49.14 49.40 27.81 28.81 0.00 0.00 48.93 49.30 0.00 0.00
Average Service 0.00 0.00 3.53 3.53 4.59 5.35 2.04 2.04 0.00 0.00 4.37 5.06 0.00 0.00
Total Inactive
Number 0 0 2 3 32 35 1 2 0 0 35 40 0 0
Average Age 0.00 0.00 57.44 60.51 48.70 48.07 27.81 33.66 0.00 0.00 48.60 48.28 0.00 0.00
Average Service 0.00 0.00 3.53 7.32 5.33 6.67 2.04 4.09 0.00 0.00 5.13 6.59 0.00 0.00

MARIN COUNTY EMPLOYEES’ RETIREMENT ASSOCIATION
ACTUARIAL VALUATION REPORT AS OF JUNE 30, 2015
APPENDIX A - MEMBERSHIP INFORMATION
43
Participant Data as of June 30,2015: Marin Special Districts
Southern Marin Fire Southern Marin Fire Mosquito District LAFCO Tamalpais CSD
Miscellaneous Safety Total Miscellaneous Miscellaneous Miscellaneous
6/30/2014 6/30/2015 6/30/2014 6/30/2015 6/30/2014 6/30/2015 6/30/2014 6/30/2015 6/30/2014 6/30/2015 6/30/2014 6/30/2015
Active Participants
Number 1 1 49 49 50 50 34 33 2 2 11 11
Average Age 52.41 53.41 41.61 41.92 41.83 42.15 49.10 49.93 41.14 42.14 51.92 52.92
Average Service 9.91 10.91 7.58 7.65 7.62 7.72 12.09 12.63 4.34 5.25 12.30 13.34
Average Pay* $79,782 $86,498 $98,396 $103,369 $98,024 $103,032 $86,505 $88,908 $92,993 $94,595 $75,472 $78,593
Service Retired
Number 3 3 20 22 23 25 13 13 3 4 6 6
Average Age 68.17 69.17 61.05 61.88 61.98 62.75 65.35 64.87 64.42 62.07 67.52 68.52
Average Total Benefit* $23,290 $23,989 $67,734 $73,717 $61,937 $67,750 $54,840 $56,486 $19,281 $15,602 $25,964 $26,743
Beneficiaries
Number 0 0 10 9 10 9 3 3 0 0 1 1
Average Age 0.00 0.00 66.68 64.86 66.68 64.86 69.64 70.64 0.00 0.00 77.92 78.92
Average Total Benefit* $0 $0 $40,288 $40,435 $40,288 $40,435 $16,085 $16,581 $0 $0 $23,250 $23,948
Duty Disabled
Number 1 1 16 16 17 17 1 1 0 0 1 1
Average Age 70.28 71.28 63.42 64.42 63.82 64.82 69.91 70.91 0.00 0.00 42.31 43.31
Average Total Benefit* $3,904 $4,021 $50,272 $51,780 $47,545 $48,971 $32,740 $33,722 $0 $0 $26,470 $27,264
Ordinary Disabled
Number 0 0 1 1 1 1 0 0 0 0 0 0
Average Age 0.00 0.00 54.21 55.21 54.21 55.21 0.00 0.00 0.00 0.00 0.00 0.00
Average Total Benefit* $0 $0 $52,680 $54,260 $52,680 $54,260 $0 $0 $0 $0 $0 $0
Total In Pay
Number 4 4 47 48 51 52 17 17 3 4 8 8
Average Age 68.70 69.70 62.91 63.15 63.36 63.65 66.38 66.24 64.42 62.07 65.67 66.67
Average Total Benefit* $18,443 $18,997 $55,630 $59,759 $52,713 $56,623 $46,701 $48,105 $19,281 $15,602 $25,688 $26,459
Terminated Vested
Number 1 1 3 3 4 4 0 0 1 0 0 0
Average Age 70.85 71.85 48.85 49.85 54.35 55.35 0.00 0.00 51.02 0.00 0.00 0.00
Average Service 8.92 8.92 2.24 2.24 3.91 3.91 0.00 0.00 3.18 0.00 0.00 0.00
Transfers
Number 0 0 16 16 16 16 1 1 0 0 2 2
Average Age 0.00 0.00 44.53 45.53 44.53 45.53 48.03 49.03 0.00 0.00 58.08 59.08
Average Service 0.00 0.00 5.81 5.81 5.81 5.81 11.00 11.00 0.00 0.00 7.70 7.70
Total Inactive
Number 1 1 19 19 20 20 1 1 1 0 2 2
Average Age 70.85 71.85 45.21 46.21 46.49 47.49 48.03 49.03 51.02 0.00 58.08 59.08
Average Service 8.92 8.92 5.25 5.25 5.43 5.43 11.00 11.00 3.18 0.00 7.70 7.70

MARIN COUNTY EMPLOYEES’ RETIREMENT ASSOCIATION
ACTUARIAL VALUATION REPORT AS OF JUNE 30, 2015
APPENDIX A - MEMBERSHIP INFORMATION
44
Participant Data as of June 30, 2015: Novato Fire Protection District
Miscellaneous Safety Total
6/30/2014 6/30/2015 6/30/2014 6/30/2015 6/30/2014 6/30/2015
Active Participants
Number 9 8 66 67 75 75
Average Age 49.62 48.62 41.85 42.57 42.78 43.22
Average Service 10.53 11.21 12.55 13.35 12.31 13.12
Average Pay* $90,563 $102,163 $114,260 $119,915 $111,417 $118,021
Service Retired
Number 2 3 51 52 53 55
Average Age 62.42 64.48 64.59 65.55 64.51 65.49
Average Total Benefit* $51,324 $42,542 $92,578 $93,708 $91,021 $90,917
Beneficiaries
Number 1 1 15 15 16 16
Average Age 50.67 51.67 62.91 63.91 62.21 63.14
Average Total Benefit* $10,616 $10,934 $39,437 $40,620 $37,636 $38,765
Duty Disabled
Number 0 0 31 31 31 31
Average Age 0.00 0.00 66.47 67.47 66.47 67.47
Average Total Benefit* $0 $0 $62,003 $63,841 $62,003 $63,841
Ordinary Disabled
Number 0 0 0 0 0 0
Average Age 0.00 0.00 0.00 0.00 0.00 0.00
Average Total Benefit* $0 $0 $0 $0 $0 $0
Total In Pay
Number 3 4 97 98 100 102
Average Age 58.50 61.28 64.93 65.91 64.75 65.73
Average Total Benefit* $37,755 $34,640 $74,589 $76,135 $73,484 $74,507
Terminated Vested
Number 1 1 3 2 4 3
Average Age 55.56 56.56 51.70 47.21 52.66 50.32
Average Service 6.16 6.16 4.94 4.82 5.24 5.26
Transfers
Number 1 1 10 11 11 12
Average Age 51.73 52.73 42.54 43.08 43.38 43.88
Average Service 1.25 1.25 3.12 3.14 2.95 2.98
Total Inactive
Number 2 2 13 13 15 15
Average Age 53.65 54.65 44.65 43.71 45.85 45.17
Average Service 3.71 3.71 3.54 3.39 3.56 3.44

MARIN COUNTY EMPLOYEES’ RETIREMENT ASSOCIATION
ACTUARIAL VALUATION REPORT AS OF JUNE 30, 2015
APPENDIX A - MEMBERSHIP INFORMATION
45
Participant Data as of June 30, 2015: City of San Rafael
Miscellaneous Police Fire Total Safety Total
6/30/2014 6/30/2015 6/30/2014 6/30/2015 6/30/2014 6/30/2015 6/30/2014 6/30/2015 6/30/2014 6/30/2015
Active Participants
Number 217 221 70 73 59 55 129 128 346 349
Average Age 48.03 47.62 38.88 39.21 40.39 40.39 39.57 39.72 44.87 44.73
Average Service 11.11 10.95 10.05 10.61 10.48 10.42 10.24 10.53 10.79 10.79
Average Pay* $74,713 $75,321 $109,030 $112,143 $120,957 $124,551 $114,485 $117,475 $89,541 $90,781
Service Retired
Number 211 222 70 73 79 82 149 155 360 377
Average Age 68.78 68.85 64.53 64.61 66.53 66.77 65.59 65.75 67.46 67.58
Average Total Benefit* $31,917 $33,607 $64,326 $64,828 $82,667 $86,377 $74,050 $76,228 $49,356 $51,130
Beneficiaries
Number 39 36 17 16 22 20 39 36 78 72
Average Age 76.17 75.60 69.97 68.41 70.51 69.97 70.27 69.28 73.22 72.44
Average Total Benefit* $14,279 $15,781 $27,305 $31,046 $34,293 $36,681 $31,247 $34,176 $22,763 $24,979
Duty Disabled
Number 18 18 40 38 21 21 61 59 79 77
Average Age 64.21 65.04 60.39 60.75 64.81 65.76 61.91 62.53 62.43 63.12
Average Total Benefit* $25,533 $26,299 $49,089 $51,826 $76,923 $79,231 $58,671 $61,581 $51,121 $53,333
Ordinary Disabled
Number 2 2 0 0 0 0 0 0 2 2
Average Age 81.45 82.45 0.00 0.00 0.00 0.00 0.00 0.00 81.45 82.45
Average Total Benefit* $11,082 $11,415 $0 $0 $0 $0 $0 $0 $11,082 $11,415
Total In Pay
Number 270 278 127 127 122 123 249 250 519 528
Average Age 69.63 69.58 63.95 63.93 66.95 67.12 65.42 65.50 67.61 67.65
Average Total Benefit* $28,789 $30,665 $54,571 $56,682 $72,955 $77,077 $63,579 $66,716 $45,480 $47,735
Terminated Vested
Number 25 27 7 7 2 2 9 9 34 36
Average Age 49.30 49.77 47.33 48.33 51.33 52.33 48.22 49.22 49.01 49.63
Average Service 7.03 6.00 9.55 9.55 4.99 4.99 8.54 8.54 7.43 6.63
Transfers
Number 56 53 24 20 6 7 30 27 86 80
Average Age 46.59 46.65 47.66 47.88 42.87 45.97 46.70 47.38 46.63 46.90
Average Service 3.52 2.83 6.17 5.65 5.40 5.06 6.02 5.50 4.39 3.73
Total Inactive
Number 81 80 31 27 8 9 39 36 120 116
Average Age 47.42 47.71 47.59 48.00 44.98 47.38 47.05 47.84 47.30 47.75
Average Service 4.60 3.90 6.94 6.66 5.30 5.04 6.60 6.26 5.25 4.63

MARIN COUNTY EMPLOYEES’ RETIREMENT ASSOCIATION
ACTUARIAL VALUATION REPORT AS OF JUNE 30, 2015
APPENDIX A - MEMBERSHIP INFORMATION
46
Participant Data as of June 30, 2015: City of San Rafael
Tier 1 Tier 2 Tier 3 Tier 1 Tier 2 Tier 3 Tier 1 Tier 2
Miscellaneous Miscellaneous Miscellaneous Police Police Safety Fire Fire
6/30/2014 6/30/2015 6/30/2014 6/30/2015 6/30/2014 6/30/2015 6/30/2014 6/30/2015 6/30/2014 6/30/2015 6/30/2014 6/30/2015 6/30/2014 6/30/2015 6/30/2014 6/30/2015
Active Participants
Number 181 167 20 18 16 36 53 53 4 5 13 15 45 41 14 14
Average Age 50.08 50.99 39.28 39.97 35.71 35.85 41.52 42.52 36.53 35.64 28.86 28.73 43.38 43.38 30.78 31.66
Average Service 13.08 14.02 1.64 2.40 0.69 0.97 12.92 13.93 1.78 2.41 0.90 1.60 13.13 13.00 1.93 2.86
Average Pay* $78,021 $79,472 $65,956 $65,324 $48,231 $61,063 $116,111 $118,943 $111,574 $113,827 $79,375 $87,556 $128,202 $130,608 $97,672 $106,812
Service Retired
Number 211 222 0 0 0 0 70 73 0 0 0 0 79 82 0 0
Average Age 68.78 68.85 0.00 0.00 0.00 0.00 64.53 64.61 0.00 0.00 0.00 0.00 66.53 66.77 0.00 0.00
Average Total Benefit* $31,917 $33,607 $0 $0 $0 $0 $64,326 $64,828 $0 $0 $0 $0 $82,667 $86,377 $0 $0
Beneficiaries
Number 39 36 0 0 0 0 17 16 0 0 0 0 22 20 0 0
Average Age 76.17 75.60 0.00 0.00 0.00 0.00 69.97 68.41 0.00 0.00 0.00 0.00 70.51 69.97 0.00 0.00
Average Total Benefit* $14,279 $15,781 $0 $0 $0 $0 $27,305 $31,046 $0 $0 $0 $0 $34,293 $36,681 $0 $0
Duty Disabled
Number 18 18 0 0 0 0 40 38 0 0 0 0 21 21 0 0
Average Age 64.21 65.04 0.00 0.00 0.00 0.00 60.39 60.75 0.00 0.00 0.00 0.00 64.81 65.76 0.00 0.00
Average Total Benefit* $25,533 $26,299 $0 $0 $0 $0 $49,089 $51,826 $0 $0 $0 $0 $76,923 $79,231 $0 $0
Ordinary Disabled
Number 2 2 0 0 0 0 0 0 0 0 0 0 0 0 0 0
Average Age 81.45 82.45 0.00 0.00 0.00 0.00 0.00 0.00 0.00 0.00 0.00 0.00 0.00 0.00 0.00 0.00
Average Total Benefit* $11,082 $11,415 $0 $0 $0 $0 $0 $0 $0 $0 $0 $0 $0 $0 $0 $0
Total In Pay
Number 270 278 0 0 0 0 127 127 0 0 0 0 122 123 0 0
Average Age 69.63 69.58 0.00 0.00 0.00 0.00 63.95 63.93 0.00 0.00 0.00 0.00 66.95 67.12 0.00 0.00
Average Total Benefit* $28,789 $30,665 $0 $0 $0 $0 $54,571 $56,682 $0 $0 $0 $0 $72,955 $77,077 $0 $0
Terminated Vested
Number 25 26 0 1 0 0 7 7 0 0 0 0 2 2 0 0
Average Age 49.30 50.31 0.00 35.83 0.00 0.00 47.33 48.33 0.00 0.00 0.00 0.00 51.33 52.33 0.00 0.00
Average Service 7.03 6.15 0.00 2.10 0.00 0.00 9.55 9.55 0.00 0.00 0.00 0.00 4.99 4.99 0.00 0.00
Transfers
Number 53 49 2 2 1 2 24 20 0 0 0 0 6 7 0 0
Average Age 47.14 46.90 41.21 47.44 27.81 39.95 47.66 47.88 0.00 0.00 0.00 0.00 42.87 45.97 0.00 0.00
Average Service 3.66 2.96 1.52 2.46 0.09 0.25 6.17 5.65 0.00 0.00 0.00 0.00 5.40 5.06 0.00 0.00
Total Inactive
Number 78 75 2 3 1 2 31 27 0 0 0 0 8 9 0 0
Average Age 47.83 48.08 41.21 43.57 27.81 39.95 47.59 48.00 0.00 0.00 0.00 0.00 44.98 47.38 0.00 0.00
Average Service 4.74 4.06 1.52 2.34 0.09 0.25 6.94 6.66 0.00 0.00 0.00 0.00 5.30 5.04 0.00 0.00

MARIN COUNTY EMPLOYEES’ RETIREMENT ASSOCIATION
ACTUARIAL VALUATION REPORT AS OF JUNE 30, 2015
APPENDIX A - MEMBERSHIP INFORMATION
47
MARIN COUNTY MARIN COUNTY
DISTRIBUTION OF MISCELLANEOUS ACTIVE MEMBERS DISTRIB
BY AGE AND SERVICE AS OF JULY 1, 2015 PAYROL
COUNTS BY AGE/SERVICE AVERAGE PAY BY AGE/SERVICE
Service Service
Age 0 1 2 3 4 5 to 9 10 to 14 15 to 19 20 to 24 25 to 29 30 to 34 35 & up Total
0 to 19 0 0 0 0 0 0 0 0 0 0 0 0 0
20 to 24 5 3 1 1 0 0 0 0 0 0 0 0 10
25 to 29 31 33 7 5 2 4 1 0 0 0 0 0 83
30 to 34 35 22 17 7 8 44 6 0 0 0 0 0 139
35 to 39 24 26 12 12 3 58 31 2 0 0 0 0 168
40 to 44 18 18 11 8 5 63 47 24 2 0 0 0 196
45 to 49 15 12 9 9 5 52 43 40 15 4 0 0 204
50 to 54 15 10 15 13 4 45 67 45 27 17 7 0 265
55 to 59 12 12 5 8 2 38 63 51 22 15 7 5 240
60 to 64 6 5 4 8 0 49 45 35 16 21 12 2 203
65 to 69 0 3 0 1 0 16 30 27 6 4 6 4 97
70 & up 0 0 0 0 0 1 9 2 2 4 0 0 18
Total 161 144 81 72 29 370 342 226 90 65 32 11 1,623
MARIN COUNTY MARIN COUNTY
DISTRIBUTION OF MISCELLANEOUS ACTIVE MEMBERS DISTRIB
PAYROLL BY AGE AND SERVICE AS OF JULY 1, 2015 BY AGE
AVERAGE PAY BY AGE/SERVICE COUNTS BY AGE/SERVICE
Service Service
Age 0 1 2 3 4 5 to 9 10 to 14 15 to 19 20 to 24 25 to 29 30 to 34 35 & up Total
0 to 19 0 0 0 0 0 0 0 0 0 0 0 0 0
20 to 24 61,768 58,104 52,455 74,630 0 0 0 0 0 0 0 0 61,024
25 to 29 57,699 63,140 57,482 77,253 56,206 78,122 62,303 0 0 0 0 0 62,026
30 to 34 62,099 70,374 66,830 74,982 84,717 79,721 71,683 0 0 0 0 0 71,930
35 to 39 64,950 73,466 73,673 71,799 74,649 84,482 83,367 93,832 0 0 0 0 78,039
40 to 44 63,869 66,420 76,955 72,641 108,573 84,131 84,653 84,256 80,219 0 0 0 80,496
45 to 49 67,091 78,095 89,807 88,564 77,320 87,872 103,161 87,450 88,399 67,423 0 0 88,404
50 to 54 87,594 71,100 77,643 79,287 92,954 76,922 81,394 83,590 89,075 92,968 81,613 0 82,360
55 to 59 86,817 80,542 93,062 80,945 140,136 90,837 84,156 87,154 88,860 102,663 105,077 81,324 88,487
60 to 64 84,339 63,570 78,450 67,524 0 80,724 85,121 89,172 101,869 97,990 97,828 140,691 87,329
65 to 69 0 111,767 0 115,264 0 78,579 79,438 81,314 69,874 84,509 64,766 114,297 81,335
70 & up 0 0 0 0 0 117,151 57,180 58,105 82,538 71,081 0 0 66,521
Total 67,376 70,692 74,982 77,213 89,505 83,332 84,722 85,606 89,562 93,389 89,668 104,108 81,673

MARIN COUNTY EMPLOYEES’ RETIREMENT ASSOCIATION
ACTUARIAL VALUATION REPORT AS OF JUNE 30, 2015
APPENDIX A - MEMBERSHIP INFORMATION
48
MARIN COUNTY MARIN COUNTY
DISTRIBUTION OF SAFETY ACTIVE MEMBERS DISTRIB
BY AGE AND SERVICE AS OF JULY 1, 2015 PAYROL
COUNTS BY AGE/SERVICE AVERAGE PAY BY AGE/SERVICE
Service Service
Age 0 1 2 3 4 5 to 9 10 to 14 15 to 19 20 to 24 25 to 29 30 to 34 35 & up Total
0 to 19 0 0 0 0 0 0 0 0 0 0 0 0 0
20 to 24 11 2 0 1 0 0 0 0 0 0 0 0 14
25 to 29 10 4 5 7 0 5 0 0 0 0 0 0 31
30 to 34 17 1 7 8 5 17 5 0 0 0 0 0 60
35 to 39 0 0 6 2 4 18 29 5 0 0 0 0 64
40 to 44 2 1 0 0 0 11 22 19 5 0 0 0 60
45 to 49 2 0 0 1 0 12 11 17 15 6 0 0 64
50 to 54 1 1 0 1 0 3 7 6 12 5 1 0 37
55 to 59 0 0 0 1 0 4 2 2 1 5 1 0 16
60 to 64 0 0 0 0 0 1 6 1 2 0 0 0 10
65 to 69 0 0 0 0 0 0 2 0 0 0 1 0 3
70 & up 0 0 0 0 0 0 0 0 0 0 0 0 0
Total 43 9 18 21 9 71 84 50 35 16 3 0 359
MARIN COUNTY MARIN SPECIAL DISTRICTS
DISTRIBUTION OF SAFETY ACTIVE MEMBERS DISTRIB
PAYROLL BY AGE AND SERVICE AS OF JULY 1, 2015 BY AGE
AVERAGE PAY BY AGE/SERVICE COUNTS BY AGE/SERVICE
Service Service
Age 0 1 2 3 4 5 to 9 10 to 14 15 to 19 20 to 24 25 to 29 30 to 34 35 & up Total
0 to 19 0 0 0 0 0 0 0 0 0 0 0 0 0
20 to 24 70,027 58,885 0 77,322 0 0 0 0 0 0 0 0 68,956
25 to 29 70,095 79,940 89,197 88,850 0 98,025 0 0 0 0 0 0 83,186
30 to 34 70,769 80,870 76,384 89,748 92,049 102,727 97,652 0 0 0 0 0 87,191
35 to 39 0 0 81,786 79,859 94,770 101,978 105,843 129,888 0 0 0 0 102,875
40 to 44 77,736 78,949 0 0 0 105,269 105,345 115,623 123,166 0 0 0 108,711
45 to 49 136,805 0 0 103,832 0 108,753 108,877 107,930 120,036 123,553 0 0 113,387
50 to 54 75,504 89,128 0 159,451 0 141,090 101,752 114,117 115,936 130,724 181,314 0 118,121
55 to 59 0 0 0 108,246 0 108,169 92,920 125,145 151,892 131,196 146,214 0 120,696
60 to 64 0 0 0 0 0 111,301 95,496 81,016 93,868 0 0 0 95,303
65 to 69 0 0 0 0 0 0 89,377 0 0 0 214,061 0 130,939
70 & up 0 0 0 0 0 0 0 0 0 0 0 0 0
Total 73,928 76,275 81,744 92,786 93,258 105,666 103,843 113,942 118,492 128,182 180,529 0 102,469

MARIN COUNTY EMPLOYEES’ RETIREMENT ASSOCIATION
ACTUARIAL VALUATION REPORT AS OF JUNE 30, 2015
APPENDIX A - MEMBERSHIP INFORMATION
49
MARIN SPECIAL DISTRICTS MARIN SPECIAL DISTRICTS
DISTRIBUTION OF MISCELLANEOUS ACTIVE MEMBERS DISTRIB
BY AGE AND SERVICE AS OF JULY 1, 2015 PAYROL
COUNTS BY AGE/SERVICE AVERAGE PAY BY AGE/SERVICE
Service Service
Age 0 1 2 3 4 5 to 9 10 to 14 15 to 19 20 to 24 25 to 29 30 to 34 35 & up Total
0 to 19 0 0 0 0 0 0 0 0 0 0 0 0 0
20 to 24 0 0 0 0 0 0 0 0 0 0 0 0 0
25 to 29 1 2 0 0 0 0 0 0 0 0 0 0 3
30 to 34 0 1 0 0 0 3 1 0 0 0 0 0 5
35 to 39 0 1 0 1 2 6 8 2 0 0 0 0 20
40 to 44 0 0 0 0 1 4 8 4 0 0 0 0 17
45 to 49 0 0 0 0 1 4 9 1 2 0 0 0 17
50 to 54 1 0 0 1 0 2 14 4 3 2 1 0 28
55 to 59 1 0 0 1 0 3 13 5 3 2 4 2 34
60 to 64 1 0 0 0 0 4 4 5 0 1 0 0 15
65 to 69 0 1 0 0 0 3 1 3 1 1 0 0 10
70 & up 0 0 0 0 1 2 1 0 1 0 0 0 5
Total 4 5 0 3 5 31 59 24 10 6 5 2 154
MARIN SPECIAL DISTRICTS MARIN SPECIAL DISTRICTS
DISTRIBUTION OF MISCELLANEOUS ACTIVE MEMBERS DISTRIB
PAYROLL BY AGE AND SERVICE AS OF JULY 1, 2015 BY AGE
AVERAGE PAY BY AGE/SERVICE COUNTS BY AGE/SERVICE
Service Service
Age 0 1 2 3 4 5 to 9 10 to 14 15 to 19 20 to 24 25 to 29 30 to 34 35 & up Total
0 to 19 0 0 0 0 0 0 0 0 0 0 0 0 0
20 to 24 0 0 0 0 0 0 0 0 0 0 0 0 0
25 to 29 38,649 46,267 0 0 0 0 0 0 0 0 0 0 43,728
30 to 34 0 64,657 0 0 0 66,554 53,187 0 0 0 0 0 63,501
35 to 39 0 117,478 0 38,569 52,809 67,662 77,647 83,298 0 0 0 0 72,771
40 to 44 0 0 0 0 45,552 65,263 67,567 73,056 0 0 0 0 67,021
45 to 49 0 0 0 0 87,635 78,671 67,747 53,714 76,407 0 0 0 71,681
50 to 54 38,649 0 0 81,706 0 47,663 77,850 77,981 83,830 107,738 60,353 0 76,601
55 to 59 38,649 0 0 160,930 0 62,124 71,042 132,020 98,856 54,187 74,692 91,010 83,980
60 to 64 41,925 0 0 0 0 71,198 97,873 82,331 0 74,450 0 0 80,288
65 to 69 0 38,649 0 0 0 77,777 84,283 62,715 60,246 69,011 0 0 67,366
70 & up 0 0 0 0 29,536 92,911 75,546 0 69,011 0 0 0 71,983
Total 39,468 62,664 0 93,735 53,668 69,904 74,397 86,848 83,013 77,885 71,824 91,010 74,676

MARIN COUNTY EMPLOYEES’ RETIREMENT ASSOCIATION
ACTUARIAL VALUATION REPORT AS OF JUNE 30, 2015
APPENDIX A - MEMBERSHIP INFORMATION
50
MARIN SPECIAL DISTRICTS MARIN SPECIAL DISTRICTS
DISTRIBUTION OF SAFETY ACTIVE MEMBERS DISTRIB
BY AGE AND SERVICE AS OF JULY 1, 2015 PAYROL
COUNTS BY AGE/SERVICE AVERAGE PAY BY AGE/SERVICE
Service Service
Age 0 1 2 3 4 5 to 9 10 to 14 15 to 19 20 to 24 25 to 29 30 to 34 35 & up Total
0 to 19 0 0 0 0 0 0 0 0 0 0 0 0 0
20 to 24 0 0 0 0 0 0 0 0 0 0 0 0 0
25 to 29 0 2 0 1 0 0 0 0 0 0 0 0 3
30 to 34 1 3 1 1 0 4 0 0 0 0 0 0 10
35 to 39 0 0 0 2 1 1 1 0 0 0 0 0 5
40 to 44 0 1 0 3 0 1 4 1 0 0 0 0 10
45 to 49 0 0 1 5 0 3 4 0 0 0 0 0 13
50 to 54 1 0 0 1 0 0 1 2 1 1 0 0 7
55 to 59 0 0 0 0 0 0 0 0 1 0 0 0 1
60 to 64 0 0 0 0 0 0 0 0 0 0 0 0 0
65 to 69 0 0 0 0 0 0 0 0 0 0 0 0 0
70 & up 0 0 0 0 0 0 0 0 0 0 0 0 0
Total 2 6 2 13 1 9 10 3 2 1 0 0 49
MARIN SPECIAL DISTRICTS NOVATO FIRE PROTECTION DISTRICT
DISTRIBUTION OF SAFETY ACTIVE MEMBERS DISTRIB
PAYROLL BY AGE AND SERVICE AS OF JULY 1, 2015 BY AGE
AVERAGE PAY BY AGE/SERVICE COUNTS BY AGE/SERVICE
Service Service
Age 0 1 2 3 4 5 to 9 10 to 14 15 to 19 20 to 24 25 to 29 30 to 34 35 & up Total
0 to 19 0 0 0 0 0 0 0 0 0 0 0 0 0
20 to 24 0 0 0 0 0 0 0 0 0 0 0 0 0
25 to 29 0 80,706 0 97,182 0 0 0 0 0 0 0 0 86,198
30 to 34 84,494 88,968 87,050 88,372 0 92,532 0 0 0 0 0 0 89,695
35 to 39 0 0 0 100,577 99,411 103,218 104,456 0 0 0 0 0 101,648
40 to 44 0 90,161 0 110,822 0 92,544 125,319 96,128 0 0 0 0 111,257
45 to 49 0 0 94,061 101,510 0 113,683 108,384 0 0 0 0 0 105,861
50 to 54 169,000 0 0 119,266 0 0 88,245 104,248 111,262 111,770 0 0 115,434
55 to 59 0 0 0 0 0 0 0 0 104,512 0 0 0 104,512
60 to 64 0 0 0 0 0 0 0 0 0 0 0 0 0
65 to 69 0 0 0 0 0 0 0 0 0 0 0 0 0
70 & up 0 0 0 0 0 0 0 0 0 0 0 0 0
Total 126,747 86,413 90,555 103,537 99,411 100,771 112,751 101,541 107,887 111,770 0 0 103,369

MARIN COUNTY EMPLOYEES’ RETIREMENT ASSOCIATION
ACTUARIAL VALUATION REPORT AS OF JUNE 30, 2015
APPENDIX A - MEMBERSHIP INFORMATION
51
NOVATO FIRE PROTECTION DISTRICT NOVATO FIRE PROTECTION DISTRICT
DISTRIBUTION OF MISCELLANEOUS ACTIVE MEMBERS DISTRIB
BY AGE AND SERVICE AS OF JULY 1, 2015 PAYROL
COUNTS BY AGE/SERVICE AVERAGE PAY BY AGE/SERVICE
Service Service
Age 0 1 2 3 4 5 to 9 10 to 14 15 to 19 20 to 24 25 to 29 30 to 34 35 & up Total
0 to 19 0 0 0 0 0 0 0 0 0 0 0 0 0
20 to 24 0 0 0 0 0 0 0 0 0 0 0 0 0
25 to 29 0 0 0 0 0 0 0 0 0 0 0 0 0
30 to 34 0 0 0 0 0 0 0 0 0 0 0 0 0
35 to 39 0 0 0 0 0 0 1 0 0 0 0 0 1
40 to 44 0 0 0 0 0 1 1 0 0 0 0 0 2
45 to 49 0 0 0 0 0 0 2 0 0 0 0 0 2
50 to 54 0 0 0 0 0 0 0 1 0 0 0 0 1
55 to 59 0 0 0 0 0 0 1 0 0 0 0 0 1
60 to 64 0 0 0 0 0 1 0 0 0 0 0 0 1
65 to 69 0 0 0 0 0 0 0 0 0 0 0 0 0
70 & up 0 0 0 0 0 0 0 0 0 0 0 0 0
Total 0 0 0 0 0 2 5 1 0 0 0 0 8
NOVATO FIRE PROTECTION DISTRICT NOVATO FIRE PROTECTION DISTRICT
DISTRIBUTION OF MISCELLANEOUS ACTIVE MEMBERS DISTRIB
PAYROLL BY AGE AND SERVICE AS OF JULY 1, 2015 BY AGE
AVERAGE PAY BY AGE/SERVICE COUNTS BY AGE/SERVICE
Service Service
Age 0 1 2 3 4 5 to 9 10 to 14 15 to 19 20 to 24 25 to 29 30 to 34 35 & up Total
0 to 19 0 0 0 0 0 0 0 0 0 0 0 0 0
20 to 24 0 0 0 0 0 0 0 0 0 0 0 0 0
25 to 29 0 0 0 0 0 0 0 0 0 0 0 0 0
30 to 34 0 0 0 0 0 0 0 0 0 0 0 0 0
35 to 39 0 0 0 0 0 0 70,640 0 0 0 0 0 70,640
40 to 44 0 0 0 0 0 113,136 69,483 0 0 0 0 0 91,309
45 to 49 0 0 0 0 0 0 96,445 0 0 0 0 0 96,445
50 to 54 0 0 0 0 0 0 0 82,108 0 0 0 0 82,108
55 to 59 0 0 0 0 0 0 154,758 0 0 0 0 0 154,758
60 to 64 0 0 0 0 0 134,292 0 0 0 0 0 0 134,292
65 to 69 0 0 0 0 0 0 0 0 0 0 0 0 0
70 & up 0 0 0 0 0 0 0 0 0 0 0 0 0
Total 0 0 0 0 0 123,714 97,554 82,108 0 0 0 0 102,163

MARIN COUNTY EMPLOYEES’ RETIREMENT ASSOCIATION
ACTUARIAL VALUATION REPORT AS OF JUNE 30, 2015
APPENDIX A - MEMBERSHIP INFORMATION
52
NOVATO FIRE PROTECTION DISTRICT NOVATO FIRE PROTECTION DISTRICT
DISTRIBUTION OF SAFETY ACTIVE MEMBERS DISTRIB
BY AGE AND SERVICE AS OF JULY 1, 2015 PAYROL
COUNTS BY AGE/SERVICE AVERAGE PAY BY AGE/SERVICE
Service Service
Age 0 1 2 3 4 5 to 9 10 to 14 15 to 19 20 to 24 25 to 29 30 to 34 35 & up Total
0 to 19 0 0 0 0 0 0 0 0 0 0 0 0 0
20 to 24 1 2 0 0 0 0 0 0 0 0 0 0 3
25 to 29 0 1 0 0 0 0 0 0 0 0 0 0 1
30 to 34 0 0 0 0 0 1 0 0 0 0 0 0 1
35 to 39 0 2 0 0 0 2 9 1 0 0 0 0 14
40 to 44 0 0 0 0 0 3 16 6 0 0 0 0 25
45 to 49 0 0 0 0 0 1 3 7 3 1 0 0 15
50 to 54 0 0 0 0 0 0 2 0 0 3 0 0 5
55 to 59 0 0 0 0 0 0 1 2 0 0 0 0 3
60 to 64 0 0 0 0 0 0 0 0 0 0 0 0 0
65 to 69 0 0 0 0 0 0 0 0 0 0 0 0 0
70 & up 0 0 0 0 0 0 0 0 0 0 0 0 0
Total 1 5 0 0 0 7 31 16 3 4 0 0 67
NOVATO FIRE PROTECTION DISTRICT CITY OF SAN RAFAEL
DISTRIBUTION OF SAFETY ACTIVE MEMBERS DISTRIB
PAYROLL BY AGE AND SERVICE AS OF JULY 1, 2015 BY AGE
AVERAGE PAY BY AGE/SERVICE COUNTS BY AGE/SERVICE
Service Service
Age 0 1 2 3 4 5 to 9 10 to 14 15 to 19 20 to 24 25 to 29 30 to 34 35 & up Total
0 to 19 0 0 0 0 0 0 0 0 0 0 0 0 0
20 to 24 94,259 100,519 0 0 0 0 0 0 0 0 0 0 98,433
25 to 29 0 100,519 0 0 0 0 0 0 0 0 0 0 100,519
30 to 34 0 0 0 0 0 107,964 0 0 0 0 0 0 107,964
35 to 39 0 100,519 0 0 0 108,264 112,049 131,226 0 0 0 0 111,231
40 to 44 0 0 0 0 0 107,364 111,881 117,778 0 0 0 0 112,754
45 to 49 0 0 0 0 0 108,399 111,629 129,165 169,423 201,178 0 0 137,126
50 to 54 0 0 0 0 0 0 146,091 0 0 154,646 0 0 151,224
55 to 59 0 0 0 0 0 0 109,117 116,138 0 0 0 0 113,798
60 to 64 0 0 0 0 0 0 0 0 0 0 0 0 0
65 to 69 0 0 0 0 0 0 0 0 0 0 0 0 0
70 & up 0 0 0 0 0 0 0 0 0 0 0 0 0
Total 94,259 100,519 0 0 0 107,855 114,023 123,395 169,423 166,279 0 0 119,915

MARIN COUNTY EMPLOYEES’ RETIREMENT ASSOCIATION
ACTUARIAL VALUATION REPORT AS OF JUNE 30, 2015
APPENDIX A - MEMBERSHIP INFORMATION
53
CITY OF SAN RAFAEL CITY OF SAN RAFAEL
DISTRIBUTION OF MISCELLANEOUS ACTIVE MEMBERS DISTRIB
BY AGE AND SERVICE AS OF JULY 1, 2015 PAYROL
COUNTS BY AGE/SERVICE AVERAGE PAY BY AGE/SERVICE
Service Service
Age 0 1 2 3 4 5 to 9 10 to 14 15 to 19 20 to 24 25 to 29 30 to 34 35 & up Total
0 to 19 0 0 0 0 0 0 0 0 0 0 0 0 0
20 to 24 1 1 0 1 0 0 0 0 0 0 0 0 3
25 to 29 7 3 2 4 1 0 0 0 0 0 0 0 17
30 to 34 5 2 4 2 1 3 2 0 0 0 0 0 19
35 to 39 4 2 3 0 3 9 3 0 0 0 0 0 24
40 to 44 2 2 1 0 1 9 9 3 0 0 0 0 27
45 to 49 1 1 0 0 0 8 7 8 4 0 0 0 29
50 to 54 3 0 1 1 2 3 4 8 3 7 2 0 34
55 to 59 0 1 0 0 0 10 9 11 2 5 0 0 38
60 to 64 0 1 0 1 0 5 6 6 1 1 1 0 22
65 to 69 0 0 0 0 0 1 2 2 0 0 0 0 5
70 & up 0 0 1 0 0 0 0 1 0 1 0 0 3
Total 23 13 12 9 8 48 42 39 10 14 3 0 221
CITY OF SAN RAFAEL CITY OF SAN RAFAEL
DISTRIBUTION OF MISCELLANEOUS ACTIVE MEMBERS DISTRIB
PAYROLL BY AGE AND SERVICE AS OF JULY 1, 2015 BY AGE
AVERAGE PAY BY AGE/SERVICE COUNTS BY AGE/SERVICE
Service Service
Age 0 1 2 3 4 5 to 9 10 to 14 15 to 19 20 to 24 25 to 29 30 to 34 35 & up Total
0 to 19 0 0 0 0 0 0 0 0 0 0 0 0 0
20 to 24 27,362 52,904 0 68,594 0 0 0 0 0 0 0 0 49,620
25 to 29 60,912 46,981 67,092 46,148 61,250 0 0 0 0 0 0 0 55,727
30 to 34 72,055 49,498 48,062 73,516 107,668 83,773 63,164 0 0 0 0 0 67,572
35 to 39 73,788 38,300 46,493 0 86,226 69,149 45,002 0 0 0 0 0 63,636
40 to 44 66,808 55,019 36,144 0 73,422 72,797 70,607 65,756 0 0 0 0 68,190
45 to 49 64,679 110,706 0 0 0 95,772 79,891 68,704 80,486 0 0 0 81,806
50 to 54 84,806 0 107,777 64,526 103,696 112,063 79,915 74,581 67,555 77,724 84,514 0 82,423
55 to 59 0 147,654 0 0 0 84,718 89,964 86,834 73,072 75,140 0 0 86,356
60 to 64 0 62,030 0 69,518 0 83,513 74,438 81,065 61,250 105,878 110,309 0 79,980
65 to 69 0 0 0 0 0 77,922 91,776 129,214 0 0 0 0 103,980
70 & up 0 0 27,377 0 0 0 0 62,498 0 71,808 0 0 53,894
Total 67,908 61,529 53,101 59,362 88,551 82,789 76,561 79,642 73,200 78,390 93,112 0 75,321

MARIN COUNTY EMPLOYEES’ RETIREMENT ASSOCIATION
ACTUARIAL VALUATION REPORT AS OF JUNE 30, 2015
APPENDIX A - MEMBERSHIP INFORMATION
54
CITY OF SAN RAFAEL CITY OF SAN RAFAEL
DISTRIBUTION OF POLICE ACTIVE MEMBERS DISTRIB
BY AGE AND SERVICE AS OF JULY 1, 2015 BY AGE
COUNTS BY AGE/SERVICE AVERAGE PAY BY AGE/SERVICE
Service Service
Age 0 1 2 3 4 5 to 9 10 to 14 15 to 19 20 to 24 25 to 29 30 to 34 35 & up Total
0 to 19 0 0 0 0 0 0 0 0 0 0 0 0 0
20 to 24 0 1 0 0 0 0 0 0 0 0 0 0 1
25 to 29 3 5 3 1 0 0 0 0 0 0 0 0 12
30 to 34 1 0 3 0 0 7 1 0 0 0 0 0 12
35 to 39 0 0 1 1 0 4 6 0 0 0 0 0 12
40 to 44 0 0 0 0 0 4 9 4 0 0 0 0 17
45 to 49 0 0 0 0 0 2 2 3 3 0 0 0 10
50 to 54 0 0 0 1 0 0 0 2 0 3 0 0 6
55 to 59 0 0 0 0 0 0 0 1 0 0 1 0 2
60 to 64 0 0 0 0 0 1 0 0 0 0 0 0 1
65 to 69 0 0 0 0 0 0 0 0 0 0 0 0 0
70 & up 0 0 0 0 0 0 0 0 0 0 0 0 0
Total 4 6 7 3 0 18 18 10 3 3 1 0 73
CITY OF SAN RAFAEL
DISTRIBUTION OF POLICE ACTIVE MEMBERS
BY AGE AND SERVICE AS OF JULY 1, 2015
AVERAGE PAY BY AGE/SERVICE
Service
Age 0 1 2 3 4 5 to 9 10 to 14 15 to 19 20 to 24 25 to 29 30 to 34 35 & up Total
0 to 19 0 0 0 0 0 0 0 0 0 0 0 0 0
20 to 24 0 75,715 0 0 0 0 0 0 0 0 0 0 75,715
25 to 29 84,748 93,936 86,366 93,387 0 0 0 0 0 0 0 0 89,700
30 to 34 85,191 0 91,027 0 0 107,094 112,710 0 0 0 0 0 101,720
35 to 39 0 0 98,452 101,792 0 111,276 123,841 0 0 0 0 0 115,700
40 to 44 0 0 0 0 0 114,350 115,011 131,412 0 0 0 0 118,714
45 to 49 0 0 0 0 0 103,994 113,570 118,547 142,267 0 0 0 121,757
50 to 54 0 0 0 171,831 0 0 0 142,335 0 121,730 0 0 136,948
55 to 59 0 0 0 0 0 0 0 129,492 0 0 127,218 0 128,355
60 to 64 0 0 0 0 0 111,179 0 0 0 0 0 0 111,179
65 to 69 0 0 0 0 0 0 0 0 0 0 0 0 0
70 & up 0 0 0 0 0 0 0 0 0 0 0 0 0
Total 84,859 90,899 90,090 122,336 0 109,518 117,666 129,545 142,267 121,730 127,218 0 112,143

MARIN COUNTY EMPLOYEES’ RETIREMENT ASSOCIATION
ACTUARIAL VALUATION REPORT AS OF JUNE 30, 2015
APPENDIX A - MEMBERSHIP INFORMATION
55
CITY OF SAN RAFAEL CITY OF SAN RAFAEL
DISTRIBUTION OF FIRE ACTIVE MEMBERS DISTRIB
BY AGE AND SERVICE AS OF JULY 1, 2015 PAYROL
AVERAGE PAY BY AGE/SERVICE AVERAGE PAY BY AGE/SERVICE
Service Service
Age 0 1 2 3 4 5 to 9 10 to 14 15 to 19 20 to 24 25 to 29 30 to 34 35 & up Total
0 to 19 0 0 0 0 0 0 0 0 0 0 0 0 0
20 to 24 0 0 0 0 0 0 0 0 0 0 0 0 0
25 to 29 0 0 3 3 0 1 0 0 0 0 0 0 7
30 to 34 1 0 2 3 2 6 0 0 0 0 0 0 14
35 to 39 0 0 2 0 1 3 2 1 0 0 0 0 9
40 to 44 0 0 0 0 1 0 2 3 0 0 0 0 6
45 to 49 0 0 0 0 0 1 5 2 2 0 0 0 10
50 to 54 0 0 0 0 0 1 1 1 0 2 0 0 5
55 to 59 0 0 0 0 0 1 0 1 0 2 0 0 4
60 to 64 0 0 0 0 0 0 0 0 0 0 0 0 0
65 to 69 0 0 0 0 0 0 0 0 0 0 0 0 0
70 & up 0 0 0 0 0 0 0 0 0 0 0 0 0
Total 1 0 7 6 4 13 10 8 2 4 0 0 55
CITY OF SAN RAFAEL
DISTRIBUTION OF FIRE ACTIVE MEMBERS
PAYROLL BY AGE AND SERVICE AS OF JULY 1, 2015
AVERAGE PAY BY AGE/SERVICE
Service
Age 0 1 2 3 4 5 to 9 10 to 14 15 to 19 20 to 24 25 to 29 30 to 34 35 & up Total
0 to 19 0 0 0 0 0 0 0 0 0 0 0 0 0
20 to 24 0 0 0 0 0 0 0 0 0 0 0 0 0
25 to 29 0 0 103,956 113,252 0 131,119 0 0 0 0 0 0 111,821
30 to 34 87,693 0 111,352 107,306 125,019 122,977 0 0 0 0 0 0 115,729
35 to 39 0 0 105,714 0 113,895 127,515 144,749 144,387 0 0 0 0 126,861
40 to 44 0 0 0 0 129,217 0 130,571 127,796 0 0 0 0 128,958
45 to 49 0 0 0 0 0 120,528 129,516 134,747 146,050 0 0 0 132,970
50 to 54 0 0 0 0 0 113,820 136,316 115,352 0 130,812 0 0 125,422
55 to 59 0 0 0 0 0 178,613 0 129,977 0 133,221 0 0 143,758
60 to 64 0 0 0 0 0 0 0 0 0 0 0 0 0
65 to 69 0 0 0 0 0 0 0 0 0 0 0 0 0
70 & up 0 0 0 0 0 0 0 0 0 0 0 0 0
Total 87,693 0 106,571 110,279 123,288 128,037 133,454 130,325 146,050 132,016 0 0 124,551
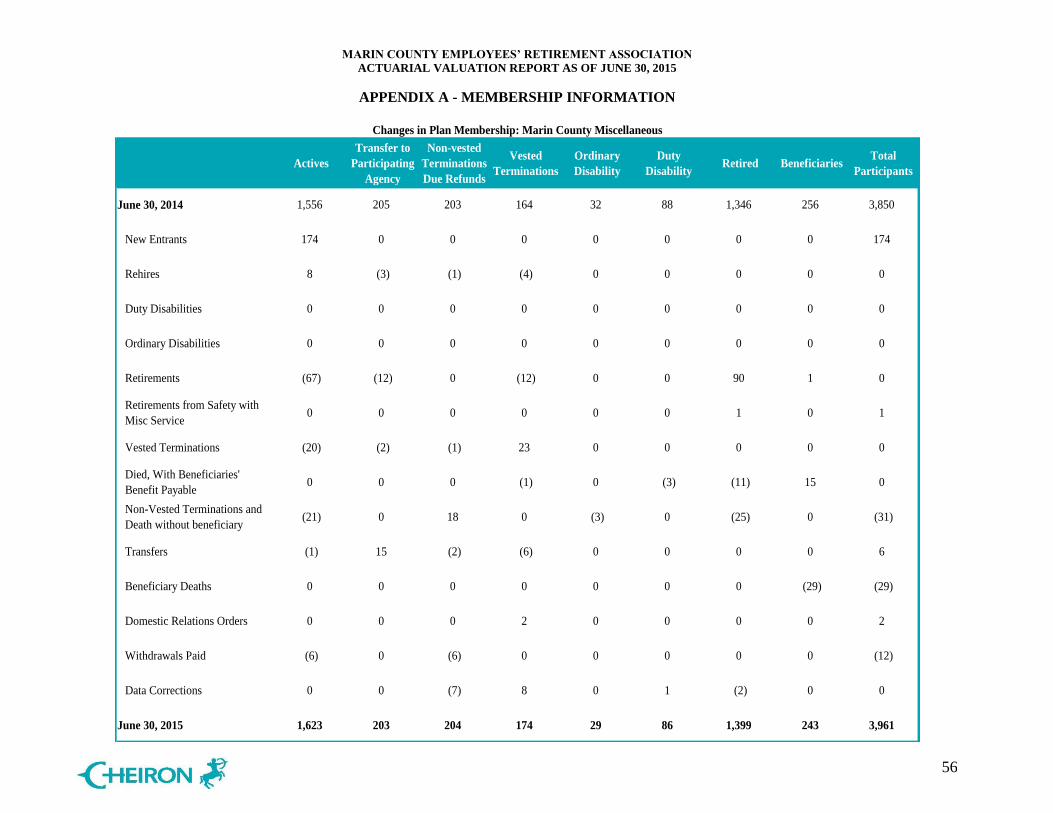
MARIN COUNTY EMPLOYEES’ RETIREMENT ASSOCIATION
ACTUARIAL VALUATION REPORT AS OF JUNE 30, 2015
APPENDIX A - MEMBERSHIP INFORMATION
56
Changes in Plan Membership: Marin County Miscellaneous Changes in Plan Membership: Marin County Safety
Actives
Transfer to
Participating
Agency
Non-vested
Terminations
Due Refunds
Vested
Terminations
Ordinary
Disability
Duty
DisabilityRetired Beneficiaries
Total
Participants
June 30, 2014 1,556 205 203 164 32 88 1,346 256 3,850
New Entrants 174 0 0 0 0 0 0 0 174
Rehires 8 (3) (1) (4) 0 0 0 0 0
Duty Disabilities 0 0 0 0 0 0 0 0 0
Ordinary Disabilities 0 0 0 0 0 0 0 0 0
Retirements (67) (12) 0 (12) 0 0 90 1 0
Retirements from Safety with
Misc Service0 0 0 0 0 0 1 0 1
Vested Terminations (20) (2) (1) 23 0 0 0 0 0
Died, With Beneficiaries'
Benefit Payable0 0 0 (1) 0 (3) (11) 15 0
Non-Vested Terminations and
Death without beneficiary(21) 0 18 0 (3) 0 (25) 0 (31)
Transfers (1) 15 (2) (6) 0 0 0 0 6
Beneficiary Deaths 0 0 0 0 0 0 0 (29) (29)
Domestic Relations Orders 0 0 0 2 0 0 0 0 2
Withdrawals Paid (6) 0 (6) 0 0 0 0 0 (12)
Data Corrections 0 0 (7) 8 0 1 (2) 0 0
June 30, 2015 1,623 203 204 174 29 86 1,399 243 3,961

MARIN COUNTY EMPLOYEES’ RETIREMENT ASSOCIATION
ACTUARIAL VALUATION REPORT AS OF JUNE 30, 2015
APPENDIX A - MEMBERSHIP INFORMATION
57
Changes in Plan Membership: Marin County Safety Changes in Plan Membership: Marin Special Districts Miscellaneous
Actives
Transfer to
Participating
Agency
Non-vested
Terminations
Due Refunds
Vested
Terminations
Ordinary
Disability
Duty
DisabilityRetired Beneficiaries
Total
Participants
June 30, 2014341 59 18 16 6 100 204 64 808
New Entrants 42 0 0 0 0 0 0 0 42
Rehires 1 0 0 0 0 0 0 0 1
Duty Disabilities (1) 0 0 (1) 0 2 0 0 0
Ordinary Disabilities (1) 0 0 0 1 0 0 0 0
Retirements (14) (4) 0 (1) 0 0 19 0 0
Retirements from Safety with
Misc Service0 0 0 0 0 0 1 0 1
Vested Terminations (5) 0 0 5 0 0 0 0 0
Died, With Beneficiaries'
Benefit Payable(1) 0 0 0 0 (2) (2) 5 0
Non-Vested Terminations and
Death without beneficiary(2) 0 2 0 0 (2) (1) 0 (3)
Transfers 1 4 (2) 0 0 0 0 0 3
Beneficiary Deaths 0 0 0 0 0 0 0 (9) (9)
Domestic Relations Orders 0 0 0 1 0 0 0 2 3
Withdrawals Paid (2) 0 (1) 0 0 0 0 0 (3)
Data Corrections 0 3 0 0 0 2 (2) 0 3
June 30, 2015359 62 17 20 7 100 219 62 846

MARIN COUNTY EMPLOYEES’ RETIREMENT ASSOCIATION
ACTUARIAL VALUATION REPORT AS OF JUNE 30, 2015
APPENDIX A - MEMBERSHIP INFORMATION
58
Changes in Plan Membership: Marin Special Districts Miscellaneous Changes in Plan Membership: Marin Special Districts Safety
Actives
Transfer to
Participating
Agency
Non-vested
Terminations
Due Refunds
Vested
Terminations
Ordinary
Disability
Duty
DisabilityRetired Beneficiaries
Total
Participants
June 30, 2014 166 25 28 15 3 3 92 8 340
New Entrants 5 0 0 0 0 0 0 0 5
Rehires 0 0 0 0 0 0 0 0 0
Duty Disabilities 0 0 0 0 0 0 0 0 0
Ordinary Disabilities 0 0 0 0 0 0 0 0 0
Retirements (7) (1) 0 (2) 0 0 10 0 0
Retirements from Safety with
Misc Service0 0 0 0 0 0 0 0 0
Vested Terminations (5) 0 0 5 0 0 0 0 0
Died, With Beneficiaries'
Benefit Payable0 0 0 0 0 0 0 0 0
Non-Vested Terminations and
Death without beneficiary(2) 0 2 0 0 0 (1) 0 (1)
Transfers (2) 3 0 (1) 0 0 0 0 0
Beneficiary Deaths 0 0 0 0 0 0 0 0 0
Domestic Relations Orders 0 0 0 0 0 0 0 0 0
Withdrawals Paid (1) 0 (1) 0 0 0 0 0 (2)
Data Corrections 0 0 0 0 0 0 1 0 1
June 30, 2015 154 27 29 17 3 3 102 8 343

MARIN COUNTY EMPLOYEES’ RETIREMENT ASSOCIATION
ACTUARIAL VALUATION REPORT AS OF JUNE 30, 2015
APPENDIX A - MEMBERSHIP INFORMATION
59
Changes in Plan Membership: Marin Special Districts Safety Changes in Plan Membership: Marin County and Special Districts All Groups
Actives
Transfer to
Participating
Agency
Non-vested
Terminations
Due Refunds
Vested
Terminations
Ordinary
Disability
Duty
DisabilityRetired Beneficiaries
Total
Participants
June 30, 2014 49 16 0 3 1 16 20 10 115
New Entrants 3 0 0 0 0 0 0 0 3
Rehires 0 0 0 0 0 0 0 0 0
Duty Disabilities 0 0 0 0 0 0 0 0 0
Ordinary Disabilities 0 0 0 0 0 0 0 0 0
Retirements (2) 0 0 0 0 0 2 0 0
Retirements from Safety with
Misc Service0 0 0 0 0 0 0 0 0
Vested Terminations 0 0 0 0 0 0 0 0 0
Died, With Beneficiaries'
Benefit Payable0 0 0 0 0 0 0 0 0
Non-Vested Terminations and
Death without beneficiary(1) 0 1 0 0 0 0 0 0
Transfers 0 0 0 0 0 0 0 0 0
Beneficiary Deaths 0 0 0 0 0 0 0 (1) (1)
Domestic Relations Orders 0 0 0 0 0 0 0 0 0
Withdrawals Paid 0 0 0 0 0 0 0 0 0
Data Corrections 0 0 0 0 0 0 0 0 0
June 30, 2015 49 16 1 3 1 16 22 9 117

MARIN COUNTY EMPLOYEES’ RETIREMENT ASSOCIATION
ACTUARIAL VALUATION REPORT AS OF JUNE 30, 2015
APPENDIX A - MEMBERSHIP INFORMATION
60
Changes in Plan Membership: Marin County and Special Districts All Groups Changes in Plan Membership: Novato Fire Protection District Miscellaneous
Actives
Transfer to
Participating
Agency
Non-vested
Terminations
Due Refunds
Vested
Terminations
Ordinary
Disability
Duty
DisabilityRetired Beneficiaries
Total
Participants
June 30, 2014 2,112 305 249 198 42 207 1,662 338 5,113
New Entrants 224 0 0 0 0 0 0 0 224
Rehires 9 (3) (1) (4) 0 0 0 0 1
Duty Disabilities (1) 0 0 (1) 0 2 0 0 0
Ordinary Disabilities (1) 0 0 0 1 0 0 0 0
Retirements (90) (17) 0 (15) 0 0 121 1 0
Retirements from Safety with
Misc Service0 0 0 0 0 0 2 0 2
Vested Terminations (30) (2) (1) 33 0 0 0 0 0
Died, With Beneficiaries'
Benefit Payable(1) 0 0 (1) 0 (5) (13) 20 0
Non-Vested Terminations and
Death without beneficiary(26) 0 23 0 (3) (2) (27) 0 (35)
Transfers (2) 22 (4) (7) 0 0 0 0 9
Beneficiary Deaths 0 0 0 0 0 0 0 (39) (39)
Domestic Relations Orders 0 0 0 3 0 0 0 2 5
Withdrawals Paid (9) 0 (8) 0 0 0 0 0 (17)
Data Corrections 0 3 (7) 8 0 3 (3) 0 4
June 30, 2015 2,185 308 251 214 40 205 1,742 322 5,267

MARIN COUNTY EMPLOYEES’ RETIREMENT ASSOCIATION
ACTUARIAL VALUATION REPORT AS OF JUNE 30, 2015
APPENDIX A - MEMBERSHIP INFORMATION
61
Changes in Plan Membership: Novato Fire Protection District Miscellaneous Changes in Plan Membership: Novato Fire Protection District Safety
Actives
Transfer to
Participating
Agency
Non-vested
Terminations
Due Refunds
Vested
Terminations
Ordinary
Disability
Duty
DisabilityRetired Beneficiaries
Total
Participants
June 30, 2014 9 1 0 1 0 0 2 1 14
New Entrants 0 0 0 0 0 0 0 0 0
Rehires 0 0 0 0 0 0 0 0 0
Duty Disabilities 0 0 0 0 0 0 0 0 0
Ordinary Disabilities 0 0 0 0 0 0 0 0 0
Retirements (1) 0 0 0 0 0 1 0 0
Retirements from Safety with
Misc Service0 0 0 0 0 0 0 0 0
Vested Terminations 0 0 0 0 0 0 0 0 0
Died, With Beneficiaries'
Benefit Payable0 0 0 0 0 0 0 0 0
Non-Vested Terminations and
Death without beneficiary0 0 0 0 0 0 0 0 0
Transfers 0 0 0 0 0 0 0 0 0
Beneficiary Deaths 0 0 0 0 0 0 0 0 0
Domestic Relations Orders 0 0 0 0 0 0 0 0 0
Withdrawals Paid 0 0 0 0 0 0 0 0 0
Data Corrections 0 0 0 0 0 0 0 0 0
June 30, 2015 8 1 0 1 0 0 3 1 14

MARIN COUNTY EMPLOYEES’ RETIREMENT ASSOCIATION
ACTUARIAL VALUATION REPORT AS OF JUNE 30, 2015
APPENDIX A - MEMBERSHIP INFORMATION
62
Changes in Plan Membership: Novato Fire Protection District Safety Changes in Plan Membership: Novato Fire Protection District All Groups
Actives
Transfer to
Participating
Agency
Non-vested
Terminations
Due Refunds
Vested
Terminations
Ordinary
Disability
Duty
DisabilityRetired Beneficiaries
Total
Participants
June 30, 2014 66 10 5 3 0 31 51 15 181
New Entrants 1 0 0 0 0 0 0 0 1
Rehires 0 0 0 0 0 0 0 0 0
Duty Disabilities 0 0 0 0 0 0 0 0 0
Ordinary Disabilities 0 0 0 0 0 0 0 0 0
Retirements 0 0 0 (1) 0 0 1 0 0
Retirements from Safety with
Misc Service0 0 0 0 0 0 0 0 0
Vested Terminations 0 0 0 0 0 0 0 0 0
Died, With Beneficiaries'
Benefit Payable0 0 0 0 0 0 0 0 0
Non-Vested Terminations and
Death without beneficiary0 0 0 0 0 0 0 0 0
Transfers 0 1 (1) 0 0 0 0 0 0
Beneficiary Deaths 0 0 0 0 0 0 0 0 0
Domestic Relations Orders 0 0 0 0 0 0 0 0 0
Withdrawals Paid 0 0 0 0 0 0 0 0 0
Data Corrections 0 0 0 0 0 0 0 0 0
June 30, 2015 67 11 4 2 0 31 52 15 182

MARIN COUNTY EMPLOYEES’ RETIREMENT ASSOCIATION
ACTUARIAL VALUATION REPORT AS OF JUNE 30, 2015
APPENDIX A - MEMBERSHIP INFORMATION
63
Changes in Plan Membership: Novato Fire Protection District All Groups Changes in Plan Membership: City of San Rafael Miscellaneous
Actives
Transfer to
Participating
Agency
Non-vested
Terminations
Due Refunds
Vested
Terminations
Ordinary
Disability
Duty
DisabilityRetired Beneficiaries
Total
Participants
June 30, 2014 75 11 5 4 0 31 53 16 195
New Entrants 1 0 0 0 0 0 0 0 1
Rehires 0 0 0 0 0 0 0 0 0
Duty Disabilities 0 0 0 0 0 0 0 0 0
Ordinary Disabilities 0 0 0 0 0 0 0 0 0
Retirements (1) 0 0 (1) 0 0 2 0 0
Retirements from Safety with
Misc Service0 0 0 0 0 0 0 0 0
Vested Terminations 0 0 0 0 0 0 0 0 0
Died, With Beneficiaries'
Benefit Payable0 0 0 0 0 0 0 0 0
Non-Vested Terminations and
Death without beneficiary0 0 0 0 0 0 0 0 0
Transfers 0 1 (1) 0 0 0 0 0 0
Beneficiary Deaths 0 0 0 0 0 0 0 0 0
Domestic Relations Orders 0 0 0 0 0 0 0 0 0
Withdrawals Paid 0 0 0 0 0 0 0 0 0
Data Corrections 0 0 0 0 0 0 0 0 0
June 30, 2015 75 12 4 3 0 31 55 16 196

MARIN COUNTY EMPLOYEES’ RETIREMENT ASSOCIATION
ACTUARIAL VALUATION REPORT AS OF JUNE 30, 2015
APPENDIX A - MEMBERSHIP INFORMATION
64
Changes in Plan Membership: City of San Rafael Miscellaneous Changes in Plan Membership: City of San Rafael Police
Actives
Transfer to
Participating
Agency
Non-vested
Terminations
Due Refunds
Vested
Terminations
Ordinary
Disability
Duty
DisabilityRetired Beneficiaries
Total
Participants
June 30, 2014 217 56 55 25 2 18 211 39 623
New Entrants 24 0 0 0 0 0 0 0 24
Rehires 0 0 0 0 0 0 0 0 0
Duty Disabilities 0 0 0 0 0 0 0 0 0
Ordinary Disabilities 0 0 0 0 0 0 0 0 0
Retirements (7) (4) 0 (4) 0 0 15 0 0
Retirements from Safety with
Misc Service0 0 0 0 0 0 0 0 0
Vested Terminations (4) (1) 0 5 0 0 0 0 0
Died, With Beneficiaries'
Benefit Payable0 0 0 0 0 0 (1) 1 0
Non-Vested Terminations and
Death without beneficiary(4) 0 4 0 0 0 (3) 0 (3)
Transfers (3) 3 0 0 0 0 0 0 0
Beneficiary Deaths 0 0 0 0 0 0 0 (4) (4)
Domestic Relations Orders 0 0 0 0 0 0 0 0 0
Withdrawals Paid (2) 0 (2) (1) 0 0 0 0 (5)
Data Corrections 0 (1) (2) 2 0 0 0 0 (1)
June 30, 2015 221 53 55 27 2 18 222 36 634

MARIN COUNTY EMPLOYEES’ RETIREMENT ASSOCIATION
ACTUARIAL VALUATION REPORT AS OF JUNE 30, 2015
APPENDIX A - MEMBERSHIP INFORMATION
65
Changes in Plan Membership: City of San Rafael Police Changes in Plan Membership: City of San Rafael Fire
Actives
Transfer to
Participating
Agency
Non-vested
Terminations
Due Refunds
Vested
Terminations
Ordinary
Disability
Duty
DisabilityRetired Beneficiaries
Total
Participants
June 30, 2014 70 24 6 7 0 40 70 17 234
New Entrants 6 0 0 0 0 0 0 0 6
Rehires 0 0 0 0 0 0 0 0 0
Duty Disabilities 0 0 0 0 0 0 0 0 0
Ordinary Disabilities 0 0 0 0 0 0 0 0 0
Retirements 0 (4) 0 0 0 0 4 0 0
Retirements from Safety with
Misc Service0 0 0 0 0 0 0 0 0
Vested Terminations 0 0 0 0 0 0 0 0 0
Died, With Beneficiaries'
Benefit Payable0 0 0 0 0 (1) (1) 2 0
Non-Vested Terminations and
Death without beneficiary(3) 0 3 0 0 (1) 0 0 (1)
Transfers 0 0 0 0 0 0 0 0 0
Beneficiary Deaths 0 0 0 0 0 0 0 (3) (3)
Domestic Relations Orders 0 0 0 0 0 0 0 0 0
Withdrawals Paid 0 0 0 0 0 0 0 0 0
Data Corrections 0 0 0 0 0 0 0 0 0
June 30, 2015 73 20 9 7 0 38 73 16 236

MARIN COUNTY EMPLOYEES’ RETIREMENT ASSOCIATION
ACTUARIAL VALUATION REPORT AS OF JUNE 30, 2015
APPENDIX A - MEMBERSHIP INFORMATION
66
Changes in Plan Membership: City of San Rafael Fire Changes in Plan Membership: City of San Rafael All Groups
Actives
Transfer to
Participating
Agency
Non-vested
Terminations
Due Refunds
Vested
Terminations
Ordinary
Disability
Duty
DisabilityRetired Beneficiaries
Total
Participants
June 30, 2014 59 6 5 2 0 21 79 22 194
New Entrants 1 0 0 0 0 0 0 0 1
Rehires 0 0 0 0 0 0 0 0 0
Duty Disabilities 0 0 0 0 0 0 0 0 0
Ordinary Disabilities 0 0 0 0 0 0 0 0 0
Retirements (4) 0 0 0 0 0 4 0 0
Retirements from Safety with
Misc Service0 0 0 0 0 0 0 0 0
Vested Terminations 0 0 0 0 0 0 0 0 0
Died, With Beneficiaries'
Benefit Payable0 0 0 0 0 0 0 0 0
Non-Vested Terminations and
Death without beneficiary(1) 0 1 0 0 0 (1) 0 (1)
Transfers 0 1 (1) 0 0 0 0 0 0
Beneficiary Deaths 0 0 0 0 0 0 0 (2) (2)
Domestic Relations Orders 0 0 0 0 0 0 0 0 0
Withdrawals Paid 0 0 0 0 0 0 0 0 0
Data Corrections 0 0 0 0 0 0 0 0 0
June 30, 2015 55 7 5 2 0 21 82 20 192

MARIN COUNTY EMPLOYEES’ RETIREMENT ASSOCIATION
ACTUARIAL VALUATION REPORT AS OF JUNE 30, 2015
APPENDIX A - MEMBERSHIP INFORMATION
67
Changes in Plan Membership: City of San Rafael All Groups
Actives
Transfer to
Participating
Agency
Non-vested
Terminations
Due Refunds
Vested
Terminations
Ordinary
Disability
Duty
DisabilityRetired Beneficiaries
Total
Participants
June 30, 2014 346 86 66 34 2 79 360 78 1,051
New Entrants 31 0 0 0 0 0 0 0 31
Rehires 0 0 0 0 0 0 0 0 0
Duty Disabilities 0 0 0 0 0 0 0 0 0
Ordinary Disabilities 0 0 0 0 0 0 0 0 0
Retirements (11) (8) 0 (4) 0 0 23 0 0
Retirements from Safety with
Misc Service0 0 0 0 0 0 0 0 0
Vested Terminations (4) (1) 0 5 0 0 0 0 0
Died, With Beneficiaries'
Benefit Payable0 0 0 0 0 (1) (2) 3 0
Non-Vested Terminations and
Death without beneficiary(8) 0 8 0 0 (1) (4) 0 (5)
Transfers (3) 4 (1) 0 0 0 0 0 0
Beneficiary Deaths 0 0 0 0 0 0 0 (9) (9)
Domestic Relations Orders 0 0 0 0 0 0 0 0 0
Withdrawals Paid (2) 0 (2) (1) 0 0 0 0 (5)
Data Corrections 0 (1) (2) 2 0 0 0 0 (1)
June 30, 2015 349 80 69 36 2 77 377 72 1,062
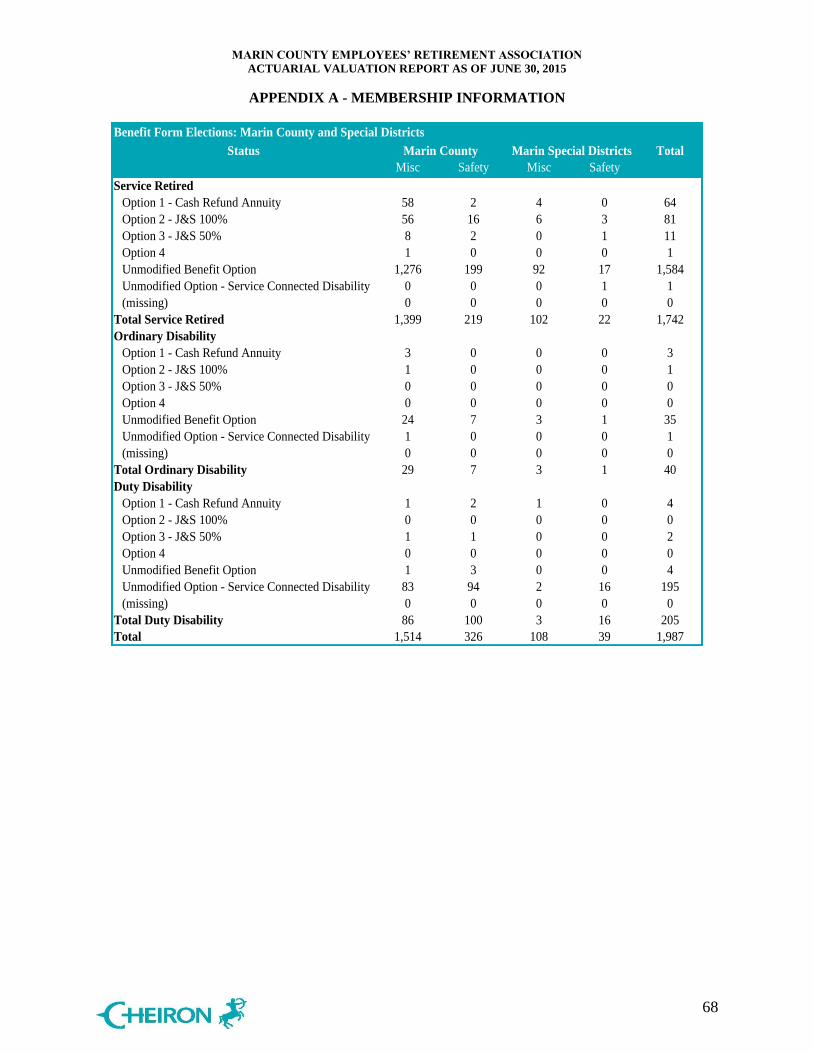
MARIN COUNTY EMPLOYEES’ RETIREMENT ASSOCIATION
ACTUARIAL VALUATION REPORT AS OF JUNE 30, 2015
APPENDIX A - MEMBERSHIP INFORMATION
68
Benefit Form Elections: Marin County and Special Districts
Status Marin County Marin Special Districts Total
Misc Safety Misc Safety
Service Retired
Option 1 - Cash Refund Annuity 58 2 4 0 64
Option 2 - J&S 100% 56 16 6 3 81
Option 3 - J&S 50% 8 2 0 1 11
Option 4 1 0 0 0 1
Unmodified Benefit Option 1,276 199 92 17 1,584
Unmodified Option - Service Connected Disability 0 0 0 1 1
(missing) 0 0 0 0 0
Total Service Retired 1,399 219 102 22 1,742
Ordinary Disability
Option 1 - Cash Refund Annuity 3 0 0 0 3
Option 2 - J&S 100% 1 0 0 0 1
Option 3 - J&S 50% 0 0 0 0 0
Option 4 0 0 0 0 0
Unmodified Benefit Option 24 7 3 1 35
Unmodified Option - Service Connected Disability 1 0 0 0 1
(missing) 0 0 0 0 0
Total Ordinary Disability 29 7 3 1 40
Duty Disability
Option 1 - Cash Refund Annuity 1 2 1 0 4
Option 2 - J&S 100% 0 0 0 0 0
Option 3 - J&S 50% 1 1 0 0 2
Option 4 0 0 0 0 0
Unmodified Benefit Option 1 3 0 0 4
Unmodified Option - Service Connected Disability 83 94 2 16 195
(missing) 0 0 0 0 0
Total Duty Disability 86 100 3 16 205
Total 1,514 326 108 39 1,987

MARIN COUNTY EMPLOYEES’ RETIREMENT ASSOCIATION
ACTUARIAL VALUATION REPORT AS OF JUNE 30, 2015
APPENDIX A - MEMBERSHIP INFORMATION
69
Benefit Form Elections: Novato Fire Protection District
Status Miscellaneous Safety Total
Service Retired
Option 1 - Cash Refund Annuity 0 0 0
Option 2 - J&S 100% 0 1 1
Option 3 - J&S 50% 1 0 1
Option 4 0 0 0
Unmodified Benefit Option 2 51 53
Unmodified Option - Service Connected Disability 0 0 0
(missing) 0 0 0
Total Service Retired 3 52 55
Ordinary Disability 0
Option 1 - Cash Refund Annuity 0 0 0
Option 2 - J&S 100% 0 0 0
Option 3 - J&S 50% 0 0 0
Option 4 0 0 0
Unmodified Benefit Option 0 0 0
Unmodified Option - Service Connected Disability 0 0 0
(missing) 0 0 0
Total Ordinary Disability 0 0 0
Duty Disability 0
Option 1 - Cash Refund Annuity 0 0 0
Option 2 - J&S 100% 0 0 0
Option 3 - J&S 50% 0 0 0
Option 4 0 0 0
Unmodified Benefit Option 0 1 1
Unmodified Option - Service Connected Disability 0 30 30
(missing) 0 0 0
Total Duty Disability 0 31 31
Total 3 83 86

MARIN COUNTY EMPLOYEES’ RETIREMENT ASSOCIATION
ACTUARIAL VALUATION REPORT AS OF JUNE 30, 2015
APPENDIX A - MEMBERSHIP INFORMATION
70
Benefit Form Elections: City of San Rafael
Miscellaneous Police Fire Total
Service Retired
Option 1 - Cash Refund Annuity 5 1 0 6
Option 2 - J&S 100% 19 13 4 36
Option 3 - J&S 50% 2 0 0 2
Option 4 0 0 0 0
Unmodified Benefit Option 196 58 78 332
Unmodified Option - Service Connected Disability 0 0 0 0
(missing) 0 1 0 1
Total Service Retired 222 73 82 377
Ordinary Disability 0
Option 1 - Cash Refund Annuity 0 0 0 0
Option 2 - J&S 100% 0 0 0 0
Option 3 - J&S 50% 0 0 0 0
Option 4 0 0 0 0
Unmodified Benefit Option 2 0 0 2
Unmodified Option - Service Connected Disability 0 0 0 0
(missing) 0 0 0 0
Total Ordinary Disability 2 0 0 2
Duty Disability 0
Option 1 - Cash Refund Annuity 1 1 0 2
Option 2 - J&S 100% 0 0 0 0
Option 3 - J&S 50% 0 0 0 0
Option 4 0 0 0 0
Unmodified Benefit Option 1 0 0 1
Unmodified Option - Service Connected Disability 16 37 21 74
(missing) 0 0 0 0
Total Duty Disability 18 38 21 77
Total 242 111 103 456

MARIN COUNTY EMPLOYEES’ RETIREMENT ASSOCIATION
ACTUARIAL VALUATION REPORT AS OF JUNE 30, 2015
APPENDIX A - MEMBERSHIP INFORMATION
71
Marin County and Special Districts: Service Retired Marin County and Special Districts: Duty Disabled
Marin County Marin Special Districts Marin County
Miscellaneous Safety Miscellaneous Safety Total
Age Number
Average
Annual
Benefit
Number
Average
Annual
Benefit
Number
Average
Annual
Benefit
Number
Average
Annual
Benefit
Number
Average
Annual
Benefit
0 to 24 0 $0 0 $0 0 $0 0 $0 0 $0
25 to 29 0 $0 0 $0 0 $0 0 $0 0 $0
30 to 34 0 $0 0 $0 0 $0 0 $0 0 $0
35 to 39 0 $0 0 $0 0 $0 0 $0 0 $0
40 to 44 0 $0 0 $0 0 $0 0 $0 0 $0
45 to 49 0 $0 4 $42,464 0 $0 0 $0 4 $42,464
50 to 54 20 $17,603 31 $60,384 4 $5,641 1 $20,397 56 $40,481
55 to 59 96 $23,194 49 $60,888 15 $32,531 9 $86,814 169 $38,340
60 to 64 183 $38,227 48 $78,075 18 $44,126 6 $59,916 255 $46,655
65 to 69 320 $38,958 32 $68,793 29 $37,968 3 $71,426 384 $41,623
70 to 74 298 $39,321 31 $68,899 25 $34,455 3 $82,093 357 $41,908
75 to 79 196 $35,724 15 $76,240 7 $45,795 0 $0 218 $38,835
80 to 84 149 $30,754 8 $43,194 3 $26,991 0 $0 160 $31,305
85 to 89 76 $26,865 1 $57,745 0 $0 0 $0 77 $27,266
90 to 94 48 $21,511 0 $0 1 $18,945 0 $0 49 $21,458
95+ 13 $20,038 0 $0 0 $0 0 $0 13 $20,038
<Total> 1399 $34,794 219 $66,927 102 $36,154 22 $73,717 1742 $39,405
Marin County and Special Districts: Duty Disabled Marin County and Special Districts: Ordinary Disabled
Marin County Marin Special Districts Marin County
Miscellaneous Safety Miscellaneous Safety Total
Age Number
Average
Annual
Benefit
Number
Average
Annual
Benefit
Number
Average
Annual
Benefit
Number
Average
Annual
Benefit
Number
Average
Annual
Benefit
0 to 24 0 $0 0 $0 0 $0 0 $0 0 $0
25 to 29 0 $0 1 $47,291 0 $0 0 $0 1 $47,291
30 to 34 0 $0 0 $0 0 $0 0 $0 0 $0
35 to 39 0 $0 1 $45,096 0 $0 0 $0 1 $45,096
40 to 44 2 $30,735 3 $50,741 1 $27,264 0 $0 6 $40,159
45 to 49 1 $33,900 11 $46,413 0 $0 1 $52,913 13 $45,951
50 to 54 7 $30,058 15 $39,721 0 $0 0 $0 22 $36,647
55 to 59 10 $35,768 14 $45,535 0 $0 2 $48,466 26 $42,004
60 to 64 20 $30,292 17 $55,940 0 $0 5 $47,332 42 $42,702
65 to 69 18 $37,256 11 $67,087 0 $0 5 $50,868 34 $48,909
70 to 74 12 $34,247 13 $55,217 2 $18,871 3 $62,546 30 $45,139
75 to 79 10 $56,730 8 $39,441 0 $0 0 $0 18 $49,046
80 to 84 5 $24,389 4 $36,488 0 $0 0 $0 9 $29,766
85 to 89 1 $14,755 2 $35,596 0 $0 0 $0 3 $28,649
90 to 94 0 $0 0 $0 0 $0 0 $0 0 $0
95+ 0 $0 0 $0 0 $0 0 $0 0 $0
<Total> 86 $35,522 100 $49,279 3 $21,669 16 $51,780 205 $43,299

MARIN COUNTY EMPLOYEES’ RETIREMENT ASSOCIATION
ACTUARIAL VALUATION REPORT AS OF JUNE 30, 2015
APPENDIX A - MEMBERSHIP INFORMATION
72
Marin County and Special Districts: Ordinary Disabled Marin County and Special Districts: Beneficiaries
Marin County Marin Special Districts Marin County
Miscellaneous Safety Miscellaneous Safety Total
Age Number
Average
Annual
Benefit
Number
Average
Annual
Benefit
Number
Average
Annual
Benefit
Number
Average
Annual
Benefit
Number
Average
Annual
Benefit
0 to 24 0 $0 0 $0 0 $0 0 $0 0 $0
25 to 29 0 $0 0 $0 0 $0 0 $0 0 $0
30 to 34 0 $0 0 $0 0 $0 0 $0 0 $0
35 to 39 0 $0 1 $33,730 0 $0 0 $0 1 $33,730
40 to 44 0 $0 0 $0 0 $0 0 $0 0 $0
45 to 49 0 $0 0 $0 0 $0 0 $0 0 $0
50 to 54 1 $22,915 4 $36,588 1 $34,497 0 $0 6 $33,961
55 to 59 3 $24,837 0 $0 0 $0 1 $54,260 4 $32,193
60 to 64 4 $22,386 1 $126,273 0 $0 0 $0 5 $43,164
65 to 69 10 $18,590 1 $23,870 1 $13,306 0 $0 12 $18,590
70 to 74 8 $19,106 0 $0 1 $28,508 0 $0 9 $20,151
75 to 79 1 $9,250 0 $0 0 $0 0 $0 1 $9,250
80 to 84 1 $2,663 0 $0 0 $0 0 $0 1 $2,663
85 to 89 1 $52,377 0 $0 0 $0 0 $0 1 $52,377
90 to 94 0 $0 0 $0 0 $0 0 $0 0 $0
95+ 0 $0 0 $0 0 $0 0 $0 0 $0
<Total> 29 $20,345 7 $47,175 3 $25,437 1 $54,260 40 $26,270
Marin County and Special Districts: Beneficiaries
Marin County Marin Special Districts
Miscellaneous Safety Miscellaneous Safety Total
Age Number
Average
Annual
Benefit
Number
Average
Annual
Benefit
Number
Average
Annual
Benefit
Number
Average
Annual
Benefit
Number
Average
Annual
Benefit
0 to 24 0 $0 0 $0 0 $0 0 $0 0 $0
25 to 29 0 $0 0 $0 0 $0 0 $0 0 $0
30 to 34 1 $30,702 0 $0 0 $0 0 $0 1 $30,702
35 to 39 3 $6,079 1 $27,230 0 $0 0 $0 4 $11,367
40 to 44 2 $31,101 0 $0 0 $0 1 $41,710 3 $34,637
45 to 49 3 $18,520 1 $44,232 1 $18,550 0 $0 5 $23,668
50 to 54 9 $19,088 5 $53,442 0 $0 1 $73,785 15 $34,185
55 to 59 15 $22,095 8 $20,824 1 $32,865 1 $42,171 25 $22,922
60 to 64 21 $18,917 8 $38,587 0 $0 1 $55,911 30 $25,396
65 to 69 33 $29,409 9 $46,164 1 $12,639 2 $31,144 45 $32,464
70 to 74 26 $22,636 11 $47,160 1 $11,328 1 $46,973 39 $29,887
75 to 79 33 $28,931 5 $25,500 2 $20,132 1 $33,852 41 $28,204
80 to 84 32 $20,513 7 $41,008 2 $14,284 0 $0 41 $23,709
85 to 89 30 $21,762 2 $28,747 0 $0 1 $7,226 33 $21,745
90 to 94 28 $17,357 3 $42,625 0 $0 0 $0 31 $19,802
95+ 7 $20,794 2 $24,565 0 $0 0 $0 9 $21,632
<Total> 243 $22,723 62 $38,665 8 $18,027 9 $40,435 322 $26,171

MARIN COUNTY EMPLOYEES’ RETIREMENT ASSOCIATION
ACTUARIAL VALUATION REPORT AS OF JUNE 30, 2015
APPENDIX A - MEMBERSHIP INFORMATION
73
Novato Fire Protection District: Service Retired Novato Fire Protection District: Duty Disabled
Miscellaneous Safety Total
Age Number
Average
Annual
Benefit
Number
Average
Annual
Benefit
Number
Average
Annual
Benefit
0 to 24 0 $0 0 $0 0 $0
25 to 29 0 $0 0 $0 0 $0
30 to 34 0 $0 0 $0 0 $0
35 to 39 0 $0 0 $0 0 $0
40 to 44 0 $0 0 $0 0 $0
45 to 49 0 $0 2 $68,052 2 $68,052
50 to 54 1 $9,369 3 $112,534 4 $86,743
55 to 59 0 $0 5 $91,587 5 $91,587
60 to 64 0 $0 13 $97,325 13 $97,325
65 to 69 1 $21,899 13 $94,719 14 $89,517
70 to 74 1 $96,358 12 $97,448 13 $97,364
75 to 79 0 $0 4 $68,809 4 $68,809
80 to 84 0 $0 0 $0 0 $0
85 to 89 0 $0 0 $0 0 $0
90 to 94 0 $0 0 $0 0 $0
95+ 0 $0 0 $0 0 $0
<Total> 3 $42,542 52 $93,708 55 $90,917
Novato Fire Protection District: Duty Disabled Novato Fire Protection District: Ordinary Disabled
Miscellaneous Safety Total
Age Number
Average
Annual
Benefit
Number
Average
Annual
Benefit
Number
Average
Annual
Benefit
0 to 24 0 $0 0 $0 0 $0
25 to 29 0 $0 0 $0 0 $0
30 to 34 0 $0 0 $0 0 $0
35 to 39 0 $0 0 $0 0 $0
40 to 44 0 $0 0 $0 0 $0
45 to 49 0 $0 0 $0 0 $0
50 to 54 0 $0 3 $55,936 3 $55,936
55 to 59 0 $0 2 $92,040 2 $92,040
60 to 64 0 $0 6 $59,354 6 $59,354
65 to 69 0 $0 7 $75,388 7 $75,388
70 to 74 0 $0 10 $57,754 10 $57,754
75 to 79 0 $0 3 $55,265 3 $55,265
80 to 84 0 $0 0 $0 0 $0
85 to 89 0 $0 0 $0 0 $0
90 to 94 0 $0 0 $0 0 $0
95+ 0 $0 0 $0 0 $0
<Total> 0 $0 31 $63,841 31 $63,841

MARIN COUNTY EMPLOYEES’ RETIREMENT ASSOCIATION
ACTUARIAL VALUATION REPORT AS OF JUNE 30, 2015
APPENDIX A - MEMBERSHIP INFORMATION
74
Novato Fire Protection District: Ordinary Disabled Novato Fire Protection District: Surviving Beneficiaries
Miscellaneous Safety Total
Age Number
Average
Annual
Benefit
Number
Average
Annual
Benefit
Number
Average
Annual
Benefit
0 to 24 0 $0 0 $0 0 $0
25 to 29 0 $0 0 $0 0 $0
30 to 34 0 $0 0 $0 0 $0
35 to 39 0 $0 0 $0 0 $0
40 to 44 0 $0 0 $0 0 $0
45 to 49 0 $0 0 $0 0 $0
50 to 54 0 $0 0 $0 0 $0
55 to 59 0 $0 0 $0 0 $0
60 to 64 0 $0 0 $0 0 $0
65 to 69 0 $0 0 $0 0 $0
70 to 74 0 $0 0 $0 0 $0
75 to 79 0 $0 0 $0 0 $0
80 to 84 0 $0 0 $0 0 $0
85 to 89 0 $0 0 $0 0 $0
90 to 94 0 $0 0 $0 0 $0
95+ 0 $0 0 $0 0 $0
<Total> 0 $0 0 $0 0 $0
Novato Fire Protection District: Surviving Beneficiaries City of San Rafael: Service Retired
Miscellaneous Safety Total
Age Number
Average
Annual
Benefit
Number
Average
Annual
Benefit
Number
Average
Annual
Benefit
0 to 24 0 $0 0 $0 0 $0
25 to 29 0 $0 0 $0 0 $0
30 to 34 0 $0 0 $0 0 $0
35 to 39 0 $0 0 $0 0 $0
40 to 44 0 $0 0 $0 0 $0
45 to 49 0 $0 1 $70,039 1 $70,039
50 to 54 1 $10,934 3 $36,601 4 $30,185
55 to 59 0 $0 2 $27,371 2 $27,371
60 to 64 0 $0 3 $36,373 3 $36,373
65 to 69 0 $0 3 $46,237 3 $46,237
70 to 74 0 $0 1 $56,126 1 $56,126
75 to 79 0 $0 0 $0 0 $0
80 to 84 0 $0 1 $27,327 1 $27,327
85 to 89 0 $0 1 $43,438 1 $43,438
90 to 94 0 $0 0 $0 0 $0
95+ 0 $0 0 $0 0 $0
<Total> 1 $10,934 15 $40,620 16 $38,765
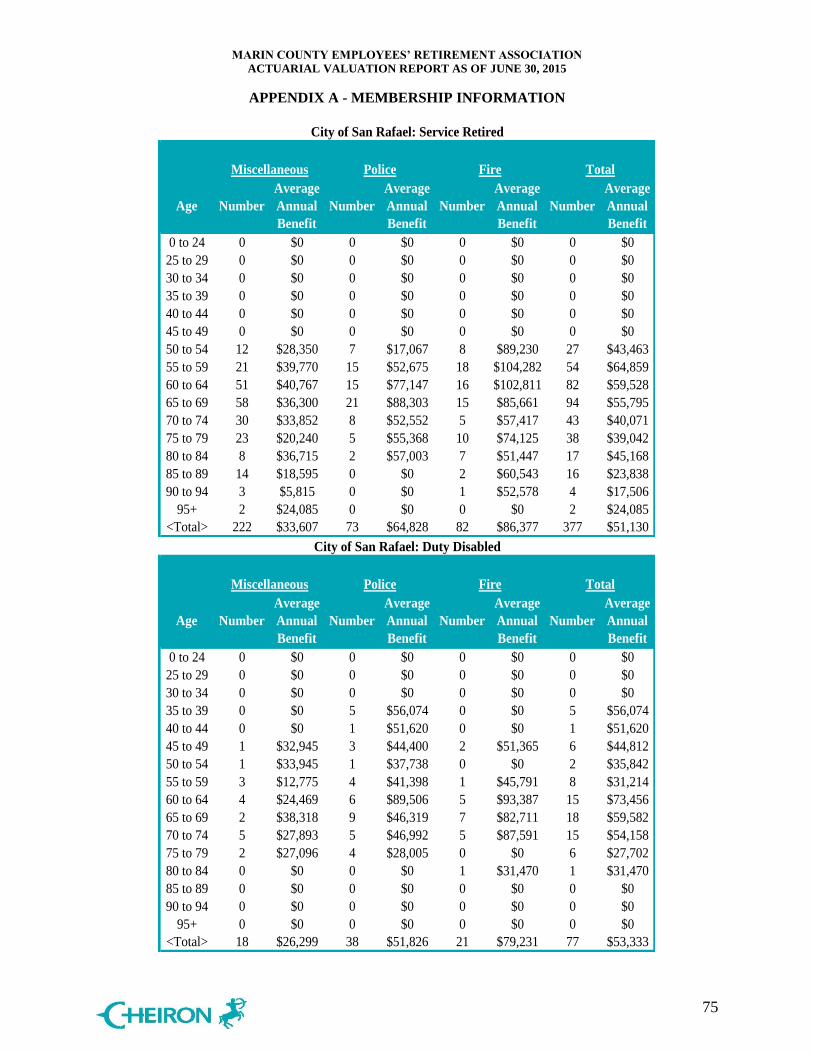
MARIN COUNTY EMPLOYEES’ RETIREMENT ASSOCIATION
ACTUARIAL VALUATION REPORT AS OF JUNE 30, 2015
APPENDIX A - MEMBERSHIP INFORMATION
75
City of San Rafael: Service Retired City of San Rafael: Duty Disabled
Miscellaneous Police Fire Total
Age Number
Average
Annual
Benefit
Number
Average
Annual
Benefit
Number
Average
Annual
Benefit
Number
Average
Annual
Benefit
0 to 24 0 $0 0 $0 0 $0 0 $0
25 to 29 0 $0 0 $0 0 $0 0 $0
30 to 34 0 $0 0 $0 0 $0 0 $0
35 to 39 0 $0 0 $0 0 $0 0 $0
40 to 44 0 $0 0 $0 0 $0 0 $0
45 to 49 0 $0 0 $0 0 $0 0 $0
50 to 54 12 $28,350 7 $17,067 8 $89,230 27 $43,463
55 to 59 21 $39,770 15 $52,675 18 $104,282 54 $64,859
60 to 64 51 $40,767 15 $77,147 16 $102,811 82 $59,528
65 to 69 58 $36,300 21 $88,303 15 $85,661 94 $55,795
70 to 74 30 $33,852 8 $52,552 5 $57,417 43 $40,071
75 to 79 23 $20,240 5 $55,368 10 $74,125 38 $39,042
80 to 84 8 $36,715 2 $57,003 7 $51,447 17 $45,168
85 to 89 14 $18,595 0 $0 2 $60,543 16 $23,838
90 to 94 3 $5,815 0 $0 1 $52,578 4 $17,506
95+ 2 $24,085 0 $0 0 $0 2 $24,085
<Total> 222 $33,607 73 $64,828 82 $86,377 377 $51,130
City of San Rafael: Duty Disabled City of San Rafael: Ordinary Disabled
Miscellaneous Police Fire Total
Age Number
Average
Annual
Benefit
Number
Average
Annual
Benefit
Number
Average
Annual
Benefit
Number
Average
Annual
Benefit
0 to 24 0 $0 0 $0 0 $0 0 $0
25 to 29 0 $0 0 $0 0 $0 0 $0
30 to 34 0 $0 0 $0 0 $0 0 $0
35 to 39 0 $0 5 $56,074 0 $0 5 $56,074
40 to 44 0 $0 1 $51,620 0 $0 1 $51,620
45 to 49 1 $32,945 3 $44,400 2 $51,365 6 $44,812
50 to 54 1 $33,945 1 $37,738 0 $0 2 $35,842
55 to 59 3 $12,775 4 $41,398 1 $45,791 8 $31,214
60 to 64 4 $24,469 6 $89,506 5 $93,387 15 $73,456
65 to 69 2 $38,318 9 $46,319 7 $82,711 18 $59,582
70 to 74 5 $27,893 5 $46,992 5 $87,591 15 $54,158
75 to 79 2 $27,096 4 $28,005 0 $0 6 $27,702
80 to 84 0 $0 0 $0 1 $31,470 1 $31,470
85 to 89 0 $0 0 $0 0 $0 0 $0
90 to 94 0 $0 0 $0 0 $0 0 $0
95+ 0 $0 0 $0 0 $0 0 $0
<Total> 18 $26,299 38 $51,826 21 $79,231 77 $53,333

MARIN COUNTY EMPLOYEES’ RETIREMENT ASSOCIATION
ACTUARIAL VALUATION REPORT AS OF JUNE 30, 2015
APPENDIX A - MEMBERSHIP INFORMATION
76
City of San Rafael: Ordinary Disabled City of San Rafael: Surviving Beneficiaries
Miscellaneous Police Fire Total
Age Number
Average
Annual
Benefit
Number
Average
Annual
Benefit
Number
Average
Annual
Benefit
Number
Average
Annual
Benefit
0 to 24 0 $0 0 $0 0 $0 0 $0
25 to 29 0 $0 0 $0 0 $0 0 $0
30 to 34 0 $0 0 $0 0 $0 0 $0
35 to 39 0 $0 0 $0 0 $0 0 $0
40 to 44 0 $0 0 $0 0 $0 0 $0
45 to 49 0 $0 0 $0 0 $0 0 $0
50 to 54 0 $0 0 $0 0 $0 0 $0
55 to 59 0 $0 0 $0 0 $0 0 $0
60 to 64 0 $0 0 $0 0 $0 0 $0
65 to 69 0 $0 0 $0 0 $0 0 $0
70 to 74 1 $15,101 0 $0 0 $0 1 $15,101
75 to 79 0 $0 0 $0 0 $0 0 $0
80 to 84 0 $0 0 $0 0 $0 0 $0
85 to 89 0 $0 0 $0 0 $0 0 $0
90 to 94 1 $7,728 0 $0 0 $0 1 $7,728
95+ 0 $0 0 $0 0 $0 0 $0
<Total> 2 $11,415 0 $0 0 $0 2 $11,415
City of San Rafael: Surviving Beneficiaries
Miscellaneous Police Fire Total
Age Number
Average
Annual
Benefit
Number
Average
Annual
Benefit
Number
Average
Annual
Benefit
Number
Average
Annual
Benefit
0 to 24 0 $0 0 $0 0 $0 0 $0
25 to 29 0 $0 0 $0 0 $0 0 $0
30 to 34 0 $0 0 $0 0 $0 0 $0
35 to 39 0 $0 0 $0 0 $0 0 $0
40 to 44 0 $0 0 $0 0 $0 0 $0
45 to 49 1 $12,257 1 $19,847 0 $0 2 $16,052
50 to 54 2 $7,026 1 $51,562 2 $26,340 5 $23,658
55 to 59 2 $13,384 1 $2,902 3 $41,716 6 $25,803
60 to 64 1 $562 3 $18,536 3 $57,483 7 $32,659
65 to 69 6 $26,685 2 $33,431 1 $90,715 9 $35,298
70 to 74 4 $25,826 4 $27,319 4 $26,716 12 $26,620
75 to 79 4 $13,923 2 $73,992 2 $32,256 8 $33,523
80 to 84 4 $24,502 1 $9,249 3 $23,897 8 $22,369
85 to 89 7 $9,489 1 $33,442 2 $24,781 10 $14,943
90 to 94 5 $6,186 0 $0 0 $0 5 $6,186
95+ 0 $0 0 $0 0 $0 0 $0
<Total> 36 $15,781 16 $31,046 20 $36,681 72 $24,979

MARIN COUNTY EMPLOYEES’ RETIREMENT ASSOCIATION
ACTUARIAL VALUATION REPORT AS OF JUNE 30, 2015
APPENDIX A - MEMBERSHIP INFORMATION
77
Retirement Eligibility
Number Reaching Service Retirement Eligibility
As Defined in Section 1.1 in Year(s)
Plan Current Actives 0 1 2 3 4 5 6-10 Total
County
Miscellaneous Tier 1 16 16 0 0 0 0 0 0 16
Miscellaneous Tier 2 54 50 1 1 2 0 0 0 54
Miscellaneous Tier 3 967 495 61 60 57 32 24 125 854
Miscellaneous Tier 3A 133 3 2 1 3 18 8 31 66
Miscellaneous Tier 4 139 0 0 0 1 2 5 53 61
Miscellaneous Tier 5 314 6 0 6 15 29 36 28 120
Safety Tier 1A 1 1 0 0 0 0 0 0 1
Safety Tier 2A 63 23 4 4 1 4 2 12 50
Safety Tier 2B 241 67 6 9 13 17 12 52 176
Safety Tier 3 54 0 0 0 0 1 2 2 5
Total County 1,982 661 74 81 92 103 89 303 1,403
Courts
Courts Tier 1 3 3 0 0 0 0 0 0 3
Courts Tier 2 1 0 0 0 1 0 0 0 1
Courts Tier 3 88 43 8 7 3 1 2 12 76
Courts Tier 4 4 1 0 0 0 1 0 0 2
Courts Tier 5 6 0 0 0 0 1 3 0 4
Total Courts 102 47 8 7 4 3 5 12 86
Special Districts
South Marin Fire Miscellaneous 1 1 0 0 0 0 0 0 1
South Marin Fire Safety 49 13 1 2 1 4 1 12 34
Mosquito District 33 19 0 0 1 0 1 5 26
LAFCO 2 0 0 0 0 0 0 1 1
Tamalpais CSD 11 6 1 1 0 0 0 1 9
Marin CSD 5 2 0 0 0 0 0 0 2
Total Special Districts 101 41 2 3 2 4 2 19 73
Total County and Special Districts 2,185 749 84 91 98 110 96 334 1,562
Novato
Miscellaneous 8 2 1 0 1 1 0 2 7
Safety 67 15 3 2 4 4 5 26 59
Total Novato 75 17 4 2 5 5 5 28 66
San Rafael
Miscellaneous Tier 1 167 75 13 7 10 12 2 23 142
Miscellaneous Tier 2 18 1 0 0 0 0 0 5 6
Miscellaneous Tier 3 36 0 0 0 0 2 3 1 6
Fire Tier 1 41 10 0 3 3 2 5 6 29
Fire Tier 2 14 0 0 0 0 0 0 0 0
Safety Tier 1 53 14 3 2 2 3 2 19 45
Safety Tier 2 5 0 0 0 0 0 0 1 1
Safety Tier 3 15 0 0 0 0 0 0 0 0
Total San Rafael 349 100 16 12 15 19 12 55 229

MARIN COUNTY EMPLOYEES’ RETIREMENT ASSOCIATION
ACTUARIAL VALUATION REPORT AS OF JUNE 30, 2015
APPENDIX B - STATEMENT OF CURRENT ACTUARIAL ASSUMPTIONS AND METHODS
78
The assumptions and methods used in the actuarial valuation as of June 30, 2015 are:
Actuarial Methods
1. Actuarial Cost Method
The actuarial valuation is prepared using the entry age actuarial cost method (CERL
31453.5). Under the principles of this method, the actuarial present value of the projected
benefits of each individual included in the valuation is allocated as a level percentage of
the individual's projected compensation between entry age and assumed exit (until
maximum retirement age). For members who transferred from outside of MCERA, entry
age is based on entry into the system. The normal cost for the Plan is based on the sum of
the individual normal costs for each member (Individual Entry Age Method).
The UAL (or Surplus Funding) is amortized as a percentage of the projected salaries of
present and future members of MCERA. Effective with the June 30, 2013 valuation, the
UAL as of June 30, 2013 is amortized over a closed 17-year period (15 years remaining
as of June 30, 2015), except for the additional UAL attributable to the extraordinary loss
from 2008-2009, which is being amortized over a separate closed period (23 years as of
June 30, 2015).
Any subsequent unexpected change in the unfunded actuarial liability after June 30, 2013
is amortized over 24 years (22 years for assumption changes) that includes a 5-year
phase-in/out (3 years for assumption changes) of the payments/credits for each annual
layer.
2. Valuation of Assets
As of the June 30, 2014 valuation, assets are valued using the market value. The assets
used to compute the UAL are the market value of assets, minus the value of any non-
valuation contingency reserves.
Actuarial Assumptions
3. Rate of Return
Assets are assumed to earn 7.25% net of investment, but not administrative expenses.
4. Administrative Expenses
Administrative expenses are assumed to be $4.635 million for the next year, to be split
between employees and employers based on their share of the overall contributions.
Administrative expenses are assumed to increase by 3.0% per year.
5. Cost-of-Living
The cost-of-living as measured by the Consumer Price Index (CPI) will increase at the
rate of 2.75% per year.

MARIN COUNTY EMPLOYEES’ RETIREMENT ASSOCIATION
ACTUARIAL VALUATION REPORT AS OF JUNE 30, 2015
APPENDIX B - STATEMENT OF CURRENT ACTUARIAL ASSUMPTIONS AND METHODS
79
6. Post Retirement COLA
Post retirement COLAs are assumed at the rate of 2.7% for members with a 4% COLA
cap, 2.6% for members with a 3% COLA cap, and 1.9% for members with a 2% COLA
cap.
7. Internal Revenue Code Section 415 Limit
The Internal Revenue Code Section 415 maximum benefit limitations are not reflected in
the valuation for funding purposes. Any limitation is reflected in a member’s benefit at
the time of retirement.
8. Internal Revenue Code Section 401(a)(17)
The Internal Revenue Code Section 401(a)(17) maximum compensation limitation is not
reflected in the valuation for funding purposes. Any limitation is reflected in a member’s
benefit after retirement.
9. PEPRA Compensation Limit
The PEPRA Pensionable Compensation Limit (GC 7522.10) is reflected in the valuation
to project compensation and benefits for PEPRA members. The limit is expected to
increase by 2.75% in future years.
10. Interest on Member Contributions
The annual credited interest rate on member contributions is assumed to be 7.25%.
11. Sick Leave Service Credit Upon Retirement
Active members’ benefits are adjusted by a percentage, in accordance with the table
below, for anticipated conversions of sick leave or other terminal earnings to retirement
service credit or final compensation.
Rate
Marin County 1.20%
Marin Courts 1.20%
Marin Special Districts 1.20%
Novato Fire Protection District 3.00%
City of San Rafael 2.50%

MARIN COUNTY EMPLOYEES’ RETIREMENT ASSOCIATION
ACTUARIAL VALUATION REPORT AS OF JUNE 30, 2015
APPENDIX B - STATEMENT OF CURRENT ACTUARIAL ASSUMPTIONS AND METHODS
80
12. Family Composition
Percentage married for all active members who retire, become disabled, or die during
active service is shown in the table below. Male members are assumed to be three years
older than their spouses and female members are assumed to be one year younger than
their spouses.
Percentage Married
Gender Percentage
Males 80%
Females 50%
13. Increases in Pay
Wage inflation component: 3.00%
Additional longevity and promotion component:
Service Miscellaneous Safety
0 8.00% 5.00%
1 8.00% 5.00%
2 8.00% 5.00%
3 6.00% 2.00%
4 2.00% 1.25%
5+ 0.75% 1.25%

MARIN COUNTY EMPLOYEES’ RETIREMENT ASSOCIATION
ACTUARIAL VALUATION REPORT AS OF JUNE 30, 2015
APPENDIX B - STATEMENT OF CURRENT ACTUARIAL ASSUMPTIONS AND METHODS
81
14. Rates of Termination (All Types)
Sample rates of termination are show in the following tables below. Note that termination rates do not apply once a member is
eligible for retirement.
Service Male Female Safety
0 15.00% 15.00% 8.00%
1 9.00% 10.00% 5.00%
2 7.00% 8.00% 4.00%
3 7.00% 8.00% 4.00%
4 7.00% 8.00% 4.00%
Miscellaneous
Safety
Male Females
Age5-9 Years of
Service
10-14 Years of
Service
15-29 Years of
Service
5-9 Years of
Service
10-14 Years of
Service
15-29 Years of
Service
5-19 Years of
Service
20 7.00% 5.30% 3.00% 7.75% 5.30% 3.00% 2.06%
25 7.00% 5.30% 3.00% 7.75% 5.30% 3.00% 2.24%
30 7.00% 5.30% 3.00% 7.75% 5.30% 3.00% 3.53%
35 6.75% 4.50% 2.50% 7.75% 4.50% 2.50% 3.41%
40 4.80% 3.20% 2.00% 5.80% 3.20% 2.00% 1.14%
45 3.75% 2.50% 1.70% 4.75% 2.50% 1.70% 1.70%
50 2.10% 0.00% 0.00% 3.10% 0.00% 0.00% 0.27%
55 1.20% 0.00% 0.00% 2.20% 0.00% 0.00% 0.10%
60 1.20% 0.00% 0.00% 2.20% 0.00% 0.00% 0.00%
Miscellaneous
MARIN COUNTY EMPLOYEES’ RETIREMENT ASSOCIATION
ACTUARIAL VALUATION REPORT AS OF JUNE 30, 2015
APPENDIX B - STATEMENT OF CURRENT ACTUARIAL ASSUMPTIONS AND METHODS
82
15. Withdrawal
Rates of withdrawal apply to active Members who terminate their employment and
withdraw their member contributions, forfeiting entitlement to future Plan benefits.
30% of all Miscellaneous Member terminations with less than five years of service are
assumed to take a refund of contributions, as well as 15% of those with five or more
years of service.
25% of all Safety Member terminations with less than ten years of service are assumed to
take a refund of contributions, and 5% of those with ten or more years are assumed to
take a refund.
16. Vested Termination and Reciprocal Transfers
Rates of vested termination apply to active Members who terminate their employment
and leave their member contributions on deposit with the Plan.
70% of all Miscellaneous Member terminations with less than five years of service are
assumed to leave their contributions on deposit, as well as 85% of those with five or more
years of service.
75% of all Safety Member terminations with less than ten years of service are assumed to
leave their contributions on deposit, as well as 95% of those with ten or more years of
service.
No vested terminations or transfers are assumed to occur with 30 years of service. Vested
terminated Miscellaneous Members are assumed to begin receiving benefits at age 55;
terminated Safety Members are assumed to begin receiving benefits at age 50.
20% of vested terminated Miscellaneous members and 40% of vested terminated Safety
Members are assumed to be reciprocal.

MARIN COUNTY EMPLOYEES’ RETIREMENT ASSOCIATION
ACTUARIAL VALUATION REPORT AS OF JUNE 30, 2015
APPENDIX B - STATEMENT OF CURRENT ACTUARIAL ASSUMPTIONS AND METHODS
83
17. Rates of Service-Connected Disability
Sample service-connected disability rates of active participants are shown below.
Age Male Female Safety
20 0.0250% 0.0125% 0.0605%
25 0.0400% 0.0200% 0.0825%
30 0.0650% 0.0325% 0.1980%
35 0.0800% 0.0400% 0.3025%
40 0.1050% 0.0525% 0.6490%
45 0.1300% 0.0650% 0.6270%
50 0.1550% 0.0775% 0.7040%
55 0.1650% 0.0825% 2.1450%
60 0.1850% 0.0925% 0.0000%
65 0.1950% 0.0975% 0.0000%
Miscellaneous
18. Rates of Non Service-Connected Disability
Sample non service-connected disability rates of active participants are shown below.
Age Miscellaneous Safety
20 0.0000% 0.0200%
25 0.0030% 0.0300%
30 0.0050% 0.0500%
35 0.0080% 0.0700%
40 0.0130% 0.1600%
45 0.0220% 0.2600%
50 0.0450% 0.3600%
55 0.0780% 0.4600%
60 0.1280% 0.0000%
65 0.1970% 0.0000%
19. Rates of Mortality for Active Lives
Rates of mortality for active Members are specified by CalPERS 2014 Pre-Retirement
Non-Industrial Death rates (plus Duty-Related Death rates for Safety Members), with the
20-year static projection used by CalPERS replaced by generational improvements from
a base year of 2009 using Scale MP-2014.

MARIN COUNTY EMPLOYEES’ RETIREMENT ASSOCIATION
ACTUARIAL VALUATION REPORT AS OF JUNE 30, 2015
APPENDIX B - STATEMENT OF CURRENT ACTUARIAL ASSUMPTIONS AND METHODS
84
20. Rates of Mortality for Retired Healthy Lives
Rates of mortality for retired Members and their beneficiaries are given by CalPERS
2014 Post-Retirement Healthy Mortality rates, adjusted by 110% for Safety Males and
95% for Miscellaneous and Safety Females, with the 20-year static projection used by
CalPERS replaced by generational improvements from a base year of 2009 using Scale
MP-2014.
21. Rates of Mortality for Retired Disabled Lives
Rates of mortality among disabled Members are given by CalPERS 2014 Disability
Mortality rates (Non-Industrial rates for Miscellaneous members and Industrial Disability
rates for Safety members), adjusted by 90% for Males and Females (Miscellaneous and
Safety) with the 20-year static projection used by CalPERS replaced by generational
improvements from a base year of 2009 using Scale MP-2014.
22. Mortality Improvement
Mortality is assumed to improve in future years in accordance with the MP-2014
generational improvement tables.

MARIN COUNTY EMPLOYEES’ RETIREMENT ASSOCIATION
ACTUARIAL VALUATION REPORT AS OF JUNE 30, 2015
APPENDIX B - STATEMENT OF CURRENT ACTUARIAL ASSUMPTIONS AND METHODS
85
23. Rates of Retirement
Rates of retirement are based on age according to the following tables below.
PEPRA: For New Members we assume that the current retirement rates will apply, but
that no Non-Safety members will retire before age 52.
Miscellaneous Rates
Age<20 Years of
Service
20-29 Years of
Service
30+ Years of
Service
50-54 4.00% 4.00% 4.00%
55 8.00% 10.00% 25.00%
56 4.00% 4.00% 25.00%
57 4.00% 6.00% 25.00%
58 4.00% 8.00% 25.00%
59 8.00% 10.00% 25.00%
60-61 8.00% 10.00% 35.00%
62-74 20.00% 20.00% 35.00%
75-79 25.00% 25.00% 35.00%
80 100.00% 100.00% 100.00%
Safety Rates
3% @ 50 3% @ 50 3% @ 50 3% @ 55 3% @ 55 3% @ 55
Age<20 Years of
Service
20-29 Years of
Service
30+ Years of
Service
<20 Years of
Service
20-29 Years of
Service
30+ Years of
Service
40-49 0.00% 3.00% 3.00% 0.00% 1.00% 1.00%
50 25.00% 25.00% 50.00% 5.00% 5.00% 30.00%
51-53 10.00% 10.00% 20.00% 5.00% 5.00% 30.00%
54 10.00% 10.00% 20.00% 5.00% 15.00% 30.00%
55 25.00% 25.00% 50.00% 20.00% 40.00% 50.00%
56 25.00% 25.00% 50.00% 10.00% 30.00% 50.00%
57-59 25.00% 25.00% 50.00% 10.00% 20.00% 50.00%
60-64 50.00% 50.00% 50.00% 30.00% 30.00% 50.00%
65 100.00% 100.00% 100.00% 100.00% 100.00% 100.00%

MARIN COUNTY EMPLOYEES’ RETIREMENT ASSOCIATION
ACTUARIAL VALUATION REPORT AS OF JUNE 30, 2015
APPENDIX C - SUMMARY OF PLAN PROVISIONS
86
Brief Outline of Plan Provisions
Definitions
Compensation
Compensation means the cash remuneration for services paid by the employer. It
includes base pay and certain differential, incentive, and special pay allowances
defined by the Board of Retirement. Overtime is excluded, with the exception of
overtime paid under the Fair Labor Standards Act that is regular and recurring.
PEPRA: For non-reciprocal members joining the Plan on and after January 1, 2013
(New Members), only base compensation or normal monthly rate of pay, as defined,
up to the PEPRA wage cap ($117,020 for both 2015 and 2016) will count for
computing Plan benefits and employee contributions and employer contributions for
those participating in Social Security. For those not participating in Social Security,
the compensation cap is 120% of the cap above ($140,424 for both 2015 and 2016).
In addition, some sources of compensation, such as leave cashouts, allowances, and
some types of special pays, will be excluded from benefit and contribution
computations for New Members.
Credited Service
In general, Credited Service is earned for the period during which Member
Contributions are paid.
Temporary service for which the Member was not credited, or service for which the
Member withdrew his or her Member Contributions, may be purchased by paying or
repaying the Member Contributions with interest. The categories of services that
credit may be purchased for are listed below:
Leave without Pay (Member’s illness): Member may purchase only up to
twelve months of service per incident.
Re-deposits: Member may only purchase the amount of service previously
withdrawn.
Service Prior to Membership: Member must pay employee portion and
applicable interest.
Military Leave without Pay: Member, who has taken a leave without pay in
order to serve in the military, will be given an option to buy the service time.
Service In-Between: Member may purchase service per incident.

MARIN COUNTY EMPLOYEES’ RETIREMENT ASSOCIATION
ACTUARIAL VALUATION REPORT AS OF JUNE 30, 2015
APPENDIX C - SUMMARY OF PLAN PROVISIONS
87
Public Service: Member must have been employed by the date as indicated
below and cannot be receiving a benefit from the other entity:
April 16, 1979:
Novato Fire Protection District
May 1, 1979:
County of Marin
Marin County Courts
Marin City Community Service District
Tamalpais Community Service District
Southern Marin Fire Protection District
Marin/Sonoma Mosquito and Vector Control District
Local Agency Formation Commission (LAFCO)
May 7, 1979:
City of San Rafael
In all cases of service buybacks, repayment terms for most payment plans may not
exceed the length of the period of service being purchased, with a maximum of five
years. Payment for public service purchases may also not exceed five years. In the
event of an active Member’s death, the beneficiary is given the opportunity to pay off
any service purchase agreements at the time of death.
A percentage of credited sick leave may be credited according to the Member’s
applicable bargaining unit.
Final Compensation
For County employees hired after June 30, 1980, and Bargaining Units 10 and 13,
LAFCO Tier 3 members and San Rafael employees hired after July 1, 2011, Final
Compensation means the highest Compensation earned during any thirty-six
consecutive months of the Member’s employment. For all others, it is the highest
Compensation earned during any twelve months of employment.
PEPRA: For all New Members, highest average Compensation will be based on the
highest thirty-six consecutive months, rather than 12 months.

MARIN COUNTY EMPLOYEES’ RETIREMENT ASSOCIATION
ACTUARIAL VALUATION REPORT AS OF JUNE 30, 2015
APPENDIX C - SUMMARY OF PLAN PROVISIONS
88
Miscellaneous Member
Any Member who is not a Safety Member is a Miscellaneous Member. Miscellaneous
Members are called “Nonsafety Members” Under PEPRA.
Safety Member
Any sworn Member engaged in law enforcement or fire suppression, and most
probation officers are Safety Members.
Membership
Eligibility
All full-time, permanent employees of the City of San Rafael, Novato Fire Protection
Districts, Marin County, and other participating special districts become Members on
their date of appointment.
PEPRA: A New Member is any Member joining the Plan for the first time on or after
January 1, 2013, or who was a member of the Plan previously but withdrew MCERA
contributions and did not redeposit them with interest upon reentry. Employees who
transfer from and are eligible for reciprocity with another public employer will not be
New Members if their service in the reciprocal system was under a pre-PEPRA tier.
Member Contributions
Each Member contributes a percentage of Compensation to the Plan through payroll
deduction. The percentage contributed depends on the Member’s age upon joining the
Plan, and is determined in accordance with the requirements of the ’37 Act. Members
do not contribute after earning 30 years of Credited Service.
Interest is credited semiannually to each Member’s accumulated contributions. The
crediting rate is set by the Board; the current annual rate is 7.25%.
PEPRA: New Members must contribute half of the normal cost of the Plan.
Contributions for these Members will be based on the Normal Cost associated with
their benefits; General and Safety members will pay different rates, as will those with
different COLA caps.
New Members will pay a single contribution rate, not a rate based on entry age. All
New Members are expected to continue contributing after earning 30 years of service.
Service Retirement
Eligibility
Miscellaneous County Members hired after July 1, 2008, Courts Members hired after
January 1, 2009, and San Rafael Miscellaneous Members hired after July 1, 2011 are
eligible to retire at age 55 if they have earned ten years of Credited Service. All other

MARIN COUNTY EMPLOYEES’ RETIREMENT ASSOCIATION
ACTUARIAL VALUATION REPORT AS OF JUNE 30, 2015
APPENDIX C - SUMMARY OF PLAN PROVISIONS
89
Miscellaneous Members are eligible to retire at age 50 if they have earned ten years
of Credited Service. Alternatively, Miscellaneous Members are eligible to retire at
any age after having earned 30 years of Credited Service, or upon reaching age 70
with no service requirement.
Safety Members are eligible to retire at age 50 if they have earned ten years of
Credited Service. Alternatively, Safety Members are eligible to retire at any age after
having earned 20 years of Credited Service, or upon reaching age 70 with no service
requirement.
PEPRA: New Nonsafety Members are eligible to retire upon attaining age 52 and
completing five or more years of service, or upon reaching age 70 with no service
requirement. New Safety Members are eligible to retire upon attaining age 50 and
completing five or more years of service, or upon reaching age 70 with no service
requirement. New Members must reach PEPRA-specified ages, regardless of their
years of service, to retire for service.
Benefit Amount
The Service Retirement Benefit payable to the Member is equal to the Member’s
Final Compensation multiplied by credited service, the benefit factor from Table 1
and the age factor from Table 2 corresponding to the Member’s code section. The age
factor multiplied by the benefit factor for each code section is also shown in Table 2,
other than the PEPRA factors. The appropriate code sections for each group are listed
in Table 1 on the next page.
The percentage of Final Compensation may not exceed 100%.

MARIN COUNTY EMPLOYEES’ RETIREMENT ASSOCIATION
ACTUARIAL VALUATION REPORT AS OF JUNE 30, 2015
APPENDIX C - SUMMARY OF PLAN PROVISIONS
90
Description Class FAP COLA Code Section
Formula
Retirement
Age 1
Benefit Factor
Special Districts Courts Tier 1 Miscellaneous 1 4 31676.14 55.50 2.00%
Special Districts Courts Tier 2 Miscellaneous 3 2 31676.1 61.25 2.00%
Special Districts Courts Tier 3 Miscellaneous 3 2 31676.16 55.00 2.00%
Special Districts Courts Tier 4 Miscellaneous 3 2 31676.16 55.00 2.00%
Special Districts Courts Tier 5 Miscellaneous 3 2 7522.20 62.00 2.00%
Special Districts LAFCO Tier 7 (also referred to as Tier 2) Miscellaneous 1 4 31676.11 58.50 2.00%
Special Districts LAFCO Tier 3 Miscellaneous 3 2 31676.16 55.00 2.00%
Special Districts LAFCO Tier 4 Miscellaneous 3 2 7522.20 62.00 2.00%
Special Districts Marin City CSD Tier 1 Miscellaneous 1 4 31676.11 58.50 2.00%
Special Districts Marin City CSD Tier 2 Miscellaneous 3 4 7522.20 62.00 2.00%
Special Districts Mosquito District Tier 1 Miscellaneous 1 4 31676.14 55.50 2.00%
Special Districts Mosquito District Tier 2 Miscellaneous 3 4 7522.20 62.00 2.00%
Special Districts Tamalpais CSD Tier 1 Miscellaneous 1 4 31676.11 58.50 2.00%
Special Districts Tamalpais CSD Tier 2 Miscellaneous 3 4 7522.20 62.00 2.00%
Special Districts South Marin Fire Miscellaneous Tier 1 Miscellaneous 1 4 31676.19 55.00 2.70%
Special Districts South Marin Fire Miscellaneous Tier 2 Miscellaneous 3 4 7522.20 62.00 2.00%
Special Districts South Marin Fire Safety Tier 1 Safety 1 4 31664.1 50.00 3.00%
Special Districts South Marin Fire Safety Tier 2 Safety 1 4 31664.2 55.00 3.00%
Special Districts South Marin Fire Safety Tier 2A Safety 3 3 31664.2 55.00 3.00%
Special Districts South Marin Fire Safety Tier 3 Safety 3 4 7522.25(d) 57.00 2.70%
Special Districts South Marin Fire Safety Tier 3A Safety 3 3 7522.25(d) 57.00 2.70%
County Miscellaneous Tier 1 Miscellaneous 1 4 31676.14 55.50 2.00%
County Miscellaneous Tier 2 Miscellaneous 3 2 31676.1 61.25 2.00%
County Miscellaneous Tier 3 Miscellaneous 3 2 31676.16 55.00 2.00%
County Miscellaneous Tier 3A 2
Miscellaneous 3 2 31676.16 55.00 2.00%
County Miscellaneous Tier 4 2
Miscellaneous 3 2 31676.1 61.25 2.00%
County Miscellaneous Tier 5 Miscellaneous 3 2 7522.20 62.00 2.00%
County Safety Tier 1A Safety 1 4 31664.2 55.00 3.00%
County Safety Tier 1B Safety 1 4 31664.1 50.00 3.00%
County Safety Tier 2A Safety 3 2 31664.2 55.00 3.00%
County Safety Tier 2B Safety 3 2 31664.1 50.00 3.00%
County Safety Tier 3 Safety 3 2 7522.25(d) 57.00 2.70%
Novato Miscellaneous Tier 1 Miscellaneous 1 4 31676.16 55.00 2.00%
Novato Miscellaneous Tier 2 Miscellaneous 3 4 7522.20 62.00 2.00%
Novato Safety Tier 1 Safety 1 4 31664.1 50.00 3.00%
Novato Safety Tier 2 Safety 1 4 31664.2 55.00 3.00%
Novato Safety Tier 3 Safety 3 4 7522.25(d) 57.00 2.70%
San Rafael Miscellaneous Tier 1 Miscellaneous 1 3 31676.19 55.00 2.70%
San Rafael Miscellaneous Tier 2 2
Miscellaneous 3 2 31676.16 55.00 2.00%
San Rafael Miscellaneous Tier 3 Miscellaneous 3 2 7522.20 62.00 2.00%
San Rafael Fire Tier 1 Safety 1 3 31664.2 55.00 3.00%
San Rafael Fire Tier 2 Safety 3 2 31664.2 55.00 3.00%
San Rafael Safety Tier 1 Safety 1 3 31664.2 55.00 3.00%
San Rafael Safety Tier 2 Safety 3 2 31664.2 55.00 3.00%
San Rafael Safety Tier 3 Safety 3 2 7522.25(d) 57.00 2.70%1 This represents the age at which a retiring member would receive the benefit factor shown in the final column.
2 Members of these Tiers must be age 55 with 10 years of service to receive a service retirement benefit.
Table 1: Member Group Descriptions
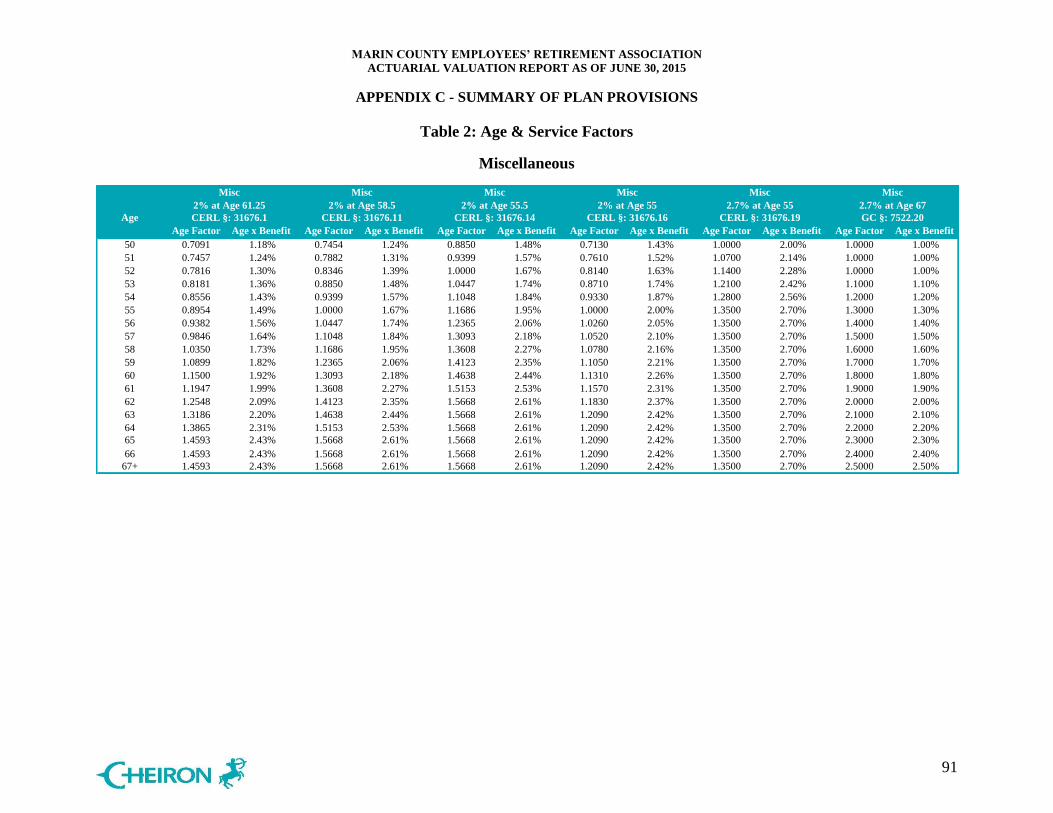
MARIN COUNTY EMPLOYEES’ RETIREMENT ASSOCIATION
ACTUARIAL VALUATION REPORT AS OF JUNE 30, 2015
APPENDIX C - SUMMARY OF PLAN PROVISIONS
91
Table 2: Age & Service Factors
Miscellaneous
Misc Misc Misc Misc Misc Misc
2% at Age 61.25 2% at Age 58.5 2% at Age 55.5 2% at Age 55 2.7% at Age 55 2.7% at Age 67
Age CERL §: 31676.1 CERL §: 31676.11 CERL §: 31676.14 CERL §: 31676.16 CERL §: 31676.19 GC §: 7522.20
Age Factor Age x Benefit Age Factor Age x Benefit Age Factor Age x Benefit Age Factor Age x Benefit Age Factor Age x Benefit Age Factor Age x Benefit
50 0.7091 1.18% 0.7454 1.24% 0.8850 1.48% 0.7130 1.43% 1.0000 2.00% 1.0000 1.00%
51 0.7457 1.24% 0.7882 1.31% 0.9399 1.57% 0.7610 1.52% 1.0700 2.14% 1.0000 1.00%
52 0.7816 1.30% 0.8346 1.39% 1.0000 1.67% 0.8140 1.63% 1.1400 2.28% 1.0000 1.00%
53 0.8181 1.36% 0.8850 1.48% 1.0447 1.74% 0.8710 1.74% 1.2100 2.42% 1.1000 1.10%
54 0.8556 1.43% 0.9399 1.57% 1.1048 1.84% 0.9330 1.87% 1.2800 2.56% 1.2000 1.20%
55 0.8954 1.49% 1.0000 1.67% 1.1686 1.95% 1.0000 2.00% 1.3500 2.70% 1.3000 1.30%
56 0.9382 1.56% 1.0447 1.74% 1.2365 2.06% 1.0260 2.05% 1.3500 2.70% 1.4000 1.40%
57 0.9846 1.64% 1.1048 1.84% 1.3093 2.18% 1.0520 2.10% 1.3500 2.70% 1.5000 1.50%
58 1.0350 1.73% 1.1686 1.95% 1.3608 2.27% 1.0780 2.16% 1.3500 2.70% 1.6000 1.60%
59 1.0899 1.82% 1.2365 2.06% 1.4123 2.35% 1.1050 2.21% 1.3500 2.70% 1.7000 1.70%
60 1.1500 1.92% 1.3093 2.18% 1.4638 2.44% 1.1310 2.26% 1.3500 2.70% 1.8000 1.80%
61 1.1947 1.99% 1.3608 2.27% 1.5153 2.53% 1.1570 2.31% 1.3500 2.70% 1.9000 1.90%
62 1.2548 2.09% 1.4123 2.35% 1.5668 2.61% 1.1830 2.37% 1.3500 2.70% 2.0000 2.00%
63 1.3186 2.20% 1.4638 2.44% 1.5668 2.61% 1.2090 2.42% 1.3500 2.70% 2.1000 2.10%
64 1.3865 2.31% 1.5153 2.53% 1.5668 2.61% 1.2090 2.42% 1.3500 2.70% 2.2000 2.20%
65 1.4593 2.43% 1.5668 2.61% 1.5668 2.61% 1.2090 2.42% 1.3500 2.70% 2.3000 2.30%
66 1.4593 2.43% 1.5668 2.61% 1.5668 2.61% 1.2090 2.42% 1.3500 2.70% 2.4000 2.40%
67+ 1.4593 2.43% 1.5668 2.61% 1.5668 2.61% 1.2090 2.42% 1.3500 2.70% 2.5000 2.50%
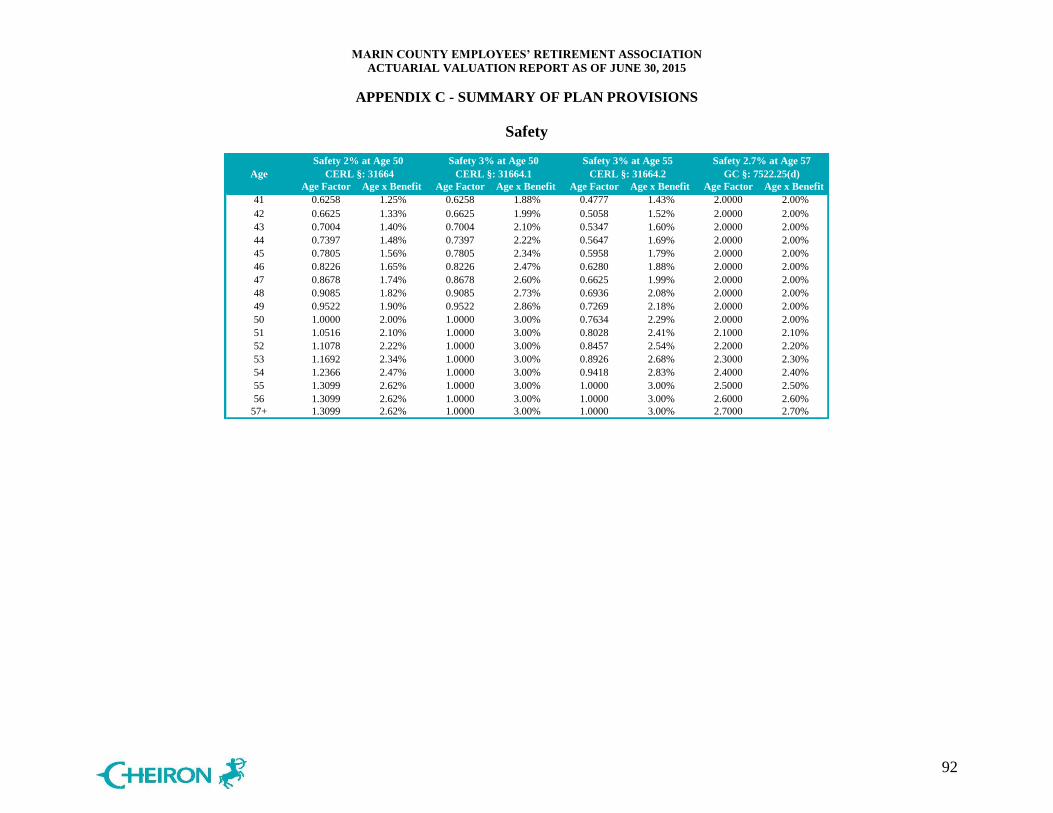
MARIN COUNTY EMPLOYEES’ RETIREMENT ASSOCIATION
ACTUARIAL VALUATION REPORT AS OF JUNE 30, 2015
APPENDIX C - SUMMARY OF PLAN PROVISIONS
92
Safety
Safety 2% at Age 50 Safety 3% at Age 50 Safety 3% at Age 55 Safety 2.7% at Age 57
Age CERL §: 31664 CERL §: 31664.1 CERL §: 31664.2 GC §: 7522.25(d)
Age Factor Age x Benefit Age Factor Age x Benefit Age Factor Age x Benefit Age Factor Age x Benefit
41 0.6258 1.25% 0.6258 1.88% 0.4777 1.43% 2.0000 2.00%
42 0.6625 1.33% 0.6625 1.99% 0.5058 1.52% 2.0000 2.00%
43 0.7004 1.40% 0.7004 2.10% 0.5347 1.60% 2.0000 2.00%
44 0.7397 1.48% 0.7397 2.22% 0.5647 1.69% 2.0000 2.00%
45 0.7805 1.56% 0.7805 2.34% 0.5958 1.79% 2.0000 2.00%
46 0.8226 1.65% 0.8226 2.47% 0.6280 1.88% 2.0000 2.00%
47 0.8678 1.74% 0.8678 2.60% 0.6625 1.99% 2.0000 2.00%
48 0.9085 1.82% 0.9085 2.73% 0.6936 2.08% 2.0000 2.00%
49 0.9522 1.90% 0.9522 2.86% 0.7269 2.18% 2.0000 2.00%
50 1.0000 2.00% 1.0000 3.00% 0.7634 2.29% 2.0000 2.00%
51 1.0516 2.10% 1.0000 3.00% 0.8028 2.41% 2.1000 2.10%
52 1.1078 2.22% 1.0000 3.00% 0.8457 2.54% 2.2000 2.20%
53 1.1692 2.34% 1.0000 3.00% 0.8926 2.68% 2.3000 2.30%
54 1.2366 2.47% 1.0000 3.00% 0.9418 2.83% 2.4000 2.40%
55 1.3099 2.62% 1.0000 3.00% 1.0000 3.00% 2.5000 2.50%
56 1.3099 2.62% 1.0000 3.00% 1.0000 3.00% 2.6000 2.60%
57+ 1.3099 2.62% 1.0000 3.00% 1.0000 3.00% 2.7000 2.70%

MARIN COUNTY EMPLOYEES’ RETIREMENT ASSOCIATION
ACTUARIAL VALUATION REPORT AS OF JUNE 30, 2015
APPENDIX C - SUMMARY OF PLAN PROVISIONS
93
PEPRA: For New Nonsafety Members, the benefit multiplier will be 1% at age 52,
increasing by 0.1% for each year of age to 2.5% at 67. For New Safety Members, the
benefit multiplier will be 2% at age 50, increasing by 0.1% for each year of age to
2.7% at age 57. In between exact ages, the multiplier will increase by 0.025% for
each quarter year increase in age.
New Members are subject to the PEPRA caps and other restrictions on pensionable
compensation described in other parts of the valuation.
Form of Benefit
The Service Retirement Benefit will be paid monthly beginning at retirement and for
the life of the Member. If the member selects the unmodified benefit form, in the
event of the Member’s death 60% of the benefit will continue for the life of the
Member’s spouse or to the age of majority of dependent minor children if there is no
spouse. In the event there is no surviving spouse or minor children, any unpaid
remainder of the Member’s accumulated contributions will be paid to the Member’s
designated beneficiary.
Actuarially equivalent optional benefit forms are also available.
Annually on April 1, benefits are increased or decreased to reflect changes in the CPI
for the San Francisco Bay Area. Annual increases may not exceed the COLA figures
shown in Table 1, but CPI increases above this figure are “banked” and used for
future increases when the CPI increases by less than the figures shown.
In addition, ad hoc cost-of-living adjustments have been granted in the past and may
be granted in the future.
A lump sum benefit of $5,000 will be payable upon the death of a retired member.

MARIN COUNTY EMPLOYEES’ RETIREMENT ASSOCIATION
ACTUARIAL VALUATION REPORT AS OF JUNE 30, 2015
APPENDIX C - SUMMARY OF PLAN PROVISIONS
94
Service-Connected Disability
Eligibility
Members are eligible for Service-Connected Disability Retirement benefits at any age
if they are permanently disabled as a result of injuries or illness sustained in the line
of duty.
Benefit Amount
The Service-Connected Disability Retirement Benefit payable to Members is equal to
the greater of 50% of their Final Compensation or – if the Member is eligible at
disability for a Service Retirement Benefit – the Service Retirement Benefit accrued
on the date of disability.
PEPRA: The Service-Connected Disability Retirement Benefit for New Members
will be based on the new definitions of Pensionable Compensation and Final
Compensation applicable to New Members.
Form of Benefit
The Service-Connected Disability Retirement Benefit will be paid monthly beginning
at the effective date of disability retirement and for the life of the Member; in the
event of the Member’s death, 100% of the benefit will continue for the life of the
Member’s spouse or to the age of majority of dependent minor children if there is no
spouse. In the event there is no surviving spouse or minor children, any unpaid
remainder of the Member’s accumulated contributions will be paid to the Member’s
designated beneficiary.
Actuarially equivalent optional benefit forms and COLA adjustments (as described
for the Service Retirement benefit) are also available. A lump sum benefit of $5,000
will be payable upon the death of the member.

MARIN COUNTY EMPLOYEES’ RETIREMENT ASSOCIATION
ACTUARIAL VALUATION REPORT AS OF JUNE 30, 2015
APPENDIX C - SUMMARY OF PLAN PROVISIONS
95
Nonservice-Connected Disability
Eligibility
Members are eligible to for Nonservice-Connected Disability Retirement benefits if
they are permanently disabled at any age after earning five years of Credited Service.
Benefit Amount
The Nonservice-Connected Disability Retirement Benefit payable to Miscellaneous
Members is equal to the greatest of:
1.5% of Final Compensation at disability multiplied by years of Credited Service
at disability;
1.5% of Final Compensation at disability multiplied by years of Credited Service
projected to age 65, but not to exceed one-third of Final Compensation; or,
If the Member is eligible at disability for a Service Retirement Benefit, the
Service Retirement Benefit accrued on the date of disability.
The Nonservice-Connected Disability Retirement Benefit payable to Safety Members
is equal to the greatest of:
1.8% of Final Compensation at disability multiplied by years of Credited Service
at disability;
1.8% of Final Compensation at disability multiplied by years of Credited Service
projected to age 55, but not to exceed one-third of Final Compensation; or,
If the Member is eligible at disability for a Service Retirement Benefit, the
Service Retirement Benefit accrued on the date of disability.
PEPRA: The Nonservice-Connected Disability Retirement Benefit for New Members
will be based on the new definitions of Pensionable Compensation and Final
Compensation applicable to New Members.
Form of Benefit
The Nonservice-Connected Disability Retirement Benefit will be paid monthly
beginning at the effective date of disability retirement, and for the life of the Member;
in the event of the Member’s death, 60% of the benefit will continue for the life of the
Member’s spouse or to the age of majority of dependent minor children if there is no
spouse. In the event there is no surviving spouse or minor children, any unpaid
remainder of the Member’s accumulated contributions will be paid to the Member’s
designated beneficiary.

MARIN COUNTY EMPLOYEES’ RETIREMENT ASSOCIATION
ACTUARIAL VALUATION REPORT AS OF JUNE 30, 2015
APPENDIX C - SUMMARY OF PLAN PROVISIONS
96
Actuarially equivalent optional benefit forms and COLA adjustments (as described
for the Service Retirement benefit) are also available. A lump sum benefit of $5,000
will be payable upon the death of the member.
Pre-Retirement Death
Eligibility
A Member’s survivors are eligible to receive different Death benefits dependent on
the Member’s cause of death and retirement eligibility.
Benefit Amount
In the event the Member’s death resulted from injury or illness sustained in
connection with the Member’s duties, the Death Benefit payable to a surviving
spouse or domestic partner will be 50% of the Member’s Final Compensation.
In the event the Member was eligible for Service Retirement or Non-Service
Connected Disability, the Death Benefit payable to the survivor will be 60% of the
survivor benefit based on benefit due on Member’s date of death.
In all other cases, the eligible survivor will receive a refund of the Member’s
contributions with interest plus one month of Final Compensation for each year of
service to a maximum of six years.
PEPRA: The Death Benefits for New Members related to Final Compensation will be
based on the new definitions of Pensionable Compensation and Final Compensation
applicable to New Members.
Form of Benefit
The Service-Connected Death Benefit will be paid monthly beginning at the
Member’s death and for the life of the surviving spouse or to the age of majority of
dependent minor children if there is no spouse.
COLA adjustments (as described for the Service Retirement benefit) are also
available.
Withdrawal Benefit
Eligibility
A Member is eligible for a Withdrawal Benefit upon termination of employment.

MARIN COUNTY EMPLOYEES’ RETIREMENT ASSOCIATION
ACTUARIAL VALUATION REPORT AS OF JUNE 30, 2015
APPENDIX C - SUMMARY OF PLAN PROVISIONS
97
Benefit Amount
The Withdrawal Benefit is a refund of the Member’s accumulated Contributions with
interest. Upon receipt of the Withdrawal Benefit the Member forfeits all Credited
Service. Alternatively, the Member can leave contributions on deposit and retire at
the date first eligible (age 70 for those not vested).
Form of Benefit
The Withdrawal Benefit is paid in a lump sum upon election by the Member.
Deferred Vested Benefit
Eligibility
A Member is eligible for a Deferred Vested Benefit upon termination of employment
after earning five years of Credited Service, including reciprocity service from
another system. The Member must leave his or her Member Contributions with
interest on deposit with the Plan.
Benefit Amount
The Deferred Vested Benefit is computed in the same manner as the Service
Retirement Benefit, but it is based on Credited Service and Final Compensation on
the date of termination.
PEPRA: For New Members, the Deferred Vested Benefit will be based on the new
benefit formulas, and will be based on the new definitions of Pensionable
Compensation and Final Compensation applicable to New Members.
Form of Benefit
The Deferred Vested Benefit will be paid monthly beginning at retirement and for the
life of the Member; in the event of the Member’s death, 60% of the benefit will
continue for the life of the Member’s spouse or to the age of majority of dependent
minor children if there is no spouse. In the event there is no surviving spouse or
minor children, any unpaid remainder of the Member’s accumulated contributions
will be paid to the Member’s designated beneficiary.
Actuarially equivalent optional benefit forms and COLA adjustments (as described
for the Service Retirement benefit) are also available. A lump sum benefit of $ 5,000
will be payable upon the death of the member.
PEPRA: For New Members, the Deferred Vested Benefit may commence at the new
service retirement eligibility criteria (age 52 for Nonsafety, age 50 for Safety.)

MARIN COUNTY EMPLOYEES’ RETIREMENT ASSOCIATION
ACTUARIAL VALUATION REPORT AS OF JUNE 30, 2015
APPENDIX C - SUMMARY OF PLAN PROVISIONS
98
Reciprocal Benefit
Eligibility
A Member is eligible for a Reciprocal Benefit upon termination of employment and
entry, within a specified period of time, into another retirement system recognized as
a reciprocal system by the Plan. In addition, the Member must leave his or her
Member Contributions with interest on deposit with the Plan.
Benefit Amount
The Reciprocal Benefit is computed in the same manner as the Service Retirement
Benefit, but it is based on Credited Service on the date of termination and Final
Compensation on the date of retirement; Final Compensation is based on the highest
of the Compensation earned under this Plan or the reciprocal plan.
PEPRA: For New Members, the Reciprocal Benefit will be based on the new benefit
formulas, and will be based on the new definitions of Pensionable Compensation and
Final Compensation applicable to New Members.
Form of Benefit
The Reciprocal Benefit will be paid monthly beginning at retirement and for the life
of the Member; in the event of the Member’s death, 60% of the benefit will continue
for the life of the Member’s spouse or to the age of majority of dependent minor
children if there is no spouse. In the event there is no surviving spouse or minor
children, any unpaid remainder of the Member’s accumulated contributions will be
paid to the Member’s designated beneficiary.
Actuarially equivalent optional benefit forms and COLA adjustments (as described
for the Service Retirement benefit) are also available.
A lump sum benefit may be payable upon the death of a retired Member by the last
system the Member worked under.
PEPRA: For New Members, the Reciprocal Benefit may commence at the new
service retirement eligibility criteria (age 52 for Nonsafety, age 50 for Safety.)

MARIN COUNTY EMPLOYEES’ RETIREMENT ASSOCIATION
ACTUARIAL VALUATION REPORT AS OF JUNE 30, 2015
APPENDIX C - SUMMARY OF PLAN PROVISIONS
99
Optional Benefit Forms
Prior to retirement, a member may elect to convert his retirement allowance into a
benefit of equivalent actuarial value in accordance with one of the optional forms
described below.
1. A reduced retirement allowance payable during his life with the provision that on
his death the excess, if any, of his accumulated deductions at the time of
retirement over the annuity payments made to him will be paid to his designated
beneficiary or estate; or,
2. A reduced retirement allowance payable during his life with the provision that
after his death the reduced allowance will be continued for life to the beneficiary
designated by him at the time of his retirement; or,
3. A reduced retirement allowance payable during his life with the provision that
after his death an allowance of one-half of his reduced allowance will be
continued for life to the beneficiary designated by him at the time of his
retirement.
PEPRA: No change.
MARIN COUNTY EMPLOYEES’ RETIREMENT ASSOCIATION
ACTUARIAL VALUATION REPORT AS OF JUNE 30, 2015
APPENDIX D - GLOSSARY
100
1. Actuarial Assumptions
Assumptions as to the occurrence of future events affecting pension costs such as mortality,
withdrawal, disability, retirement, changes in compensation, and rates of investment return.
2. Actuarial Cost Method
A procedure for determining the Actuarial Present Value of pension plan benefits and
expenses and for developing an allocation of such value to each year of service, usually in
the form of a Normal Cost and an Actuarial Liability.
3. Actuarial Gain (Loss)
The difference between actual experience and that expected based upon a set of Actuarial
Assumptions during the period between two Actuarial Valuation dates, as determined in
accordance with a particular Actuarial Cost Method.
4. Actuarial Liability
The portion of the Actuarial Present Value of Projected Benefits which will not be paid by
future Normal Costs. It represents the value of the past Normal Costs with interest to the
valuation date.
5. Actuarial Present Value (Present Value)
The value as of a given date of a future amount or series of payments. The Actuarial Present
Value discounts the payments to the given date at the assumed investment return and
includes the probability of the payment being made.
6. Actuarial Valuation
The determination, as of a specified date, of the Normal Cost, Actuarial Liability, Actuarial
Value of Assets, and related Actuarial Present Values for a pension plan.

MARIN COUNTY EMPLOYEES’ RETIREMENT ASSOCIATION
ACTUARIAL VALUATION REPORT AS OF JUNE 30, 2015
APPENDIX D - GLOSSARY
101
7. Actuarial Value of Assets
The value of cash, investments, and other property belonging to a pension plan as used by the
actuary for the purpose of an Actuarial Valuation. The purpose of an Actuarial Value of
Assets is generally to smooth out fluctuations in market values. As of the June 30, 2014
valuation no smoothing of the assets is applied, and the Actuarial Value equals the Market
Value.
8. Actuarially Equivalent
Of equal Actuarial Present Value, determined as of a given date, with each value based on
the same set of actuarial assumptions.
9. Amortization Payment
The portion of the pension plan contribution which is designed to pay interest and principal
on the Unfunded Actuarial Liability in order to pay for that liability in a given number of
years.
10. Entry Age Normal Actuarial Cost Method
A method under which the Actuarial Present Value of the Projected Benefits of each
individual included in an Actuarial Valuation is allocated on a level basis over the earnings
of the individual between entry age and assumed exit ages.
11. Funded Ratio
The ratio of the Actuarial Value of Assets to the Actuarial Liability.
12. Normal Cost
That portion of the Actuarial Present Value of pension plan benefits and expenses which is
allocated to a valuation year by the Actuarial Cost Method.
13. Projected Benefits
Those pension plan benefit amounts which are expected to be paid in the future under a
particular set of Actuarial Assumptions, taking into account such items as increases in future
compensation and service credits.
14. Unfunded Actuarial Liability
The excess of the Actuarial Liability over the Actuarial Value of Assets.
MARIN COUNTY EMPLOYEES’ RETIREMENT ASSOCIATION
ACTUARIAL VALUATION REPORT AS OF JUNE 30, 2015
APPENDIX E - MEMBER CONTRIBUTION RATES
102
Employee contribution rates vary by member Group and Tier. The basic rates are determined
based on Government Code Section 31621 for General members (31621.1 for members under
benefit section 31676.11, 31621.8 for members under benefit 31676.19) and Section 31639.25
for Safety members. The COLA rates for members are determined based on 50% of the normal
cost associated with the expected COLA benefits, determined for each individual entry age. A
cap on the employee COLA contribution rate is applied to the County and Courts members.
Some County Safety groups are paying additional employee contributions as a result of
bargaining agreements.
The current rates were determined based on an interest rate of 7.25% per annum, an average
salary increase of 3.00% per year (plus service-based increases for merit/longevity), and the
CalPERS 2014 Post-Retirement Healthy Mortality rates, adjusted by 110% for Safety Males and
95% for Miscellaneous and Safety Females, with a status projection from a base year of 2009 to
the year 2037 using Scale MP-2014.
The rates are blended based on a male/female weighting of 40% male/60% female for General
members, and 85% male/15% female for Safety members. Basic and COLA rates were
determined based on an assumption that members would cease making contributions after 30
years of service.
Employee contribution rates for PEPRA members are determined based on half the Normal Cost
for the PEPRA members (computed separately for General and Safety members, and those with
2%, 3% or 4% capped COLAs). Due to the passage of SB13, contribution rates for PEPRA
members are not rounded, and are recomputed each year.
A load is added to the employee contributions to cover their share of the expected administrative
expenses. For the current valuation, the load is 4.8% of the total unadjusted contribution rate.

MARIN COUNTY EMPLOYEES’ RETIREMENT ASSOCIATION
ACTUARIAL VALUATION REPORT AS OF JUNE 30, 2015
APPENDIX E - MEMBER CONTRIBUTION RATES
103
Entry COL Limited
Age Basic COL to 1.58% Total
20 5.92% 1.98% 1.58% 7.50%
21 5.98% 2.04% 1.58% 7.56%
22 6.01% 2.12% 1.58% 7.59%
23 6.05% 2.18% 1.58% 7.63%
24 6.08% 2.24% 1.58% 7.66%
25 6.11% 2.31% 1.58% 7.69%
26 6.13% 2.38% 1.58% 7.71%
27 6.15% 2.44% 1.58% 7.73%
28 6.17% 2.50% 1.58% 7.75%
29 6.18% 2.57% 1.58% 7.76%
30 6.18% 2.63% 1.58% 7.76%
31 6.30% 2.68% 1.58% 7.88%
32 6.43% 2.73% 1.58% 8.01%
33 6.55% 2.79% 1.58% 8.13%
34 6.68% 2.85% 1.58% 8.26%
35 6.80% 2.91% 1.58% 8.38%
36 6.94% 2.97% 1.58% 8.52%
37 7.08% 3.03% 1.58% 8.66%
38 7.21% 3.09% 1.58% 8.79%
39 7.36% 3.14% 1.58% 8.94%
40 7.51% 3.20% 1.58% 9.09%
41 7.65% 3.25% 1.58% 9.23%
42 7.80% 3.29% 1.58% 9.38%
43 7.96% 3.34% 1.58% 9.54%
44 8.13% 3.40% 1.58% 9.71%
45 8.29% 3.44% 1.58% 9.87%
46 8.46% 3.46% 1.58% 10.04%
47 8.64% 3.50% 1.58% 10.22%
48 8.83% 3.53% 1.58% 10.41%
49 9.02% 3.56% 1.58% 10.60%
50 9.23% 3.56% 1.58% 10.81%
51 9.46% 3.56% 1.58% 11.04%
52 9.71% 3.55% 1.58% 11.29%
53 9.98% 3.44% 1.58% 11.56%
54 10.32% 3.31% 1.58% 11.90%
55 10.59% 3.20% 1.58% 12.17%
56 10.56% 3.07% 1.58% 12.14%
57 10.37% 2.96% 1.58% 11.95%
58 10.19% 2.83% 1.58% 11.77%
59+ 10.00% 2.71% 1.58% 11.58%
County Miscellaneous and Courts: Tier 1 (31676.14)

MARIN COUNTY EMPLOYEES’ RETIREMENT ASSOCIATION
ACTUARIAL VALUATION REPORT AS OF JUNE 30, 2015
APPENDIX E - MEMBER CONTRIBUTION RATES
104
Entry COL Limited
Age Basic COL to 1.58% Total
20 5.63% 0.99% 0.99% 6.62%
21 5.68% 1.02% 1.02% 6.70%
22 5.72% 1.05% 1.05% 6.77%
23 5.76% 1.08% 1.08% 6.84%
24 5.80% 1.11% 1.11% 6.91%
25 5.82% 1.14% 1.14% 6.96%
26 5.85% 1.17% 1.17% 7.02%
27 5.85% 1.22% 1.22% 7.07%
28 5.87% 1.26% 1.26% 7.13%
29 5.88% 1.29% 1.29% 7.17%
30 5.88% 1.33% 1.33% 7.21%
31 6.00% 1.37% 1.37% 7.37%
32 6.13% 1.40% 1.40% 7.53%
33 6.23% 1.45% 1.45% 7.68%
34 6.36% 1.48% 1.48% 7.84%
35 6.49% 1.52% 1.52% 8.01%
36 6.63% 1.55% 1.55% 8.18%
37 6.75% 1.58% 1.58% 8.33%
38 6.93% 1.62% 1.58% 8.51%
39 7.10% 1.66% 1.58% 8.68%
40 7.23% 1.69% 1.58% 8.81%
41 7.38% 1.72% 1.58% 8.96%
42 7.53% 1.75% 1.58% 9.11%
43 7.67% 1.79% 1.58% 9.25%
44 7.83% 1.82% 1.58% 9.41%
45 7.99% 1.86% 1.58% 9.57%
46 8.16% 1.89% 1.58% 9.74%
47 8.34% 1.91% 1.58% 9.92%
48 8.51% 1.94% 1.58% 10.09%
49 8.70% 1.97% 1.58% 10.28%
50 8.90% 1.98% 1.58% 10.48%
51 9.12% 2.00% 1.58% 10.70%
52 9.36% 2.01% 1.58% 10.94%
53 9.59% 1.99% 1.58% 11.17%
54 9.71% 1.95% 1.58% 11.29%
55 9.68% 1.89% 1.58% 11.26%
56 9.53% 1.82% 1.58% 11.11%
57 9.36% 1.76% 1.58% 10.94%
58 9.68% 1.69% 1.58% 11.26%
59+ 9.97% 1.62% 1.58% 11.55%
County Miscellaneous and Courts: Tier 2 (31676.1)
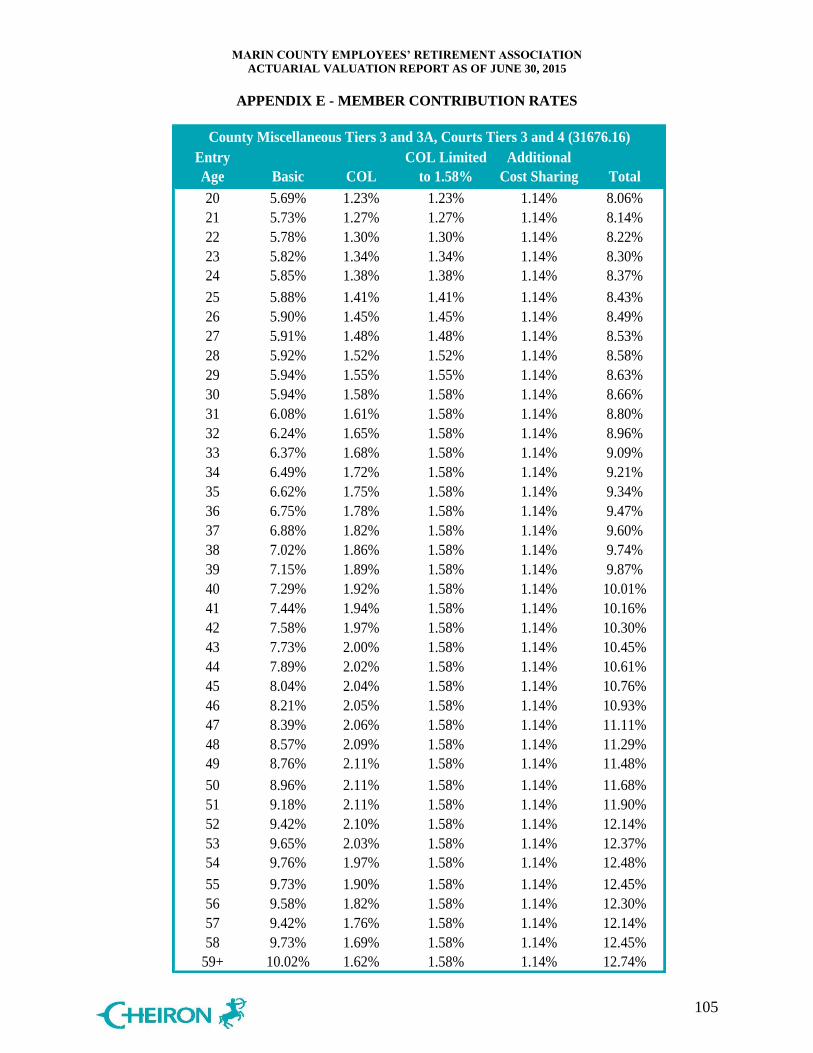
MARIN COUNTY EMPLOYEES’ RETIREMENT ASSOCIATION
ACTUARIAL VALUATION REPORT AS OF JUNE 30, 2015
APPENDIX E - MEMBER CONTRIBUTION RATES
105
Entry COL Limited Additional
Age Basic COL to 1.58% Cost Sharing Total
20 5.69% 1.23% 1.23% 1.14% 8.06%
21 5.73% 1.27% 1.27% 1.14% 8.14%
22 5.78% 1.30% 1.30% 1.14% 8.22%
23 5.82% 1.34% 1.34% 1.14% 8.30%
24 5.85% 1.38% 1.38% 1.14% 8.37%
25 5.88% 1.41% 1.41% 1.14% 8.43%
26 5.90% 1.45% 1.45% 1.14% 8.49%
27 5.91% 1.48% 1.48% 1.14% 8.53%
28 5.92% 1.52% 1.52% 1.14% 8.58%
29 5.94% 1.55% 1.55% 1.14% 8.63%
30 5.94% 1.58% 1.58% 1.14% 8.66%
31 6.08% 1.61% 1.58% 1.14% 8.80%
32 6.24% 1.65% 1.58% 1.14% 8.96%
33 6.37% 1.68% 1.58% 1.14% 9.09%
34 6.49% 1.72% 1.58% 1.14% 9.21%
35 6.62% 1.75% 1.58% 1.14% 9.34%
36 6.75% 1.78% 1.58% 1.14% 9.47%
37 6.88% 1.82% 1.58% 1.14% 9.60%
38 7.02% 1.86% 1.58% 1.14% 9.74%
39 7.15% 1.89% 1.58% 1.14% 9.87%
40 7.29% 1.92% 1.58% 1.14% 10.01%
41 7.44% 1.94% 1.58% 1.14% 10.16%
42 7.58% 1.97% 1.58% 1.14% 10.30%
43 7.73% 2.00% 1.58% 1.14% 10.45%
44 7.89% 2.02% 1.58% 1.14% 10.61%
45 8.04% 2.04% 1.58% 1.14% 10.76%
46 8.21% 2.05% 1.58% 1.14% 10.93%
47 8.39% 2.06% 1.58% 1.14% 11.11%
48 8.57% 2.09% 1.58% 1.14% 11.29%
49 8.76% 2.11% 1.58% 1.14% 11.48%
50 8.96% 2.11% 1.58% 1.14% 11.68%
51 9.18% 2.11% 1.58% 1.14% 11.90%
52 9.42% 2.10% 1.58% 1.14% 12.14%
53 9.65% 2.03% 1.58% 1.14% 12.37%
54 9.76% 1.97% 1.58% 1.14% 12.48%
55 9.73% 1.90% 1.58% 1.14% 12.45%
56 9.58% 1.82% 1.58% 1.14% 12.30%
57 9.42% 1.76% 1.58% 1.14% 12.14%
58 9.73% 1.69% 1.58% 1.14% 12.45%
59+ 10.02% 1.62% 1.58% 1.14% 12.74%
County Miscellaneous Tiers 3 and 3A, Courts Tiers 3 and 4 (31676.16)

MARIN COUNTY EMPLOYEES’ RETIREMENT ASSOCIATION
ACTUARIAL VALUATION REPORT AS OF JUNE 30, 2015
APPENDIX E - MEMBER CONTRIBUTION RATES
106
Entry COL Limited
Age Basic COL to 1.58% Total
20 5.63% 0.99% 0.99% 6.62%
21 5.68% 1.02% 1.02% 6.70%
22 5.72% 1.06% 1.06% 6.78%
23 5.76% 1.09% 1.09% 6.85%
24 5.80% 1.12% 1.12% 6.92%
25 5.82% 1.15% 1.15% 6.97%
26 5.85% 1.18% 1.18% 7.03%
27 5.86% 1.23% 1.23% 7.09%
28 5.87% 1.27% 1.27% 7.14%
29 5.88% 1.31% 1.31% 7.19%
30 5.88% 1.34% 1.34% 7.22%
31 6.00% 1.38% 1.38% 7.38%
32 6.13% 1.41% 1.41% 7.54%
33 6.23% 1.46% 1.46% 7.69%
34 6.36% 1.49% 1.49% 7.85%
35 6.49% 1.52% 1.52% 8.01%
36 6.63% 1.55% 1.55% 8.18%
37 6.75% 1.58% 1.58% 8.33%
38 6.92% 1.61% 1.58% 8.50%
39 7.10% 1.66% 1.58% 8.68%
40 7.23% 1.69% 1.58% 8.81%
41 7.38% 1.72% 1.58% 8.96%
42 7.53% 1.75% 1.58% 9.11%
43 7.67% 1.78% 1.58% 9.25%
44 7.83% 1.82% 1.58% 9.41%
45 7.99% 1.86% 1.58% 9.57%
46 8.16% 1.89% 1.58% 9.74%
47 8.34% 1.91% 1.58% 9.92%
48 8.51% 1.94% 1.58% 10.09%
49 8.70% 1.97% 1.58% 10.28%
50 8.90% 1.98% 1.58% 10.48%
51 9.12% 2.00% 1.58% 10.70%
52 9.36% 2.01% 1.58% 10.94%
53 9.59% 1.99% 1.58% 11.17%
54 9.71% 1.95% 1.58% 11.29%
55 9.68% 1.89% 1.58% 11.26%
56 9.53% 1.82% 1.58% 11.11%
57 9.36% 1.76% 1.58% 10.94%
58 9.68% 1.69% 1.58% 11.26%
59+ 9.97% 1.62% 1.58% 11.55%
County Miscellaneous Tier 4 (31676.1)

MARIN COUNTY EMPLOYEES’ RETIREMENT ASSOCIATION
ACTUARIAL VALUATION REPORT AS OF JUNE 30, 2015
APPENDIX E - MEMBER CONTRIBUTION RATES
107
Entry COL Limited Additional
Age Basic COL to 3.10% Cost Sharing Total
20 8.61% 3.83% 3.10% 3.64% 15.35%
21 8.75% 3.94% 3.10% 3.64% 15.49%
22 8.89% 4.05% 3.10% 3.64% 15.63%
23 9.02% 4.17% 3.10% 3.64% 15.76%
24 9.16% 4.28% 3.10% 3.64% 15.90%
25 9.31% 4.36% 3.10% 3.64% 16.05%
26 9.45% 4.45% 3.10% 3.64% 16.19%
27 9.60% 4.56% 3.10% 3.64% 16.34%
28 9.75% 4.67% 3.10% 3.64% 16.49%
29 9.89% 4.79% 3.10% 3.64% 16.63%
30 10.05% 4.89% 3.10% 3.64% 16.79%
31 10.21% 5.03% 3.10% 3.64% 16.95%
32 10.36% 5.16% 3.10% 3.64% 17.10%
33 10.52% 5.28% 3.10% 3.64% 17.26%
34 10.69% 5.40% 3.10% 3.64% 17.43%
35 10.86% 5.46% 3.10% 3.64% 17.60%
36 11.03% 5.48% 3.10% 3.64% 17.77%
37 11.19% 5.50% 3.10% 3.64% 17.93%
38 11.38% 5.58% 3.10% 3.64% 18.12%
39 11.56% 5.64% 3.10% 3.64% 18.30%
40 11.75% 5.71% 3.10% 3.64% 18.49%
41 11.95% 5.79% 3.10% 3.64% 18.69%
42 12.16% 5.87% 3.10% 3.64% 18.90%
43 12.38% 5.98% 3.10% 3.64% 19.12%
44 12.63% 6.09% 3.10% 3.64% 19.37%
45 12.90% 6.20% 3.10% 3.64% 19.64%
46 13.14% 6.16% 3.10% 3.64% 19.88%
47 13.09% 6.22% 3.10% 3.64% 19.83%
48 13.04% 6.28% 3.10% 3.64% 19.78%
49+ 12.99% 6.35% 3.10% 3.64% 19.73%
County Safety: Tier 1A (31664.2)

MARIN COUNTY EMPLOYEES’ RETIREMENT ASSOCIATION
ACTUARIAL VALUATION REPORT AS OF JUNE 30, 2015
APPENDIX E - MEMBER CONTRIBUTION RATES
108
Entry COL Limited Additional
Age Basic COL to 3.10% Cost Sharing Total
20 8.61% 4.49% 3.10% 3.64% 15.35%
21 8.75% 4.52% 3.10% 3.64% 15.49%
22 8.89% 4.60% 3.10% 3.64% 15.63%
23 9.02% 4.70% 3.10% 3.64% 15.76%
24 9.16% 4.79% 3.10% 3.64% 15.90%
25 9.31% 4.88% 3.10% 3.64% 16.05%
26 9.45% 4.98% 3.10% 3.64% 16.19%
27 9.60% 5.07% 3.10% 3.64% 16.34%
28 9.75% 5.18% 3.10% 3.64% 16.49%
29 9.89% 5.27% 3.10% 3.64% 16.63%
30 10.05% 5.37% 3.10% 3.64% 16.79%
31 10.21% 5.50% 3.10% 3.64% 16.95%
32 10.36% 5.64% 3.10% 3.64% 17.10%
33 10.52% 5.78% 3.10% 3.64% 17.26%
34 10.69% 5.89% 3.10% 3.64% 17.43%
35 10.86% 6.00% 3.10% 3.64% 17.60%
36 11.03% 6.11% 3.10% 3.64% 17.77%
37 11.19% 6.24% 3.10% 3.64% 17.93%
38 11.38% 6.35% 3.10% 3.64% 18.12%
39 11.56% 6.47% 3.10% 3.64% 18.30%
40 11.75% 6.58% 3.10% 3.64% 18.49%
41 11.95% 6.41% 3.10% 3.64% 18.69%
42 12.16% 6.44% 3.10% 3.64% 18.90%
43 12.38% 6.50% 3.10% 3.64% 19.12%
44 12.63% 6.58% 3.10% 3.64% 19.37%
45 12.90% 6.69% 3.10% 3.64% 19.64%
46 13.14% 6.69% 3.10% 3.64% 19.88%
47 13.09% 6.70% 3.10% 3.64% 19.83%
48 13.04% 6.70% 3.10% 3.64% 19.78%
49+ 12.99% 6.72% 3.10% 3.64% 19.73%
Some members who are receiving enhanced benefits under 31664.1 are paying an
additional 2.60%, 3.530% or 3.885%, depending on their bargaining agreement.
County Safety: Tier 1B (31664.1)

MARIN COUNTY EMPLOYEES’ RETIREMENT ASSOCIATION
ACTUARIAL VALUATION REPORT AS OF JUNE 30, 2015
APPENDIX E - MEMBER CONTRIBUTION RATES
109
Entry COL Limited Additional
Age Basic COL to 3.10% Cost Sharing Total
20 8.13% 2.36% 2.36% 3.64% 14.13%
21 8.26% 2.43% 2.43% 3.64% 14.33%
22 8.39% 2.50% 2.50% 3.64% 14.53%
23 8.52% 2.58% 2.58% 3.64% 14.74%
24 8.66% 2.65% 2.65% 3.64% 14.95%
25 8.79% 2.70% 2.70% 3.64% 15.13%
26 8.92% 2.76% 2.76% 3.64% 15.32%
27 9.07% 2.82% 2.82% 3.64% 15.53%
28 9.21% 2.89% 2.89% 3.64% 15.74%
29 9.35% 2.97% 2.97% 3.64% 15.96%
30 9.50% 3.04% 3.04% 3.64% 16.18%
31 9.66% 3.11% 3.10% 3.64% 16.40%
32 9.90% 3.20% 3.10% 3.64% 16.64%
33 10.11% 3.27% 3.10% 3.64% 16.85%
34 10.27% 3.34% 3.10% 3.64% 17.01%
35 10.43% 3.39% 3.10% 3.64% 17.17%
36 10.59% 3.41% 3.10% 3.64% 17.33%
37 10.75% 3.42% 3.10% 3.64% 17.49%
38 10.93% 3.47% 3.10% 3.64% 17.67%
39 11.11% 3.51% 3.10% 3.64% 17.85%
40 11.29% 3.55% 3.10% 3.64% 18.03%
41 11.48% 3.61% 3.10% 3.64% 18.22%
42 11.68% 3.66% 3.10% 3.64% 18.42%
43 11.90% 3.73% 3.10% 3.64% 18.64%
44 12.10% 3.80% 3.10% 3.64% 18.84%
45 12.20% 3.87% 3.10% 3.64% 18.94%
46 12.20% 3.85% 3.10% 3.64% 18.94%
47 12.16% 3.89% 3.10% 3.64% 18.90%
48 12.57% 3.93% 3.10% 3.64% 19.31%
49+ 12.99% 3.97% 3.10% 3.64% 19.73%
County Safety: Tier 2A (31664.2)

MARIN COUNTY EMPLOYEES’ RETIREMENT ASSOCIATION
ACTUARIAL VALUATION REPORT AS OF JUNE 30, 2015
APPENDIX E - MEMBER CONTRIBUTION RATES
110
Entry COL Limited Additional Prior
Age Basic COL to 3.10% Cost Sharing Total Total
20 8.70% 2.90% 2.90% 3.64% 15.24% 14.54%
21 8.82% 2.92% 2.92% 3.64% 15.38% 14.68%
22 8.95% 2.98% 2.98% 3.64% 15.57% 14.86%
23 9.10% 3.04% 3.04% 3.64% 15.78% 15.06%
24 9.25% 3.11% 3.10% 3.64% 15.99% 15.26%
25 9.45% 3.16% 3.10% 3.64% 16.19% 15.45%
26 9.65% 3.22% 3.10% 3.64% 16.39% 15.64%
27 9.87% 3.28% 3.10% 3.64% 16.61% 15.85%
28 10.09% 3.36% 3.10% 3.64% 16.83% 16.06%
29 10.29% 3.43% 3.10% 3.64% 17.03% 16.25%
30 10.43% 3.48% 3.10% 3.64% 17.17% 16.39%
31 10.59% 3.57% 3.10% 3.64% 17.33% 16.54%
32 10.76% 3.66% 3.10% 3.64% 17.50% 16.70%
33 10.92% 3.74% 3.10% 3.64% 17.66% 16.85%
34 11.08% 3.82% 3.10% 3.64% 17.82% 17.01%
35 11.25% 3.89% 3.10% 3.64% 17.99% 17.17%
36 11.42% 3.96% 3.10% 3.64% 18.16% 17.33%
37 11.59% 4.05% 3.10% 3.64% 18.33% 17.49%
38 11.77% 4.13% 3.10% 3.64% 18.51% 17.67%
39 11.96% 4.20% 3.10% 3.64% 18.70% 17.85%
40 12.15% 4.28% 3.10% 3.64% 18.89% 18.03%
41 12.35% 4.17% 3.10% 3.64% 19.09% 18.22%
42 12.56% 4.19% 3.10% 3.64% 19.30% 18.42%
43 12.79% 4.24% 3.10% 3.64% 19.53% 18.64%
44 13.00% 4.30% 3.10% 3.64% 19.74% 18.84%
45 13.11% 4.36% 3.10% 3.64% 19.85% 18.94%
46 13.11% 4.37% 3.10% 3.64% 19.85% 18.94%
47 13.06% 4.38% 3.10% 3.64% 19.80% 18.90%
48 13.49% 4.39% 3.10% 3.64% 20.23% 19.31%
49+ 13.93% 4.40% 3.10% 3.64% 20.67% 19.73%
Some members who are receiving enhanced benefits under 31664.1 are paying an additional 2.60%,
3.530% or 3.885%, depending on their bargaining agreement.
County Safety: Tier 2B (31664.1)

MARIN COUNTY EMPLOYEES’ RETIREMENT ASSOCIATION
ACTUARIAL VALUATION REPORT AS OF JUNE 30, 2015
APPENDIX E - MEMBER CONTRIBUTION RATES
111
Entry
Age Basic COL Total
20 7.60% 2.44% 10.04%
21 7.63% 2.55% 10.18%
22 7.65% 2.63% 10.28%
23 7.67% 2.71% 10.38%
24 7.67% 2.81% 10.48%
25 7.67% 2.88% 10.55%
26 7.83% 2.92% 10.75%
27 7.98% 2.97% 10.95%
28 8.14% 3.01% 11.15%
29 8.30% 3.05% 11.35%
30 8.47% 3.11% 11.58%
31 8.64% 3.15% 11.79%
32 8.81% 3.21% 12.02%
33 8.98% 3.26% 12.24%
34 9.16% 3.33% 12.49%
35 9.34% 3.40% 12.74%
36 9.54% 3.45% 12.99%
37 9.73% 3.51% 13.24%
38 9.93% 3.56% 13.49%
39 10.12% 3.61% 13.73%
40 10.33% 3.66% 13.99%
41 10.54% 3.68% 14.22%
42 10.77% 3.70% 14.47%
43 11.01% 3.73% 14.74%
44 11.26% 3.75% 15.01%
45 11.52% 3.77% 15.29%
46 11.80% 3.73% 15.53%
47 12.12% 3.75% 15.87%
48 12.46% 3.76% 16.22%
49 12.87% 3.77% 16.64%
50 13.23% 3.74% 16.97%
51 13.19% 3.72% 16.91%
52 12.95% 3.70% 16.65%
53 12.73% 3.57% 16.30%
54+ 12.49% 3.44% 15.93%
South Marin Fire: Miscellaneous Tier 1 (31676.19)

MARIN COUNTY EMPLOYEES’ RETIREMENT ASSOCIATION
ACTUARIAL VALUATION REPORT AS OF JUNE 30, 2015
APPENDIX E - MEMBER CONTRIBUTION RATES
112
Entry
Age Basic COL Total
20 8.29% 4.49% 12.78%
21 8.42% 4.52% 12.94%
22 8.56% 4.60% 13.16%
23 8.69% 4.70% 13.39%
24 8.84% 4.79% 13.63%
25 8.99% 4.88% 13.87%
26 9.13% 4.98% 14.11%
27 9.28% 5.07% 14.35%
28 9.42% 5.18% 14.60%
29 9.57% 5.27% 14.84%
30 9.72% 5.37% 15.09%
31 9.89% 5.50% 15.39%
32 10.04% 5.64% 15.68%
33 10.19% 5.78% 15.97%
34 10.37% 5.89% 16.26%
35 10.53% 6.00% 16.53%
36 10.70% 6.11% 16.81%
37 10.86% 6.24% 17.10%
38 11.06% 6.35% 17.41%
39 11.23% 6.47% 17.70%
40 11.43% 6.58% 18.01%
41 11.63% 6.41% 18.04%
42 11.83% 6.44% 18.27%
43 12.05% 6.50% 18.55%
44 12.31% 6.58% 18.89%
45 12.57% 6.69% 19.26%
46 12.82% 6.69% 19.51%
47 12.76% 6.70% 19.46%
48 12.71% 6.70% 19.41%
49+ 12.66% 6.72% 19.38%
South Marin Fire Safety: Tier 1 (31664.1)

MARIN COUNTY EMPLOYEES’ RETIREMENT ASSOCIATION
ACTUARIAL VALUATION REPORT AS OF JUNE 30, 2015
APPENDIX E - MEMBER CONTRIBUTION RATES
113
Entry
Age Basic COL Total
20 8.29% 3.83% 12.12%
21 8.43% 3.94% 12.37%
22 8.56% 4.05% 12.61%
23 8.70% 4.17% 12.87%
24 8.83% 4.28% 13.11%
25 8.98% 4.36% 13.34%
26 9.13% 4.45% 13.58%
27 9.27% 4.56% 13.83%
28 9.43% 4.67% 14.10%
29 9.57% 4.79% 14.36%
30 9.73% 4.89% 14.62%
31 9.88% 5.03% 14.91%
32 10.04% 5.16% 15.20%
33 10.20% 5.28% 15.48%
34 10.36% 5.40% 15.76%
35 10.53% 5.46% 15.99%
36 10.70% 5.48% 16.18%
37 10.87% 5.50% 16.37%
38 11.05% 5.58% 16.63%
39 11.23% 5.64% 16.87%
40 11.43% 5.71% 17.14%
41 11.62% 5.79% 17.41%
42 11.83% 5.87% 17.70%
43 12.06% 5.98% 18.04%
44 12.30% 6.09% 18.39%
45 12.58% 6.20% 18.78%
46 12.82% 6.16% 18.98%
47 12.76% 6.22% 18.98%
48 12.71% 6.28% 18.99%
49+ 12.66% 6.35% 19.01%
South Marin Fire Safety: Tier 2 (31664.2)

MARIN COUNTY EMPLOYEES’ RETIREMENT ASSOCIATION
ACTUARIAL VALUATION REPORT AS OF JUNE 30, 2015
APPENDIX E - MEMBER CONTRIBUTION RATES
114
Entry
Age Basic COL Total
20 7.96% 3.49% 11.45%
21 8.09% 3.59% 11.68%
22 8.21% 3.70% 11.91%
23 8.35% 3.80% 12.15%
24 8.48% 3.91% 12.39%
25 8.62% 3.98% 12.60%
26 8.75% 4.07% 12.82%
27 8.90% 4.16% 13.06%
28 9.03% 4.27% 13.30%
29 9.18% 4.37% 13.55%
30 9.32% 4.48% 13.80%
31 9.48% 4.59% 14.07%
32 9.63% 4.71% 14.34%
33 9.79% 4.82% 14.61%
34 9.94% 4.93% 14.87%
35 10.10% 4.99% 15.09%
36 10.26% 5.00% 15.26%
37 10.43% 5.03% 15.46%
38 10.61% 5.09% 15.70%
39 10.78% 5.16% 15.94%
40 10.96% 5.22% 16.18%
41 11.15% 5.28% 16.43%
42 11.35% 5.36% 16.71%
43 11.57% 5.47% 17.04%
44 11.78% 5.57% 17.35%
45 11.88% 5.67% 17.55%
46 11.87% 5.63% 17.50%
47 11.83% 5.68% 17.51%
48 12.25% 5.74% 17.99%
49+ 12.66% 5.81% 18.47%
South Marin Fire Safety: Tier 2A (31664.2)

MARIN COUNTY EMPLOYEES’ RETIREMENT ASSOCIATION
ACTUARIAL VALUATION REPORT AS OF JUNE 30, 2015
APPENDIX E - MEMBER CONTRIBUTION RATES
115
Entry Tamalpais CSD Tier 1 (31676.11)
Age Basic COL Total
20 6.33% 1.74% 8.07%
21 6.35% 1.79% 8.14%
22 6.38% 1.84% 8.22%
23 6.38% 1.91% 8.29%
24 6.39% 1.96% 8.35%
25 6.40% 2.01% 8.41%
26 6.52% 2.08% 8.60%
27 6.65% 2.15% 8.80%
28 6.79% 2.22% 9.01%
29 6.92% 2.28% 9.20%
30 7.05% 2.35% 9.40%
31 7.20% 2.40% 9.60%
32 7.34% 2.46% 9.80%
33 7.48% 2.53% 10.01%
34 7.64% 2.59% 10.23%
35 7.79% 2.65% 10.44%
36 7.95% 2.70% 10.65%
37 8.10% 2.77% 10.87%
38 8.27% 2.82% 11.09%
39 8.44% 2.88% 11.32%
40 8.61% 2.93% 11.54%
41 8.79% 3.00% 11.79%
42 8.97% 3.05% 12.02%
43 9.17% 3.10% 12.27%
44 9.38% 3.17% 12.55%
45 9.60% 3.22% 12.82%
46 9.83% 3.26% 13.09%
47 10.09% 3.30% 13.39%
48 10.39% 3.34% 13.73%
49 10.73% 3.39% 14.12%
50 11.02% 3.41% 14.43%
51 10.98% 3.43% 14.41%
52 10.79% 3.44% 14.23%
53 10.60% 3.36% 13.96%
54 10.41% 3.28% 13.69%
55 10.32% 3.18% 13.50%
56 10.24% 3.06% 13.30%
57 10.14% 2.93% 13.07%
58 10.04% 2.82% 12.86%
59+ 9.93% 2.70% 12.63%
Marin City CSD Tier 1, LAFCO Tier 7,

MARIN COUNTY EMPLOYEES’ RETIREMENT ASSOCIATION
ACTUARIAL VALUATION REPORT AS OF JUNE 30, 2015
APPENDIX E - MEMBER CONTRIBUTION RATES
116
Entry
Age Basic COL Total
20 5.85% 1.98% 7.83%
21 5.90% 2.04% 7.94%
22 5.93% 2.12% 8.05%
23 5.97% 2.18% 8.15%
24 6.01% 2.24% 8.25%
25 6.03% 2.31% 8.34%
26 6.06% 2.38% 8.44%
27 6.08% 2.44% 8.52%
28 6.09% 2.50% 8.59%
29 6.10% 2.57% 8.67%
30 6.10% 2.63% 8.73%
31 6.23% 2.68% 8.91%
32 6.35% 2.73% 9.08%
33 6.48% 2.79% 9.27%
34 6.60% 2.85% 9.45%
35 6.73% 2.91% 9.64%
36 6.86% 2.97% 9.83%
37 7.00% 3.03% 10.03%
38 7.14% 3.09% 10.23%
39 7.29% 3.14% 10.43%
40 7.43% 3.20% 10.63%
41 7.58% 3.25% 10.83%
42 7.73% 3.29% 11.02%
43 7.89% 3.34% 11.23%
44 8.05% 3.40% 11.45%
45 8.21% 3.44% 11.65%
46 8.38% 3.46% 11.84%
47 8.56% 3.50% 12.06%
48 8.75% 3.53% 12.28%
49 8.94% 3.56% 12.50%
50 9.15% 3.56% 12.71%
51 9.38% 3.56% 12.94%
52 9.64% 3.55% 13.19%
53 9.90% 3.44% 13.34%
54 10.24% 3.31% 13.55%
55 10.51% 3.20% 13.71%
56 10.48% 3.07% 13.55%
57 10.29% 2.96% 13.25%
58 10.11% 2.83% 12.94%
59+ 9.93% 2.71% 12.64%
Mosquito District Tier 1 (31676.14)

MARIN COUNTY EMPLOYEES’ RETIREMENT ASSOCIATION
ACTUARIAL VALUATION REPORT AS OF JUNE 30, 2015
APPENDIX E - MEMBER CONTRIBUTION RATES
117
Entry
Age Basic COL Total
20 5.64% 1.23% 6.87%
21 5.68% 1.27% 6.95%
22 5.72% 1.30% 7.02%
23 5.77% 1.34% 7.11%
24 5.80% 1.38% 7.18%
25 5.82% 1.41% 7.23%
26 5.84% 1.45% 7.29%
27 5.86% 1.48% 7.34%
28 5.87% 1.52% 7.39%
29 5.88% 1.55% 7.43%
30 5.88% 1.58% 7.46%
31 6.00% 1.61% 7.61%
32 6.12% 1.65% 7.77%
33 6.23% 1.68% 7.91%
34 6.36% 1.72% 8.08%
35 6.49% 1.75% 8.24%
36 6.63% 1.78% 8.41%
37 6.75% 1.82% 8.57%
38 6.88% 1.86% 8.74%
39 7.02% 1.89% 8.91%
40 7.16% 1.92% 9.08%
41 7.30% 1.94% 9.24%
42 7.45% 1.97% 9.42%
43 7.60% 2.00% 9.60%
44 7.76% 2.02% 9.78%
45 7.92% 2.04% 9.96%
46 8.09% 2.05% 10.14%
47 8.26% 2.06% 10.32%
48 8.43% 2.09% 10.52%
49 8.62% 2.11% 10.73%
50 8.82% 2.11% 10.93%
51 9.04% 2.11% 11.15%
52 9.28% 2.10% 11.38%
53 9.52% 2.03% 11.55%
54 9.63% 1.97% 11.60%
55 9.60% 1.90% 11.50%
56 9.46% 1.82% 11.28%
57 9.29% 1.76% 11.05%
58 9.60% 1.69% 11.29%
59+ 9.93% 1.62% 11.55%
LAFCO Tier 3 (31676.16)

MARIN COUNTY EMPLOYEES’ RETIREMENT ASSOCIATION
ACTUARIAL VALUATION REPORT AS OF JUNE 30, 2015
APPENDIX E - MEMBER CONTRIBUTION RATES
118
Entry
Age Basic COL Total
20 5.85% 2.00% 7.85%
21 5.91% 2.06% 7.97%
22 5.93% 2.13% 8.06%
23 5.97% 2.18% 8.15%
24 6.01% 2.24% 8.25%
25 6.03% 2.31% 8.34%
26 6.06% 2.36% 8.42%
27 6.08% 2.41% 8.49%
28 6.09% 2.46% 8.55%
29 6.10% 2.52% 8.62%
30 6.10% 2.57% 8.67%
31 6.23% 2.62% 8.85%
32 6.35% 2.67% 9.02%
33 6.47% 2.73% 9.20%
34 6.60% 2.78% 9.38%
35 6.73% 2.84% 9.57%
36 6.87% 2.89% 9.76%
37 7.00% 2.95% 9.95%
38 7.14% 3.00% 10.14%
39 7.28% 3.05% 10.33%
40 7.43% 3.10% 10.53%
41 7.58% 3.14% 10.72%
42 7.72% 3.18% 10.90%
43 7.88% 3.23% 11.11%
44 8.05% 3.26% 11.31%
45 8.22% 3.30% 11.52%
46 8.39% 3.30% 11.69%
47 8.57% 3.33% 11.90%
48 8.76% 3.35% 12.11%
49 8.94% 3.39% 12.33%
50 9.15% 3.37% 12.52%
51 9.39% 3.37% 12.76%
52 9.64% 3.36% 13.00%
53 9.90% 3.26% 13.16%
54 10.24% 3.14% 13.38%
55 10.51% 3.03% 13.54%
56 10.48% 2.91% 13.39%
57 10.29% 2.80% 13.09%
58 10.12% 2.68% 12.80%
59+ 9.92% 2.58% 12.50%
Novato Miscellaneous Tier 1 (31676.16)

MARIN COUNTY EMPLOYEES’ RETIREMENT ASSOCIATION
ACTUARIAL VALUATION REPORT AS OF JUNE 30, 2015
APPENDIX E - MEMBER CONTRIBUTION RATES
119
Entry
Age Basic COL Total
20 8.29% 4.55% 12.84%
21 8.43% 4.58% 13.01%
22 8.57% 4.67% 13.24%
23 8.70% 4.77% 13.47%
24 8.84% 4.87% 13.71%
25 8.98% 4.97% 13.95%
26 9.13% 5.06% 14.19%
27 9.27% 5.16% 14.43%
28 9.42% 5.27% 14.69%
29 9.57% 5.37% 14.94%
30 9.73% 5.46% 15.19%
31 9.88% 5.61% 15.49%
32 10.04% 5.74% 15.78%
33 10.20% 5.87% 16.07%
34 10.36% 6.00% 16.36%
35 10.53% 6.10% 16.63%
36 10.70% 6.23% 16.93%
37 10.87% 6.34% 17.21%
38 11.05% 6.47% 17.52%
39 11.24% 6.58% 17.82%
40 11.42% 6.70% 18.12%
41 11.62% 6.53% 18.15%
42 11.83% 6.55% 18.38%
43 12.06% 6.61% 18.67%
44 12.30% 6.70% 19.00%
45 12.58% 6.80% 19.38%
46 12.82% 6.80% 19.62%
47 12.77% 6.81% 19.58%
48 12.72% 6.82% 19.54%
49+ 12.66% 6.83% 19.49%
Novato Safety: Tier 1 (31664.1)

MARIN COUNTY EMPLOYEES’ RETIREMENT ASSOCIATION
ACTUARIAL VALUATION REPORT AS OF JUNE 30, 2015
APPENDIX E - MEMBER CONTRIBUTION RATES
120
Entry
Age Basic COL Total
20 8.29% 3.89% 12.18%
21 8.43% 3.99% 12.42%
22 8.56% 4.11% 12.67%
23 8.70% 4.23% 12.93%
24 8.83% 4.34% 13.17%
25 8.99% 4.43% 13.42%
26 9.13% 4.53% 13.66%
27 9.28% 4.63% 13.91%
28 9.42% 4.75% 14.17%
29 9.57% 4.87% 14.44%
30 9.73% 4.99% 14.72%
31 9.89% 5.11% 15.00%
32 10.04% 5.24% 15.28%
33 10.19% 5.38% 15.57%
34 10.37% 5.49% 15.86%
35 10.54% 5.55% 16.09%
36 10.70% 5.58% 16.28%
37 10.87% 5.60% 16.47%
38 11.06% 5.67% 16.73%
39 11.24% 5.74% 16.98%
40 11.42% 5.82% 17.24%
41 11.62% 5.89% 17.51%
42 11.84% 5.97% 17.81%
43 12.05% 6.09% 18.14%
44 12.31% 6.20% 18.51%
45 12.58% 6.31% 18.89%
46 12.82% 6.27% 19.09%
47 12.77% 6.33% 19.10%
48 12.72% 6.39% 19.11%
49+ 12.66% 6.46% 19.12%
Novato Safety: Tier 2 (31664.2)

MARIN COUNTY EMPLOYEES’ RETIREMENT ASSOCIATION
ACTUARIAL VALUATION REPORT AS OF JUNE 30, 2015
APPENDIX E - MEMBER CONTRIBUTION RATES
121
Entry
Age Basic COL Total
20 7.60% 2.35% 9.95%
21 7.63% 2.44% 10.07%
22 7.65% 2.54% 10.19%
23 7.66% 2.62% 10.28%
24 7.68% 2.70% 10.38%
25 7.67% 2.78% 10.45%
26 7.83% 2.82% 10.65%
27 7.99% 2.86% 10.85%
28 8.15% 2.90% 11.05%
29 8.30% 2.95% 11.25%
30 8.47% 3.00% 11.47%
31 8.64% 3.05% 11.69%
32 8.82% 3.09% 11.91%
33 8.99% 3.15% 12.14%
34 9.16% 3.22% 12.38%
35 9.35% 3.28% 12.63%
36 9.54% 3.33% 12.87%
37 9.72% 3.40% 13.12%
38 9.92% 3.44% 13.36%
39 10.12% 3.48% 13.60%
40 10.34% 3.53% 13.87%
41 10.55% 3.55% 14.10%
42 10.78% 3.57% 14.35%
43 11.00% 3.61% 14.61%
44 11.25% 3.63% 14.88%
45 11.52% 3.65% 15.17%
46 11.80% 3.62% 15.42%
47 12.11% 3.63% 15.74%
48 12.46% 3.64% 16.10%
49 12.87% 3.65% 16.52%
50 13.22% 3.63% 16.85%
51 13.19% 3.59% 16.78%
52 12.96% 3.58% 16.54%
53 12.72% 3.46% 16.18%
54+ 12.50% 3.32% 15.82%
San Rafael Miscellaneous Tier 1 (31676.19)

MARIN COUNTY EMPLOYEES’ RETIREMENT ASSOCIATION
ACTUARIAL VALUATION REPORT AS OF JUNE 30, 2015
APPENDIX E - MEMBER CONTRIBUTION RATES
122
Entry
Age Basic COL Total
20 5.64% 1.25% 6.89%
21 5.68% 1.29% 6.97%
22 5.72% 1.33% 7.05%
23 5.77% 1.37% 7.14%
24 5.80% 1.41% 7.21%
25 5.81% 1.45% 7.26%
26 5.85% 1.48% 7.33%
27 5.86% 1.51% 7.37%
28 5.87% 1.54% 7.41%
29 5.88% 1.56% 7.44%
30 5.88% 1.59% 7.47%
31 6.00% 1.62% 7.62%
32 6.12% 1.66% 7.78%
33 6.23% 1.69% 7.92%
34 6.36% 1.72% 8.08%
35 6.49% 1.75% 8.24%
36 6.63% 1.78% 8.41%
37 6.75% 1.81% 8.56%
38 6.89% 1.84% 8.73%
39 7.02% 1.87% 8.89%
40 7.16% 1.90% 9.06%
41 7.30% 1.93% 9.23%
42 7.45% 1.96% 9.41%
43 7.60% 2.00% 9.60%
44 7.76% 2.03% 9.79%
45 7.91% 2.08% 9.99%
46 8.08% 2.08% 10.16%
47 8.26% 2.10% 10.36%
48 8.43% 2.12% 10.55%
49 8.62% 2.13% 10.75%
50 8.82% 2.13% 10.95%
51 9.04% 2.13% 11.17%
52 9.28% 2.13% 11.41%
53 9.52% 2.06% 11.58%
54 9.63% 1.99% 11.62%
55 9.60% 1.92% 11.52%
56 9.45% 1.86% 11.31%
57 9.29% 1.78% 11.07%
58 9.60% 1.71% 11.31%
59+ 9.92% 1.65% 11.57%
San Rafael Miscellaneous Tier 2 (31676.16)

MARIN COUNTY EMPLOYEES’ RETIREMENT ASSOCIATION
ACTUARIAL VALUATION REPORT AS OF JUNE 30, 2015
APPENDIX E - MEMBER CONTRIBUTION RATES
123
Entry
Age Basic COL Total
20 8.29% 3.69% 11.98%
21 8.43% 3.78% 12.21%
22 8.56% 3.90% 12.46%
23 8.70% 4.01% 12.71%
24 8.83% 4.12% 12.95%
25 8.99% 4.20% 13.19%
26 9.13% 4.30% 13.43%
27 9.28% 4.39% 13.67%
28 9.42% 4.51% 13.93%
29 9.57% 4.61% 14.18%
30 9.72% 4.73% 14.45%
31 9.89% 4.85% 14.74%
32 10.04% 4.97% 15.01%
33 10.20% 5.09% 15.29%
34 10.36% 5.20% 15.56%
35 10.54% 5.27% 15.81%
36 10.70% 5.28% 15.98%
37 10.87% 5.31% 16.18%
38 11.05% 5.38% 16.43%
39 11.24% 5.44% 16.68%
40 11.43% 5.51% 16.94%
41 11.62% 5.59% 17.21%
42 11.83% 5.66% 17.49%
43 12.05% 5.78% 17.83%
44 12.30% 5.88% 18.18%
45 12.58% 5.98% 18.56%
46 12.82% 5.94% 18.76%
47 12.76% 6.01% 18.77%
48 12.71% 6.07% 18.78%
49+ 12.66% 6.13% 18.79%
San Rafael Safety Tier 1 (31664.2)

MARIN COUNTY EMPLOYEES’ RETIREMENT ASSOCIATION
ACTUARIAL VALUATION REPORT AS OF JUNE 30, 2015
APPENDIX E - MEMBER CONTRIBUTION RATES
124
Entry
Age Basic COL Total
20 7.95% 2.39% 10.34%
21 8.08% 2.46% 10.54%
22 8.20% 2.53% 10.73%
23 8.34% 2.61% 10.95%
24 8.48% 2.67% 11.15%
25 8.61% 2.74% 11.35%
26 8.75% 2.79% 11.54%
27 8.90% 2.86% 11.76%
28 9.04% 2.93% 11.97%
29 9.18% 3.01% 12.19%
30 9.33% 3.07% 12.40%
31 9.48% 3.15% 12.63%
32 9.63% 3.24% 12.87%
33 9.79% 3.31% 13.10%
34 9.94% 3.39% 13.33%
35 10.10% 3.43% 13.53%
36 10.26% 3.45% 13.71%
37 10.43% 3.47% 13.90%
38 10.61% 3.51% 14.12%
39 10.79% 3.55% 14.34%
40 10.96% 3.61% 14.57%
41 11.15% 3.65% 14.80%
42 11.35% 3.70% 15.05%
43 11.57% 3.77% 15.34%
44 11.78% 3.85% 15.63%
45 11.87% 3.92% 15.79%
46 11.87% 3.90% 15.77%
47 11.83% 3.94% 15.77%
48 12.24% 3.98% 16.22%
49+ 12.67% 4.02% 16.69%
San Rafael Safety Tier 2 (31664.2)

MARIN COUNTY EMPLOYEES’ RETIREMENT ASSOCIATION
ACTUARIAL VALUATION REPORT AS OF JUNE 30, 2015
APPENDIX E - MEMBER CONTRIBUTION RATES
125
Prior
All Ages Basic COLA Total Total
PEPRA Misc 2% COLA 7.39% 1.79% 9.18% 9.07%
PEPRA Misc 4% COLA 6.05% 2.18% 8.23% 8.31%
PEPRA Safety 2% COLA 10.87% 2.66% 13.53% 13.80%
PEPRA Safety 3% COLA 13.03% 4.56% 17.59% 14.59%
PEPRA Safety 4% COLA 9.94% 3.80% 13.74% 14.92%
PEPRA Rates