marfin pank eesti as - versobank report description of the credit institution and its management...
TRANSCRIPT

*MARFIN BANK
MARFIN PANK EESTI AS(MARFIN BANK ESTONIA LTD.)
ANNUAL REPORT 2009
(TRANSLATION FROM ORIGINAL IN ESTONIAN)
Beginning of reporting year 01.01.2009End of reporting year 31.12.2009
Registry code 10586461Address Pärnu mnt 12, 10148 Tallinn, EstoniaPhone (+372) 6802 500Fax (+372)6802 501E-mail [email protected] home page www. marfinbank.ee

TABLE OF CONTENTS
INTRODUCTION 3
MANAGEMENT REPORT 4
FINANCIAL STATEMENTS 2009 10
MANAGEMENT BoARD’s CONFIRMATION 11STATEMENT OF COMPREHENSIVE INCOME 12STATEMENT OF FINANCIAL POSITION 13STATEMENT OF CASH FLOWS 14STATEMENT OF CHANGES IN EQuITY 15ACCOUNTING POLICIES 16NOTES TO THE FINANCIAL STATEMENTS 32
SIGNATURES OF THE MANAGEMENT BOARD AND THE SUPERVISORYBOARD TO THE ANNUAL REPORT 2009 68
INDEPENDENT AUDITOR’S REPORT 69
THE MANAGEMENT BOARD’S PROFIT ALLOCATION PROPOSAL 70

INTRODUCTION
General Data of Credit Institution
Business nameLocation and addressRegistered in stateRegistration dateRegistry codePhoneFaxS.W.l.F,T.’s BIC codeE-mailInternet home page
Auditor
Auditor’s business nameAuditor’s registry codeAuditor’s location and addressName of partner in chargeName of engagement leader
Report Data
Balance sheet date of reportReport periodReport currency and unitsAdditionally all informationpurposes.
MARFIN PANK EESTI ASPärnu mnt 12, 10148 Tallinn, EstoniaRepublic of Estonia14.10.199910586461 (Estonian Commercial Register)(+372) 6 802 500(+372) 6 802 [email protected]://www. marfinbank.ee
Aktsiaselts PricewaterhouseCoopers10142876Pärnu mnt 15, 10141 Tallinn, EstoniaTilt RaimlaRelika Mell
31.12.200901 .01 .2009 — 31.12.2009Estonian kroon (EEK), in thousands kroons
is presented in thousands of euros (EUR ths.) for illustrative
Classification of Economic Activities (EMTAK 2008): 64191 Credit institutions (banks)
3
MANAGEMENT REPORT
Description of the Credit Institution and its Management Bodies
MARFIN PANK EESTI AS is a credit institution, established in 1999 and operating inEstonia. MARFIN PANK EESTI AS (hereinafter: the Bank) holds the activity licenseissued by Estonian Central Bank (the Bank of Estonia), which allows the Bank to engagein all banking operations. Bank has an account manager status of Estonian CentralDepository for Securities, is the member of S.W.LF.T. and pan-Baltic member of NASDAQOMX Baltic stock exchanges. Bank has joined SEPA (Single Euro Payments Area)systems as an indirect member and the cross-border clearing system TARGET2-Estonia.
MARFIN PANK EESTI AS uses the trademark MARFIN BANK, which is globally used byMarlin Popular Bank group in all international markets.
MARFIN PANK EESTI AS belongs to the banking group of Marlin Popular Bank,registered in Cyprus, and operating in 11 countries with 515 branches. Group has morethan 9000 employees. Year 2009 net profit of the Marlin Popular Bank group totalled 186.7million euros and total assets 41.8 billion euros according to preliminary results. MarlinPopular Bank has a A-3/Prime-1 (outlook: stable) rating by Moody’s Investors Service, andBBB+ (outlook: stable) rating by Fitch Ratings.
The owners of MARFIN PANK EESTI AS, as of the report date, are:52.8379% of shares are owned by Marlin Popular Bank Public Company Ltd. (locationNicosia, Cypros);32.4229% of shares are owned by Mr. Nikolaos Sarros (place of residence Athens,Greece);4.8883% of shares are owned by Sigma Real Estate OU (location Tallinn, Estonia), aprivate limited company under control of Mr. Nikolaos Sarros;4.8883% is owned by FrOsundaviksparken AB (location Angelholm, Sweden), undercontrol of Mr. Ulrich John;2.4938% of shares are owned by Mirage Investments 00 (location Tallinn, Estonia) and2.4688% is owned by Mr. Emmanouil Karavelakis (place of residence Athens, Greece).There were no changes in owners in the year 2009.
The Supervisory Board of the Bank has seven members. Mr. Fotios Karatzenis (Chairmanof the Supervisory Board), Mr. Nikolaos Sarros (Vice-Chairman of the Supervisory Board),Mr. Efthymios Bouloutas, Mr. Achillefs Giannisis, Mr. Frank Ulrich John, Mr. EmmanouilKaravelakis and Mr. Christos Stylianides were the members of the Supervisory Board asof report date. There were no changes in the Supervisory Board in the year 2009.
The Management Board of the Bank has four members. Mr. Riho Rasmann is theChairman of the Management Board, and the members of the Management Board are Mr.Sven Raba, Mr. Mart Veskimagi and Mr. Roul Tutt. The Chairman of the ManagementBoard and the members of the Management Board do not own shares neither hold optionsto acquire shares of the Bank. There were no changes in the Management Board in theyear 2009.
The Bank has neither subsidiaries nor participating interests, exceeding 20% shareholdingin any company. Bank owns 16% of business development company European BusinessDevelopment AS.
4

Description of Economic Environment
Sharp adjustment of Estonian economy to the drop in demand, following the end ofexpansive credit policy, continued in year 2009. Although the negative economiccycle was foreseen already in year 2008, the actual extent of shrinking economywas clearly outside the range of forecasts. The fall was amplified also by the dropin demand brought by the global financial crises in the main export markets ofEstonia, in addition to the shrinking local consumption. The preliminary results are:GDP -14% on a yearly basis and the increase of unemployment to 15.5%. Firststabilisation was reached though in the last quarter of the year, where based onfirst assessments the seasonally adjusted GDP of the 4th quarter rose +2.6%compared with the preceeding quarter. One positive factor was also that the dropin exports was smaller than the drop in imports, resulting in the smallest foreigntrade deficit of the last 15 years and the current account deficit to GDP improvedfrom -17.8% in year 2007 to 6% surplus. Signs of stabilisation were also seen inthe real estate market where the number of purchase-sale transactions grew +30%in the 4th quarter compared with the 3rd quarter, and the prices started to rise, atleast in the more liquid market of apartments. The rise of activity in the real estatemarket was still not followed by the similar adjustment in the mortgage loan market.In yearly terms the number of real estate transactions dropped -23% and the totalvalue of transactions -47% compared with year 2008.
Extensive economic downfall left its mark also on the financial results of thebanking sector. Thus the total of loan and leasing portfolios lent to Estonianhouseholds and companies decreased by 17 billion kroons i.e. 6.4% at the end ofyear 2009 compared with the previous year. The loan portfolio quality declinedsimultaneously and at the year end the loans with arrears exceeding 60 dayscomprised 6.4% of the loan portfolio. At the same time the shorter term arrearsvolumes started to decrease quickly at the end of the year, as a positive indication.Continuous drop in the mortgage loan quality is still possible if the unemploymentlevels remain high. The loan allowances formed to cover potential loan lossesreached 8.5 billion kroons i.e. 3.7% of loan portfolio at the end of year 2009. Quickadjustment in consumption and investment decisions to economic downfall andalso the high kroon interest rates which remained at high levels throughout most ofthe year kept the deposit volumes of private persons and companies from fallingand within a year their total volume even grew by 2 billion kroons i.e. 2%. Estonianbanking sector made 8.9 billion kroons of losses in year 2009.
Although the Estonian kroon interest rates remained significantly higher than theeuro interest rates throughout most of year 2009, the 4th quarter brought first signsof slowdown of economic downfall and improvement in the fiscal balance of thestate, which in turn increased the probability of Estonian successful changeover toeuro, and a fast convergence of kroon and euro interest rates. The differencebetween 6-month Euribor and Talibor decreased from earlier 518 basis points to258 basis points at the end of year 2009 compared with the end of 2008 and theconvergence speeded up in the beginning of year 2010. The low level of Euriborthroughout the year kept also the average loan interest rates stable and theaverage loan interest rates of mortgage loans and long term loans of companieswere 3.4% and 4%, respectively, at the end of year 2009.
5

The outlook of Estonian economy for year 2010 is mainly connected withexpectancies that Estonia will join the euro area in the beginning of year 2011. Theprobability of euro changeover taking place as planned is extremely high, aspreliminary assessments assure that the budget and structural-political measuresapplied by the government have kept the budget deficit less than the 3% to GDPMaastricht criteria and the deflationary pressure to the consumer price index alsoallowed to fulfill the inflation criteria. It was also seen in the drop of kroon interestrates at the end of the year, price drop in credit default swaps allowing themitigation of Estonian credit risk, change in the real estate market and the quickrise of stock prices, which took place on the Tallinn stock exchange in thebeginning of year 2010. Joining the euro area as planned will improve thecredibility of Estonia in the eyes of foreign investors and enhance competitiveness.Euro changeover will also have a further positive effect on property prices andboost the real estate market. The inflow of foreign direct investments to Estonia willalso increase.
The return of foreign demand in the main Estonian export markets plays asignificant role in resuming economic growth, which is also the main basis forgrowth forecasts for year 2010. Current estimations project the GDP growth up to2% in year 2010. Large surplus in production capacities enables the initialfulfillment of demand when foreign demands returns without new capital and timeconsuming investments, which supports the quick recovery of economy.
Major Economic Events
10th year of operations has been a year of fast growth for the Bank, primarily in terms ofcustomer numbers and deposit volumes. Number of customers of the Bank increased 1.3times during the year, the number of active depositors increased 24%. Deposit growth ratewas much higher than the market average, being 1.2 times in client (excluding creditinstitutions) deposits. Volumes of transactions grew even more. The Bank is still offeringfree of charge normal EEK payments within Estonia to its customers in its internet bank,and many other fees and commissions are more favourable as well.
Client deposits with the Bank totalled 425.7 million kroons i.e. 27.2 million euros as of31.12.2009 (357.0 million kroons i.e. 22.8 million euros as of 31.12.2008). Bank continuesto pay higher interest rates on time deposits, than the market average.
Gross loan portfolio (excluding deposits with financial institutions and accrued interests)comprised 617.6 million kroons (39.5 million euros), decreasing 5.6% from beginning ofyear (average of Estonian credit institutions was -8.6%) and forming 83.6% of total assetsas at the end of financial year (31.12.2008: 78.9%). Gross loan portfolio amounted 654.0million kroons i.e. 41.8 million euros as of 31.12.2008. Loans to deposits ratio stood at1.45 at year-end 2009 (1.83 at year-end 2008).
Significant increase in conservative loan and other loss provisions caused the net loss ofthe Bank in year 2009, and first write-offs of hopeless claims were made, totalling 1.2million kroons (0.1 million euros). Net loss of 2009 comprised 84.4 million kroons i.e. 5.4million euros (net loss of 2008 was 12.4 million kroons i.e. 0.8 million euros). Total assetsof the Bank have decreased 10.9% from beginning of the year, reaching 739.0 millionkroons i.e. 47.2 million euros as of 31.12.2009 (as of 31.12.2008 the balance sheet totalwas 829.4 million kroons i.e. 53.0 million euros).
6
Net interest income of the reporting period was 34.8 million kroons i.e. 2.2 million euros(2008: 43.9 million kroons i.e. 2.8 million euros), earned mostly on loans. Net fees andcommissions income totalled 2.3 million kroons i.e. 0.1 million euros (2008: 0.1 millionkroons i.e. 0.01 million euros). 3.4 million kroons i.e. 0.2 million euros was earned asdealing profits from FX and securities’ transactions (2008: 4.4 million kroons i.e. 0.3 millioneuros). Total operating income from banking activities comprised 39.4 million kroons i.e.2.5 million euros in year 2009 compared with 46.3 million kroons i.e. 3.0 million euros yearearlier. Administrative expenses of 2009 and 2008 were correspondingly 35.9 millionkroons (2.3 million euros) and 37.0 million kroons (2.4 million euros).
Total of 0.8 million kroons (0.05 million euros) of membership fees were calculated to theSupervisory Board members in year 2009, in the same volume as year earlier. Nomembership fees have been paid to the members of the Management Board, Calculatedsalaries of the members of the Management Board totalled 3.7 million kroons i.e. 0.2million euros in year 2009, of employees 12.6 million kroons i.e. 0.8 million euros.Calculated salaries of the members of the Management Board totalled the same in year2008 as in 2009, of employees 11.9 million kroons (0.8 million euros). Average number ofemployees was 47 (year earlier also 47), number of employees at the end of year 2009was 47 (at year-end 2008: 48).
Bank’s equity totalled 102.6 million kroons i.e. 6.6 million euros as of 31 December 2009and the regulatory capital adequacy stood at 24.81% (31.12.2008: 183.8 million kroons i.e.11.7 million euros, capital adequacy 30.06%). Bank took a 4.0 million euro i.e. 62.6 millionkroon subordinated debt from Marfin Egnatia Bank S.A., a bank belonging to the group, inDecember 2009 to fulfill the prudential ratios and increase the share of long-term funding.This 10-year subordinated loan can be treated as tier 2 own funds. Bank is planning sharecapital increase in the end of the first quarter of year 2010.
No new branch offices were opened, nor existing offices closed in year 2009. Bank branchoffices are located in the center of Tallinn, Tartu, Pärnu and Jöhvi. Bank’s internet bank isavailable in Estonian, English and from December 2009 also in Russian language.
Corporate Governance Report
“Corporate Governance Recommendations” guideline issued by the Estonian FinancialSupervision Authority is in force since 01.01.2006. Whereas the shares of MARFIN PANKEESTI AS are not traded in the regulated market of Estonia and the Bank has no otherissued securities listed in the stock exchange as of report date, Corporate GovernanceRecommendations are not mandatory for the Bank. Information is disclosed as required bylegislation, international financial reporting standards (IFRS) and good banking practises.
7
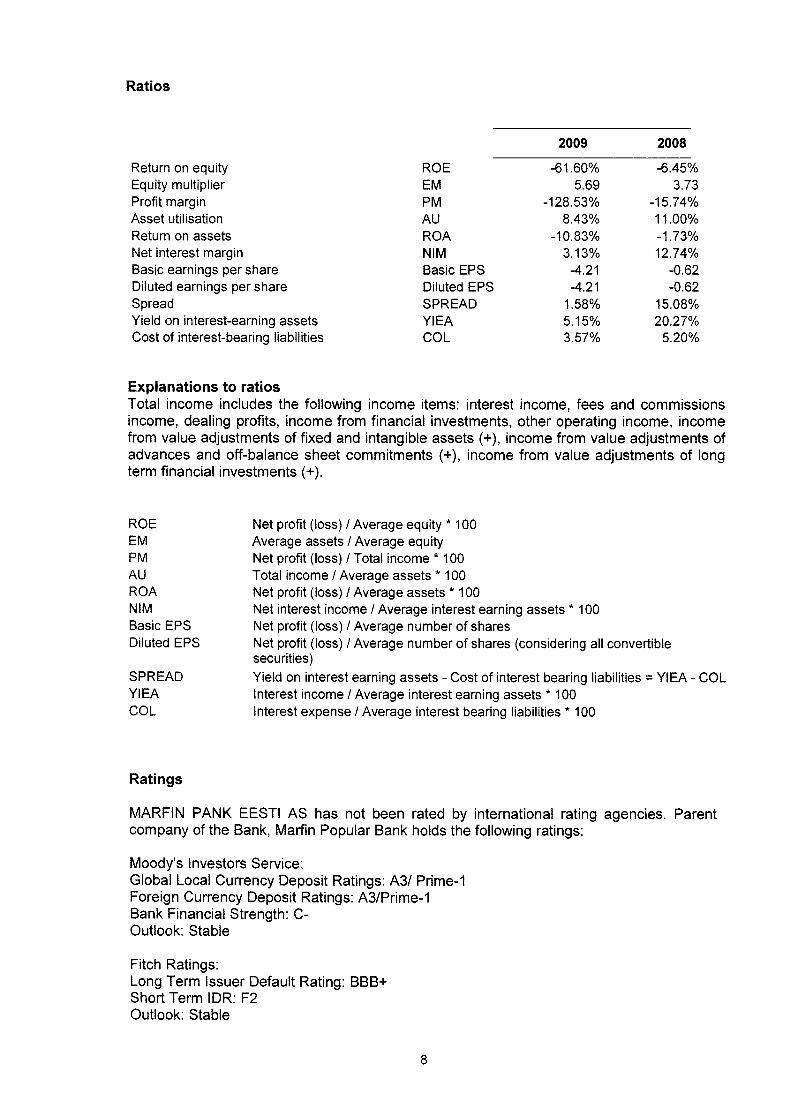
Ratios
ROEEMPMAUROANIMBasic EPSDiluted EPSSPREADYIEACCL
-61.60%5.69
-128.53%8.43%
-10.83%3.13%
-4.21-4.21
1.58%5.15%3.57%
-6.45%3.73
-15.74%11.00%-1.73%12.74%
-0.62-0.62
15.08%20.27%
5.20%
Explanations to ratiosTotal income includes the following income items: interest income, fees and commissionsincome, dealing profits, income from financial investments, other operating income, incomefrom value adjustments of fixed and intangible assets (+), income from value adjustments ofadvances and off-balance sheet commitments (-t-), income from value adjustments of longterm financial investments (+).
ROEEMPMAURCANIMBasic EPSDiluted EPS
SPREADYIEACCL
Ratings
Net profit (loss) I Average equity * 100Average assets / Average equityNet profit (loss) I Total income * 100Total income I Average assets * 100Net profit (loss) / Average assets * 100Net interest income I Average interest earning assets * 100Net profit (loss) / Average number of sharesNet profit (loss) I Average number of shares (considering all convertiblesecurities)Yield on interest earning assets - Cost of interest bearing liabilities = YIEA - CCLInterest income! Average interest earning assets * 100Interest expense I Average interest bearing liabilities * 100
MARFIN PANK EESTI AS has not been rated by international rating agencies. Parentcompany of the Bank, Marfin Popular Bank holds the following ratings:
Moody’s Investors Service:Global Local Currency Deposit Ratings: A3/ Prime-iForeign Currency Deposit Ratings: A3/Prime-1Bank Financial Strength: C-Outlook: Stable
Fitch Ratings:Long Term Issuer Default Rating: BBB+Short Term IDR: F2Outlook: Stable
2009 2008
Return on equityEquity multiplierProfit marginAsset utilisationReturn on assetsNet interest marginBasic earnings per shareDiluted earnings per shareSpreadYield on interest-earning assetsCost of interest-bearing liabilities
8

Legal Disputes
The Bank has submitted three statements of claim to the Harju County Court, as of 31December 2009. Courts are proceeding with sixteen bankruptcy proceedings against bothprincipal obligors and guarantors. Bankruptcy proceedings have ended with abatementdue to lack of assets of two legal entities and one private person. Four statements againstprivate persons have been filed for payment order. Execution proceedings are taking placeagainst seven private persons and three legal entities.
There are no court actions filed against the Bank, and Bank’s management is not aware,as of report preparation date, of any significant claims for compensation of damages whatthe third parties would be planning to file against the Bank.
9

FinancialStatements
2009
10

Management Board’s Confirmation
The Management Board declares its liability for the correctness of the Financial Statementsof MARFIN PANK EESTI AS for the financial year ended on 31.12.2009, presented onpages 10 to 67 and confirms to the best of its knowledge, that:
• the accounting methods used in preparation of the financial statements are inaccordance with the International Accounting Standards Board’s (IASB) InternationalFinancial Reporting Standards (IFRS), as adopted by the European Union;
• Financial Statements give a true and fair view of the financial position, the results ofoperations and cash flows of MARFIN PANK EESTI AS;
• all significant matters of fact, which have arisen before the date of completion of theAnnual Report on 01 March 2010, have been duly apprised and disclosed in the AnnualReport;
• MARFIN PANK EESTI AS is operating on a going concern basis.
....
Riho Rasmann Chairman of the Management Board &4 )
..... oro \O
11
Sven Raba Member of the Management Board ‘ .lOiO
Mart Veskimagi Member of the Management Board 01. 0’. ZoLO
Roul Tutt Member of the Management Board
_________
/

Statement of Comprehensive Income
EEK ths. EEK ths. EUR ths. EUR ths.
Other operating expenses 6 -1,131 -2,188 -72 -140
Depreciation and amortisation of tangibleand intangible assets
Operating profit before allowances 1,114 6,886 71 440
Impairment loss on financial assets
NET LOSS FOR THE PERIOD
Net change in revaluation reserve ofavailable-for-sales financial assets
COMPREHENSIVE LOSS FOR THE PERIOD
a r dentf1tseerrnseks.nt:aed too the purpose ot 1enttcatofl Ofly
initsaad/PihPas 4 L
_____________
Kuupaevldate O5O2 OPrcewatarhouseCoopr.rs, ThINrrn j
The accounting policies on pp. 16-31 and notes to the financial statements on pp. 32-67form an integral part of the Financial Statements.
Note 2009 2008 2009 2008
Interest income 1 57,808 71,509 3,695 4,570Interestexpense 2 -23,010 -27,578 -1,471 -1,763Net interest income 34,798 43,931 2,224 2,808
Fees and commissions income 3 4,371 2,621 279 168Fees and commissions expense 4 -2,105 -2,536 -135 -162Net fees and commissions income 2,266 85 145 5
Net trading gains 5 3,480 4,473 222 286
Total operating income
Administrative expensesPersonnel expensePayroll related taxesOther administrative expenses
39,413 46,301 2,519 2,959
-35,9267 -17,3708 -5,8419 -12,715
-36,965-16,939
-5,733-14,293
-2,296-1,110
-373-813
-2,362-1,083
-366-913
-15710 -2,373 -2,450 -152
11 -85,502 -19,256 -5,465 -1,231
-84,388 -12,370 -5,393 -791
3,219 -3,557 206 -227
-81,169 -15,927 -5,188 -1,018
12

Statement of Financial Position
ASSETS
Note
EEK ths. EEK ths. EUR ths. EUR ths.
31.12.09 31.12.08 31.12.09 31.12.08
Intangible assets
Other assets
TOTAL ASSETS
Cash
Loans and advancesBalances with central bankDue from other banksDue from customersFinancial assets held for trading
Available-for-sale financial assets
Property and equipment
Investment properties
12 2,076 1,889 133 121723,763 800,429 46,257 51,157
13 107,592 112,350 6,876 7,18014 61,057 47,972 3,902 3,06615 555,113 640,107 35,478 40,91016 245 910 16 58
17 2,972 19,137 190 1,223
18 2,853 4,518 182 289
19 4,382 0 280 0
20 621 931 40 60
21 2,118 1,536 135 98
16 112 325 7 21
739,030 829,350 47,233 53,005
LIABILITIES
Financial liabilities held for trading
Financial liabilities measured at amortised630,956 623,550 36,224 39,852cost
Duetocreditinstitutions 22 141,043 266,519 9,014 17,034Due to customers 22 425,737 357,031 27,210 22,818Subordinated debt 23 63,018 0 4,028 0Borrowed funds from government and foreign
24 1,158 0 74 0aidTax liabilities 25 825 802 53 51
Other liabilities 26 4,527 20,894 289 1,335TOTAL LIABILITIES 636,420 645,571 40,675 41,260
SHAREHOLDERS’ EQUITY 27Share capital 200,500 200,500 12,814 12,814Statutory legal reserve 559 559 36 36Fair value reserve of available-for-sale
-338 -3,557 -22 -227financial assetsAccumulated deficit -13,723 -1,353 -877 -86Loss for the financial year -84,388 -12,370 -5,393 -791TOTAL SHAREHOLDERS’ EQUITY 102,610 183,779 6,558 11,746TOTAL LIABILITIES AND
739,030 829,350 47,233 53,005SHAREHOLDERS’ EQUITY
The accounting policies on pp. 16-31 and notes to the financial statements on pp. 32-67form an integral part of the Financial Statements.
13
Jiit cntf1sc irn .
ttaN d ot dnUt. on . v
rnt alsd/ru1
uup 0 O5CY O
Prnw t honp r, TnH n
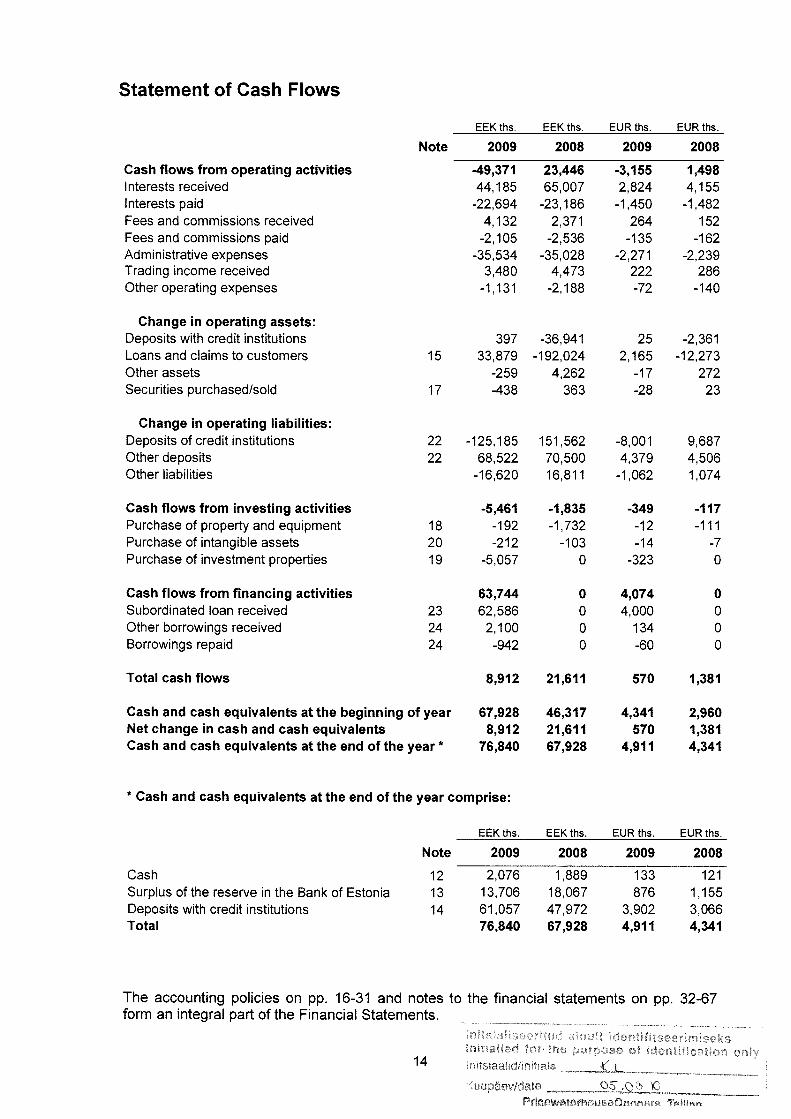
Statement of Cash Flows
EEK ths. EEK ths, EUR ths. EUR ths.
63,74423 62,58624 2,10024 -942
o 4,0740 4,0000 1340 -60
0000
Total cash flows 8,912 21,611 570 1,381
EEK ths. EEK ths, EUR ths. EUR ths.
The accounting policies on pp. 16-31 and notes to the financial statements on pp. 32-67form an integral part of the Financial Statements.
rn’ u ‘ rhtl eh1wakr1 tor the ct te ntf cihon only
14
______
uupdev/cffito _çl\GTill
2009 2008 2009
Cash flows from operating activitiesInterests receivedInterests paidFees and commissions receivedFees and commissions paidAdministrative expensesTrading income receivedOther operating expenses
Change in operating assets:Deposits with credit institutionsLoans and claims to customersOther assetsSecurities purchased/sold
Change in operating liabilities:Deposits of credit institutionsOther depositsOther liabilities
Cash flows from investing activitiesPurchase of property and equipmentPurchase of intangible assetsPurchase of investment properties
Cash flows from financing activitiesSubordinated loan receivedOther borrowings receivedBorrowings repaid
Note
-49,37144,185
-22,6944,132
-2,105-35,534
3,480-1,131
39715 33,879
-25917 -438
22 -125,18522 68,522
-16,620
-5,46118 -19220 -21219 -5,057
23,44665,007
-23,1862,371
-2,536-35,028
4,473-2,188
-36,941-192,024
4,262363
151,56270,50016,811
-1,835-1,732
-1030
-3,1552,824
-1,450264
-135-2,271
222-72
252,165
-17-28
-8,0014,379
-1,062
-349-12-14
-323
2008
1,4984,155
-1,482152
-162-2,239
286-140
-2,361-12,273
27223
9,6874,5061,074
-117—111
-70
Cash and cash equivalents at the beginning of year 67,928 46,317 4,341 2,960Net change in cash and cash equivalents 8,912 21,611 570 1,381Cash and cash equivalents at the end of the year * 76,840 67,928 4,911 4,341
* Cash and cash equivalents at the end of the year comprise:
Note
Cash 12 2,076 1,889 133 121Surplus of the reserve in the Bank of Estonia 13 13,706 18,067 876 1,155Deposits with credit institutions 14 61,057 47,972 3,902 3,066Total 76,840 67,928 4,911 4,341
2009 2008 2009 2008
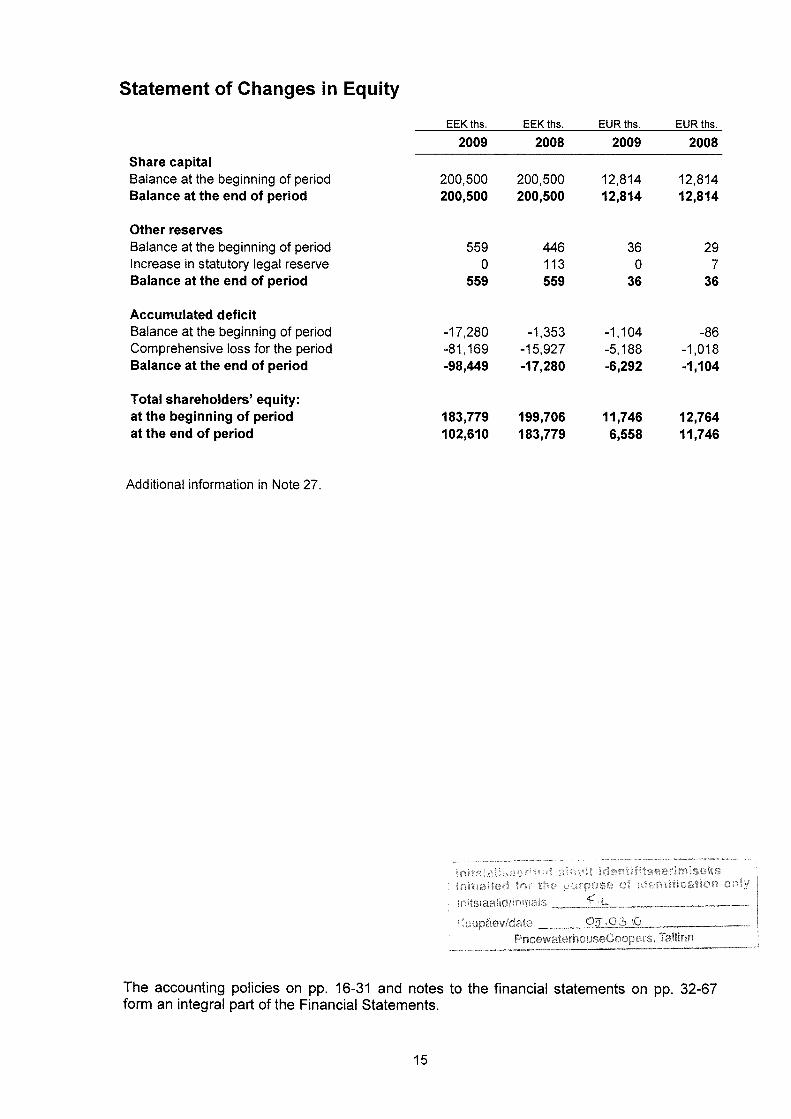
Statement of Changes in Equity
Share capitalBalance at the beginning of periodBalance at the end of period
Other reservesBalance at the beginning of periodIncrease in statutory legal reserveBalance at the end of period
Accumulated deficitBalance at the beginning of periodComprehensive loss for the periodBalance at the end of period
Total shareholders’ equity:atthe beginning of periodat the end of period
Additional information in Note 27.
EEK ths. EEK ths. EUR ths. EUR ths.
2009 2008 2009 2008
200,500 200,500 12,814 12,814200,500 200,500 12,814 12,814
559 446 36 290 113 0 7
559 559 36 36
-17,280 -1,353 -1,104 -86-81,169 -15,927 -5,188 -1,018-98,449 -17,280 -6,292 -1,104
183,779 199,706 11,746 12,764102,610 183,779 6,558 11,746
rtsCnaV
Kuupäev/datePricowatrhouseCooperS THnn j
The accounting policies on pp. 16-31 and notes to the financial statements on pp. 32-67form an integral part of the Financial Statements.
15

Accounting Policies
Statement of Compliance
MARFIN PANK EESTI AS (hereinafter also “the Bank”) is a credit institution domiciled inEstonia.
The Management Board approved the financial statements on 01 March 2010. Approval ofthe financial statements in included in the agenda of the meeting of the Supervisory Boardand the General Meeting of Shareholders on 12 March 2010.
The financial statements of MARFIN PANK EESTI AS have been prepared in accordancewith the International Financial Reporting Standards (IFRSs) as adopted by the EuropeanUnion. Several changes to texts of valid standards have entered into force since 1 January2009 and new IFRS standards became mandatory for the bank from the financial yearwhich began on 1 January 2009. Adoption of new standards or changes to standards havenot caused significant changes in accounting policies or affected the results of operations ofthe bank.
Basis of Preparation
The functional and presentation currency of MARFIN PANK EESTI AS is the Estoniankroon (EEK). The statements have also been presented in euros (EUR) for illustrativepurposes. Numeric data in the financial statements is presented in thousands of monetaryunits. As the Estonian kroon is pegged to the euro at a fixed exchange rate of 15.6466kroons to 1 euro, no currency differences arise from presenting the report in euros.
The financial statements are prepared on the historical cost basis, except for the casesmentioned in some accounting principles below.
Segment Reporting
Segment reporting has not been compiled, as the Bank has so far only one importantsegment based on the number of customers, products and services, management andoperating location. The Bank’s main activity is lending to and deposit-taking from Estoniancustomers; all other areas of operation are either insignificant in terms of volume and/orsupporting activities.
Significant Judgements and Estimates by the Management
The preparation of financial statements in conformity with IFRSs requires management tomake certain judgements and estimates that affect the amounts reported in the financialstatements. Judgements and estimates by the management are also required in applyingthe accounting principles and measurement bases.The judgements and estimates made by the management are reviewed on an ongoingbasis, and they are based on historical experience and other factors including assumptionsof likely future events which are believed to be reasonable under the conditions. Actualresults may differ from these estimates.
Judgements that have the most significant effect on the amounts recognised in the financialstatements and estimates that can cause a significant adjustment to the carrying amount ofassets and liabilities within the next financial year include:
fl frflLWdk rp r rf rnv
16Kuupaevld• __.cL

Impairment losses on loans and advances. The Bank regularly reviews its loan portfolioto assess potential impairment of asset value. In determining whether an impairment lossshould be recorded in the income statement, the Bank makes judgements as to whetherthere is any observable data indicating that there is a measurable decrease in theestimated future cash flows from a portfolio of loans before the decrease can be identifiedwith an individual loan in that portfolio. This evidence may include observable dataindicating that there has been an adverse change in the payment status of borrowers in agroup, or state or local economic conditions that correlate with defaults on assets in thegroup. Management uses estimates based on historical loss experience for assets withcredit risk characteristics and objective evidence of impairment similar to those in theportfolio when scheduling its future cash flows.
Impairment of available-for-sale debt investments. The Bank determines that available-for-sale debt investments are impaired when there has been a change in expected cashflows to be collected from the instrument. This determination of whether the expected cashflows have changes requires judgement. In making this judgement, the Bank evaluatesamong other factors, the changes in solvency position of the issuer, possible changes incredit behaviour and any other relevant information available to the management. Inaddition, impairment may be appropriate when there is evidence of changes in technologyor a deterioration in the financial health of the investment object, industry and sectorperformance, or operational or financing cash flows.
Effects of Changes in Economic Environment
Recent volatility in global and Estonian financial markets
The ongoing global liquidity crisis which commenced in the middle of 2007 has resulted in,among other things, a lower level of capital market funding, lower liquidity levels across thebanking sector, and, at times, higher interbank lending rates and very high volatility in stockmarkets. Indeed the full extent of the impact of the ongoing financial crisis is proving to beimpossible to anticipate or completely guard against. Subsection “Description of EconomicEnvironment” of the Management Report gives more detailed overview of current economicconditions and future scenarios in Estonia,
Financial crises has had limited impact on the Bank, as all previously issued bonds havebeen redeemed already in year 2007 and the dependence on banks outside the group isvery small. Bank’s liquidity is at all times guaranteed by the financing from the Group.Management is unable to reliably estimate the effects on the Bank’s financial position ofany lower liquidity of the financial markets and the increased volatility in the currency andequity markets. Management believes it is taking all the necessary measures to support thesustainability and growth of the Group’s business in the current circumstances.
Impact on collateral (especially real estate)
The amount of provision for impaired loans is based on management’s appraisals of theseassets at the balance sheet date after taking into consideration the cash flows that mayresult from foreclosure less costs for obtaining and selling the collateral. Although themarket in Estonia for many types of collateral, also real estate, has been has been showingfirst signs of stabilisation, the liquidity is still low for certain types of assets. As a result, theactual realisable value on foreclosure may differ from the value ascribed in estimatingallowances for impairment.
c r ii n t ‘
lnts!aadñn —
17 Kuupaev/dat __jDLO\O
Prcewaterhousecoop.crs TaiHnn

Disappearance of an active market for quoted financial instruments
As a result of the recent volatility in financial markets there are no longer regularly occurringtransactions on an arm’s length basis for certain financial instrument quoted on capital andmoney market. Hence fair value as at 31.12.2009 of these instruments has beendetermined using a valuation technique. The objective of the valuation technique is toestablish what the transaction price would have been on the reporting date in an arm’slength exchange motivated by normal business considerations. Hence determining fairvalue requires consideration of current market conditions, including the relative liquidity ofthe market and current credit spreads. The valuation technique used by management todetermine fair value of fixed income instruments was discounted cash flow analysis. It isvery complicated for the management to reliably estimate the effects on the Bank’s financialposition of any decreased liquidity of the financial markets and the increased volatility in thecurrency and equity markets. Management believes it is taking all the necessary measuresto support the sustainability and growth of the Bank’s business in the currentcircumstances.
Impact on customers
Customers (borrowers) of the Bank have been affected and may be affected further by thelower liquidity situation and other effects of the macroeconomic downturn which could inturn impact their ability to repay the amounts owed. Deteriorating operating conditions forcustomers may also have an impact on management’s cash flow forecasts and assessmentof the impairment of financial assets. To the extent that information is available,management has properly and to the best of its knowledge reflected revised estimates ofexpected future cash flows in its impairment assessments.
Liquidity
As the Bank is financed by the parent in the extent necessary and the parent is ready toraise additional capital if necessary, the liquidity has not been affected by the changes ineconomic environment.
Assets and Liabilities Denominated in Foreign Currencies
Foreign currency transactions are recorded based on the foreign currency exchange ratesof the Bank of Estonia officially valid on the transaction date. Monetary assets and liabilitiesdenominated in foreign currencies are translated to Estonian kroons based on the foreignexchange rates of the Bank of Estonia valid on the balance sheet date. Changes inexchange rates are recognised in the income statement in “Net trading income”. Changesin the fair value of monetary securities denominated in foreign currency classified asavailable-for-sale are analysed between translation differences resulting from changes inthe amortised cost of the security and other changes in the carrying amount of the security.Translation differences related to changes in the amortised cost are recognised in incomestatement, and other changes in the carrying amount are recognised in fair value reserve inequity. Translation differences on non-monetary items, such as equities held at fair valuethrough profit or loss, are reported as part of the fair value gain or loss. Translationdifferences on non-monetary items, such as equities classified as available-for-salefinancial assets, are included in the fair value reserve in equity.
Offsetting
Financial assets and liabilities are offset only if a relevant legal right exists and there isintent to settle the amounts on a net basis or to realise the asset and settle the liabilitysimultaneously.
roe ct oii!yntsaad/inm.is
18 KuuDev/date
___________
PricewaterhosiCoopers,TaWnn

Cash and Cash Equivalents
Cash on hand is recognised as cash in the balance sheet. Cash and cash equivalentsinclude cash, and readily available demand and overnight deposits with other creditinstitutions and the surplus of the account balance with the Bank of Estonia. Cash flows arereported using the direct method. Cash and cash equivalents are stated in the balancesheet at amortised cost.
Financial Instruments
Cash, short-term financial investments, amounts due from credit institutions and customers,other receivables and accruals are classified as financial assets. Financial liabilities includepayables to customers, debts evidenced by certificates, accrued expenses and otherliabilities. Financial assets and liabilities are initially recognised at their fair value. Financialliabilities are stated in the balance sheet at amortised cost, using the effective interest ratemethod.
A financial asset is removed from the balance sheet when the bank loses right to the cashflows arising from the financial asset, or passes the cash flows arising from the asset andmost of the risks and gains relating to the financial asset, to a third party. A financial liabilityis removed from the balance sheet, when it is settled or discharged or it expires.
Purchases and sales of financial assets are consistently recognised on the settlement date,i.e. on the date on which the bank acquires or loses ownership of the financial asset.
Financial Investments
Held-to-maturity investments
If the Bank has the positive intent and ability to hold debt securities to maturity, then theyare classified as held-to-maturity. Held-to-maturity investments are measured at amortisedcost using the effective interest method.
Available-for-sale financial assets
The Bank’s investments in equity securities and certain debt securities are classified asavailable-for-sale financial assets, Subsequent to initial recognition, they are measured atfair value and gains and losses on changes of fair value (other than impairment losses,interest income and foreign exchange gains and losses) are recognised directly in equity.Interest income on available-for-sale debt securities is calculated using the effective interestmethod and recognised in profit or loss. Dividends on available-for-sale equity instrumentsare recognised in profit or loss when the Bank’s right to receive payment is established andit is probable that the dividends will be collected.Fair value is determined by reference tothe indicative bid prices of big banks or, if those are not available, the yields of similarsecurities with a similar maturity denominated in the same currency. When an investment isderecognised, the cumulative gain or loss in equity is transferred to profit or loss.
Impairment losses are recognised in profit or loss when incurred as a result of one or moreevents (“loss events”) that occurred after the initial recognition of investment securitiesavailable for sale. A significant or prolonged decline in the fair value of an equity instrumentbelow its cost is an indicator that it is impaired. The cumulative impairment loss — measuredas the difference between the acquisition cost and the current fair value, less anyimpairment loss on that asset previously recognised in profit or loss — is removed fromequity and recognised in profit or loss. Impairment losses on equity instruments are notreversed through profit or loss. Debt instrument is considered to be impaired when there isa change in expected cash flows to be collected from the instrument. If, in a subsequentperiod, the fair value of a debt instrument classified as available for sale increases and theincrease can be objectively related to an event occurring after the impairment loss was
I —‘fl
tO 010 .fl: U rposo of coO on on y19
nItsiaad1fltt°
Kuupaevldcle _%LO______— ¶0nI1I fOllnn

recognised in profit or loss, the impairment loss is reversed through current period’s profit orloss.
Financial assets at fair value through profit or loss
An instrument is classified as a financial asset at fair value through profit or loss if it is heldfor trading or is designated as such upon initial recognition. Financial assets at fair valuethrough profit or loss are reported in the balance sheet at fair value, based on quotedmarket prices and the official foreign exchange rates of the Bank of Estonia. The sharesand debt securities not actively traded on an active market are valued in fair valueaccording to the last quotation from an acknowledged provider with a presumption thatthere have been regular quotations available for the shares/debt securities and the pricevolatility has been in normal range for similar instruments. If the price is not available fromquotations or there is no sufficient regularity of the quotations or the volatility of theinstrument price quotations is outside the normal range, the shares/debt securities arerevaluated into fair value based on all available information regarding the issuer tobenchmark the financial instrument price against similar instruments available on activemarket to determine the fair value. For held for trading debt securities, for which the quotedprices from an active market are not available, cash flows are discounted at market interestrates, issuer’s risk added. In any case, if the market for a financial asset is not active, theBank establishes fair value by using valuation techniques. These include the use of recentarm’s length transactions, discounted cash flow analysis, and other valuation techniquescommonly used by market participants.
Any gain or loss arising from changes in fair value is recognised in the income statement in“Net trading gains less losses”.
Loans and receivables
Loans and receivables are non-derivative financial assets with fixed or determinablepayments that are not quoted in an active market. They arise when the Bank providesmoney, goods or services directly to a debtor/customer with no intention of trading theresulting receivable. Loans and receivables are recognized in the balance sheet when thecash is paid to the borrower or right to demand payment has arisen and are derecognizedonly when they are repaid or written-off, regardless of the fact that part of them may berecognized as costs through providing impairment allowances for loans, Loans andreceivables are measured at amortised cost using the effective interest method.
Derivative Instruments
Derivative instruments (e.g. forwards and swaps) are recognised on the trade date at fairvalue. After initial recognition, derivative instruments are measured at fair value, based ontheir quoted market prices and the official exchange rates of the Bank of Estonia. Therevaluation is recognised in the balance sheet in respective line “Financial assets held fortrading” or “Financial liabilities held for trading” depending whether the fair value of therespective derivative is positive or negative and the result of the revaluation is recognised inthe income statement in “Net trading gains less losses”. Interest income received fromderivatives is recognised in income statement under “Interest income”.
Valuation and Impairment of Loans and Advances
Loans to clients are recognised in the balance sheet in “Due from customers” and fundsheld at other banks are recognised in “Due from other banks”. Bank regulations requiremonthly revaluation of the loan portfolio. Receivables arising from loan agreements arerecognised in the balance sheet at amortised cost. Cost is adjusted for repayments of theprincipal and, where necessary, and any impairment losses. Amortised cost is calculated bydiscounting the estimated future cash flows of the instrument using the initial effective
r. U :u fl It$Ue r m Sc. kSfrr poc ci I(( UI U
20__;:_.
Vupäevldate 9Qi.
________
Tmrn

interest rate. If there is any indication of impairment, a receivable is written down to thepresent value of the estimated future receipts, discounted at initial effective interest rate.
Impairment losses are recognised in profit or loss when incurred as a result of one or moreevents (“loss events”) that occurred after the initial recognition of the financial asset andwhich have an impact on the amount or timing of the estimated future cash flows of thefinancial asset or group of financial assets that can be reliably estimated. If the Bankdetermines that no objective evidence exists that impairment was incurred for anindividually assessed financial asset, whether significant or not, it includes the asset in agroup of financial assets with similar credit risk characteristics and collectively assessesthem for impairment. The primary factors that the Bank considers in determining whether afinancial asset is impaired are its overdue status and realisability of related collateral, if anyand the expected cash flows.
If the terms of an impaired financial asset held at amortised cost are renegotiated orotherwise modified because of financial difficulties of the borrower or issuer, impairment ismeasured using the original effective interest rate before the modification of terms.
Impairment losses are always recognised through an allowance account to write down theasset’s carrying amount to the present value of expected cash flows (which exclude futurecredit losses that have not been incurred) discounted at the original effective interest rate ofthe asset.
If the value of an impaired receivable rises in subsequent periods, a previously recognisedimpairment loss is reversed to an amount equal to the present value of the item’s estimatedfuture cash flows or, if lower, the carrying amount of the receivable which would have beendetermined if no impairment loss had been recognised.
Uncollectible assets are written off against the related impairment loss provision after all thenecessary procedures to recover the asset have been completed and the amount of theloss has been determined. Subsequent recoveries of amounts previously written off arecredited to impairment loss account in the income statement.
Securities purchase and resale transactions (reverse repos) are recognised and assessedfor impairment similarly to other loans.
Intangible Assets
Purchased patents, licenses and software are recognised as intangible assets. Intangibleassets are measured in the balance sheet at cost less any amortisation and any impairmentlosses. The straight-line method is used for amortising intangible assets. The amortisationrate for intangible assets is 20% per year.
Property and equipment
Significant assets which are used in the Bank’s business activities and whose expecteduseful life extends over one year are recognised as property and equipment. New items ofproperty and equipment are initially recognised at cost and are depreciated from the monthof implementation until they are depreciated to the residual value. Property and equipmentare measured in the balance sheet at cost less any accumulated depreciation and anyimpairment losses. The straight-line method is used for depreciating property andequipment and the annual depreciation rates are:Computers, communication equipment 30 %Office equipment 25 %Office furniture 20 %Telephones 40 %Capitalised improvements to leased office space 20%Other tangible assets 20%
fl U fl r m U k
21 rpc •e ot n t a a a
intsia&id/fltIa
uupaov/datc’ OO

The subsequent expenditure of an item of property and equipment shall be recognised asan asset if these are in accordance with definition of non-current assets and if it is probablethat future economic benefits associated with the item will flow to the entity. All other repairsand maintenance are charged to other operating expenses during the financial period inwhich they are incurred.
The appropriateness of depreciation/amortization rates, methods and residual values areassessed at each reporting date.
Impairment of Assets
The management of the Bank assesses if there is any indication that an asset may beimpaired at each balance sheet date. If such indication exists, an impairment test isperformed and the recoverable amount of the asset estimated. The recoverable amount ofan asset is the higher of its fair value (less costs to sell) and value in use calculated usingthe discounted cash flow method. If the test results show that the recoverable amount of anasset is lower than its carrying amount, the asset is written down to its recoverable amount.If the recoverable amount cannot be determined for an individual asset, the recoverableamount is determined for the smallest group of assets (the cash-generating unit) the assetbelongs to. Impairment losses are recognised as expenses in the period in which they areincurred.
If a subsequent impairment test of an asset which has been written down shows that itsrecoverable amount has risen above its carrying amount, the former impairment loss isreversed and the asset’s carrying amount is increased. The increased carrying amount maynot exceed the carrying amount which would have been determined (net of amortisation ordepreciation) had no impairment loss been recognised.
Financial Liabilities
Financial liabilities include customer deposits, liabilities to other banks and other liabilities.Financial liabilities are recognized in the balance sheet on their settlement date (value date)at fair value net of transaction costs and are subsequently measured at amortized costusing effective interest rate method and recorded on line “Due to customers”. Interestexpenses are recorded in the income statement under “Interest expense”.
The effective interest rate is the rate that exactly discounts the expected stream of futurecash payments through maturity. The amortization of the transaction costs is presented inthe income statement together with the interest expenses. The respective interest expensesare recorded in the income statement under “Interest expense
In case there is an unused limit for any borrowings, this is presented as contingent asset.
Debt Certificate Liabilities
Bonds issued are recognised at fair value using settlement date accounting. Subsequent toinitial recognition, bonds are measured at their amortised cost, using the effective interestrate method. Issue costs are included in determining the effective interest rate.
The Bank redeemed the bonds listed on the Tallinn Stock Exchange (SBMBO475O7A) on20 April 2007 after which the Bank has not issued any more bonds.
Interest, Fees and Commissions
All interest and similar income is recognised as interest income. Similar income includesincome connected with the contractual maturity/redernptio_,,,te Qr mpunt. ,oLtheasset and
fl I( AC C C
22riitsiaCd/n:.
.
— *

it is recognised over the term of the receivable. Interest income is calculated using theoriginal effective interest rate applied in discounting the estimated future cash flows of theasset.
The effective interest method is a method of calculating the amortized cost of a financialasset or a financial liability and of allocating the interest income or interest expense over therelevant period. The effective interest rate is the rate that exactly discounts estimated futurecash payments or receipts through the expected life of the financial instrument to the netcarrying amount of the financial asset or financial liability. When calculating the effectiveinterest rate, the Bank estimates cash flows considering all contractual terms of thefinancial instrument, but does not consider future credit losses. The calculation includes allsignificant fees paid or received between parties to the contract that are an integral part ofthe effective interest rate, transaction costs and all other premiums or discounts.
Once a financial asset or a group of similar financial assets has been written down as aresult of an impairment loss, interest income is recognized using the rate of interest used todiscount the future cash flows for the purpose of measuring the impairment loss.
Fees and commissions income is recognised in the fair value of the consideration receivedor receivable for the services provided in the ordinary course of the Bank’s activities. Feesand commission income and expense are recognised on an accrual basis, Loan fees (lessdirect expenses) are included in the calculation of the effective interest rate.
Other transaction fee income and other income are recognized on accrual basis at themoment of executing the respective transactions.
Dividends are recognised in the income statement when the entity’s right to receivepayment is established.
Payables to employees
Payables to employees contain the contractual right arising from employment contracts. Inaddition to the salaries payable, this liability also includes accrued social andunemployment taxes calculated on it. Pursuant to employment contracts and currentlegislation, payables to employees also include an accrued holiday pay liability as of thebalance sheet date. In addition to the holiday pay, this liability also includes accrued socialand unemployment insurance premium payments.
Accounting for Leases
Lease agreements are classified as finance leases if all material risks and rewards arisingfrom the agreement are transferred to the lessee. Assets leased on terms of finance leaseare recognised at the present value of minimum lease payments and depreciated accordingto their useful life of the asset or lease term. All other lease agreements are treated asoperating leases and the payments made on the basis of those agreements are expensedin the period for which they are made.
Mandatory Reserve in the Bank of Estonia
The Bank of Estonia has established a mandatory reserve requirement to credit institutionsat 15% of the average amount of deposits and issued financial guarantees. Creditinstitutions are obliged to keep at least 40% of the established mandatory reservemaintained in Estonian kroons on the correspondent account at the Bank of Estonia on adaily basis. Fulfillment of the reserve requirement is monitored based on a month’saverage.
n. saadñnta
23 Kuupâev/date 05PricewateriouseCr opers, Ta.llnn

Contingent LiabNities
Guarantees, unused loan limits and letters of credit that in certain circumstances maybecome obligations, but it is not probable that an outflow of resources will be required tosettle the obligation; or the amount of the obligation cannot be measured with sufficientreliability,are recognised as contingent liabilities. Other potential or existing liabilities whoserealisation is less probable than non-realisation or whose accompanying costs cannot bedetermined reliably, are disclosed in the notes to the financial statements as contingentliabilities. Where an entity is jointly and severally liable for an obligation, the part of theobligation that is expected to be met by other parties is treated as a contingent liability.Contingent liabilities may develop in a way not initially expected. Therefore, they areassessed continually to determine whether an outflow of resources embodying economicbenefits has become probable. If it becomes probable that an outflow of future economicbenefits will be required for an item previously dealt with as a contingent liability, a provisionis recognised in the financial statements of the period in which the change in probabilityoccurs (except in the extremely rare circumstances where no reliable estimate can bemade).
Corporate Income Tax
The profit of Estonian legal entities is not taxed according to effective legislation; thereforedeferred income tax assets and liabilities do not exist. In place of profit, income tax is leviedon dividends paid out of retained earnings. The tax rate is 2 1/79 of the amount paid out asnet dividends. The corporate income tax payable on dividends is recognised as the incometax expense of the same period in which the dividends are declared, irrespective of theperiod for which the dividends are declared or the period in which the dividends are actuallypaid out.
EarningslLosses per Share
Basic earnings/losses per share are calculated by dividing profit/loss for the financial yearby the weighted average number of ordinary shares outstanding during the period.
Net profit/loss attributable to ordinary shareholders and the weighted average number ofordinary shares are adjusted for all dilutive potential ordinary shares, having dilutive effecton earnings/losses per share, when calculating diluted earnings/losses per share. As theBank does not have financial instruments, which could dilute earnings/losses per share inthe future, basic earnings/losses per share and diluted earnings/losses per share are equal.
Financial Guarantees
Guarantees issued by the Bank to customers and potential loan commitments as well asunused loan amounts are recognised on off-balance sheet accounts. Received guaranteefees are reported in income over the period of the guarantee.
Financial guarantee liabilities are initially recorded at their fair value and the initial fair valueis amortised over the life of the financial guarantee. Therefore the financial guaranteeliability is carried at the higher of the amortised amount and present value of futurepayments (if it is likely that payments are to be made under the guarantee). Liabilitiesarising from financial guarantees are reported under other liabilities.
&&
24 Kuupäev/date 2L2Q_Tallnn

Standards, amendments to published standards and interpretations mandatory forthe Bank’s accounting periods beginning on or after 1 January 2009
IFRIC II, IFRS 2- Group and Treasury Share Transactions (IFRIC 11 as adopted by theEU is effective for annual periods beginning on or after 1 March 2008, early adoptionpermitted). The interpretation contains guidelines on the following issues: an entity grantsits employees rights to its equity instruments that may or must be repurchased from a thirdparty in order to settle obligations towards the employees; or an entity or its owner grantsthe entity’s employees rights to the entity’s equity instruments. Adoption of the interpretationdid not have any impact on the Bank’s financial statements.
IFRIC 14, lAS 19 — The Limit on a Defined Benefit Asset, Minimum FundingRequirements and their Interaction (IFRIC 14 as adopted by the EU is effective forannual periods beginning on or after 31 December 2008, early adoption permitted). Theinterpretation contains guidance on when refunds or reductions in future contributions maybe regarded as available for the purposes of the asset ceiling test in lAS 19, EmployeeBenefits. Adoption of the interpretation did not have any impact on the Bank’s financialstatements.
IFRS 8, Operating Segments (effective for annual periods beginning on or after 1 January2009). The standard applies to entities whose debt or equity instruments are traded in apublic market or that file, or are in the process of filing, their financial statements with aregulatory organisation for the purpose of issuing any class of instruments in a publicmarket. IFRS 8 requires an entity to report financial and descriptive information about itsoperating segments, with segment information presented on a similar basis to that used forinternal reporting purposes. The adoption of IFRS 8 has not resulted in an increase in thenumber of reportable segments presented, as the Bank has so far only one importantsegment based on the number of customers, products and services, management andoperating location. The Bank’s main activity is lending; all other areas of operation areeither insignificant in terms of volume and/or supporting activities.
lAS 23, Borrowing Costs, revised in March 2007 (effective for annual periods beginningon or after 1 January 2009). The main change is the removal of the option of immediatelyrecognising as an expense borrowing costs that relate to assets that is not carried at fairvalue and that take a substantial period of time to get ready for use or sale. Such borrowingcosts form part of the cost of that asset, if the commencement date for capitalisation is onor after 1 January 2009. Prior to the revision of the standard, the Bank’s accounting policywas capitalisation of borrowing costs and thus the change had no impact on the Bank’sfinancial statements.
lAS 1, Presentation of Financial Statements, revised in September 2007 (effective forannual periods beginning on or after 1 January 2009). The main change in lAS I is thereplacement of the income statement by a statement of comprehensive income whichincludes all non-owner changes in equity, such as the revaluation of available-for-salefinancial assets. Alternatively, entities are allowed to present two statements: a separateincome statement and a statement of comprehensive income. The Bank has elected topresent a single statement of comprehensive income. The revised lAS 1 also introduces arequirement to present a statement of financial position (balance sheet) at the beginning ofthe earliest comparative period whenever the entity restates comparatives due toreclassifications, changes in accounting policies, or corrections of errors. The revised lAS Ihad an impact on the presentation of the Bank’s financial statements but had no impact onthe recognition or measurement of specific transactions and balances.
Improvements to International Financial Reporting Standards, issued in May 2008(effective for annual periods beginning on or after 1 January 2009). The amendmentsconsist of a mixture of substantive changes, clarifications, and changes in terminology in
25
I/djPwatrh(Ia TIrin

various standards. The substantive changes relate to the following areas: classification asheld for sale under IFRS 5 in case of a loss of control over a subsidiary (effective for annualperiods beginning on or after 1 July 2009); possibility of presentation of financialinstruments held for trading as non-current under lAS 1; accounting for sale of lAS 16assets which were previously held for rental and classification of the related cash flowsunder lAS 7 as cash flows from operating activities; clarification of definition of a curtailmentunder lAS 19; accounting for below market interest rate government loans in accordancewith lAS 20; making the definition of borrowing costs in lAS 23 consistent with the effectiveinterest method; clarification of accounting for subsidiaries held for sale under lAS 27 andIFRS 5; reduction in the disclosure requirements relating to associates and joint venturesunder lAS 28 and lAS 31; enhancement of disclosures required by lAS 36; clarification ofaccounting for advertising costs under lAS 38; amending the definition of the fair valuethrough profit or loss category to be consistent with hedge accounting under lAS 39;introduction of accounting for investment properties under construction in accordance withlAS 40; and reduction in restrictions over manner of determining fair value of biologicalassets under lAS 41. Further amendments made to lAS 8, 10, 18, 20, 29, 34, 40, 41 and toIFRS 7 represent terminology or editorial changes only, which the IASB believes have no orminimal effect on accounting. The amendments did not have an impact on the Bank’sfinancial statements.
Puttable Financial Instruments and Obligations Arising on Liquidation — lAS 32 andlAS I Amendment (effective for annual periods beginning on or after 1 January 2009). Theamendment requires classification as equity of some financial instruments that meet thedefinition of financial liabilities. The amendment did not have an impact on these financialstatements.
Vesting Conditions and Cancellations — Amendment to IFRS 2 (effective for annualperiods beginning on or after 1 January 2009). The amendment clarified that only serviceconditions and performance conditions are vesting conditions. Other features of a share-based payment are not vesting conditions. The amendment specifies that all cancellations,whether by the entity or by other parties, should receive the same accounting treatment.The amendment did not have an impact on these financial statements.
IFRIC 13, Customer Loyalty Programmes (effective for annual periods beginning on orafter 1 July 2008, IFRIC 13 as adopted by the EU is effective for annual periods beginningafter 31 December 2008; early adoption permitted). IFRIC 13 clarifies that where goods orservices are sold together with a customer loyalty incentive (for example, loyalty points orfree products), the arrangement is a multiple-element arrangement and the considerationreceivable from the customer is allocated between the components of the arrangementusing fair values. The amendment did not have an impact on these financial statements.
Cost of an Investment in a Subsidiary, Jointly Controlled Entity or Associate — IFRS Iand lAS 27 Amendment (effective for annual periods beginning on or after 1 January2009). The amendment allows first-time adopters of IFRS to measure investments insubsidiaries, jointly controlled entities or associates at fair value or at previous GAAPcarrying value as deemed cost in the separate financial statements. The amendment alsorequires distributions from pre-acquisition net assets of investees to be recognised in profitor loss for the year rather than as a recovery of the investment. The amendment did nothave an impact on these financial statements.
Improving Disclosures about Financial Instruments - Amendment to IFRS 7, issued inMarch 2009 (effective for annual periods beginning on or after 1 January 2009). Theamendment requires enhanced disclosures about fair value measurements and liquidityrisk. The entity is required to disclose an analysis of financial instruments using a three-level fair value measurement hierarchy. The amendment (a) clarifies that the maturityanalysis of liabilities should include issued financial guarantee contracts at the maximumamount of the guarantee in the earliest period in which the guarantee could be called; and
26__;._.
upâev/dmt

(b) requires disclosure of remaining contractual maturities of financial derivatives if thecontractual maturities are essential for an understanding of the timing of the cash flows. Anentity will further have to disclose a maturity analysis of financial assets it holds formanaging liquidity risk, if that information is necessary to enable users of its financialstatements to evaluate the nature and extent of liquidity risk. The enhanced disclosures areincluded in these financial statements.
Embedded Derivatives - Amendments to IFRIC 9 and lAS 39, issued in March 2009(effective for annual periods ending on or after 30 June 2009; amendments to I ERIC 19 andlAS 39 as adopted by the EU are effective for annual periods beginning after 31 December2009, early adoption permitted). The amendments clarify that on reclassification of afinancial asset out of the ‘at fair value through profit or loss’ category, all embeddedderivatives have to be assessed and, if necessary, separately accounted for. Theamendment did not have an impact on these financial statements.
New standards, amendments to standards and interpretations that are mandatory forthe Bank’s accounting periods beginning on or after 1 January 2010 or later periodsand which the Bank has not early adopted
IFRIC 12, Service Concession Arrangements (IERIC 12 as adopted by the EU iseffective for annual periods beginning on or after 30 March 2009, early adoption permitted).The interpretation contains guidance on applying the existing standards by serviceproviders in public-to-private service concession arrangements. Application of IFRIC 12 willnot have any impact on the Bank’s financial statements, because the Bank is not subject toany service concession arrangements.
IFRIC 15, Agreements for the Construction of Real Estate (effective for annual periodsbeginning on or after 1 January 2009; IERIC 15 as adopted by the EU is effective for annualperiods beginning after 31 December 2009, early adoption permitted). The interpretationapplies to the accounting for revenue and associated expenses by entities that undertakethe construction of real estate directly or through subcontractors, and provides guidance fordetermining whether agreements for the construction of real estate are within the scope oflAS 11 or lAS 18. It also provides criteria for determining when entities should recogniserevenue on such transactions. Interpretation does not have an impact on Bank’s financialstatements.
IFRIC 16, Hedges of a Net Investment in a Foreign Operation (effective for annualperiods beginning on or after 1 October 2008; IFRIC 16 as adopted by the EU is effectivefor annual periods beginning after 30 June 2009, early adoption permitted). Theinterpretation explains which currency risk exposures are eligible for hedge accounting andstates that translation from the functional currency to the presentation currency does notcreate an exposure to which hedge accounting could be applied. The IERIC allows thehedging instrument to be held by any entity or entities within a group except the foreignoperation that itself is being hedged. The interpretation also clarifies how the currencytranslation gain or loss reclassified from other comprehensive income to profit or loss iscalculated on disposal of the hedged foreign operation. Reporting entities apply lAS 39 todiscontinue hedge accounting prospectively when their hedges do not meet the criteria forhedge accounting in IERIC 16. Interpretation does not have an impact on Bank’s financialstatements.
IFRIC 17, Distributions of Non-Cash Assets to Owners (effective for annual periodsbeginning on or after 1 July 2009; IFRIC 17 as adopted by the EU is effective for annualperiods beginning after 31 October 2009, early adoption permitted). The interpretationclarifies when and how distribution of non-cash assets as dividends to the owners should
fl27
Kuupaev/datTllrr

be recognised. An entity should measure a liability to distribute non-cash assets as adividend to its owners at the fair value of the assets to be distributed. A gain or loss ondisposal of the distributed non-cash assets will be recognised in profit or loss for the yearwhen the entity settles the dividend payable. IFRIC 17 does not have an impact on Bank’sfinancial statements as the Bank does not distribute non-cash assets to owners.
IFRIC 18, Transfers of Assets from Customers (effective prospectively to transfers ofassets from customers received on or after 1 July 2009, earlier application permitted;IFRIC 18 as adopted by the EU is effective for annual periods beginning after 31 October2009, early adoption permitted). The interpretation clarifies the accounting for transfers ofassets from customers, namely, the circumstances in which the definition of an asset ismet; the recognition of the asset and the measurement of its cost on initial recognition; theidentification of the separately identifiable services (one or more services in exchange forthe transferred asset); the recognition of revenue, and the accounting for transfers of cashfrom customers. Interpretation does not have an impact on Bank’s financial statements.
Classification of Rights Issues - Amendment to lAS 32, issued in October 2009(effective for annual periods beginning on or after 1 February 2010). The amendmentexempts certain rights issues of shares with proceeds denominated in foreign currenciesfrom classification as financial derivatives. The amendment is not expected to have amaterial impact on the Bank’s financial statements.
lAS 27, Consolidated and Separate Financial Statements, revised in January 2008(effective for annual periods beginning on or after 1 July 2009). The revised lAS 27 willrequire an entity to attribute total comprehensive income to the owners of the parent and tothe non-controlling interests (previously “minority interests”) even if this results in the non-controlling interests having a deficit balance (the current standard requires the excesslosses to be allocated to the owners of the parent in most cases). The revised standardspecifies that changes in a parent’s ownership interest in a subsidiary that do not result inthe loss of control must be accounted for as equity transactions. It also specifies how anentity should measure any gain or loss arising on the loss of control of a subsidiary. At thedate when control is lost, any investment retained in the former subsidiary will have to bemeasured at its fair value. The Bank is currently assessing the impact of the amendedstandard on its financial statements.
IFRS 3, Business Combinations, revised in January 2008 (effective for businesscombinations for which the acquisition date is on or after the beginning of the first annualreporting period beginning on or after 1 July 2009). The revised IFRS 3 will allow entities tochoose to measure non-controlling interests using the existing IFRS 3 method(proportionate share of the acquiree’s identifiable net assets) or at fair value. The revisedIFRS 3 is more detailed in providing guidance on the application of the purchase method tobusiness combinations. The requirement to measure at fair value every asset and liability ateach step in a step acquisition for the purposes of calculating a portion of goodwill has beenremoved. Instead, in a business combination achieved in stages, the acquirer will have toremeasure its previously held equity interest in the acquiree at its acquisition-date fair valueand recognise the resulting gain or loss, if any, in profit or loss for the year. Acquisition-related costs will be accounted for separately from the business combination and thereforerecognised as expenses rather than included in goodwill. An acquirer will have to recogniseat the acquisition date a liability for any contingent purchase consideration. Changes in thevalue of that liability after the acquisition date will be recognised in accordance with otherapplicable IFRSs, as appropriate, rather than by adjusting goodwill. The revised IFRS 3brings into its scope business combinations involving only mutual entities and businesscombinations achieved by contract alone. The Bank is currently assessing the impact of theamended standard on its financial statements.
Initsiaad/jnt 4L
28 Kuupäev/date QfToQ

Amendment to IFRS 5, Non-current Assets Held for Sale and DiscontinuedOperations (and consequential amendments to IFRS 1) (effective for annual periodsbeginning on or after 1 July 2009). This amendment to IFRS 5 is part of the IASB’s annualimprovements project published in May 2008. The amendment clarifies that an entitycommitted to a sale plan involving loss of control of a subsidiary would classify thesubsidiary’s assets and liabilities as held for sale. The revised guidance should be appliedprospectively from the date at which the entity first applied IFRS 5. The Bank is currentlyassessing the impact of the amendment on its financial statements.
Eligible Hedged Items — Amendment to lAS 39 (effective with retrospective applicationfor annual periods beginning on or after 1 July 2009). The amendment clarifies how theprinciples that determine whether a hedged risk or portion of cash flows is eligible fordesignation should be applied in particular situations. The amendment is not expected tohave any impact on the Bank’s financial statements as the Bank does not apply hedgeaccounting.
IFRS 1, First-time Adoption of International Financial Reporting Standards, revised inDecember 2008 (effective for the first IFRS financial statements for a period beginning onor after 1 July 2009; restructured IFRS I as adopted by the EU is effective for annualperiods beginning after 31 December 2009, early adoption permitted). The revised IFRS Iretains the substance of its previous version but within a changed structure in order to makeit easier for the reader to understand and to better accommodate future changes. Therevised standard does not have any effect on the Bank’s financial statements.
Group Cash-settled Share-based Payment Transactions - Amendments to IFRS 2(effective for annual periods beginning on or after 1 January 2010, not yet adopted by theEU). The amendments provide a clear basis to determine the classification of share-basedpayment awards in both consolidated and separate financial statements. The amendmentsincorporate into the standard the guidance in IFRIC 8 and IFRIC 11, which are withdrawn.The amendments expand on the guidance given in IFRIC 11 to address plans that werepreviously not considered in the interpretation. The amendments also clarify the definedterms in the Appendix to the standard. The Bank does not expect the amendments to haveany material effect on its financial statements.
Additional Exemptions for First-time Adopters - Amendments to IFRS I (effective forannual periods beginning on or after 1 January 2010; not yet adopted by the EU). Theamendments exempt entities using the full cost method from retrospective application ofIFRSs for oil and gas assets and also exempt entities with existing leasing contracts fromreassessing the classification of those contracts in accordance with IFRIC 4, ‘DeterminingWhether an Arrangement Contains a Lease’ when the application of their nationalaccounting requirements produced the same result. The amendments will not have anyimpact on the Bank’s financial statements.
Improvements to International Financial Reporting Standards, issued in April 2009(amendments to IFRS 2, lAS 38, IFRIC 9 and IFRIC 16 are effective for annual periodsbeginning on or after 1 July 2009; amendments to IFRS 5, IFRS 8, lAS 1, lAS 7, lAS 17,lAS 36 and lAS 39 are effective for annual periods beginning on or after 1 January 2010;the improvements have not yet been adopted by the EU). The improvements consist of amixture of substantive changes and clarifications in the following standards andinterpretations: clarification that contributions of businesses in common control transactionsand formation of joint ventures are not within the scope of IFRS 2; clarification of disclosurerequirements set by IFRS 5 and other standards for non-current assets (or disposal groups)classified as held for sale or discontinued operations; requiring to report a measure of totalassets and liabilities for each reportable segment under IFRS 8 only if such amounts areregularly provided to the chief operating decision maker; amending lAS I to allowclassification of certain liabilities settled by entity s own equity instruments as non-current,
29 tsaaid/ifltia.
T

changing lAS 7 such that only expenditures that result in a recognised asset are eligible forclassification as investing activities; allowing classification of certain long-term land leasesas finance leases under lAS 17 even without transfer of ownership of the land at the end ofthe lease; providing additional guidance in lAS 18 for determining whether an entity acts asa principal or an agent; clarification in lAS 36 that a cash generating unit shall not be largerthan an operating segment before aggregation; supplementing lAS 38 regardingmeasurement of fair value of intangible assets acquired in a business combination;amending lAS 39 (i) to include in its scope option contracts that could result in businesscombinations, (ii) to clarify the period of reclassifying gains or losses on cash flow hedginginstruments from equity to profit or loss for the year and (iii) to state that a prepaymentoption is closely related to the host contract if upon exercise the borrower reimburseseconomic loss of the lender; amending IFRIC 9 to state that embedded derivatives incontracts acquired in common control transactions and formation of joint ventures are notwithin its scope; and removing the restriction in IFRIC 16 that hedging instruments may notbe held by the foreign operation that itself is being hedged. The Bank does not expect theamendments to have any material effect on its financial statements.
Amendment to lAS 24, Related Party Disclosures, issued in November 2009 (effectivefor annual periods beginning on or after 1 January 2011; not yet adopted by the EU). Theamended standard simplifies the disclosure requirements for government-related entitiesand clarifies the definition of a related party. The Bank is currently assessing the impact ofthe amended standard on disclosures in its financial statements.
IFRS 9, Financial Instruments Part 1: Classification and Measurement, issued inNovember 2009 (effective for annual periods beginning on or after 1 January 2013; not yetadopted by the EU). IFRS 9 replaces those parts of lAS 39 relating to the classification andmeasurement of financial assets. Key features are as follows:
• Financial assets are required to be classified into two measurement categories: thoseto be measured subsequently at fair value, and those to be measured subsequentlyat amortised cost. The decision is to be made at initial recognition. The classificationdepends on the entity’s business model for managing its financial instruments and thecontractual cash flow characteristics of the instrument.
• An instrument is subsequently measured at amortised cost only if it is a debtinstrument and both (i) the objective of the entity’s business model is to hold the assetto collect the contractual cash flows, and (ii) the asset’s contractual cash flowsrepresent only payments of principal and interest (that is, it has only “basic loanfeatures”). All other debt instruments are to be measured at fair value through profit orloss.
• All equity instruments are to be measured subsequently at fair value. Equityinstruments that are held for trading will be measured at fair value through profit orloss. For all other equity investments, an irrevocable election can be made at initialrecognition, to recognise unrealised and realised fair value gains and losses throughother comprehensive income rather than profit or loss. There is to be no recycling offair value gains and losses to profit or loss. This election may be made on aninstrument-by-instrument basis. Dividends are to be presented in profit or loss, aslong as they represent a return on investment.
The Bank is considering the implications of the standard, the impact on the Bank and thetiming of its adoption by the Bank.
IFRIC 19, Extinguishing Financial Liabilities with Equity Instruments (effective forannual periods beginning on or after 1 July 2010; not yet adopted by the EU). This IFRICclarifies the accounting when an entity renegotiates the terms of its debt with the result thatthe liability is extinguished through the debtor issuing its own equity instruments to thecreditor. A gain or loss is recognised in the profit and loss account based on the fair value
ftr30 idñn.t
_...
Q.’
Prr.rh

of the equity instruments compared to the carrying amount of the debt. The Bank iscurrently assessing the impact of the interpretation on its financial statements.
Prepayments of a Minimum Funding Requirement — Amendment to IFRIC 14 (effectivefor annual periods beginning on or after 1 January 2011; not yet adopted by the EU). Thisamendment will have a limited impact as it applies only to companies that are required tomake minimum funding contributions to a defined benefit pension plan. It removes anunintended consequence of IFRIC 14 related to voluntary pension prepayments when thereis a minimum funding requirement. The Bank is currently assessing the impact of theamended interpretation on its financial statements.
Limited exemption from comparative IFRS 7 disclosures for first-time adopters -
Amendment to IFRS I (effective for annual periods beginning on or after 1 July 2010; notyet adopted by the EU). Existing IFRS preparers were granted relief from presentingcomparative information for the new disclosures required by the March 2009 amendmentsto IFRS 7 ‘Financial Instruments: Disclosures’. This amendment to IFRS I provides firsttime adopters with the same transition provisions as included in the amendment to IFRS 7.The amendment is not expected to have any impact on the Bank’s financial statements.
Other new standards and interpretations are not expected to significantly affect the Bank’sfinancial statements.
nisaadiinas .L.
31

Notes to the Financial Statements
Note 1: Interest Income
From loansFrom demand deposits with other banksFrom time deposits with other banksFrom debt securitiesFrom derivativesOther incomeTotal
Interest income by geographical areasEstoniaOECD countriesTotal
On demand depositsOn time depositsOn derivativesOther interest expenseTotal
Interest expense by geographical areasEstoniaOECD countriesTotal
Account opening and maintenance feesBank transaction feesSecurities transaction feesOther fees and commissions incomeTotal
Fees and commissions income by geographical areasEstoniaOECD countriesTotal
Note 2: Interest Expense
EEK ths. EEK ths. EUR ths. EUR ths.
2009 2008 2009 2008
53,849 62,874 3,442 4,018971 3,339 62 213260 668 17 43
1,904 3,670 122 235507 285 32 18317 673 20 43
57,808 71,509 3,695 4,570
56,930 69,996 3,638 4,474878 1,513 56 97
57,808 71,509 3,695 4,570
EEK ths. EEK ths. EUR ths. EUR ths.
2009 2008 2009 2008
1,349 2,515 86 16120,660 23,935 1,320 1,530
534 1,128 34 72467 0 30 0
23,010 27,578 1,471 1,763
16,873 15,678 1,078 1,0026,137 11,900 392 761
23,010 27,578 1,471 1,763
Note 3: Fees and Commissions Income
EEK ths. EEK ths. EUR ths. EUR ths.
2009 2008 2009 2008
363 339 23 222,941 1,845 188 118
917 346 59 22150 91 10 6
4,371 2,621 279 168
2,108 1,412 135 902,263 1,209 145 774,371 2,621 279 168
sI
32 wpav/d 0 0Prtr w I nn

Note 4: Fees and Commissions Expense
Securities’ transactions expensesBank transaction expensesSWIFT. expensesCollection charges and other fee expensesTotal
From foreign exchangeFrom shares and debt securities in tradingportfolioTotal
Guarantee Fund payments *
Financial Supervision Authority feesStock Exchange feesOther operating expensesTotal
Note 7: Personnel Expense
SalariesCompensation to the Supervisory BoardmembersFringe benefitsIncome tax on fringe benefitsChange in vacations pay accrualTotal
From salariesFrom compensation to the Supervisory Boardmembers
33
Note 5: Net Trading Gains
EEK ths. EEK ths. EUR ths. EUR ths.
2009 2008 2009 2008
599 143 38 9988 787 63 50512 426 33 27
6 1,180 0 752,105 2,536 135 162
EEK ths. EEK ths. EUR ths. EUR ths.
2009 2008 2009 2008
3,436 4,486 220 287
44 -13 3 -1
3,480 4,473 222 286
Note 6: Other Operating Expenses
EEK ths. EEK ths. EUR ths. EUR ths.
2009 2008 2009 2008
16 858 1 55862 844 55 54187 186 12 1266 300 4 19
1,131 2,188 72 140* Guarantee Fund payments decreased in year 2009, as the Fund significantly loweredquarterly contributions to deposit guarantee sectoral fund (from 0125% to 0.0008% in 3rdquarter 2008).
Note 8: Payroll Related Taxes
EEK ths. EEK ths. EUR ths. EUR ths.
2009 2008 2009 2008
16,319 15,599 1,043 997
792 788 51 50
92 156 6 1069 56 4 498 340 6 22
17,370 16,939 1,110 1,083
EEK ths. EEK ths. EUR ths. EUR ths.
2009 2008 2009 2008
5,433 5,105 347 326
261 430 17 27

Note 10: Depreciation and Amortisation of Tangible and Intangible Assets
Note 11: Impairment Loss on Financial Assets
* Decrease in value of property investments and tangible assets, as well as allowances forimpairment of fees receivable has been disclosed as impairment on other assets.
.
V!C
. .
EEK ths. EEK ths. EUR ths. EUR ths.
2009 2008 2009 2008106 85 7 5
32 112 2 7
9 1 1 0
5,841 5,733 373 366
Note 8 continued:
From fringe benefitsSocial insurance tax from change in vacationspay accrualUnemployment insurance premium from changein vacations pay accrualTotal
Note 9: Other Administrative Expenses
Rent of premisesOther professional services purchasedAdvertising expensesOffice expensesTransportation expensesOther expensesPost and telecommunication expensesTraining and business trip expensesIT expensesTotal
EEKths.
2009
5,0722,1121,1451,0421,069
803975274223
12,715
EEKths.
20084,7902,3042,1341,508
980975887427288
14,293
EURths.
2009
32413573676851621814
813
EURths.
2008
306147136966362572718
913
EEKths. EEKths. EURths. EURths.
Note 2009 2008 2009 2008Depreciation of tangible assets 18 1,857 1,966 119 126Amortisation of intangible assets 20 516 484 33 31Total 2,373 2,450 152 157
EEKths. EEKths. EURths. EURths.
2009 2008 2009 2008-21,591 -94 -1,380 -6Available-for-sale financial assets (Note 17)
Loans (Note 15):Impairment loss on loansClaims written offRecoveries of impaired loans
Total loansImpairment on other assets *
Total
-63,820 -22,314 -4,079 -1,426-1,160 0 -74 02,055 3,330 131 213
-62,925 -18,984 -4,022 -1,213-986 -178 -63 -11
-85,502 -19,256 -5,465 -1,231

Note 12: Cash
In Estonian kroonsIn foreign currencyTotal
Note 13: Balances with Central Bank
Mandatory reserveSurplus of the reserve with the central bankAccrued interests receivableTotal
EEK ths. EEK ths. EUR ths. EUR ths.
31.12.09 31.12.08 31.12.09 31.1 2.08
1,141 1,216 73 78935 673 60 43
2,076 1,889 133 121
EEK ths. EEK ths. EUR ths. EUR ths,
31.12.09 31.1 2.08 31.12.09 31.12.08
93,886 94,283 6,000 6,02613,686 17,904 875 1,144
20 163 1 10107,592 112,350 6,876 7,180
The Bank of Estonia has established a mandatory reserve requirement to credit institutions at15% of the average amount of deposits and issued financial guarantees. Fulfillment of thereserve requirement is monitored based on month’s average. Credit institutions are obliged tokeep at least 40% of the established mandatory reserve maintained in Estonian kroons on thecorrespondent account at the Bank of Estonia on a daily basis.
Note 14: Due from Other Banks
Due from other banks by bank ratings (Moodys Investors Service)Al 24,199Aal 23,166
Note 15: Due from Customers
Due by customer types (gross)Due from financial institutions
Loans:Loans to financial institutions
710,964
0 35,691
35.
)f / L
— 05 03
EEK ths.
Correspondent accounts
Receivables by countryEstoniaOECD countriesTotal
31.12.09
61,057
24,13836,91961,057
EEK ths.
31.12.08
47,972
35,71012,26247,972
EUR ths.
31.12.09
3,902
1,5432,3603,902
1,5471,481
0Aa2Aa3Baa3Not ratedTotal
EURths.
31.12.08
3,066
2,282784
3,066
0701
2,281
843,066
6,5199
7,16461,057
0 417I0
1,31047,972
00
4583,902
EEK ths. EEK ths. EUR ths. EUR ths.
31.12.09 31.12.08 31.12.09 31.12.08
3,110 3,465 199 221
36,742 43,837 2,348 2,802

Note 15 continued:
______________________________________
EEK ths. EEK ths. EUR ths. EUR ths.
31.12.09 31.12.08 31.12.09 31.12.08Loans to private companies 498,738 532,949 31,875 34,062Loans to non-profit organisations 500 0 32 0Loans to private persons 84,594 81,679 5,407 5,220Total loans 620,574 658,465 39,662 42,084Total due from customers (gross) 623,684 661,930 39,861 42,305
Specific loan loss allowances -84,658 -22,893 -5,411 -1,463Accrued interest receivable 19,101 5,555 1,221 355Effective interest rate adjustment -3,014 -4,485 -193 -287Total due from customers (net) 555,113 640,107 35,478 40,910
Loans by collaterals (gross)Mortgage 467,994 503,009 29,910 32,148Commercial pledge 12,753 15,104 815 965Pledge of shares 20,810 24,690 1,330 1,578Deposit 4,737 7,057 303 451Other security over movables 43,632 48,232 2,789 3,083Other 30,181 24,663 1,929 1,576Without collateral 40,467 35,710 2,586 2,282Total 620,574 658,465 39,662 42,084
Due by remaining maturity (gross)On demand 3,032 3,386 194 216Up to 3 months 99,031 97,491 6,329 6,2313to 12 months 66,046 90,070 4,221 5,757lto2years 117,435 140,216 7,505 8,9612to5years 185,786 234,168 11,874 14,966over 5 years 42,937 46,945 2,744 3,000pastdue 24,759 26,761 1,582 1,710impaired loans 84,658 22,893 5,411 1,463Total 623,684 661,930 39,861 42,305
Due by countries (gross)Estonia 615,525 654,876 39,339 41,854OECD countries 8,159 7,054 521 451Total 623,684 661,930 39,861 42,305
Past Due and Impaired Loans
EEK ths. EEK ths. EUR ths. EUR ths.
31.12.09 31.12.08 31.12.09 31.12.08Past due loan principal payments (md. impaired,
110 523 49 654 7 064 3,173gross)Past due loan interests payments 6,024 1,416 385 90Total past due claims 116,547 51,070 7,449 3,264No. of non-performing loans 57 22 57 22
Past due loans by client type (gross)Loans to private companies 111,525 47,379 7,128 3,028Loans to private persons 5,022 3,691 321 236Total 116,547 51,070 7,449 3,264
36flk L

Note 15 continued:
Fair Value of Collaterals of Past Due and Impaired Loans
Past due financial assets maturity structure
Private companiesUp to 90 days91 days to 1 year1 to 2 yearsTotal
Private personsUpto9odays91 days to 1 year1 to 2 yearsTotalTotal past due financial assets
Restructured loans
EEK ths. EEK ths. EUR ths. EUR ths.
31.12.09 31.12.08 31.12.09 31.12.08
Past due 70,945 122,037 4,534 7,800Impaired loans 119,171 17,050 7,616 1,090Total 190,116 139,087 12,151 8,889
Specific Loan Loss Allowances by ClientTypePrivate companiesLoan loss allowances at beginning of period -22,460 -3,940 -1,435 -252New loan loss allowances during period -56,301 -34,708 -3,598 -2,218Deductions of allowances during period 1,303 16,188 83 1,035Loan loss allowances at end of period -77,458 -22,460 -4,950 -1,435
Private personsLoan loss allowances at beginning of period -433 0 -28 0New loan loss allowances during period -7,519 -480 -481 -31Deductions of allowances during period 752 47 48 3Loan loss allowances at end of period -7,200 -433 -460 -28Total specific loan loss allowances -84,658 -22,893 -5,411 -1,463
All uncovered loans and overdrafts, where the payments are overdue by more than 90 days, arereported as non-performing loans. Five loans have been written off as hopeless in year 2009.
Total credit risk, arising from on-balance sheet assets is equal to the carrying value of thefinancial assets. Credit risk arising from unused loan limits disclosed off-balance sheetcomprises EEK 1,735 ths (please see Note 31).
EEK ths. EEK ths. EUR ths. EUR ths.
31.12.09 31.12.08 31.12.09 31.12.08
522 28,198 33 1,80264,217 18,570 4,104 1,18746,786 610 2,990 39
111,525 47,379 7,128 3,028
99 3,456 6 2211,132 33 72 23,791 203 242 135,022 3,691 321 236
116,547 51,070 7,449 3,264
EEK ths. EEK ths. EUR ths. EUR ths.
31.12.09 31.12.08 31.12.09 31.12.08Loans to companies 154,619 0 9,882 0Loans to private persons 2,454 0 157 0Total 157,073 0 10,039 0
Bank has restructured less than twenty loans, as of 31.12.2009, where the payment difficultieshave temporary nature.
37
.....
0 •fl [y
Kuu.päev/dot: 05. O3 \
•

Note 16: Financial AssetslFinancial Liabilities Held for Trading
Derivatives *
Financial assets in fair value with changethrough income statement
md, shares listed on a stock exchange (activemarket)Total
Shares and other securities by countriesEstoniaOECD countriesTotal
Currency related derivatives:claims (in contract value)commitments (in contract value)fair value
Interest rate and commodity related derivatives:
claims (in contract value)commitments (in contract value)fair value
Debt securities and other shares by issuerDebt securities of credit institutionsDebt securities of private companiesOther shares and fund units of privatecompaniesTotal
EEK ths. EEK ths. EUR ths. EUR ths.
31.1 2.09 31.12.08 31.12.09 31.12.08
-12 481 -1 31
145 104 9 7
145 104 9 7
133 585 9 37
56 71 4 577 514 5 33
133 585 9 37
EEK ths, EEK ths. EUR ths. EUR ths.
31.12.09 31.12.08 31.12.09 31.12.08
109,639 41,195 7,007 2,633109,639 41,207 7,007 2,634
1 -12 0 -1
8,428 22,590 539 1,4448,428 22,590 539 1,444
-13 493 -1 32
EEK ths. EEK ths. EUR ths. EUR ths,
31.12.09 31.12.08 31.12.09 31.12.08
674 993 43 631,039 18,048 66 1,153
1,259 96 80 6
2,972 19,137 190 1,223
* Derivatives
Note 17: Available-for-Sale Financial Assets
38

Note 17 continued:
Movements in debt securities and other shares
Balance at beginning of yearPurchasesRedemptionsProvisionsAmortised premium discount and fair valuerevaluationInterest accrualsTotal
EEK ths. EEK ths, EUR ths. EUR ths.
31.12.09 31.12.08 31.12.09 31.12.08
19,137 28,328 1,223 1,8101,205 26,360 77 1,685-767 -26,715 -49 -1,707
-21,591 -94 -1,380 -6
5,045 -8,811 322 -563
-57 69 -4 42,972 19,137 190 1,223
Debt securities by ratingsWith ratings (lower than A-) 0 993 0 63Without ratings 2,972 18,144 190 1,160Total 2,972 19,137 190 1,223
Debt securities by countriesEstonia 2,972 19,137 190 1,223OECD countries 0 0 0 0Total 2,972 19,137 190 1,223
Allowances for impairment of available-for-sale financial assets
Debt securities of private companiesOther shares of private companiesTotal
Note 18: Property and Equipment
EEK ths. EEK ths. EUR ths. EUR ths.
31.12.09 31.12.08 31.12.09 31.12.08
21,549 94 1,377 642 0 0 0
21,591 94 1,380 6
EEK ths.
OtherCapitalised Compu- Furni- tangible Totalconstruction ters ture assetsexpenses *
Balance as of 01.01.2009At cost 4,601 1,276 1,396 3,511 10,784Accumulated depreciation -2,655 -842 -1,003 -1,766 -6,266Net value 1,946 434 393 1,745 4,518
Changes in 2009Purchasesduring period 0 32 35 125 192Depreciation expense -793 -241 -186 -637 -1,857
Property and equipment0 124 245 60 -429write-offs (at cost) - - -
Balance as of 31.12.2009At cost 4,601 1,184 1,186 3,576 10,547Accumulated depreciation -3,448 -959 -944 -2,343 -7,694Net value 1,153 225 242 1,233 2,853
39

Note 18 continued:EUR ths.
OtherCapitalised Compu- Furni- tangible Totalconstruction ters ture assetsexpenses *
Balance as of 01.01.2009At cost 294 82 89 224 689Accumulated depreciation -170 -54 -64 -113 -400Net value 124 28 25 112 289
Changes in 2009Purchases during period 0 2 2 8 12Depreciation expense -51 -15 -12 -41 -119
Property and equipment0 -8 -16 -4 -27write-offs (at cost)
Balance as of 31.12.2009At cost 294 76 76 229 674Accumulated depreciation -220 -61 -60 -150 -492Net value 74 14 15 79 182
* Reconstruction expenses of rented premises.
EEK ths.
OtherCapitalised Compu- Furni- tangible Prepay- Totalconstruction ters ture mentsexpenses * assets
Balance as of 01 .01.2008At cost 3,844 1,364 1,498 3,459 0 10,165Accumulated depreciation -1,830 -940 -927 -1,537 0 -5,234Net value 2,014 424 571 1,922 0 4,931
Changes in 2008Purchasesduring period 172 278 24 416 842 1,732Depreciation expense -832 -266 -202 -666 0 -1,966
Property and equipmentwrite-offs (at cost) -14 -366 -126 -607 0 -1,113
Registered as property andequipment from 599 0 0 243 -842 0prepayment
Balance as of 31.12.2008At cost 4,601 1,276 1,396 3,511 0 10,784Accumulated depreciation -2,655 -842 -1,003 -1,766 0 -6,266Net value 1,946 434 393 1,745 0 4,518
. 1fl.iV
40
OS
35

Note 18 continued:
87 96 221-60 -59 -9827 36 123
o 6500 -335o 315
Changes in 2008Purchases during periodDepreciation expense
11 18 2 27-53 -17 -13 -43
54 1110 -126
Property and equipmentwrite-offs (at cost)
Registered as property andequipment fromprepayment
Balance as of 31.12.2008At costAccumulated depreciationNet value
* Reconstruction expenses of rented premises.
Note 19: Investment properties
5,057-675
4,382
0 3230 -430 280
0 6890 -4000 289
000
Bank has acquired seven flats from repertory auctions in year 2009, with an intention to sellthem in the few coming years.Investment properties are valued at fair value, derived by the Bank from transactions in marketvalue with similar assets.
41 cupaev!datePrc fl —
EUR ths.
OtherCapitalised Compu- Furni- tangible Prepay-construction Totalters ture mentsexpenses * assets
Balance as of 01.01.2008At costAccumulated depreciationNet value
246-117129
-1 -23 -8 -39 0 -71
38 0 0 16 -54 0
294 82 89 224-170 -54 -64 -113124 28 25 112
Investment properties acquiredFair value revaluationTotal
EEK ths. EEK ths. EUR ths. EUR ths.
31.12.09 31.12.08 31.12.09 31.12.08

Note 20: Intangible Assets
Software
Balance as of 01.01.At costAccumulated amortisationNet value
Changes during report yearPurchases during periodAmortisation expenseWrite-offs (at cost)
Balance as of 31.12.At costAccumulated amortisationNet value
EEK ths, EEK ths. EUR ths. EUR ths.
42
EEK ths. EEK ths. EUR ths. EUR ths,
31.12.09 31.12.08 31.12.09 31.12.08
4,216 4,113 269 263-3,285 -2,801 -210 -179
931 1,312 60 84
212 103 14 7-516 -484 14 7-209 0 -13 -0
EEK ths. EEK ths. EUR ths, EUR ths.
31.12.09 31.12.08 31.12.09 31.12.08
4,219 4,216 270 269-3,598 -3,285 -230 -210
621 931 40 60
EEKths. EEKths. EURths. EURths.
31.12.09 31.12.08 31.12.09 31.12.08
411 250 26 16861 854 55 55660 326 42 21184 106 12 7
2 0 0 02,118 1,536 135 98
Note 21: Other assets
Fees and commissions receivablePrepaid supervision fees *
Other prepaid expenses **
Other receivablesOther accrued revenueTotal
Prepaid supervision fees include fees paid to the supervisory authority in accordance with theFinancial Supervision Authority Act. The rate of supervision fee consists of the capital sharewhich is an amount equal to one per cent of the minimum amount of the net own funds and theshare calculated on the basis of assets in an amount equal to 0.005 to 0.05 per cent of theassets of the credit institution. The supervision fee is prepaid once a year for the next year.
** Other prepaid expenses include the collateral amounts paid according to the leaseagreements for premises, insurance payments and server maintenance fees.
Note 22: Deposits
31.12.09 31.12.08Deposits from credit institutions 141,043 266,519 9,014 17,034Other deposits 425,737 357,031 27,210 22,818Total 566,780 623,550 36,224 39,852
Demand deposits 97,709 100,492 6,245 6,423Time deposits 465,008 518,887 29,719 33,163Accrued interests 4,063 4,171 260 267Total 566,780 623,550 36,224 39,852
31.12.09 31.12.08

Note 22 continued:
Demand deposits by customer groupsCompaniesPrivate personsNon-profit organisationsCredit institutionsFinancial institutionsGovernmentTotal
Time deposits by customer groupsCredit institutionsPrivate persons
CompaniesNon-profit organ isationsFinancial institutionsTotal
Deposits by maturitiesOn demandUp to 3 months3 to 12 months1 to 2 years2 to 5 yearsTotal
Subordinated debt receivedInterest payableTotal
Bank took a 4.0 million euro i.e. 62.6 million kroon subordinated debt from Marfin Egnatia BankS.A. a bank belonging to the group, in December 2009, bearing an interest rate 6 monthEuribor + 3% pa. This 10-year subordinated loan can be treated as tier 2 own funds.
43—
— ___ 2oTm n
EEKths. EEKths. EURths. EURths.
31.12.09 31.12.08 31.1 2.09 31.12.08
70,176 79,803 4,485 5,10025,376 18,498 1,622 1,182
1,965 1,984 126 127162 174 10 1129 33 2 2
1 0 0 097,709 100,492 6,245 6,423
140,819 265,992 9,000 17,000134,171 118,462 8,575 7,571
EEK ths. EEK ths. EUR ths. EUR ths.
31.12.09 31.12.08 31.12.09 31.12.08
175,834 110,140 11,238 7,03914,184 24,293 907 1,553
0 0 0 0465,008 518,887 29,719 33,163
97,708 43,581 6,245 2,785287,177 402,425 18,354 25,720163,637 155,585 10,458 9,944
13,665 8,764 873 560530 9,024 34 577
562,717 619,379 35,964 39,586
EEK ths. EEK ths. EUR ths. EUR ths.
Note 23: Subordinated Debt
31.12.09 31.12.08 31.12.09 31.1 2.08
62,586 0 4,000 0432 0 28 0
63,018 0 4,028 0
Note 24: Borrowed Funds from Government and Foreign Aid
Borrowings receivedBorrowings repaidTotal
EEKths. EEKths. EURths. EURths,
31.1 2.09 31.12.08 31.12.09 31.12.08
2,100942
1,158
000
1346074
000

Note 24 continued:
Borrowings from Estonian Rural Development Foundation are reported under borrowed fundsfrom government and foreign aid. Borrowings bear a fixed interest rate 1.5 - 3% p.a.
Note 25: Tax Liabilities
Taxes payable
EEK ths. EEK ths. EUR ths. EUR ths.
31.12.09 31.12.08 31.12.09 31.12.08
825 802 53 51
There has not been any tax audit in the Bank, and thus no additional taxes have been assigned.Tax authority has the right to audit tax calculations of the Bank during 6 years from due date offiling tax declaration, and in case of mistakes assign additional taxes, interests and penalties.
Note 26: Other Liabilities
EEKths. EEKths. EURths. EURths.
* Payments in transmission include payments of customers and the bank, which are in clearingprocess as well as unsettled payments (md. incorrectly received funds, returnable funds etc.)which can fluctuate significantly as of report date due to few single payments.
-
r)äcv/date ___
Prcevat6 hc•u.sc()c iiflfl
EEK ths. EEK ths. EUR ths. EUR ths.
31.12.09 31.12.08 31.12.09 31.12.08
Deposits by maturitiesUpto3months 528 0 34 03to 12 months 228 0 15 01 to 2 years 390 0 25 02to5years 12 0 1 0Total 1,158 0 74 0
31.12.09 31.12.08Payments in transmission * 3,138Payables to employees 1,012Payables to suppliers 368Prepaid expensesOther liabilitiesTotal 4,527 20,894
19,726872157
0 1269 13
31.12.09
2016524
01
289
31.12.08
1,2615610
81
1,335

Note 27: Shareholders’ Equity
SharesShare capital is divided into 20,050,000 common shares with nominal value of 10 Estoniankroons each, and was paid-in in cash. According to the articles of association, the minimumshare capital of the Bank is 100,000,000 Estonian kroons and maximum share capital is400,000,000 Estonian kroons. Each registered share gives one vote to the shareholder,which gives shareholder’ a right to participate in the management of the company, in profitdistribution and in case of liquidation in distribution of remaining assets, also other rightsstipulated in law and articles of association.
The ownership structure of the Bank is disclosed in the Management Report. There is noultimate controlling party, as the ownership of the parent company is also diluted.
Fair Value Reserve for Available-for-Sale Financial Assets
Revaluation gains and losses from available-for-sale financial assets (debt securities) arereflected as fair value reserve in accordance with lAS 39.
Statutory Legal ReserveStatutory legal reserve has been formed in accordance with the Estonian CommercialCode, Statutory legal reserve is formed by means of yearly appropriations from the netprofit. At least 1/20 of the net profit must be set aside to statutory legal reserve, until thestatutory legal reserve is at least 1/10 of share capital. Statutory legal reserve can be usedto cover losses, also to increase share capital. No payments can be made to the ownersfrom the statutory legal reserve.
Note 28: Related-Party Transactions
The following parties are considered to be related in the Annual Report of MARFINPANK EESTI AS:
a. owners (Marfin Popular Bank Public Company Ltd. is the main owner of theBank);
b. other companies belonging to the same consolidation group;c. executive management and Supervisory Board;d. close relatives of the persons mentioned previously and the companies related to
them.
Management Board members of the creditinstitution, head of internal audit and their
_____________________________________
related parties, also companies controlled EEK ths. EEK ths. EUR ths. EUR ths
jointly of privately by these persons: 31.12.09 31.12.08 31.12.09 31.12.08
Loans:Balance of loans at beginning of period 1,431 1,709 91 109Disbursed loans 38 655 2 42Repaid loans -744 -933 -48 -60Balance of loans at end of period 725 1,431 46 91Interest receivable 1 6 0 0
Deposits 941 1,342 60 86Interest payable 1 2 0 0
Interest income 48 135 3 9Interests paid 29 22 2 1
P u m r r

Note 28 continued:
Fees and commission income
Salaries of the members of the ManagementBoard
Shareholders of the credit institution and theirrelated parties, also companies controllediointlv of Drivatelv by these Dersons:
EEKths. EEKths. EURths. EURths.
2009 2008 2009 20087 15 0 1
4,986 4,934 319 315
EEKths. EEKths. EURths. EURths,
31.12.09 31.12.08 31.12.09 31.12.08
Compensation to the members of the SupervisoryBoard 1,054 2,078 67 133
Parent company of the Bank:Marfin Popular Bank Public Company Ltd.
Credit institutions’ deposits with the BankInterest receivableInterest payable
Off-balance sheet claimsOff-balance sheet commitments
EEKths. EEKths. EURths. EURths.
31.12.09 31.12.08 31.12.09 31.1 2.08
46
Loans:Balance of loans at beginning of period 11,161 11,661 713 745Disbursed loans 380 0 24 0Repaid loans -485 -500 -31 -32Balance of loans at end of period 11,056 11,161 707 713Interest receivable 16 16 1 1
Deposits 3,790 4,563 242 292Interest payable 10 135 1 9Prepayments for services 189 189 12 12
Interest income 558 579 36 37Interests paid 176 132 11 8Fees and commission income 49 88 3 6Fees and commission expense 20 36 1 2Administrative and other operating expenses 3,860 3,457 247 221
Interest incomeInterest expenseFees and commission incomeTrading incomeAdministrative and other operating expenses
162 250,519 10 16,0110 715 0 46
13 564 1 36
507 285 32 182,728 2,875 174 184
21 21 1 10 57 0 40 18 0 1
8,428 22,590 539 1,4448,428 22,590 539 1,444
::.,

Note 28 continued:
Consolidation group companies of the parentcompany:Marfin Egnatia Bank S.A., Marlin Investment EEKths. EEKths. EURths. EURths.
Group Holdings Societe Anonyme 31.12O9 3t12.08 3t12.09 31.12O8
Credit institutions’ deposits with the Bank 125,176 4 8,000 0
Subordinated debt 62,586 0 4,000 0Interest payable 493 0 32 0
Interest income 0 5 0 0Interest expense 3,150 8,674 201 554Fees and commission income I 1 0 0
Loans to related parties have no loan loss allowances.
47 cpv/dae .9 QJO________._.
rs, 1fls. rr
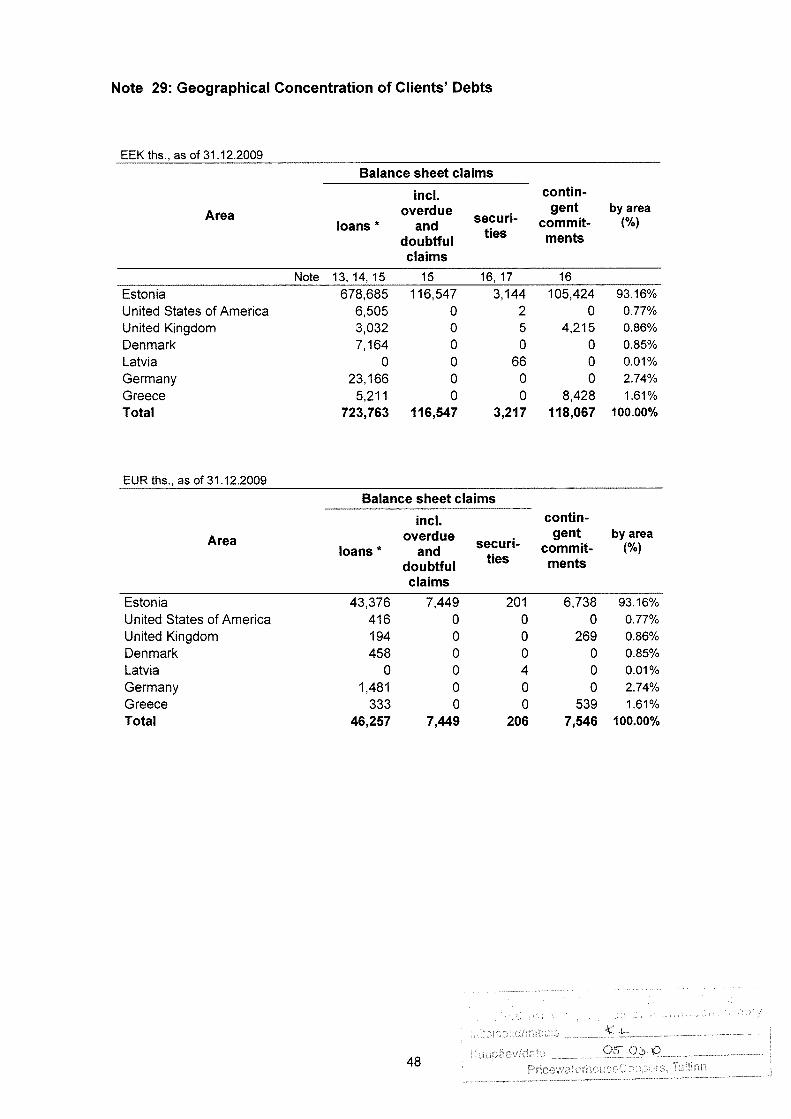
Note 29: Geographical Concentration of Clients’ Debts
dIn
48Frc.ea.te [ie)Df:
EEK ths., as of 31.122009
Balance sheet claims
mci. contin
Area overdue securi-gent by area
loans * and commit- (%)ties mentsdoubtful
claims
Note 13,14,15 15 16,17 16Estonia 678,685 116,547 3,144 105,424 93.16%United States of America 6,505 0 2 0 0.77%United Kingdom 3,032 0 5 4,215 0.86%Denmark 7,164 0 0 0 0.85%Latvia 0 0 66 0 0.01%Germany 23,166 0 0 0 2.74%Greece 5,211 0 0 8,428 1.61%Total 723,763 116,547 3,217 118,067 100.00%
EUR ths., as of 31 .12.2009
Balance sheet claims
mci. contin
Area overdue securi-gent by area
loans * and commit- (%)ties mentsdoubtful
claims
Estonia 43,376 7,449 201 6,738 93.16%United States of America 416 0 0 0 0.77%United Kingdom 194 0 0 269 0.86%Denmark 458 0 0 0 0.85%Latvia 0 0 4 0 0.01%Germany 1,481 0 0 0 2.74%Greece 333 0 0 539 1.61%Total 46,257 7,449 206 7,546 100.00%

Note 29 continued:
EEKths., as of 31.12.2008Balance sheet claims
md. contin
Area overdue securi-gent by area
loans * and commit- (%)ties mentsdoubtful
claimsNote 13, 14, Note 16,Note 15 Note 1615 17
Estonia 781,112 51,070 19,197 9,203 91.62%United States of America 10,856 0 1 0 1.23%United Kingdom 3,386 0 92 31,992 4.01%Denmark 1,310 0 0 0 0.15%Latvia 0 0 42 0 0.00%Germany 93 0 0 0 0.01%Greece 3,672 0 0 22,590 2.97%Total 800,429 51,070 19,332 63,785 100.00%
EUR ths., as of 31.12.2008Balance sheet claims
md. contin
Area overdue securi-gent by area
loans * and commit- (%)ties mentsdoubtful
claims
Estonia 49,922 3,264 1,227 588 91 .62%United States of America 694 0 0 0 1.23%United Kingdom 216 0 6 2,045 4.01%Denmark 84 0 0 0 0.15%Latvia 0 0 3 0 0.00%Germany 6 0 0 0 0.01%Greece 235 0 0 1,444 2.97%Total 51,157 3,264 1,236 4,077 100.00%
* Includes claims on credit institutions and financial institutions.
49 Q5Q3O

Note 30: Concentration of Clients’ Debts by Economic Sector
EEKths., as of 31.12.2009Balance sheet claims
md. continby
Economic sector overduesecuri-
gent sectorloans * and commit- (%)ties
doubtful ments
claims
Note 13, 14, 15 15 16, 17 16Agriculture, forestry and fishing 17,747 11,285 0 0 3.02%Manufacturing 12,460 76 37 0 1.31%Electricity, gas, steam and air conditioning 4,364 0 40 0 0.46%supplyConstruction 16,144 19,747 0 0 3.73%Wholesale and retail trade 17,400 5,798 41 18,064 4.30%Transportation and storage 10,308 87 0 43,363 5.59%Accommodation and food service activities 2,121 0 0 0 0.22%Information and communication 1,302 0 67 0 0.14%Financial and insurance activities 185,209 0 1,939 56,103 25.30%Real estate activities 324,861 63,660 1,039 0 40.51%Professional, scientific and technical 321 0 0 0 0.03%activitiesAdministrative and support service activities 864 0 0 0 0.09%Human health and social work activities 4,1 10 0 0 0 0.43%Arts, entertainment and recreation 2,562 0 0 0 0.27%Other service activities 46,254 10,872 54 0 5.95%Private persons 77,736 5,022 0 537 8.66%Total 723,763 116,547 3,217 118,067 100.00%
EUR ths., as of 31.12.2009Balance sheet claims
md. continby
Economic sector overduesecuri-
gent sectorloans * and commit
ties mentsdoubtfulclaims
Agriculture, forestry and fishing 1,134 721 0 0 3.02%Manufacturing 796 5 2 0 1.31%Electricity, gas, steam and air conditioning 279 0 3 0 0.46%
Construction 1,032 1,262 0 0 3.73%Wholesale and retail trade 1,112 371 3 1,155 4.30%Transportation and storage 659 6 0 2,771 5.59%Accommodation and food service activities 136 0 0 0 0.22%Information and communication 83 0 4 0 0.14%Financial and insurance activities 11,837 0 124 3,586 25.30%Real estate activities 20,762 4,069 66 0 40.51%Professional, scientific and technical
21 0 0 0 0 03°!activities .
0
Administrative and support service activities 55 0 0 0 0.09%Human health and social work activities 263 0 0 0 0.43%Arts, entertainment and recreation 164 0 0 0 0.27%Other service activities 2,956 695 3 0 5.95%Private persons 4,968 321 0 34 8.66%Total 46,257 7,449 206 7,546 100.00%
50
•••

51
c.v/d
Note 30 continued:EEKths., as of 31 12.2008
Balance sheet claims
mci. continby
Economic sector overdue securi-gent sector
loans * and commit- (%)tiesdoubtful mentsclaims
Note 13, 14, 15 15 16, 17 16Agriculture, forestry and fishing 16,637 31 1 0 0 1.81%Manufacturing 20,762 10,206 772 0 3.39%
Water supply; sewerage, waste management 0 0 36 0 0.00%and remediation activitiesConstruction 38,739 6,623 1,091 0 4.97%Wholesale and retail trade 30,067 1,315 0 9,203 4.34%Transportation and storage 8,118 0 0 0 0.87%Accommodation and food service activities 12,605 5,381 14,980 0 3.52%Information and communication 0 0 42 0 0.00%Financial and insurance activities 208,022 0 1,801 54,582 28.27%Real estate activities 351,721 23,430 1,229 0 40,24%Professional, scientific and technical 372 0 0 0 0.04%activitiesAdministrative and support service activities 5,266 0 0 0 0.56%Human health and social work activities 7,130 6 0 0 0.76%Arts, entertainment and recreation 247 0 0 0 0.03%Otherserviceactivities 24,919 108 96 0 2.69%Private persons 75,824 3,691 0 0 8.50%Total 800,429 51,070 20,047 63,785 100.00%
EUR ths., as of 31 .12.2008
Balance sheet claimsmci. contin
byEconomic sector overdue securi-
gent sectorloans * and commit- (%)ties
doubtful mentsclaims
Agriculture, forestry and fishing 1,063 20 0 0 1.81%Manufacturing 1,327 652 49 0 3.39%Water supply; sewerage, waste management 0 0 2 0 0 00°!and remediation activities .
Construction 2,476 423 70 0 4.97%Wholesale and retail trade 1,922 84 0 588 4.34%Transportation and storage 519 0 0 0 0.87%Accommodation and food service activities 806 344 957 0 3.52%Information and communication 0 0 3 0 0.00%Financial and insurance activities 13,295 0 1 15 3,488 28.27%Real estate activities 22,479 1,497 79 0 40.24%Professknal, scientific and technical 24 0 0 0 0.04%
Administrative and support service activities 337 0 0 0 0.56%Human health and social work activities 456 0 0 0 0.76%Arts, entertainment and recreation 16 0 0 0 0.03%Other service activities 1,593 7 6 0 2.69%Private persons 4,846 236 0 0 8.50%Total 51,157 3,264 1,281 4,077 100.00%
* Includes claims on credit institutions and financial institutions.

Note 31: Contingent Liabilities
EEK ths.
31.12.2009EUR ths.
Liabilities Liabilities
Irrevocable transactions 2,010 128Guarantees and similar irrevocable transactions 275 18Unused partof creditlines and overdraft limits 1,735 111
31.12.2008EEK ths. EUR ths.
Liabilities Liabilities
Irrevocable transactionsGuarantees and similar irrevocable transactionsUnused part of credit lines and overdraft limits
52 _._...__.
fli
19,22717,1912,036
1,2291,099
130

Note 32: Liquidity (Assets and Liabilities by Remaining Maturities)
EEK ths., as of 3112.2009
Claims, liabilities
Claims of the BankCash and claims tobanksClaims to customersSecuritiesOther claims
On Over- Up to 1 Ito 3 3 to 12 ito 2 2 to 5 Over 5 Totaldemand due month months months years years years
175,760 53,714 59,921 54,909 62,003 103,979 184,633 39,269 734,188
0 0 0 0 0 0 170,726
3,032 52,675 59,822 54,909 60,482 103,979 183,959 39,269 558,1271,405 1,039 99 0 0 0 674 0 3,217
597 0 0 0 1,521 0 0 0 2,118
Liabilities of theBankAmounts owed tobanksAmounts owed toclientsSubordinated debt
97,548
0 140,881
558 63,018 636,308
0 0 0 0 141,043
546 0 425,737
0 0 0 63,018 63,018390 12 0 1,158
0 0 0 5,352
Net
Contingent:
73,901 53,714 -181,811 5,614 -103,651 89,787 184,075 -23,749 97,880
0 0 8,428100 1,857 8,481
0 0 118,0670 0 120,077
11,233 3,433 3,830 3,509
0
Other claims 38 0
Liabilities of theBankAmounts owed tobanksAmounts owed toclientsSubordinated debt
Net 4,723 3,433 -11,620
3,963 6,645 11,800 2,510 46,923
0 0 0 0 10,911
359 -6,625 5,738 11,765 -1,518 6,256
Contingent:assetsliabilities
0 0 7,0070 0 7,007
0 539119 542
0 0 7,5460 0 7,674
.•,/., OO\O.
170,726 0
101,859
162
0 241,732 49,295 165,654 14,192
Other borrowingsOther liabilities
0
0 99,638 48,777 165,426 13,802
0 0 0 00
4,1490 100 1,203
5180
2280
assetsliabilities
0 0 109,6390 0 109,639
EUR ths., as of 31 .12.2009
On Over- Up to I I to 3 3 to 12 1 to 2 2 to 5 Over 5 TotalClaims, liabilitiesdemand due month months months years years years
Claims of the BankCash and claims tobanksClaims to customersSecurities
10,911
194 3,36790 66
0 0
3,823 3,5096 0
3,866 6,645 11,757 2,510 35,6710 0 43 0 206
0 0 97 0 0 0 135
10,587 907
Other borrowingsOther liabilities
6,510 0 15,449 3,151
10 0 9,004 0
6,234 0 6,368 3,117
0 0 0 00 0 1 33
265 0 77 0
36 4,028 40,667
10,573
0 0 0 0 9,014
882 35 0 27,210
0 0 0 4,028 4,02815 25 1 0 74
0 0 0 0 342
06
Total claims to customers differs from the balance sheet amount by EEK 3,014 ths, which isthe total of effective interest rate adjustment.
53

Note 32 continued:
Liabilities of the4,103Bank
Amounts owed to 11 0 17,023banks
EEK ths., as of 31.122008
On Over- Up to I I to 3 3 to 12 1 to 2 2 to 5 Over 5 TotalClaims, liabilitiesdemand due month months months years years years
Claims of the Bank 165,796 51,288 51,598 27,587 94,815 140,216 249,148 43,453 823,901Cash and claims to 162,048 0 0 0 0 0 0 0 162,048banksClaims to customers 3,386 51,070 51,150 27,587 90,070 140,216 234,168 42,460 640,107Securities 199 218 92 0 2,850 0 14,980 993 19,332Other claims 163 0 356 0 1,895 0 0 0 2,414
Liabilities of the 64,193 0 375,755 31,799 155,933 8,764 9,024 0 645,468BankAmounts owed to 174 0 266,345 0 0 0 0 0 266,519banksAmounts owed to 43,408 0 108,451 31,799 155,585 8,764 9,024 0 357,031clientsOther liabilities 20,611 0 959 0 348 0 0 0 21,918
Net 101,603 51,288 -324,157 -4,212 -61,118 131,452 240,124 43,453 178,433
Contingent:assets 0 0 41,195 0 14,162 0 8,428 0 63,785liabilities 0 0 41,307 17,091 15,407 0 9,219 0 83,024
EUR ths., as of 31.12.2008
On Over- Up to 1 1 to 3 3 to 12 1 to 2 2 to 5 Over 5 TotalClaims, liabilitiesdemand due month months months years years years
10,596 3,278 3,298 1,763 6,060 8,961 15,923 2,777 52,657Claims of the BankCash and claims tobanksClaims to customersSecuritiesOther claims
Amounts owed toclientsOther liabilities 1,317
10,357 0 0 0 0 0 0 0 10,357
216 3,264 3,269 1,763 5,757 8,961 14,966 2,714 40,91013 14 6 0 182 0 957 63 1,23610 0 23 0 121 0 0 0 154
0 24,015 2,032 9,966 560 577 0 41,253
0 0 0 0 0 17,034
2,774 0 6,931 2,032 9,944 560 577 0 22,818
0 61 0 22 0 0 0 1,401
1,317 0 61 0 22 0 0 0 1,401
0 0 2,633 0 905 0 539 0 4,0770 0 2,640 1,092 985 0 589 0 5,306
Net
Contingent:assetsliabilities
54
L
‘V/ t o

Note 33: Loss Per Share
MARFIN PANK EESTI AS has not issued convertible securities.
Note 34: Operating Lease Liabilities
Rental payments for vehicles
MARFIN PANK EESTI AS has concluded operating lease agreements for five vehicles as of31.12.2009. Longest contract ends on 03.06.2014, i.e. no agreement exceeds 5 years.
Rental payments for vehicles by due dates
Rental payment paid and expensed duringreporting yearRental payments payable:until 1 year1 to 5 years
Rental payments for bank premises
EEK ths. EEK ths. EUR ths. EUR ths.
2009 2008 2009 2008
484 482 31 31
219 417 14 27296 575 19 37
MARFIN PANK EESTI AS has concluded agreements for renting bank premises in Tallinn,Tartu, JOhvi and Prnu. Longest rent agreement ends on 02.06.20 18.
Rental payments for bank premises by due dates
Rental payment paid and expensed duringreporting yearRental payments payable:until 1 year1 to 5 yearsover 5 years
EEK ths. EEK ths. EUR ths. EUR ths.
2009 2008 2009 2008
Agreements for renting bank premises can be terminated before the prescribed time uponagreement in three months notice time.
55
EEK ths. EEK ths. EUR ths. EUR ths.
2009 2008 2009 2008
Net loss for the reporting period -84,388 12,370 -5,393 -791Weighted average no. of shares (ths. pcs.) 20,050 20,050 20,050 20,050Basic loss per share -4.21 -0.62 -0.27 -0.04Diluted loss per share -4.21 -0.62 -0.27 -0.04
4,624 4,442 296
4,785 4,64015,713 19,334
752 1,045
284
2971,236
67
3061,004
48
Note 35: Risk and Capital Management
Risk Management
MARKET RISK
Interest rate riskThe Bank’s general strategy is to minimise exposure to the interest rate risk primarily bykeeping similar interest rate sensitivity of its assets and liabilities. Interest rate risksensitivity is analysed by measuring the sensitivity of claims and liabilities with interest raterepricing taking place within a year to +200 basis points parallel shift of all interest curves,and its affect on profits. Assets’ and liabilities’ interest sensitivity gaps periodised by interestrepricing and grouped by period form a basis for analysis. Affect is annualised by weightinginterest sensitivity gaps by average length of respective period until year-end. Additionally,the effect of cumulative current year interest sensitivity gap is assessed on next year’sprofit. See interest positions and sensitivity analysis in Note 37.
Foreign currency riskThe Bank maintains minimum positions in foreign currencies necessary to provide servicesto the customers and wishing to keep a low risk profile. The Bank does not take speculativeforeign currency positions. The Bank’s Management Board has set the limits for maximumopen currency positions. All foreign currency positions are continuously monitored andmarked to market. Open foreign currency positions are mainly hedged with swaps andforwards.
Open Currency PositionsThe short and long net positions of each currency are converted to Estonian kroons usingthe rate of last banking day issued by the Bank of Estonia. Open positions betweenEstonian kroon and euro are unlimited, as the currencies are pegged. Total open netcurrency position against EEK is limited intraday by 3.1 million kroons (0.2 million euros)and overnight FX position by 2.3 million kroons (0.15 million euros). See FX positions andsensitivity analysis in Note 36.
Other price riskOther price risk of market risks rises from placing Bank’s assets to instruments sensitive tomarket risk on the purpose of trading or investment. Market risk emerges from generalmarket conditions unfavourable to the bank, or from decline in the financial position ofissuers whose securities are in the trading portfolio. Personnel of the money and capitalmarkets’ division makes decisions on positions within the limits established by theManagement Board.
LIQUIDITY RISKThe main objective of the Bank’s liquidity management is to match the maturities of assetsand liabilities as much as possible, and not to depend too much on short-term financing.The daily management of the Bank’s liquidity is the responsibility of the money and capitalmarket division. The Bank keeps its liquid assets in the correspondent account at the Bankof Estonia, in other Estonian banks, in foreign banks and in marketable securities. Limits fordeposits in other banks and securities are set by the Management Board and are subject toregular reviews. The division is responsible for monitoring the Bank’s daily liquidity and forinforming the Management Board. Bank has sufficient liquidity buffer through money marketlimits allocated by banks within the group and Estonian credit institutions. See liquiditypositions in Note 32.
CREDIT RISKThe Bank’s credit risk profile is rather characterised by low risk but stable interest incomethan high risk and higher interest income. Most decisions related to loans, guarantees and
56
.—
.
c..

sureties are made by the credit committee (except small limit decisions, made by theDirector of Retail and Corporate Banking). According to the Estonian Credit Institutions Act,the Supervisory Board establishes the competence and limits of credit committee in makingdecisions. In circumstances where the customer liabilities to the Bank exceed the authorityof the credit committee due to its potential impact on Bank’s economic standing, thedecision made must also be approved by a member of the Supervisory Board of the groupCredit Committee according to the rules set by the Supervisory Board. All liabilities thatcustomers have to the bank are considered as customer receivables. Loans must becovered by sufficient collaterals. The daily administration and monitoring of the Bank’scredit risk takes place in the loan and customer relationship division, following very detailedprocedures. Procedures cover also analysis of loan projects taking into considerationcreditworthiness of customer, previous credit history, financial condition, market conditionsand other important factors affecting the credit risk. All lending reports are available onlineto the loan and customer relationship division. The loan and customer relationship divisionreports on regular basis to the Management Board about the general credit risk and thefinancial position of the major loan customers. The credit committee reviews loans inarrears weekly, normal loans are reviewed at least yearly. The adequacy and amount ofloan loss allowances are reviewed monthly. Please see Notes 14, 15, 17.Risk ConcentrationRisk concentration is considered high if the liabilities and potential liabilities of one client orrelated parties to the credit institution exceed 10% of the net own funds of the creditinstitution (the maximum limit allowed by the central bank is 25% of net own funds). Thetotal amount of debts with high risk concentration must not exceed 800% of the net ownfunds of the credit institution. Please see Note 39.
OPERATIONAL RISKSBank enhanced further control over business continuity risks in 2009. Procedures, recoveryplans and test plans were modified. The main instrument for minimising operating andpersonnel risk is to follow the segregation of duties in performing banking operations.Operations are divided into front and back-office operations so that one employee cannotsolely execute a whole operation. The Bank’s Management Board is responsible for thepersonnel risk management.It is important in order to reduce information technology risks that BankSyst, the bankinginformation system used, can be independently developed further and modified by theBank’s IT development. Used banking software is also scaleable, allowing to increaseserver capacity, when the volume of information being processed, grows in time. Thebanking system is defended from outside intruders by firewalls. All programs belonging tothe banking system are protected by passwords, which are changed according to internalpolicies set. The banking system is equipped with a system for back-ups.The Management Board has enforced a principle that only collateral in Estonia or countrieswith high ratings are accepted in order to avoid country risk.
As the MARFIN PANK EESTI AS does not have any subsidiaries, the internal controlsystem involves only the control over the Bank’s activities.Internal control system construed in the past to consist of control measures, based ongeneral principles of controls, set by the Supervisory Board. The Management Board haselaborated the control rules, following the abovementioned general principles. The controlmeasures implemented in the Bank’s business processes are regulated by the rules andprocedures approved by the Management Board.The Management Board’s competence involves in addition to the creation of the controlmechanisms, also the implementation and the control over the fulfillment of thosemechanisms.
The internal audit department is responsible for evaluating the current internal controlsystem, the sufficiency and efficiency of the control mechanisms set by the Managementand Supervisory Boards of the Bank and makes recommendations for improvements of the
57 /qut
J/c3t

system and tests its operability. The internal audit department reports to the Managementand Supervisory Board.
The financial data is available online in an information system, which is integrated with thecentral database. The information of the Bank’s activities is stored both electronically andon paper in appropriate registers.
The employees’ access to the information, which is required for fulfilling their tasks, isregulated by the IT access rules. The Management Board is responsible for informing theBank’s employees about the external laws and rules regulating their area of responsibilityas well as the internal policies set by the Bank’s managing bodies.
Capital Management
The Bank implemented ICAAP (internal capital adequacy assessment process, which isintroduced to the banks and investment firms under article 123 of the 20061481EC directive)procedures in year 2008. Financial Supervision Authority has issued guideline“Requirements to the internal capital adequacy assessment process” to Estonian financialinstitutions, in force since 01.01.2008, which is leading the process and has more detailsthan such guidelines in the neighbouring countries. Bank implemented the so-called “Pillar1 +“ method of ICAAP, under which an additional buffer is added to the Pillar 1 regulativecapital requirements for uncovered of insufficiently covered risks. ICAAP includes approvalof capital plan stating current capital need, expected capital need, required level ofcapitalisation and sources of additional capital. See capital risk measures in Note 38.
58

Note 36: Foreign Currency Risk
31.12.2009
Balance sheet position Off-balance sheet position Netlong short long short position
EEK and EUR joint position, EEKths. 704,845 586,332 55,139 73,283 100,369
EEK and EUR joint position, EUR ths. 45,048 37,473 3,524 4,684 6,415
USD position, EEK ths. 19,699 35,866 62,932 46,808 -43
USD position, EUR ths. 1,259 2,292 4,022 2,992 -3
31.12.2008
EEK and EUR Balance sheet position Off-balance sheet position Netjoint position long short long short position
Position, EEKths. 768,908 580,112 41,545 64,164 166,176
Position, EUR ths. 49,142 37,076 2,655 4,101 10,621
The net position of other currencies does not exceed 1% of own funds.
Sensitivity analysis of foreign currency risk
The Bank is minimising its openness to foreign currency risks on a daily basis, followingthe general principles of risk management and approved limits. EEK and EUR netposition has been used in sensitivity analysis, due to Estonian kroon being pegged toeuro since 1999 at a rate of EEK 15.6466: EUR 1. Total open net foreign currencyposition of the Bank comprised 0.5 million kroons i.e. 0.03 million euros as of31.12.2009 (0.2 million kroons i.e. 0.01 million euros as of 31.12.2008). Even asimultanous 5% change in unfavourable direction for all used currencies could causethe Bank only a 24 thousand kroon i.e. 1.5 thousand euro (31.12.2008: 11 thousandkroon i.e. 0.7 thousand euro) additional loss, leading to a conclusion, that the Bank’sopenness to foreign currency risk is insignificant. Used methods and assumptions havenot changed compared with previous period.
59

Note 37: Interest-Bearing Assets and Liabilities by Interest Repricing Period
EEKths., as of 31.12.2009
Overdue Up to 1 1 to 3 3 to 12 1 to 2 2 to 5 TotalClaims, liabilities Notedemand month months months years years
Claims of the Bank 171,662 111,562 125,206 231,056 103,884 49,279 1,300 793,94913,
Claims to banks 14 168,630 0 0 0 0 0 0 168,630Claims to customers 15 3,032 110,523 124,532 231,056 103,884 49,279 1,300 623,606Securities 17 0 1,039 674 0 0 0 0 1,713
Bank’s liabilities 59,709 0 278,869 48,569 226,451 14,448 150 628,196Due to banks 22 162 0 140,819 0 0 0 0 140,981Due to customers 22 57,812 0 138,041 48,051 163,637 14,045 150 421,736Subordinated debt 23 0 0 0 0 62,586 0 0 62,586Other borrowings 24 0 0 9 518 228 403 0 1,158Stand-by loans 31 1,735 0 0 0 0 0 0 1,735
Net 111,953 111,562 -153,663 182,487 -122,567 34,831 1,150 165,753
EUR ths., as of 31.12.2009
OnClaims, liabilities Note Overdue Up to 1 1 to 3 3 to 12 1 to 2 2 to 5 Totaldemand month months months years years
Claims of the Bank 10,971 7,130 8,002 14,767 6,639 3,150 83 50,74313,
Claims to banks 14 10,777 0 0 0 0 0 0 10,777Claims to customers 15 194 7,064 7,959 14,767 6,639 3,150 83 39,856Securities 17 0 66 43 0 0 0 0 109
Bank’s liabilities 3,816 0 17,823 3,104 14,473 923 10 40,149Due to banks 22 10 0 9,000 0 0 0 0 9,010Due to customers 22 3,695 0 8,822 3,071 10,458 898 10 26,954Subordinated debt 23 0 0 0 0 4,000 0 0 4,000Other borrowings 24 0 0 1 33 15 26 0 74Stand-by loans 31 111 0 0 0 0 0 0 111
Net 7,155 7,130 -9,821 11,663 -7,833 2,226 73 10,594
Total claims to customers differs from the balance sheet amount, as the interest-bearingassets include non-performing loan claims, which are disclosed net in the balance sheet.
60

Note 37 continued:
EEKths., as of 31122008
Claims, liabilities Note Overdue Up to 1 1 to 3 3 to 12 1 to 2 2 to 5 OverTotaldemand month months months years years years
Claims of the Bank 163,624 49,654 100,502 266,970 194,915 1,040 71,236 3,370 851,311Clamstobanks 13,14 160,159 0 0 0 0 0 0 0 160,159Claims to customers 15 3,465 49,654 99,119 266,970 192,435 1,040 45,877 3,370 661,930Securities 17 0 0 1,383 0 2,480 0 25,359 0 29,222
Bank’s liabilities 102,529 0 313,715 31,799 155,585 8,764 9,024 0 621,416Duetobanks 22 174 0 265,992 0 0 0 0 0 266,166Due to customers 22 100,319 0 47,723 31,799 155,585 8,764 9,024 0 353,214Stand-by loans 31 2,036 0 0 0 0 0 0 0 2,036
Net 61,095 49,654 -213,213 235,171 39,330 -7,724 62,212 3,370 229,895
EURths., as of 31.12.2008
Claims, liabilities On Overdue Up to 1 1 to 3 3 to 12 1 to 2 2 to 5 OverTotaldemand month months months years years years
Claims of the Bank 10,457 3,173 6,423 17,062 12,457 66 4,553 215 54,409Claims to banks 13,14 10,236 0 0 0 0 0 0 0 10,236Claims to customers 15 221 3,173 6,335 17,062 12,299 66 2,932 215 42,305Securities 17 0 0 88 0 159 0 1,621 0 1,868
Bank’s liabilities 6,553 0 20,050 2,032 9,944 560 577 0 39,716Duetobanks 22 11 0 17,000 0 0 0 0 0 17,011Due to customers 22 6,412 0 3,050 2,032 9,944 560 577 0 22,574Stand-by loans 31 130 0 0 0 0 0 0 0 130
Net 3,905 3,173 -13,627 15,030 2,514 -494 3,976 215 14,693
Sensitivity analysis of interest rate risk
Bank’s cumulative interest rate sensitivity gap, which is the basis for interest rate risk, was 140.8 millionkroons (9.0 million euros) for period up to 3 months and 18.2 million kroons (1.2 million euros) for periodup to 12 months as of 31.12.2009. The effect of time-weighted +200 basis points interest curve shift forthe Bank’s profit was +680 thousand kroons (+43 thousand euros) i.e. 2.0% of the 2009 net interestincome of the bank and 0.7% of equity. The effect of time-weighted -200 basis points interest curve shiftwould be -680 thousand kroons (-43 thousand euros). Used methods and assumptions have not changedcompared with previous period.
L. ..
I I

Note 38: Capital Adequacy
Share capital paid-inOther reservesAccumulated deficit of the previous yearsIntangible assetsNet loss of the periodTotal tier I own fundsSubordinated debtAvailable-for-sale financial instrumentsTier 2 own funds, which exceed the limitsSecond level equityMinimum own fundsTier 1 own funds after deductionsTier 2 own funds after deductionsOwn funds for capital adequacy calculationsCredit institutions and investment companies under standardmethodCompanies under standard methodMass claims under standard methodClaims backed by mortgages under standard methodOverdue claims under standard methodOther assets under standard methodTotal capital requirement for credit risk and counterpartycredit riskOperational risk base methodTotal capital requirement for operational riskCapital requirements for adequacy calculationsCapital adequacy
EEK ths. EUR ths. EEK ths. EUR ths.
31 Il 2109 31I1 2109 31112108 3111 2I08
200,500 12,814 200,500 12,814559 36 559 36
-13,723 -877 -1,353 -86-621 -40 -931 -60
-84,388 -5,393 -12,370 -791102,327 6,540 186,405 11,91362,586 4,000 0 0
0 0 -1,601 -102-11,423 -730 0 051,163 3,270 0 0
153,490 9,810 184,804 11,811102,327 6,540 186,405 11,91351,163 3,270 -1,601 -102
153,490 9,810 186,405 11,913
1,371 88 3,308 211
15,067 963 15,714 1,00416,635 1,063 29,959 1,9152,789 178 3,203 205
19,266 1,231 4,852 310941 60 851 54
56,069 3,583 57,888 3,700
5,797 370 4,116 2635,797 370 4,116 263
61,866 3,954 62,004 3,96324.81% 24.81% 30.06% 30.06%
Minimum capital adequacy ratio, as required by the Bank of Estonia, is 10%.
New capital adequacy calculation directive Basel II is in force from 01.01.2008. Bank uses standardmethod for calculating capital requirements for credit risk and base method for calculating capitalrequirement for operational risk. Estonian Financial Supervisory Authority has made an exemptionfreeing the Bank from capital requirement to cover trading portfolio risks as per Credit Institutions Act§ 79 clause 2 sub-clauses 2 and 3 from 01.01.2008.
62 .

Not
e38
conti
nu
ed:
Cre
dit
risk
and
counte
rpar
tycr
edit
risk
rep
ort
foll
owin
gth
est
and
ard
met
hod
EE
Kth
s.,
asof
31.1
2.20
09
_________________________________________
______
_________________________
Bal
ance
sheet
Coll
ater
als
0ff
-bal
ance
sheet
Initi
alva
lue_
(gro
ss)
Allo
wan
ces
and
corr
ecti
ons
(-)
__
_________
__
__
__
__
____________
__
__
__
__
__
__
__
__
__
__
__
__
__
__
__
Fina
ncia
lD
ebt
Eff
ectiv
eD
ebt
Ris
k-L
oan
coll
ater
als
Loa
nFi
nanc
ial
Hyb
rid
Ris
kad
just
edC
laim
sL
oans
secu
riti
esin
tere
stra
tese
curi
tyD
eriv
ativ
esan
dsh
ares
corr
ectio
npr
ovis
ions
sim
ple
limits
guar
ante
essw
aps
wei
ght
amou
ntpr
ovis
ions
met
hod
Centr
al
go
vern
ment
and
centr
al
ban
ks
107,5
93
00
00
00
00
00
0
Irat
ecr
edit
qual
ity10
7,59
30
Cre
dit
inst
ituti
on
san
din
vest
ment
firm
s6
4,0
89
01,
000
00
00
00
534
1,42
1—
13
,70
9
Irat
ecr
edit
qual
ity
64,0
89
534
1,4
21
20%
13,2
09
IIra
tecr
edit
qual
ity
1,0
00
50
%500
Co
mp
an
ies
78
163,6
40
23
,89
9-2
,444
-13,4
56
-21
,98
10
02
75
657
C1
50
,66
8
Illan
dIV
rate
cred
itqu
ality
781
63
,64
02
3,8
99
-2,4
44
-13,4
56
-21,9
81
27
5657
10
0%
150,6
68
Reta
ilcla
ims
0230,0
98
0-5
70
-3,4
580
-4,7
40
00
50
166,0
01
Cla
ims
upto
EU
R1
mio
230,
098
-570
-3,4
58-4
,740
575
3’o
166,
001
Cla
ims
wit
hre
al
est
ate
coll
ate
rals
03
6,9
63
00
00
00
00
027,8
94
Cla
ims
fully
cover
edw
iht
real
esta
te:
0
Cla
ims,
fully
cove
red
bym
ortg
age
tore
side
ntia
lre
ales
tate
,co
vere
dcl
aim
sup
to70
%of
the
real
esta
teco
llat
eral
valu
e13
,952
35%
4,88
3
Cla
ims,
fully
cove
red
bym
ortg
age
tore
side
ntia
lre
ales
tate
,co
vere
dcl
aim
sov
er70
%of
the
real
esta
teco
llat
eral
valu
e23
,011
100%
23,0
11
Cla
ims
Inarr
ears
0208,9
74
00
-67,7
44
00
00
00
19
2,6
65
Illan
dIV
rate
cred
itqu
alit
y10
5,84
5-6
7,4
84
100%
38,3
61
Van
dV
Ira
tecr
edit
qual
ity
103,
129
-260
150%
154,
304
Oth
erass
ets
11,4
290
960
0-4
20
1,73
50
00—
9,75
4
Cas
h2,
076
0%0
Pro
pert
yan
deq
uipm
ent
7,23
510
0%7,
235
Pre
paym
ents
and
prep
aid
exp
ense
s2,
118
100%
2,11
8
Inve
stm
ents
tosh
ares
ofot
her
com
pani
es,
not
ded
uct
edfr
omow
nfu
nds
96-4
210
0%54
Loa
nlim
itsan
dov
erdr
aft
limits
with
cont
ract
ual
mat
urit
yup
to1
yea
r(c
anno
tbe
term
inat
edby
one
1,73
520
%34
7
Tota
l183,1
89
63
9,6
75
24,9
95
-3,0
14-8
4,6
58
-22,
023
-4,7
401,
735
275
1,19
61,
421
TO
TA
LR
ISK
-WE
IGH
TE
DA
SS
ET
S56
0,69
1

Not
e38
cont
inue
d:C
redi
tri
skan
dco
un
terp
arty
cred
itri
skre
port
foll
owin
gth
est
and
ard
met
hod
EU
Rth
s.,
asof
31.1
2.20
09
______
__
__
__
__
__
__
__
__
__
_
Bal
ance
shee
tC
olla
tera
lsO
ff-b
alan
cesh
eet
Initi
alva
lue_
(grn
ss)
Allo
wan
ces
and
corr
ectio
ns(-)
___
__
__
__
________
__________
________
Fina
ncia
lD
ebt
Effe
ctiv
eD
ebt
Ris
k-Lo
anco
llate
rals
Loan
Fina
ncia
lH
ybrid
Ris
kC
laim
sL
oans
secu
ritie
sin
tere
stra
tese
curi
tyD
eriv
ativ
esad
just
edan
dsh
ares
corr
ectio
npr
ovis
ions
sim
ple
limits
guar
ante
essw
aps
wei
ght
amou
ntpr
ovis
ions
met
hod
Cen
tral
gover
nm
ent
and
centr
alb
ank
s6,
876
00
00
00
00
00
Irat
ecr
edit
qual
ity6,
876
....2
2L0
Cre
dit
Inst
itu
tio
ns
and
Inves
tmen
tfi
rms
4,09
60
640
00
00
034
9187
6
Irat
ecr
edit
qual
ity4,
096
3491
20%
844
IIra
tecr
edit
qual
ity64
50%
32
Co
mp
anie
s5
10,4
591,
527
-156
-860
-1,4
050
018
420
9,62
9
IIIan
dIV
rate
cred
itqu
ality
510
,459
1,52
7-1
56-8
60-1
,405
1842
100%
9,62
9
Ret
ail
clai
ms
014
,706
0-3
6-2
210
-303
00
00
10,6
09
Cla
ims
upto
EU
R1
mio
14,7
06-3
6-2
21-3
035
75%
10,6
09
Cla
ims
wit
hre
ales
tate
coll
ater
als
02,
362
00
00
00
00
01,
783
Cla
ims
fully
cove
red
wih
tre
ales
tate
:0
Cla
ims,
fully
cove
red
bym
ortg
age
tore
side
ntia
lre
ales
tate
,co
vere
dcl
aim
sup
to70
%of
the
real
esta
teco
llat
eral
valu
e89
235
%31
2
Cla
ims,
fully
cove
red
bym
ortg
age
tore
side
ntia
lre
ales
tate
,co
vere
dcl
aim
sov
er70
%of
the
real
esta
teco
llat
eral
valu
e1,
471
100%
1,47
1
Cla
ims
inar
rear
s0
13,3
560
0-4
,330
00
00
0I
12,3
14
Illan
dIV
rate
cred
itqu
ality
6,76
5-4
,313
100%
2,45
2
Van
dV
Ira
tecr
edit
qual
ity6,
591
-17
150%
9,86
2
Oth
erass
ets
730
06
00
30
111
00
0—
623
Cas
h13
30%
0
Pro
pert
yan
deq
uipm
ent
462
192!
o46
2
Pre
paym
ents
and
prep
aid
expen
ses
135
100%
135
Inve
stm
ents
tosh
ares
ofot
her
com
pani
es,
not
dedu
cted
from
own
fund
s6
-310
0%3
oan
limits
and
over
draf
tlim
itsw
ithco
ntra
ctua
lm
atur
ity
upto
1ye
ar(c
anno
tbe
term
inat
edby
one
part
y)11
120
%22
Tot
al11
,708
40,8
831,
597
-193
-5,4
11-1
,408
-303
111
1876
91
TO
TA
LR
ISK
-WE
IGH
TE
DA
SS
ET
S35
,835
64-‘---
LH
iC

Note 38 continued: Information Disclosed on Capital Adequacy
Bank is following the principles set by the Estonian Credit Institutions Act and Bank of EstoniaGovernor’s decree ,,Procedure for application and calculation of prudential ratios of credit institutionsand consolidation groups of credit institutions” in establishing and calculating own funds, as well asdeductions and limits from own funds.
All balance sheet and off-balance sheet risk positions are divided between classes of risk exposuresstipulated in the Credit Institutions Act, to calculate risk-weighted assets followed by a division tosteps of credit quality in order to establish risk weights. Bank uses rating agency Moody’s InvestorsService’s external credit quality assessments in determining capital requirements as per creditquality steps as defined by Financial Supervisory Authority. If there is no foreign rating, the riskweight is assigned following the credit risk standard method principles as stipulated in Bank ofEstonia Governor’s decree ,,Procedure for application and calculation of prudential ratios of creditinstitutions and consolidation groups of credit institutions”.
Bank considers the following direct funded credit protection facilities in calculation of the credit riskcapital requirement, with the prior assessment each time that they are in compliance with therequirements for recognising financial collaterals as set by Bank of Estonia Governor’s decree,,Procedure for application and calculation of prudential ratios of credit institutions and consolidationgroups of credit institutions”: 1) On-balance sheet netting — recognised by agreement as an eachtime decision; 2) Financial collaterals — recognised depending on the type of underlying asset.Bank accepts as financial collateral: 1) cash on deposit with, or cash assimilated instruments held bythe Bank; 2) shares and convertible debt instruments listed in a main list on a recognised stockexchange and debt instruments meeting the requirements stipulated in Bank of Estonia Governor’sdecree ,,Procedure for application and calculation of prudential ratios of credit institutions andconsolidation groups of credit institutions”. Bank includes only such financial collaterals in thecalculation of the credit risk capital requirement, the remaining maturity of which is at least equal tothe remaining maturity of the secured risk position. Bank uses the financial collateral simple method,calculating the effect by assigning the value equal to the fair value of financial collateral.
Bank considers the following unfunded credit protection facilities in calculation of the credit riskcapital requirement, with the prior assessment each time that they are in compliance with therequirements for recognising unfunded credit protection facilities and credit derivatives as set byBank of Estonia Governor’s decree ,,Procedure for application and calculation of prudential ratios ofcredit institutions and consolidation groups of credit institutions”: 1) Unfunded credit protectiontransactions - recognised by agreement as an each time decision or by protection provider, when thecredit risk protection is provided by each time standard agreement; 2) Credit derivatives —
recognised by transaction as an each time decision.Bank applies the procedure, as set by Bank of Estonia Governor’s decree ,,Procedure for applicationand calculation of prudential ratios of credit institutions and consolidation groups of creditinstitutions”, in calculating the effects of unfunded credit protection using credit risk standard method.
Credit risk protection transactions applied as of 31.12.2009 were all financial collaterals of cashdeposited with the Bank. Bank has not used unfunded credit protection facilities nor credit derivativesas of 31.12.2009.
Bank applies the principles set by Bank of Estonia Governor’s decree ,,Procedure for application andcalculation of prudential ratios of credit institutions and consolidation groups of credit institutions” forcalculation of risk-weighted exposure amounts for securitised exposures: ,,Calculating risk-weightedexposure amounts for securitisation positions under the Standardised Approach”.
Bank had no securitised exposures as of 31.12.2009.
Bank has an exemption, as per Credit Institutions Act § 79 clause 3, from calculating separate capitalrequirement to cover interest position and stock position risk, settlement delivery risk andcounterparty risk associated with the trading portfolio. Bank applies credit risk standard method incalculating capital requirements on instruments and counterparty credit risk associated with thetrading portfolio.
Equity investments acquired under strategic purposes to the bank portfolio are classified by eachtime decision of the Management Board of the Bank.
65
u;ev!dat,,. . ,,.

Note 39: Concentration of Risks
31.12.2009EEK EUR %ofnet
flO ths. ths. own fundsNumber of customers (client groups) with high risk 16concentration
Due from customers with high risk concentration 316,838 20,250 206.42%
Due from persons related with credit institution 8,572 548 5.58%
31.12.2008EEK EUR %ofnetflO ths. ths. own funds
Number of customers (client groups) with high riskconcentration 13
Due from customers with high risk concentration
Due from persons related with credit institution
Note 40: Fair Value
354,910 22,683 194.10%
523
The Bank estimates that the fair values of the assets and liabilities recognised in thebalance sheet at amortised cost do not differ significantly from their carrying values as at31.12.2009 and 31.12.2008. Management has assessed the effective interest rates for allfinancial assets and liabilities denominated in the balance sheet at amortised costcompared it to the market rates effective on the balance sheet date and concluded thatthere is no significant difference between effective rates used for financial assets andliabilities and market rates at the balance sheet date.
• Loans to customers are sufficiently short term and issued on market terms or theinterest terms have been revised recently to match the market terms, as a result ofwhich the fair market interest rate and respectively the fair value of the loan has notchanged significantly during the loan term.
• Deposits and structured deposits are also of short remaining maturity and thereforethe fair value does not change significantly during the deposit term.
The liquidity information of loans to customers and receivables from other banks is as follows:
Cash and claims tobanksClaims to customers
o o 0 0 0 0 0 10,911
194 3,798 2,917 3,563 3,940 6,800 11,735 2,532 35,478
66L
/ oc)c
8,181 4.47%
EEK ths., as of 31.12.2009
On Over- Up to 1 1 to 3 3 to 12 1 to 2 2 to 5 Over 5Claims, liabilities Totaldemand due month months months years years years
Cash and claims to170,726 0 0 0 0 0 0 0 170,726banks
Claims to customers 3,032 59,420 45,636 55,743 61,645 106,404 183,616 39,617 555,113
EUR ths., as of 31 .12.2009
On Over- Up to 1 1 to 3 3 to 12 1 to 2 2 to 5 Over 5Claims, liabilities Totaldemand due month months months years years years
10,911

Note 40 continued:
Assets and liabilities measured at fair value
Financial assets at fair value trough profit and lossFinancial assets held for trading
Shares and fund unitsDerivative instruments
Available for sale financial assets at fair valueDebt securitiesShares and fund units
Total assets
Financial liabilities at fair value trough profit and lossDerivative instruments
Total liabilities
Financial assets at fair value trough profit and lossFinancial assets held for trading
Equity securitiesDerivative financial instruments
Financial assets designated at fair valueDebt securitiesEquity securities
Total assets
Financial liabilities at fair value trough profit and lossDerivative financial instruments
Total liabilities
Other financial assets and financial liabilities have arised in the ordinary course of operatingactivities and are payable shortly, on account of which the management board is of opinionthat their fair value does not differ significantly from their carrying value. These assets andliabilities do not carry any interest.
EEK ths. EEK ths. EEK ths. EEK ths.Level I Level 2 Level 3 Total
145 0 0 145100 0 0 100
0 674 1,039 1,7130 1,205 54 1,259
245 1,879 1,093 3,217
112 0 0 112112 0 0 112
EEKths. EEKths. EEKths. EEKths.Level I Level 2 Level 3 Total
9 0 0 96 0 0 6
0 43 66 1090 77 3 80
16 120 70 206
7 0 0 77 0 0 7
* Levels used in hierarchy:Level 1— quoted prices in active marketLevel 2 — based on market price indications, rates and interest curves from similar transactionsLevel 3 — other valuation techniques (fex discounted cash flow method)
LL.I
67

SIGNATURES OF THE MANAGEMENT BOARD AND THE SUPERVISORY BOARDTO THE ANNUAL REPORT 2009
The Annual Report 2009 of MARFIN PANK EESTI AS is signed by:
Fotios Karatzenis
Nikolaos Sarros
Efthymios Bouloutas
Achillefs Giannisis
Frank Ulrich John
Emmanouil Karavelakis
Christos Stylianides
Riho Rasmann
Chairman
Member of the Supervisory Board
Member of the Supervisory Board
Member of the Supervisory Board
I —--
-r/
Sven Raba
Mart Veskimagi
Member of the Management Board
Member of the Management Board
04.03. t 10
Roul Tutt Member of the Management Board
_______________
2i. o3 2oIo
Member of the Supervisory Board
Member of the Supervisory Board
Member of the Supervisory Board
68

J3R1CEWATERHOUsE(DPERS
AS PricewaterhouseCoopersParnu mnt. 1510141 TallinnEstonia
Telephone +372 614 1800Facsimile +372 614 1900www.pwc.ee
INDEPENDENT AUDITOR’S REPORT
(Translation of the Estonian original)’
To the Shareholders of MARFIN PANK EESTI AS
We have audited the accompanying financial statements of MARFIN PANK EESTI AS (the Bank)which comprise the statement of financial position as of 31 December 2009 and the statement ofcomprehensive income, statement of changes in equity and statement of cash flows for the yearthen ended and a summary of significant accounting policies and other explanatory notes.
Management Board’s Responsibility for the Financial Statements
Management Board is responsible for the preparation and fair presentation of these financialstatements in accordance with International Financial Reporting Standards as adopted by theEuropean Union. This responsibility includes: designing, implementing and maintaining internalcontrol relevant to the preparation and fair presentation of financial statements that are free frommaterial misstatement, whether due to fraud or error; selecting and applying appropriateaccounting policies; and making accounting estimates that are reasonable in the circumstances.
Auditor’s Responsibility
Our responsibility is to express an opinion on these financial statements based on our audit. Weconducted our audit in accordance with International Standards on Auditing. Those Standardsrequire that we comply with ethical requirements and plan and perform the audit to obtainreasonable assurance whether the financial statements are free from material misstatement.
An audit involves performing procedures to obtain audit evidence about the amounts anddisclosures in the financial statements. The procedures selected depend on the auditor’s judgment,including the assessment of the risks of material misstatement of the financial statements, whetherdue to fraud or error. In making those risk assessments, the auditor considers internal controlrelevant to the entity’s preparation and fair presentation of the financial statements in order todesign audit procedures that are appropriate in the circumstances, but not for the purpose ofexpressing an opinion on the effectiveness of the entity’s internal control. An audit also includesevaluating the appropriateness of accounting policies used and the reasonableness of accountingestimates made by management, as well as evaluating the overall presentation of the financialstatements.
We believe that the audit evidence we have obtained is sufficient and appropriate to provide abasis for our audit opinion.

PRICLWATERHOU5EeDPERS
Opinion
In our opinion, the accompanying financial statements give a true and fair view of the financialposition of the Bank as of 31 December 2009, and of its financial performance and its cash flowsfor the year then ended in accordance with International Financial Reporting Standards as adoptedby the European Union.
Tiit RaimlaAS PricewaterhouseCoopers
5 March 2010
*
This version of our report is a translation from the original, which was prepared in Estonian. Allpossible care has been taken to ensure that the translation is an accurate representation of theoriginal. However, in all matters of interpretation of information, views or opinions, the originallanguage version of our report takes precedence over this translation.
(2)

THE MANAGEMENT BOARD’S PROFIT ALLOCATION PROPOSAL
The Management Board of MARFIN PANK EESTI AS approved the audited loss ofMARFIN PANK EESTI AS for the financial year 2009 in the amount of 84,388,33503kroons (5,393,397.61 euros). The Management Board’s proposal to the General Meeting ofShareholders’ is to record the loss for the financial year 2009 in the amount of84,388,335.03 kroons (5,393,397.61 euros) under the balance sheet heading“Accumulated deficit”.
Riho Rasmann Chairman of the Management Board t9t:
4. . $!t3
Ot o3.2/t’
Sven Raba Member of the Management Board
Mart Veskimagi Member of the Management Board
Roul Tutt Member of the Management Board
70