marcia kadanoff firewhite consulting inc. ceo & president improving time to revenue
TRANSCRIPT
Marcia Kadanoff
Firewhite Consulting Inc.
CEO & President
Improving Time to RevenueImproving Time to Revenue

2
Why You’re HereWhy You’re Here
More and more software is like milk– Limited amount of time to get in, capture
revenue, maximize profits
6-6-1 economicsOpen sourceOn demand
Intro

3
Why I’m HereWhy I’m Here
Work at the intersection– Direct marketing– Marketing science
CMO Magazine calls– “New breed” of statistical marketers
Intro

4
Extreme CompetitionExtreme Competition
Supply exceeds demand– Capital is cheap– Skilled labor is ubiquitous– Infrastructure prices are dropping– Excess supply of almost everything …
except customers
Intro
Source: “Extreme Competition”, McKinsey & Co. (Jan. 2005)
5
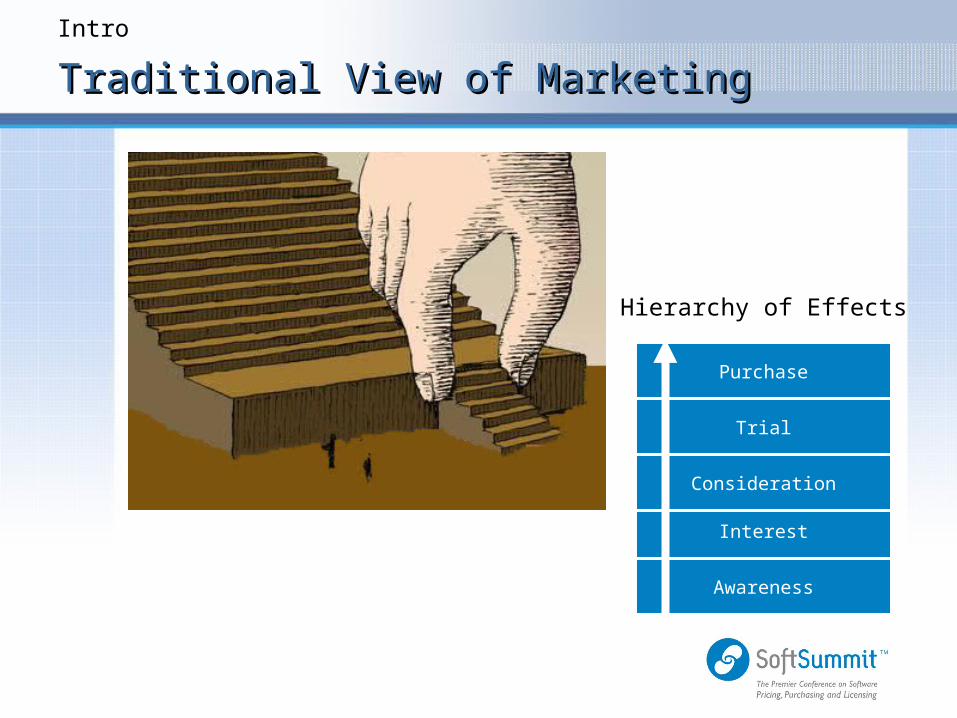
Traditional View of MarketingTraditional View of Marketing
Awareness
Interest
Consideration
Trial
Purchase
Hierarchy of Effects
Intro

6
Doesn’t fit Never validated in 30+ years Not for lack of trying
Intro
QuantitativeSurvey ResearchGallup PollsInternet PanelsMarketing Scientists
• Choice Modeling• MVT Testing• Marketing-Mix Modeling
QualitativeFocus GroupsCognitive Scientists
• Eye Tracking• Brain Scans
Brand Equity
ModelModel

7
Extreme MakeoverExtreme Makeover
Software– Technology change– Change in life stage
or at the company– Regulatory change– Reco of an expert
Customer
“spark”
Intro

8
Build a Fact baseBuild a Fact base
Leverages behavioral data– Accumulated in CRM and operational
systems at your company
• dB Analytics• Statistics
– A/B and MVT testing
Customer Analytics

9
““Must Do” AnalysesMust Do” Analyses
Sources UsesProfiling Relevant messages, offers,
media placement
Segmentation Targeting
Product pricing, bundling decisions
Customer Value* How much can I afford to spend to acquire and serve different types of customers?
Choice Modeling* Feature sets that go into a product bundle
Pricing that optimizes profits
Market-Mix Optimization Mix of spending that optimizes revenue (e.g.)
*Not discussed today in the interest of timeSee Appendix for add’l info
Customer Analytics
10
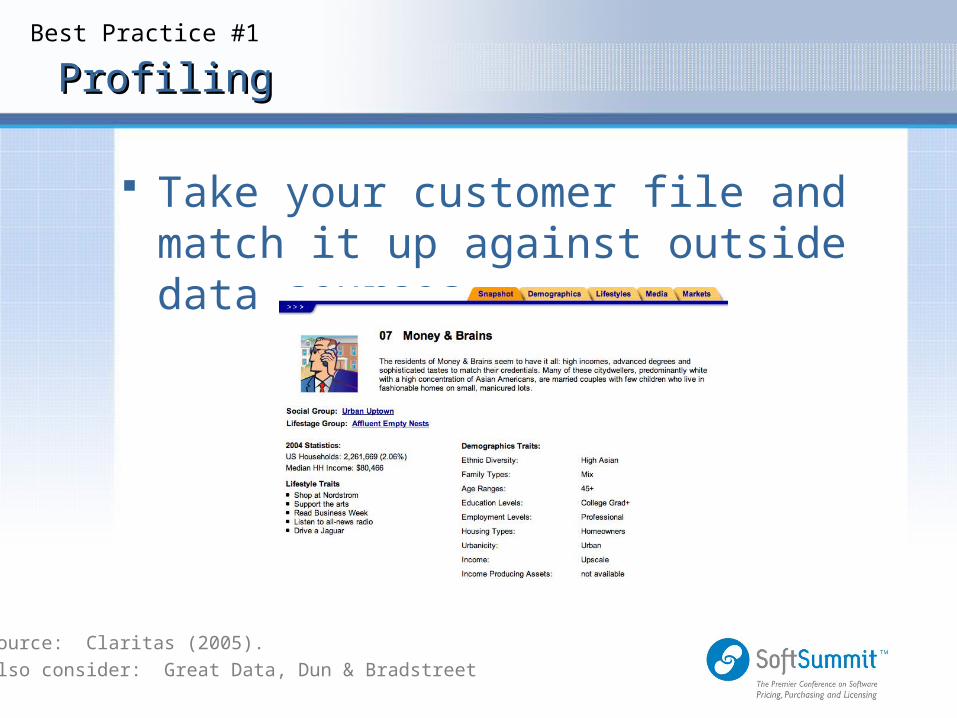
ProfilingProfiling
Take your customer file and match it up against outside data sources
Best Practice #1
Source: Claritas (2005).
Also consider: Great Data, Dun & Bradstreet

11
SegmentationSegmentation
Groups “like” customers together
N O P VP
Segment 1
Segment 2
MVP
Segment 3
AvoidAcquireRetainMigrate
RetainClone
Collaborate
Customer Value
Best Practice #2

12
Time-based AnalysisTime-based Analysis
Profiling + Segmentation – Analysis over time periods (this year vs. last) – Can lead to some “Eureka” moments– Indexing - no. of customers and revenue in two
categories (new/existing)
• 0-3 month• 0-12 month • 0-24 month• 0-36 month
Index >100 growthIndex <100 shrinkage
Best Practice #3

13
ExampleExample
Growth in 0-3 new buyers meeting a particular profile
– Female, multi ethnic– Younger than normal– Educated but not technical– Urban, Suburban
Best Practice #3

14
““Eureka Moment”Eureka Moment”Best Practice #3

15
In the FutureIn the Future
Analysts are predicting– One product, customized on the fly to
meet the dynamic needs of customers• Emma …• George …• Etc.
Customer Analytics

16
Love to detailLove to detail
Rest of analytic solutions but can’t in a single hour– “Answers” are in your customer dB– Those that aren’t
Disciplined testing• Test vs. Control - A/B testing• MVT testing
Customer Analytics

17
Step 2 - Extreme Makeover Step 2 - Extreme Makeover
Search front and center Not just search
– Organic search (SEO)– Paid search (SEM)– RSS– Banner ads– Interactive
FAQ– Traditional Advertising?– Non starter - cost reasons– $150K per Q in sustained
spending
– Technology change– Life stage– Regulatory change– Reco of an expert
Customer
Hunt & Gather
“spark”
Search Plus

18
Best PracticesBest Practices
#3 Measure result– Using ROI not click throughs or conversion
rates
#4 Test everything from end-to-end
Search term Text Ad Landing Page
– Ideally using an MVT testing service like Offermatica to speed up the process
Search Plus

19
Best Practices (cont)Best Practices (cont)
#5 Control you affiliates– To avoid bidding against yourself
#6 Leverage your fact base– Expand search terms– Guide media placements– Determine messaging and visuals
Search Plus

20
Best Practices (cont)Best Practices (cont)
#7 Make your offers strategic– Ideally, they should add and not subtract from your value
proposition
$39.99 $59.99
Search Plus
21
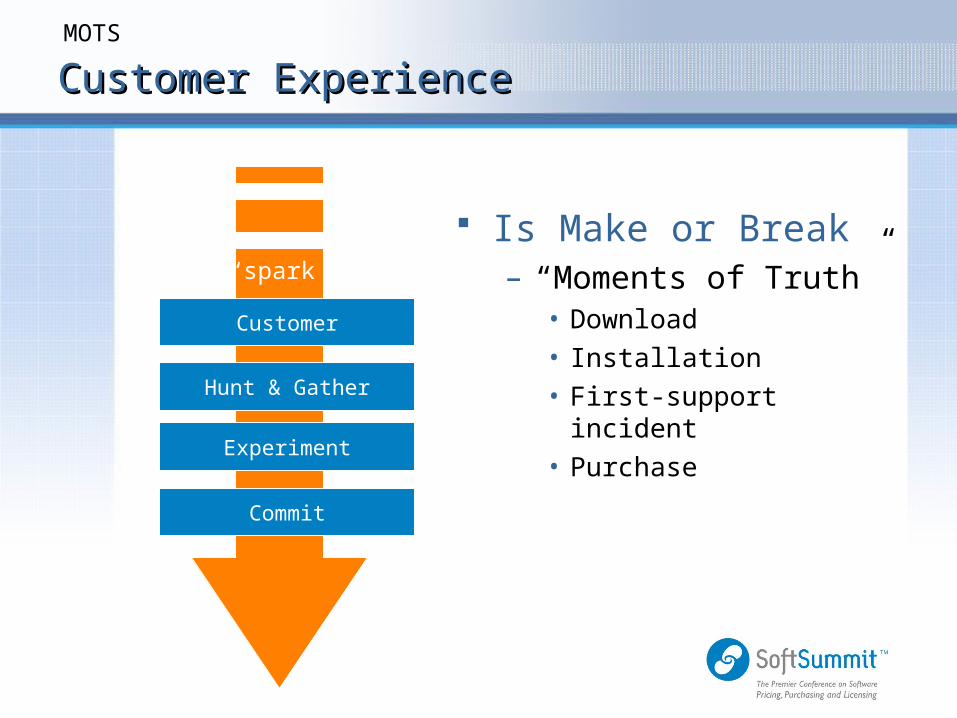
Customer ExperienceCustomer Experience
Is Make or Break– “Moments of Truth”
• Download• Installation• First-support incident• Purchase
Customer
Hunt & Gather
“spark”
Experiment
Commit
MOTS
22
Best Practice #8
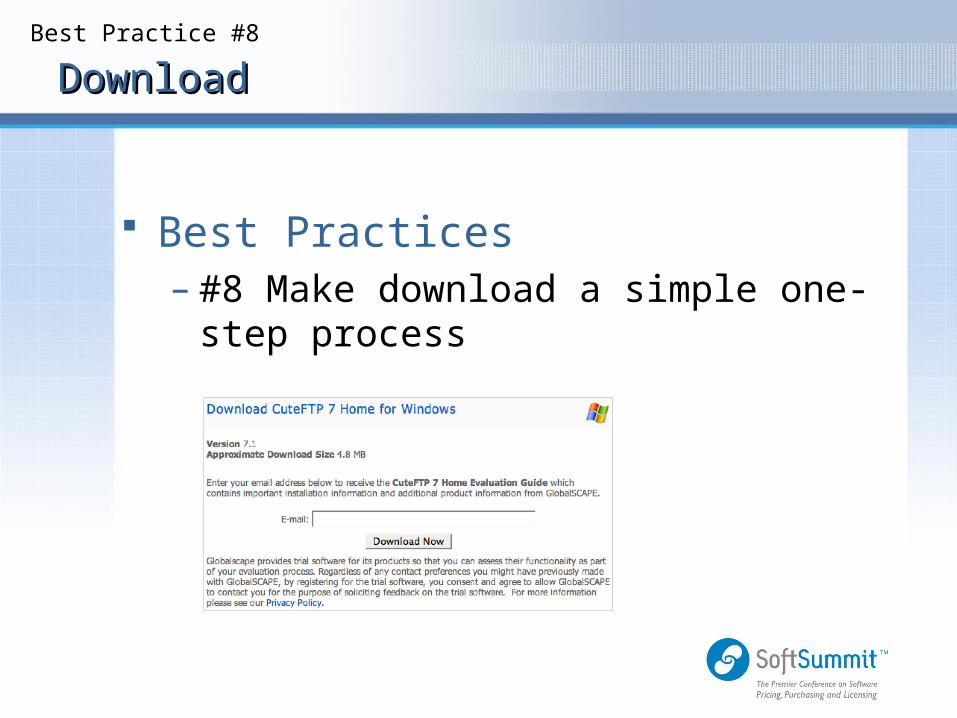
DownloadDownload
Best Practices– #8 Make download a simple one-step
process

23
Creating An AccountCreating An Account
Is a No No
Requesting too much informationToo soon in the relationship
- Identifying info- Profiling info- Business critical info- Opt-in to follow on communications
Will depress response
MOTS

24
Best PracticesBest Practices
#9 Profiling – Don’t collect information you can get
through other means
#10 Ask for one behavior at a time– Discipline based on “MOTS”– Download download + opt-in
MOTS
25
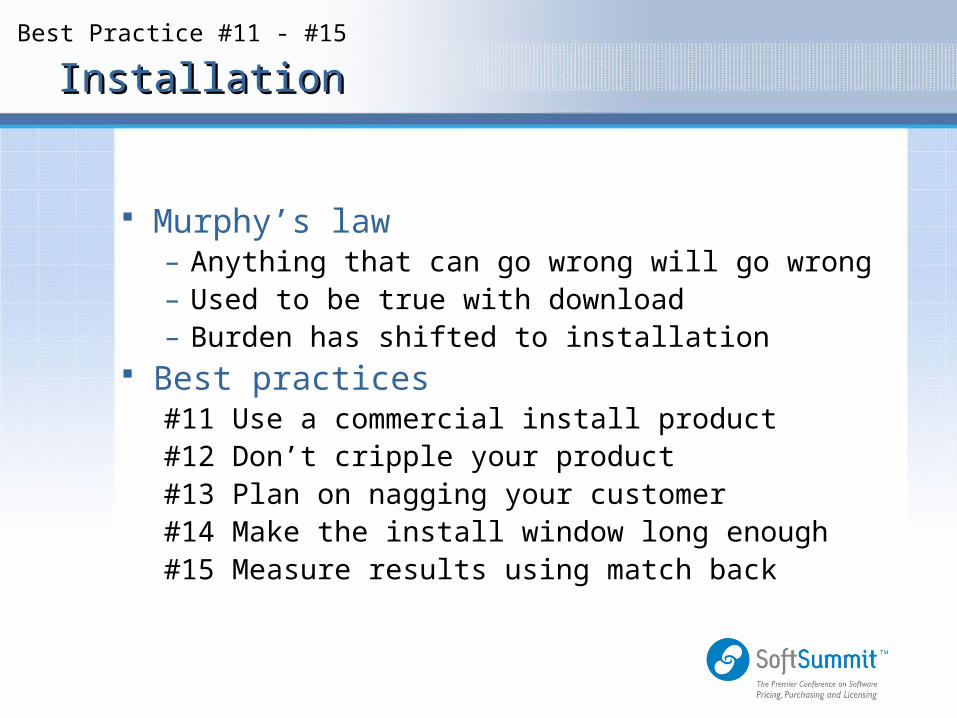
InstallationInstallation
Murphy’s law– Anything that can go wrong will go wrong– Used to be true with download– Burden has shifted to installation
Best practices#11 Use a commercial install product#12 Don’t cripple your product#13 Plan on nagging your customer#14 Make the install window long enough#15 Measure results using match back
Best Practice #11 - #15

26
First Support IncidentFirst Support Incident
This is a “Moment of Truth”– Customer judgment is harsh, immediate– You can win (or lose) a customer for life here
Best Practice– #16 Give prospects access to your support
forums -or- if you are just getting started FAQs– #17 Be clear about the preferred method of
contact– #18 Meet or exceed stated turnaround times
Best Practice #16 - #18

27
Small SizeSmall Size
Can be a substantial asset – If you come clean– Authenticity is rare
• “We’re a small company and depend on our users as the first line of support”
• “I was amazed to find that the company turned around a patch within 24 hours of my making the issue known to them”
MOTS

28
““White Space”White Space”
Best Practice– #19 Short easy-to-scan
communications– #20 Don’t even think about
violating customer’s privacy
Customer
Hunt & Gather
“spark”
Experiment
Commit
MOTS

29
True CommitmentTrue Commitment
Is based on trust
Functionality/Competence
Reliability
Shared Values
Responsiveness
Empathy
Pot
entia
l str
engt
h of
re
latio
nshi
p“Hierarchy of Trust”
Source: Global Fund for the Future (2005)Adapted from a White paper “The importance of being Ernest”
75% Emotional
25% Rational
MOTS

30
Customer
Hunt & Gather
“spark”
Experiment
Commit
Step 3 - Extreme MakeoverStep 3 - Extreme MakeoverAfter the Sale
After the Sale– Acquisition– Retention– Migration
Tactics– Upgrade Mailings– Collaboration – Brand Advocacy

31
Upgrade MailingsUpgrade Mailings
They’re B-A-C-K– EM is easy to ignore– EM + DM will lift results by 20-50%– Don’t sell features, sell benefits
• Example Recent SPSS mailing
– For mailings over 200K pieces consider leveraging predictive analytics
• Takes into account the marketing mix and upgrades you would have gotten anyway
• Example in the Appendix - courtesy of Quadstone
After the Sale

32
CollaborationCollaboration
Reduce cost to serve Up commitment
– Expert status - earned over time - protects customer base from cherry picking
– Products “wrapped” more tightly around needs– Facilitate brand advocacy/buzz/WOM
marketing Examples
– Threaded discussion board - pMachine– Embrace blogosphere - MindJet– Polling - Forrester
*See Appendix for some software solutions
After the Sale

33
Brand AdvocacyBrand Advocacy
Spread positive WOM on your behalf
Source: “The Marketing Value of Customer Advocacy”, Wragg and Lowenstein, Ad Map, January 2005
After the Sale

34
Brand AdvocacyBrand Advocacy
Tightly related to customer value
Source: “The Marketing Value of Customer Advocacy”, Wragg and Lowenstein, Ad Map, January 2005
After the Sale
35
Step 4 - Extreme MakeoverStep 4 - Extreme Makeover
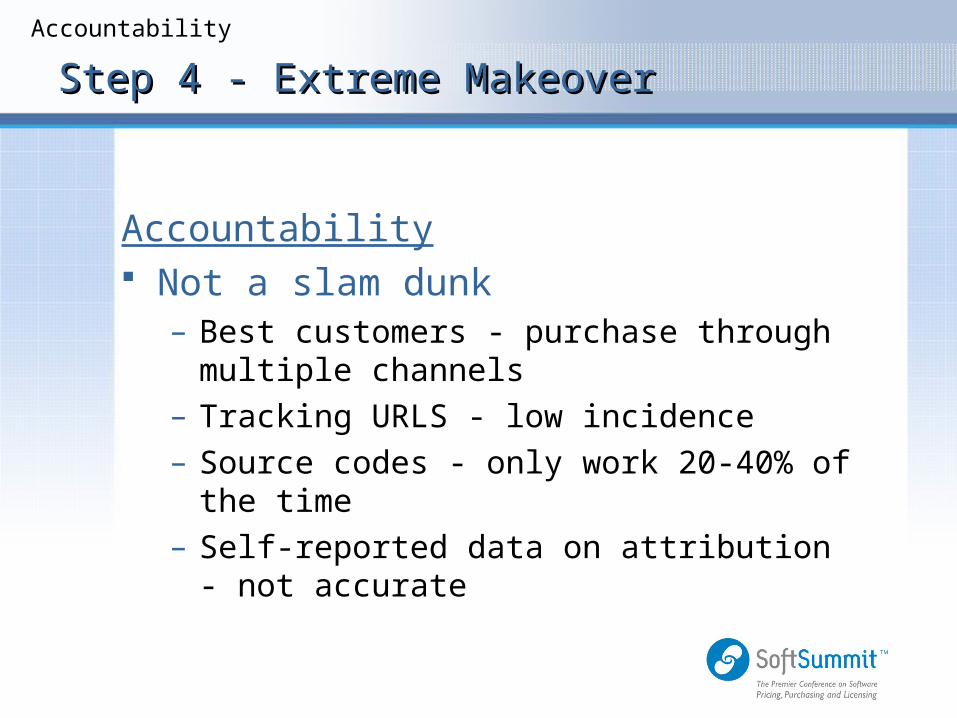
Accountability Not a slam dunk
– Best customers - purchase through multiple channels
– Tracking URLS - low incidence– Source codes - only work 20-40% of the time– Self-reported data on attribution - not accurate
Accountability

36
Market-Mix OptimizationMarket-Mix Optimization
Uses statistics to determine the best way to allocate marketing dollars– By product line– By geography– By media type
“Secret weapon” used by companies spending at least $5M on marketing– Statistical methods of attribution
Accountability

37
Major ISVMajor ISV
“Katmandu”– Sells licensed client/server software into
the Enterprise– Sells to line-of-business manager as well
as to IT– Katmandu spends in excess of $50M per
year in the US on advertising and sales promotion
Accountability

38
InputsInputs
2 years of data– Spending, sales, by product line by DMA– Set of constraints determined by
management team– Current allocation of marketing budget
Accountability

39
Media Plan Varied by DMAMedia Plan Varied by DMA
M a d is o n
B o is e
B illin g s
D e n v e r
N e w Y o r k
S a n D ie g o
D a lla s
S e a t t le
A t la n t a
C h ic a g o
D a y t o n
R a d i o
T V
D ir e c t M a i l
B a n n e r
E m a i l
S e a r c h
O u td o o r
0 %
1 0 %
2 0 %
3 0 %
4 0 %
5 0 %
6 0 %
7 0 %
8 0 %
9 0 %
RadioTVDMBannerEMSearchOutdoor
Accountability

40
Key FindingsKey Findings
Reco Re-Allocation of Budget
0%
10%
20%
30%
40%
50%
60%
Radio TV DM EM Outdoor
Before
Reallocated
% B
ud
get
All
oca
tio
n
Accountability
41
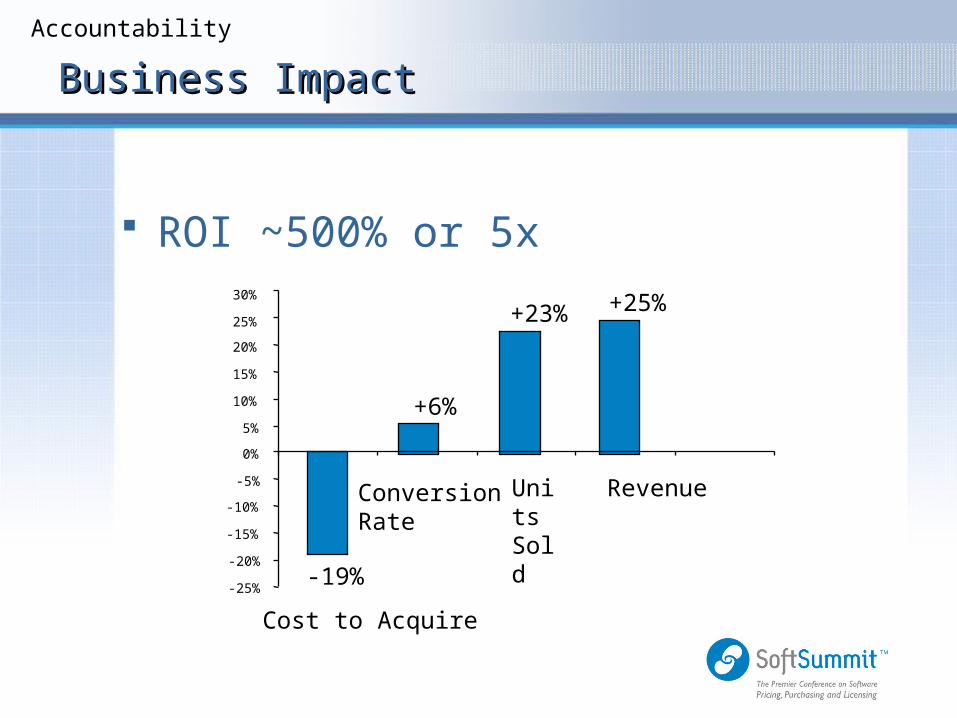
Business ImpactBusiness Impact
ROI ~500% or 5x
-19%
+6%
+23% +25%
-25%
-20%
-15%
-10%
-5%
0%
5%
10%
15%
20%
25%
30%
% C
ha
ng
e
Cost to Acquire
ConversionRate
UnitsSold
Revenue
Accountability

42
For Us PlebsFor Us Plebs
With less than $5M to spend– Match back - the Gold Standard– Take list of people who downloaded trial
software and then match back to all purchasers from all sources after allowing for a time lag
Issues– Appropriate time lag– Fuzzy logic, phonetics– Different match keys across different data
sources and/or accounting for missing data
Accountability

43
Wrap Up
Extreme CompetitionExtreme Competition
Promised you 4 “big ideas”– Marketing needs an extreme makeover– In our extreme makeover we’d
• Focus on Customer Analytics not Market Research• Put Search and Internet marketing front and center• Optimize Customer Experience using what we know
works to drive downloads, installations, and purchase• Leverage brand advocacy as a multiplier - but know
that we won’t get there without trust• Invest in accountability, recognizing that marketing is
a process like any other business process


45
This PresentationThis Presentation
– Contains copyrighted material and original intellectual property produced by Marcia Kadanoff on behalf of Firewhite Consulting, Inc.
– Feel free to use material here so long as you attribute the source to: • Marcia Kadanoff of Firewhite at www.firewhite.com
2005, all rights reserved.
Wrap Up

46
AppendixAppendix
Return on Investment
ROI = Units Sold * ASP * Margin - N(Cost to Acquire + Cost Serve)
Marketing Cost
– Where ASP is the average selling price of the products and N is the number of customers
– Typically ROI is calculated on a segment-by-segment basis
Customer Analytics

47
AppendixAppendix
Customer Analytics
CLV = m * r
1 + i - r
–Where m = margin or profit from a customer per period (e.g. per year)–Where r = retention rate, for example .8 or 80%–Where i = discount rate, for example .12 or 12%
Customer Lifetime Value
Source: Managing Customers as Investments, Gupta and Lehmann (2005)

48
AppendixAppendix
To learn more– About choice modeling– See these pages on the Firewhite site
• http://www.firewhite.com/services/npd_profit_maximizer• http://www.firewhite.com/thoughtleadership/index/choice_modeling/• http://www.firewhite.com/clients/cases/case_demand_planning
Customer Analytics

49
AppendixAppendix
For Collaboration– “First Look” of BrightIdea service
• Innovation Tools Webloghttp://www.innovationtools.com/Resources/ideamgmt-details.asp?a=190
– CMO Magazine • Requires free site registration • Roundup of Idea Management tool
http://www.cmomagazine.com/read/090105/idea_sampler.html
– Informativehttp://www.informative.com
Software Tools
50
AppendixAppendix
This case courtesy of Quadstone– Adapted by Firewhite
Predictive Analytics– Preparing for a major support mailing …
to get people to re-up through the mail– Mail a random 50% of 1,000,000
customers
After the Sale
51
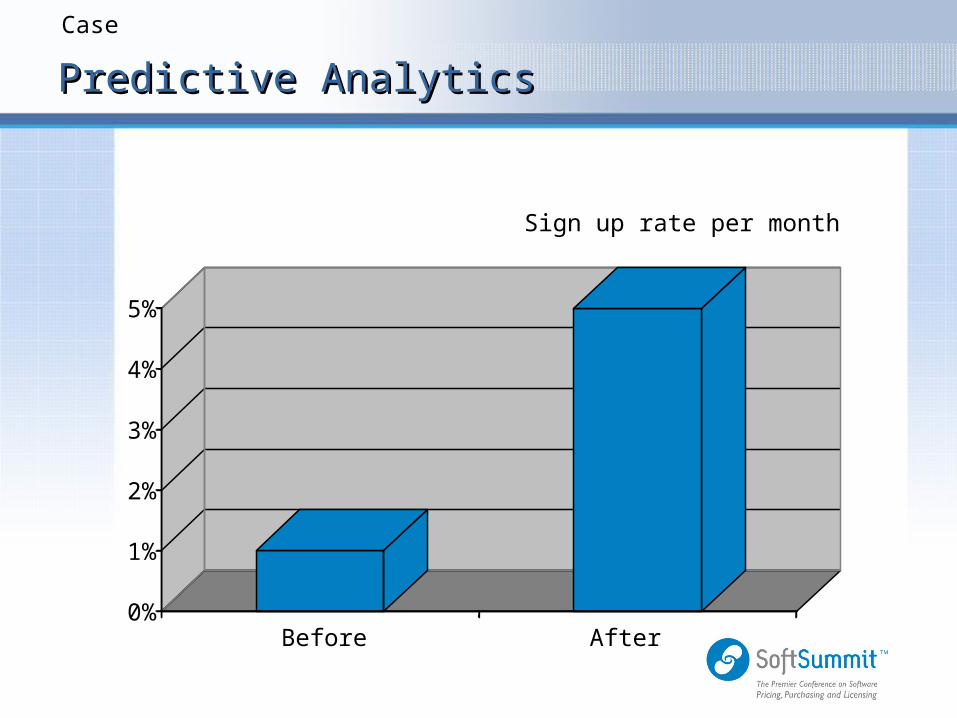
Predictive AnalyticsPredictive Analytics
0%
1%
2%
3%
4%
5%
Sign up rate per month
Case
Before After

52
Predictive AnalyticsPredictive Analytics
Lots of divergent views– The Database Marketing Manager says the
mailing worked– The Director of Advertising says that it wasn’t
the mailing at all, but that it was the result of TV advertising
– Customer support points out that the need for a security audit (s.t. that’s free for customers that re-up) was merchandised in an email newsletter that went out to all customers
Case
53
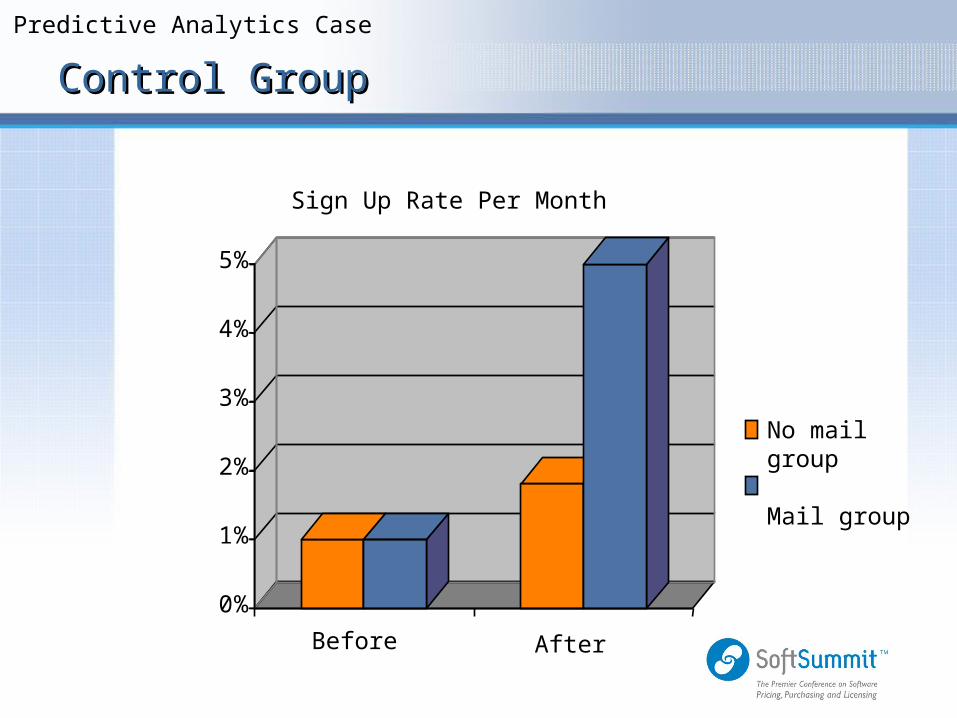
Control GroupControl Group
0%
1%
2%
3%
4%
5%
No mail group
Mail group
Before After
Sign Up Rate Per Month
Predictive Analytics Case

54
Next StepsNext Steps
Great!– Thanks to a “no mail” control group we
know mailing worked– The Database Marketing Manager now
wishes to use predictive analysis to improve the targeting of the next mailing
– He builds a decision tree . . .
Predictive Analytics Case

55
Decision TreeDecision Tree
49,873
25,100
12,353 12,747
24,773
12,321 12,452
Objective: RespondTraditional CHAID analysis5% of 1,000,000 mailed
SexFemale Male
Age<40 >40
Age<40 >40
4.3% 5.7%
4.1% 4.6% 6.2% 5.2%
Age<40 >40
Predictive Analytics Case
Best mailing targetMen <40Maximizes response

56
Mailing ROIMailing ROI
Take-up Rate
No mail group
Age
Sex 18 - 39 40 - 65
Female 0.8% 0.4%
Male 2.8% 3.3%
Take-up Rate
Mail group
Age
Sex 18 - 39 40 - 65
Female 4.1% 4.6%
Male 6.2% 5.2%
Difference
18 - 39 40 - 65
Female +3.3% +4.2%
Male +3.4% +1.9%
Predictive Analytics Case

57
Predictive Analytics Case
ProblemProblem
As is often the case– Decision tree identified lots of people
who signed up well after the mailing– Raises questions about attribution of
results and who to target
58
SolutionSolution
Predictive Analytics– Use results of controlled test to build a
predictive model, one that isolates the impact of mail on uptake of support renewals
Predictive Analytics Case

59
Predictive AnalyticsPredictive Analytics
+3.2%
+3.8%
+3.3% +4.2%
+2.6%
+3.4% +1.9%
• Objective: maximize response• Predicts lift from mailing given particular
marketing mix
SexFemale Male
Age<40 >40
Age<40 >40
Difference
18 - 39 40 - 65
Female +3.3% +4.2%
Male +3.4% +1.9%
Case
Best mailing target40+ womenMaximizes lift

60
Predictive AnalyticsPredictive Analytics
Case
Two different answers– Who should we target?
• CHAID - men <40• Predictive analytics - women 40+
– Answer is … it depends• On whether the value of these customers is
equivalent or not

61
AppendixAppendix
WOM marketing– Available on B|NET– Membership is free– After you join, search for:
After the Sale