march 4 - 7, 2018 hilton phoenix / mesa hotel mesa
TRANSCRIPT
Archive
March 4 - 7, 2018
Hilton Phoenix / Mesa Hotel
Mesa, Arizona
© 2018 BiTS Workshop – Image: pilgrims49 / iStock

COPYRIGHT NOTICE
The presentation(s)/poster(s) in this publication comprise the Proceedings of the 2018 BiTS Workshop. The content reflects the opinion of the authors and their respective companies. They are reproduced here as they were presented at the 2018 BiTS Workshop. This version of the presentation or poster may differ from the version that was distributed in hardcopy & softcopy form at the 2018 BiTS Workshop. The inclusion of the presentations/posters in this publication does not constitute an endorsement by BiTS Workshop or the workshop’s sponsors. There is NO copyright protection claimed on the presentation/poster content by BiTS Workshop. However, each presentation/poster is the work of the authors and their respective companies: as such, it is strongly encouraged that any use reflect proper acknowledgement to the appropriate source. Any questions regarding the use of any materials presented should be directed to the author(s) or their companies. The BiTS logo and ‘Burn-in & Test Strategies Workshop’ are trademarks of BiTS Workshop. All rights reserved.
www.bitsworkshop.org

Heating Up - Burn-in and Thermal BiTS 2018 Session 7 Presentation 4
March 4-7, 2018 Burn-in & Test Strategies Workshop www.bitsworkshop.org
BiTS Workshop
March 4 - 7, 2018
Conference Ready
mm/dd/2014
Extended / Accelerated Burn-In
Implementation for
Cycle Time & Cost Savings
Krishna Mohan Chavali
Sivakumar Pasupathi
GLOBALFOUNDRIES

Heating Up - Burn-in and Thermal BiTS 2018 Session 7 Presentation 4
March 4-7, 2018 Burn-in & Test Strategies Workshop www.bitsworkshop.org
Contents
Extended / Accelerated Burn-In Implementation for Cycle Time & Cost Savings 2
• Abstract
• Introduction
• Standard HTOL Vs Extended Accelerated BI
• Methodology
• Prior Requirements & Best Suitable Cases
• Extended Acceleration Study & Results
• Implementation & Savings
• Advantages
• Conclusion & References

Heating Up - Burn-in and Thermal BiTS 2018 Session 7 Presentation 4
March 4-7, 2018 Burn-in & Test Strategies Workshop www.bitsworkshop.org
Abstract
Extended / Accelerated Burn-In Implementation for Cycle Time & Cost Savings 3
• Conventional package level Burn-In is associated with significant costs & time.
• Cycle time to go through silicon integration, bumping, dicing, assembly and final
test before starting the burn-in will take 4~5 months.
• After that execution of HTOL stress and test to 1000 hours will take 2 months.
• If the process is stable and product design is able to support extended Voltage
and /or temperature stress the above Overall cycle time can be reduced.
• With prior planning and upon meeting some pre-requisites, not only the cycle
time can be improved but also huge cost savings can be made.
• Presented here are the Extended Accelerated HTOL stress techniques by which
the reduction in the overall cycle time can be achieved:
• By extended stresses either at higher voltages and/or at higher temperatures.

Heating Up - Burn-in and Thermal BiTS 2018 Session 7 Presentation 4
March 4-7, 2018 Burn-in & Test Strategies Workshop www.bitsworkshop.org
Introduction
Extended / Accelerated Burn-In Implementation for Cycle Time & Cost Savings 4
• Industry standard HTOL test for Semiconductor ICs is done at 125 C up to 1000 hrs.
• To demonstrate ≥ 10years of useful life, for the product in the field.
• Stress conditions for EFR and HTOL stresses will be generally based on acceleration Factors:
• The Voltage and Temperature Acceleration Factors are given by:
• Voltage Acceleration Factor (VAF) : Exp [ β * (Vstress - Vuse) ]
• Temperature Acceleration Factor (TAF) : Exp [ Ea/K*(1 / Tuse – 1 / Tstress) ]
Where β is the Wei-bull slope; Ea: Activation Energy; K: Boltzmann’s constant.
• If the process and product are able to support higher than required stress compliant
temperatures, the overall 1000hrs of HTOL stress can be reduced either by:
• Increasing the stress voltage at stipulated 105 / 125 C and / or
• Increasing the stress temperature to >105 / 125 C, but with stipulated Vstress.
• However these techniques need careful Prior Study and
• Very helpful in reducing the cycle time on the subsequent *ORM to achieve cost savings.
*ORM: Ongoing Reliability Monitoring
Heating Up - Burn-in and Thermal BiTS 2018 Session 7 Presentation 4
March 4-7, 2018 Burn-in & Test Strategies Workshop www.bitsworkshop.org
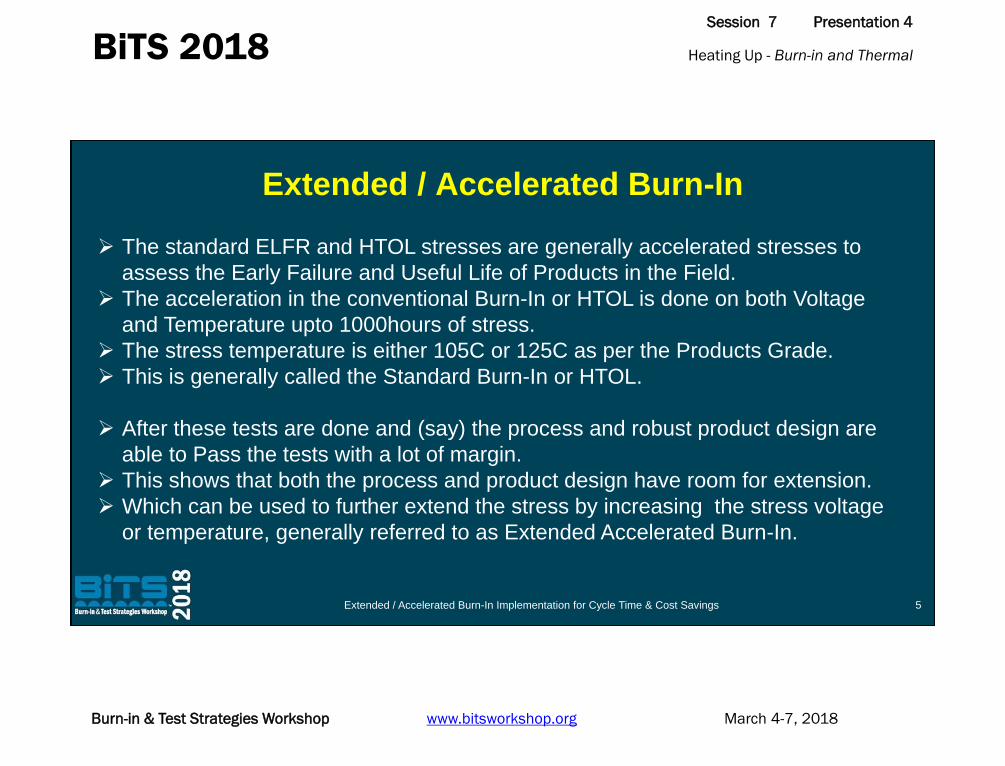
Extended / Accelerated Burn-In Implementation for Cycle Time & Cost Savings 5
Extended / Accelerated Burn-In
The standard ELFR and HTOL stresses are generally accelerated stresses to
assess the Early Failure and Useful Life of Products in the Field.
The acceleration in the conventional Burn-In or HTOL is done on both Voltage
and Temperature upto 1000hours of stress.
The stress temperature is either 105C or 125C as per the Products Grade.
This is generally called the Standard Burn-In or HTOL.
After these tests are done and (say) the process and robust product design are
able to Pass the tests with a lot of margin.
This shows that both the process and product design have room for extension.
Which can be used to further extend the stress by increasing the stress voltage
or temperature, generally referred to as Extended Accelerated Burn-In.

Heating Up - Burn-in and Thermal BiTS 2018 Session 7 Presentation 4
March 4-7, 2018 Burn-in & Test Strategies Workshop www.bitsworkshop.org
Extended / Accelerated Burn-In Implementation for Cycle Time & Cost Savings 6
Extended Acceleration: Methodology
The further Extended Accelerated Burn-In can be done in two ways to reduce the
overall stress time, equivalent to standard burn-in.
• Increasing the Stress Voltage further but keeping same stress Temperature.
• Increasing the Stress Temperature further but keeping stress voltage same.
• This is done by demonstrating the guaranteed 10years field life, with extension of
either the stress voltage or the temperature.
•
• The actual stress duration with extended accelerated stress will be <1000hrs.
• Still based on the same Thermal & Voltage Models used for HTOL stress.

Heating Up - Burn-in and Thermal BiTS 2018 Session 7 Presentation 4
March 4-7, 2018 Burn-in & Test Strategies Workshop www.bitsworkshop.org
FIT Rate Calculation
Extended / Accelerated Burn-In Implementation for Cycle Time & Cost Savings 7
The FIT rate is calculated based on a certain confidence level as explained below:
C
F SampleSize Hours A
, r 2 2
9
10
2
2
FITS =
Where “Chi-Sq” Is the chi-squared value; “C” is the Confidence Level used;
2r + 2 = is the Degrees of Freedom and “r” is the number of failures.
The Total Acceleration Factor A F is:
Where AT is the Thermal Acceleration Factor and AV is the Voltage Acceleration Factor.
A F = A V x A T

Heating Up - Burn-in and Thermal BiTS 2018 Session 7 Presentation 4
March 4-7, 2018 Burn-in & Test Strategies Workshop www.bitsworkshop.org
Acceleration Factors
Extended / Accelerated Burn-In Implementation for Cycle Time & Cost Savings 8
The Thermal Acceleration factor AT is given by the Arrhenius relationship
AT = Exp [ Ea / k ( 1/Tuse – 1/Tstress) ] where
Ea = Activation energy at steady state (typically 0.7 eV)
k = Boltzmann constant = 8.617 X 10⁻⁵ eV/K
Tstress = Stress ambient temperature in Kelvin
Tuse = Operating ambient temperature in Kelvin
The Voltage acceleration factor AV is given by: Power Law / Exponential Law
AV = (V1 / V2)-β (or) Exp [ β * (Vstress - Vuse) ] where
V1 = Operating voltage in V; V2 = Stress voltage in V;
β = Voltage constant (Varies 2 to 22 based on technology node Wei-Bull Slope)

Heating Up - Burn-in and Thermal BiTS 2018 Session 7 Presentation 4
March 4-7, 2018 Burn-in & Test Strategies Workshop www.bitsworkshop.org
Effect of Thermal Acceleration
Extended / Accelerated Burn-In Implementation for Cycle Time & Cost Savings 9
Burn-In Conditions: Sample Size = 360; Stress Voltage : 1.1xVdd
The following table shows the increase in the Temperature Acceleration Factor when BI Temperature
is increased, in steps of 5 C and the reduction in the equivalent HTOL hours required to BI.
Burn-in
Temp.
(C)
Temperature
Acceleration
wrt Ta=55C
IM & HTOL
Burn-in
Hours
Number
Of Days
Reduction In
Burn-in Time
(# Cum. Days)
Required
Qual. Time
(with ROs)
125 77.9 1000 42 0 58
130 100.4 640 27 15 43
135 128.5 500 21 21 37
140 163.6 394 17 25 33
145 206.9 312 13 29 29
150 510.4 248 11 31 27

Heating Up - Burn-in and Thermal BiTS 2018 Session 7 Presentation 4
March 4-7, 2018 Burn-in & Test Strategies Workshop www.bitsworkshop.org
Effect of Voltage Acceleration
Extended / Accelerated Burn-In Implementation for Cycle Time & Cost Savings 10
Burn-In Conditions : Sample Size = 360; Stress Temperature = 125C
The following table shows the increase in the Voltage Acceleration Factor when the Stress Voltage is
increased, in steps of 10% of Vnom and the reduction in the equivalent HTOL hours required to BI
Stress
Voltage
(X Vdd)
Voltage
Acceleration
Factor
IM & HTOL
Burn-in
Hours
Number
Of Days
Reduction In
Burn-in Time
(# of Days)
Required
Qual. Time
(with ROs)
1.1 1.21 1000 42 0 58
1.2 1.44 694 29 13 45
1.3 1.69 590 25 17 41
1.4 1.96 510 22 20 38
1.5 2.25 444 19 23 35

Heating Up - Burn-in and Thermal BiTS 2018 Session 7 Presentation 4
March 4-7, 2018 Burn-in & Test Strategies Workshop www.bitsworkshop.org
Combined Thermal & Voltage Acceleration
Extended / Accelerated Burn-In Implementation for Cycle Time & Cost Savings 11
Burn-In Conditions : Sample Size = 360; Vstress: In steps of 10%; Tstress: 5C steps
The following table shows the increase in the Voltage and Temperature Acceleration Factors when the
Stress Voltage and Temperature are increased and the reduction in the equivalent HTOL/BI hours.
BI
Temp.
(C)
Thermal
Acc. (AT)
wrt Ta=55C
Stress
Voltage
(xVdd)
Voltage
Acc.
(AV)
HTOL
Burn-in
Hours
# of
Days
Reduction
In BI Time
(# of Days)
Qual. Time
Needed
(Inc. ROs)
125 77.94 1.1 1.21 1000 42 0 58
130 100.4 1.2 1.44 538 23 19 39
135 128.54 1.3 1.69 358 15 27 31
140 163.57 1.4 1.96 244 11 31 27
140 163.57 1.3 1.69 284 12 30 28
145 209.96 1.3 1.69 224 10 32 26

Heating Up - Burn-in and Thermal BiTS 2018 Session 7 Presentation 4
March 4-7, 2018 Burn-in & Test Strategies Workshop www.bitsworkshop.org
Extended / Accelerated Burn-In Implementation for Cycle Time & Cost Savings 12
Prior Requirements
The below are some of the pre-requisites that the process & products must satisfy as
minimum requirements, before the Extended Accelerated BI can be implemented:
Process Stability & Maturity:
• The baseline process should be stable (on variability) and mature (D0 & yields).
• Baseline already passed its compliant Qualification to its grade: CE/Ind./Gr-2~3.
• Also should have enough Reliability margins after passing the standard Qual.
Product Design Maturity:
• The products’ design should be robust and proven,
• Has already passed its compliant application grade Product Qual.
• Also should have Over Drive (on voltage/temperature) margins.

Heating Up - Burn-in and Thermal BiTS 2018 Session 7 Presentation 4
March 4-7, 2018 Burn-in & Test Strategies Workshop www.bitsworkshop.org
Extended / Accelerated Burn-In Implementation for Cycle Time & Cost Savings 13
Prior Requirements - 2
Stress Extension Studies:
• To be done both on Voltage & Temperature Extensions beyond the standard stress levels.
• Done by DOE, to assess available margins both on stress voltage and temperature.
• Margins on other Reliability (Viz: FEOL, MOL, BEOL) and
• Process Defect Mechanisms to be checked.
• Some process and Technology nodes might be sensitive to:
• Extended Voltage (Vramp, GOI, HCI TDDB etc.,) and
• Others to Temperature Extension (Ex: BTI, EM, SM etc.,)
• Best way is to run the procedure of “Qualifying a Process/Product for Higher Over Drive Voltage
Applications” for checking the Voltage Extension and Overall margins.

Heating Up - Burn-in and Thermal BiTS 2018 Session 7 Presentation 4
March 4-7, 2018 Burn-in & Test Strategies Workshop www.bitsworkshop.org
Reliability Considerations
Extended / Accelerated Burn-In Implementation for Cycle Time & Cost Savings
Reliability considerations are mainly:
1) Device Level / Intrinsic Reliability.
2) Circuit Level / Product Reliability.
1) Device Level Reliability considerations:
Parasitic Bipolar turn-on for (NMOS/PMOS)
BTI (Bias Temperature Instability)
TDDB (Time Dependent Dielectric Breakdown)
HCI (Hot Carrier Integrity)
EM (Electro-migration) Life Time
Device Level Latch Up
14

Heating Up - Burn-in and Thermal BiTS 2018 Session 7 Presentation 4
March 4-7, 2018 Burn-in & Test Strategies Workshop www.bitsworkshop.org
Reliability Considerations- 2
Extended / Accelerated Burn-In Implementation for Cycle Time & Cost Savings
2) Circuit Level Reliability Considerations:
Circuit Level Reliability Evaluation Results
Package Reliability Evaluation Results.
Local / Joules’ heating
Package-Level Latchup
Dynamic High-Voltage Stress Test Evaluation
15

Heating Up - Burn-in and Thermal BiTS 2018 Session 7 Presentation 4
March 4-7, 2018 Burn-in & Test Strategies Workshop www.bitsworkshop.org
REL Items Table: Device & Circuit
Extended / Accelerated Burn-In Implementation for Cycle Time & Cost Savings
After doing the Reliability assessments, compile all the results in to a table:
Check Item Sub 1.1xVdd 1.2xVdd 1.3xVdd 1.4xVdd 1.5xVdd 1.6xVdd
Bi-Polar Turn On Voltage NMOS
Base Line
Qual
Extended
Margin
On Over
Drive
Voltage
X
PMOS
BTI Lifetime NMOS X
PMOS X
HCI Lifetime NMOS X
PMOS X
TDDB Lifetime FEOL
BEOL X
EM Lifetime BEOL X
Latchup Device
Package X
Thermal Acceleration Tjstress X
JH & Package Tjstress X
HTOL @ OD Voltage & 125C @HSV X
16

Heating Up - Burn-in and Thermal BiTS 2018 Session 7 Presentation 4
March 4-7, 2018 Burn-in & Test Strategies Workshop www.bitsworkshop.org
HTOL @ Higher BI/OD Voltage
Extended / Accelerated Burn-In Implementation for Cycle Time & Cost Savings
Complete table upto what voltage each item can pass.
Select the column in which all Reliability items Pass.
Plan and run actual HTOL at that stress voltage: Tj : 125C; Readouts: 24h, 48h, 168h, 500h, 1000h (per EOL Spec)
If no gross fails at readouts complete to final readout.
If there are gross fails do PFA to find the root cause.
Reduce Vstress to one step below (Ex: 1.3 to 1.4xVnom).
Re-run HTOL at that voltage to confirm that as the OD.
17

Heating Up - Burn-in and Thermal BiTS 2018 Session 7 Presentation 4
March 4-7, 2018 Burn-in & Test Strategies Workshop www.bitsworkshop.org
Prior Checks & Evaluation Studies Limits to Apply:
• Even after the process and products show extendable margins on stress voltage and/or
temperature, it should not be taken granted that the stress can be easily extended.
• Below parameters should be checked to ensure that with the extended voltage and
temperature stress, the packaged modules are not going into “Thermal Run-away” mode.
• Increase in Istb, Dynamic Idd and leakage Currents (GIDL, DIBL, Isub etc.,),
• Effect of frequencies: Ring Oscillators and VCO’s at higher temperatures etc.,
Test and Stress Hardware:
• Both stress and test hardware should be checked for extended voltage and temperature
ranges and designed accordingly.
• With prior planning & design, to suit for this extended stresses, the same hardware can be
used for both Standard Burn-In and Extended Accelerated Burn-In.
Your Paper Title Here: BiTS Presentation Guide & Template 1.0 18

Heating Up - Burn-in and Thermal BiTS 2018 Session 7 Presentation 4
March 4-7, 2018 Burn-in & Test Strategies Workshop www.bitsworkshop.org
Extended / Accelerated Burn-In Implementation for Cycle Time & Cost Savings 19
Best Suitable Application Cases
This methodology is best suitable for the following:
Stable Process with robust Products’ design that have margins on:
Extendable stress temperature
(and / or)
Extendable stress voltage.
Best suitable for Process and Products with:
Baseline & Over Drive (Voltage/Temp) Customers to support.
Low Leakage Devices
Low or Super Low Power (LP/SLP)
Ultra Low Power (ULP) and
Ultra Low Leakage (ULL).
Heating Up - Burn-in and Thermal BiTS 2018 Session 7 Presentation 4
March 4-7, 2018 Burn-in & Test Strategies Workshop www.bitsworkshop.org
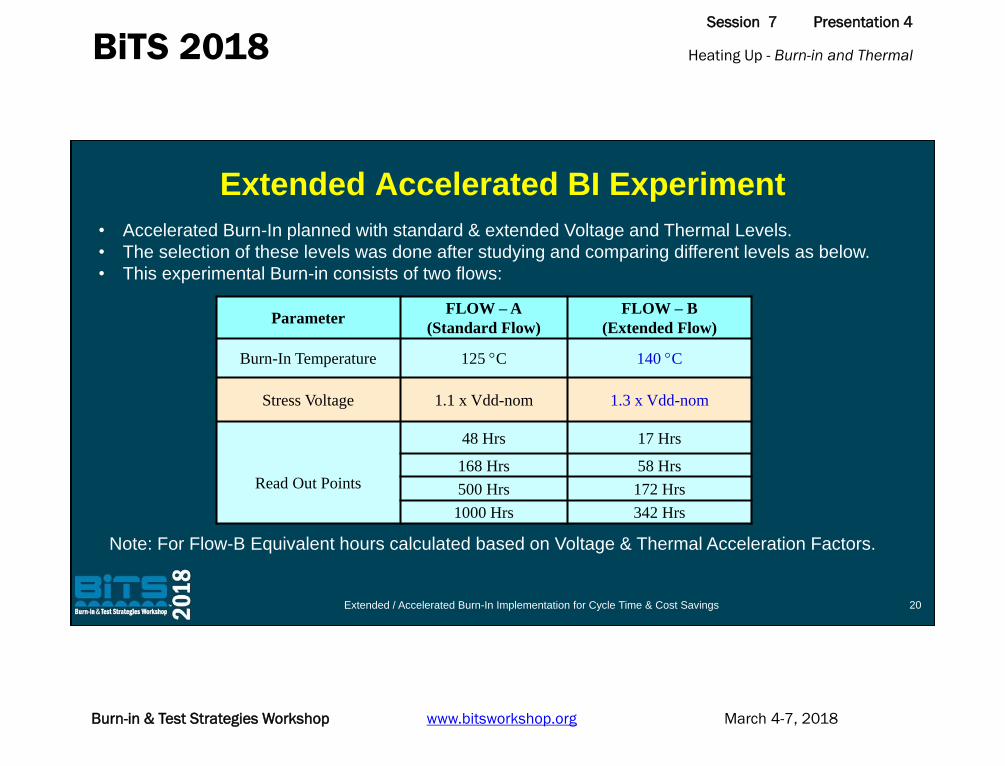
Extended Accelerated BI Experiment
Extended / Accelerated Burn-In Implementation for Cycle Time & Cost Savings 20
• Accelerated Burn-In planned with standard & extended Voltage and Thermal Levels.
• The selection of these levels was done after studying and comparing different levels as below.
• This experimental Burn-in consists of two flows:
Parameter FLOW – A
(Standard Flow)
FLOW – B
(Extended Flow)
Burn-In Temperature 125 C 140 C
Stress Voltage 1.1 x Vdd-nom 1.3 x Vdd-nom
Read Out Points
48 Hrs 17 Hrs
168 Hrs 58 Hrs
500 Hrs 172 Hrs
1000 Hrs 342 Hrs
Note: For Flow-B Equivalent hours calculated based on Voltage & Thermal Acceleration Factors.

Heating Up - Burn-in and Thermal BiTS 2018 Session 7 Presentation 4
March 4-7, 2018 Burn-in & Test Strategies Workshop www.bitsworkshop.org
Experimental Results Comparison
Extended / Accelerated Burn-In Implementation for Cycle Time & Cost Savings 21
The test results were compiled and tabulated for both the Flows:
FLOW – A (Standard Flow) FLOW – B (Accelerated Flow)
Read Out
Points
Test Results Read Out
Points
Test Results
PASS FAIL PASS FAIL
48 Hrs 229 2 BIN7 17 Hrs 228 2 BIN7, 1 BIN4
168 Hrs 228 1BIN4 58 Hrs 228 -
500 Hrs 228 - 172 Hrs 228 -
1000 Hrs 228 - 342 Hrs 228 -
Note: FA done on fails confirmed the fail mode was not due to due to higher
temperature (de-laminations) or due to higher voltage stressing (such as EOS)
Heating Up - Burn-in and Thermal BiTS 2018 Session 7 Presentation 4
March 4-7, 2018 Burn-in & Test Strategies Workshop www.bitsworkshop.org
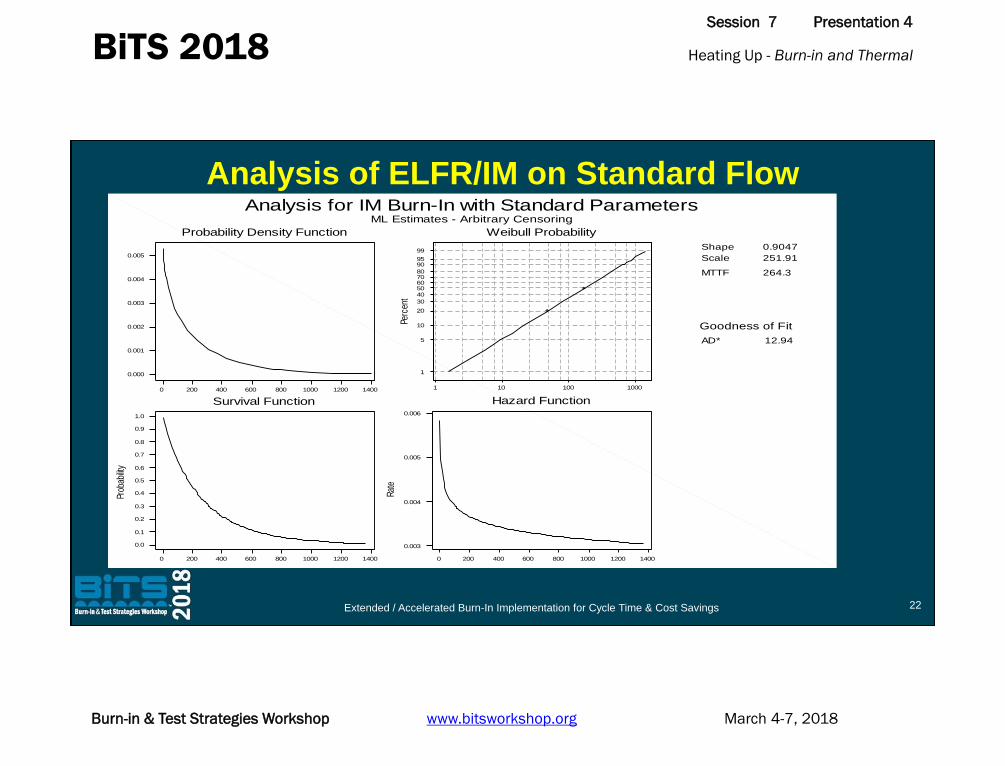
12.94AD*
Goodness of Fit
1000100101
99
9590
8070605040
30
20
10
5
1
Weibull Probability
Perc
ent
1400120010008006004002000
1.0
0.9
0.8
0.7
0.6
0.5
0.4
0.3
0.2
0.1
0.0
Survival Function
Prob
abilit
y
1400120010008006004002000
0.006
0.005
0.004
0.003
Hazard FunctionR
ate
1400120010008006004002000
0.005
0.004
0.003
0.002
0.001
0.000
Probability Density Function
Analysis for IM Burn-In with Standard ParametersML Estimates - Arbitrary Censoring
Shape
Scale
MTTF
0.9047
251.91
264.3
Analysis of ELFR/IM on Standard Flow
Extended / Accelerated Burn-In Implementation for Cycle Time & Cost Savings 22

Heating Up - Burn-in and Thermal BiTS 2018 Session 7 Presentation 4
March 4-7, 2018 Burn-in & Test Strategies Workshop www.bitsworkshop.org
Analysis of ELFR/IM on Accelerated Flow
Extended / Accelerated Burn-In Implementation for Cycle Time & Cost Savings 23
5.838AD*
Goodness of Fit
100.010.01.00.1
99
9590
8070605040
30
20
10
5
1
Weibull Probability
Perc
ent
3002001000
1.0
0.9
0.8
0.7
0.6
0.5
0.4
0.3
0.2
0.1
0.0
Survival Function
Prob
abilit
y
3002001000
0.045
0.040
0.035
0.030
0.025
0.020
0.015
0.010
Hazard Function
Rat
e
3002001000
0.035
0.030
0.025
0.020
0.015
0.010
0.005
0.000
Probability Density Function
Analysis for IM Burn-In with Accelerated ParametersML Estimates - Arbitrary Censoring
Shape
Scale
MTTF
0.8122
51.658
57.908

Heating Up - Burn-in and Thermal BiTS 2018 Session 7 Presentation 4
March 4-7, 2018 Burn-in & Test Strategies Workshop www.bitsworkshop.org
Analysis of Useful Life on Standard Flow
Extended / Accelerated Burn-In Implementation for Cycle Time & Cost Savings 24
10000005000000
99
98
97
96 95
93
90
80
70
60 50
30
10
Time to Failure
Perc
ent
Probability Plot for Std. StartExponential Distribution - ML Estimates - 60.0% CI
Arbitrary Censoring
Shape
Scale
MTTF
StDev
Median
IQR
AD*
1.000
114334
114334
114334
79250
125609
26.153
0 100000 200000 300000 400000 500000
0.0
0.1
0.2
0.3
0.4
0.5
0.6
0.7
0.8
0.9
1.0
Time to Failure
Pro
babili
ty
Parametric Survival Plot for Std. StartExponential Distribution - ML Estimates - 60.0% CI
Arbitrary Censoring
Shape
Scale
MTTF
StDev
Median
IQR
1.000
114334
114334
114334
79250
125609
5000004000003000002000001000000
8.80E-06
8.75E-06
8.70E-06
Time to Failure
Rate
Parametric Hazard Plot for Std. StartExponential Distribution - ML Estimates
Arbitrary Censoring
Shape
Scale
MTTF
StDev
Median
IQR
1.000
114334
114334
114334
79250
125609

Heating Up - Burn-in and Thermal BiTS 2018 Session 7 Presentation 4
March 4-7, 2018 Burn-in & Test Strategies Workshop www.bitsworkshop.org
Analysis of Useful Life on Accelerated Flow
Extended / Accelerated Burn-In Implementation for Cycle Time & Cost Savings 25
8000006000004000002000000
99
98
97
96 95
93
90
80
70
60
50
30
10
Time to Failure
Perc
ent
Probability Plot for Acc. StartExponential Distribution - ML Estimates - 60.0% CI
Arbitrary Censoring
Shape
Scale
MTTF
StDev
Median
IQR
AD*
1.000
78575
78575
78575
54464
86323
26.391
4000003000002000001000000
1.0
0.9
0.8
0.7
0.6
0.5
0.4
0.3
0.2
0.1
0.0
Time to Failure
Pro
babili
ty
Parametric Survival Plot for Acc. StartExponential Distribution - ML Estimates - 60.0% CI
Arbitrary Censoring
Shape
Scale
MTTF
StDev
Median
IQR
1.000
78575
78575
78575
54464
86323
4000003000002000001000000
1.32E-05
1.27E-05
1.22E-05
Time to Failure
Rat
e
Parametric Hazard Plot for Acc. StartExponential Distribution - ML Estimates
Arbitrary Censoring
Shape
Scale
MTTF
StDev
Median
IQR
1.000
78575
78575
78575
54464
86323

Heating Up - Burn-in and Thermal BiTS 2018 Session 7 Presentation 4
March 4-7, 2018 Burn-in & Test Strategies Workshop www.bitsworkshop.org
Comparison of Parameters for Both Flows
Extended / Accelerated Burn-In Implementation for Cycle Time & Cost Savings 26
Parameter Standard Flow Accelerated Flow
Shape Factor 1.0 1.0
Scale Factor 114334 78575
MTTF 114334 78575
Goodness of FIT (AD*) 26.2 26.3
• The Shape factors are exactly = 1 indicating the HTOL Stage for both flows.
• The Constant Instantaneous Failures Rate / Hazard Rate which is characteristic of “Useful
Life” of the “Bath Tub Curve” is seen and established here.
• Ratio of scale factors = Ratio of the MTTFs = 114334/78575 = 1.46.
• The Anderson Darlington’s Goodness of FIT in both the cases are almost same.
The below statistical parameters from the Fail Rate Analysis are compared for both Flows:

Heating Up - Burn-in and Thermal BiTS 2018 Session 7 Presentation 4
March 4-7, 2018 Burn-in & Test Strategies Workshop www.bitsworkshop.org
Implementation on Other Nodes & Savings
Extended / Accelerated Burn-In Implementation for Cycle Time & Cost Savings 27
The below table summarizes different projects that are implemented using this concept
on different technology nodes:
Tech
Node Std. BI Acc. BI
% Cycle Time
Reduction
%
Savings
0.5um Vst: 1.2xVnom
Tst: 125C, 1Khrs
Vst: 1.2xVnom
Tst: 145C, 768hrs 28% 32%
0.35um Vst: 1.2xVnom
Tst: 125C, 1Khrs
Vst: 1.2xVnom
Tst: 145C, 768hrs 28% 32%
0.25um Vst: 1.1xVnom
Tst: 125C, 1Khrs
Vst: 1.3xVnom
Tst: 140C, 342hrs 63% 60%
40nm Vst: 1.2xVnom
Tj: 125C 1000hrs
Vst: 1.4xVnom
Tj: 132C 638hrs 32% 42%
14nm Vst: 1.4xVnom
Tj: 125C, 500hrs
Vst: 1.5xVnom
Tj: 125C, 168hrs 33% 36%

Heating Up - Burn-in and Thermal BiTS 2018 Session 7 Presentation 4
March 4-7, 2018 Burn-in & Test Strategies Workshop www.bitsworkshop.org
Extended / Accelerated Burn-In Implementation for Cycle Time & Cost Savings 28
Advantages of Accelerated BI
No Additional Costs on H/W: With prior planning existing test/stress hardware can be used.
This can be done while designing the stress and test hardware for higher voltages and
temperatures at which the extended Accelerated BI is planned.
Faster Cycle Time: It was shown to have 30~50% cycle time on stress can be achieved.
Faster Feedback to Process/Product *CIPs: With @ 30 to 50% improvement in the stress
cycle time, the feedback on failures if any to Process or product design will be faster.
Cost Savings: With lesser stress hours Vs 1000hrs,
The stress duration on Ongoing Reliability Monitoring (ORM) can be reduced
There by bringing in 30~50% cost savings per run.
If ORMs are run every month, significant cost savings can be accumulated over a year.
*CIPs: Continuous Improvement Process

Heating Up - Burn-in and Thermal BiTS 2018 Session 7 Presentation 4
March 4-7, 2018 Burn-in & Test Strategies Workshop www.bitsworkshop.org
Advantages - 2
Extended / Accelerated Burn-In Implementation for Cycle Time & Cost Savings 29
Faster Reliability Assessments: Any subsequent qualifications or reliability
assessments on Process or products will also see the benefits of reduced
stress hours, such as:
Very useful for any sudden variations in process and/or
To assess Maverick lots’ Reliability assessments.
Better Utilization of Ovens & Testers: With reduced overall stress duration
the stress and test hardware can be used for other purposes.
Operational Advantages: With reduced overall stress the Lab Operations
will be less and more operational Cost savings.

Heating Up - Burn-in and Thermal BiTS 2018 Session 7 Presentation 4
March 4-7, 2018 Burn-in & Test Strategies Workshop www.bitsworkshop.org
Conclusion
Extended / Accelerated Burn-In Implementation for Cycle Time & Cost Savings 30
• It is shown that by implementing the Extended Accelerated Burn-In, upto
30~50% of overall stress duration can be reduced Vs standard 1000 hours
HTOL.
• Still technically able to demonstrate equivalent useful life time coverage.
• The reduced stress hours are translated to significant cost savings when this
concept was used on continuous Process Reliability Monitoring Programs.
• Especially very useful, if few Fabs/products are using the same technology and
those Fabs need to run Process/Product Reliability monitoring.

Heating Up - Burn-in and Thermal BiTS 2018 Session 7 Presentation 4
March 4-7, 2018 Burn-in & Test Strategies Workshop www.bitsworkshop.org
References
• JESD22A-108: Temperature, Bias, and Operating Life Test specification by JEDEC, Solid
State Technology Association.
• JESD-47: Stress-Test-Driven Qualification of Integrated Circuits by JEDEC, Solid State
Technology Association.
• JP-001: Foundry Process Qualification Guidelines for Wafer Fabrication Manufacturing
Sites, by JEDEC.
• JESD659: Failure-Mechanism-Driven Reliability Monitoring, Electronics Industries Alliance,
JEDEC Solid State Technology Association
• Qualifying A Process or Product For Higher Burn-In Voltage/Over Drive Application, by
Krishna Mohan Chavali, BiTS-2017 Workshop Presentation, Mesa, Arizona.
• Statistical Method for Setting up Safe Screen Voltage for Products, by Krishna Mohan
Chavali, BiTS-2017 Workshop Poster, Mesa, Arizona.
Extended / Accelerated Burn-In Implementation for Cycle Time & Cost Savings 31