march 31, 2011 factsheet v2 - edelweissmf.com · factsheet | march 2011 mutual ... investors can...
TRANSCRIPT

PURCHASE our schemes through
STOCK EXCHANGES
Edelweiss gives you one more reason to
SMILE
Factsheet | March 2011
Mutual Fund investments are subject to market risks. Please read the Statement of Additional Information (SAI)
& Scheme Information Document (SID) of the scheme carefully before investing.
For more information, please refer page 2

Schemes of Edelweiss Mutual Fund are now available on the stock exchange platform (MFSS / BSE StAR MF) for Subscriptions & Redemptions. Investors can approach a Trading Member of BSE or NSE registered with stock exchange to get the benefit of this facility.
Please visit www.nseindia.com & www.bseindia.com for more details.For further enquiries, do feel free to get in touch with us at 1800 425 0090 / +91 40 23310090 or email us at [email protected]
What is offered in this new facility? by NSE and BSE respectively for details on the same. The circulars are also This new facility enables purchase/redemption of units of the available on website www.nseindia.com & www.bseindia.com Schemes of Edelweiss Mutual Fund through the Stock Exchange respectively platform. Today, sharebroking outlets are available all over even in rural areas, to facilitate your transactions. Does the investor have to sign any documents with the Trading
Member?What is the electronic platform offered by NSE & BSE for this facility There is a letter to be signed and provided by the investor to the Trading called? Member for registering for this facility. This letter also contains the terms The electronic platform offered by NSE & BSE for this facility is called and conditions of the MFSS/BSE StAR MF facility.Mutual Fund Services System (MFSS) & Bombay Stock Exchange Platform for Allotment and Redemption of Mutual Funds (BSE StAR What confirmation will the investor get for the order placed through the MF) respectively Trading Member?
The investor will receive from the Trading Member a confirmation slip How to transact in units of Edelweiss Mutual Fund Schemes through (which will contain unique confirmation number and date and time the stock exchanges? stamp of order entry) generated from the MFSS/BSE StAR MF system. Till The investor has to approach a Trading Member of Bombay Stock the Trading Member provides allotment details to the investor, the order Exchange ("BSE") or National Stock Exchange ("NSE") who is confirmation slip would be the proof of the transaction. For physical registered with AMFI/NISM as Mutual Fund Advisor and also mode, the investor will receive Statement of Account from the Registrar registered with BSE & NSE as Participant for availing this facility. & Transfer Agent (RTA) directly.
Does the Trading Member of BSE or NSE have to be AMFI certified or What documents are required for making a purchase in the demat empanelled with Edelweiss Asset Management Limited ("Edelweiss mode?AMC") or registered with BSE & NSE to offer this facility? Investors choosing the depository mode can place order for subscription Yes the Trading Member has to have an AMFI Registration Number as currently followed for secondary market activities. The investors (ARN) and has to be empanelled with Edelweiss AMC and also should provide their depository account details along with PAN details to registered with BSE & NSE as Participant to offer this facility. the Member. When an investor desires to hold units in dematerialised
form, KYC performed by DP will be considered as compliance with the Which schemes can be purchased or sold through this facility? applicable requirements specified in this regard in terms of SEBI circular All the schemes except Edelweiss Monthly Interval Fund Series - 1 of ISD/AML/CIR-1/2008. This is in accordance with SEBI circular no. Edelweiss Mutual Fund can be purchased and redeemed through this SEBI/IMD/CIR No.11/183204/2009 dated November 13, 2009.route. Please refer to the Addendum dated 7-Sept-10, 7-Feb-11 & 1-Mar-11 for complete list of eligible schemes. The list of eligible What are the timings for putting in orders which are valid for the same schemes is subject to change from time to time. day NAV?
Currently, the timings for entering the orders on the respective platforms Is there any limit for value of transactions through stock exchanges? are between 9.00 a.m. to 3.00 p.m. The applicability of NAV will be Currently, purchase of upto `1 crore only be done through stock subject to guidelines issued by SEBI on Uniform cut-off timings for exchanges. For physical transactions, the maximum redemption applicability of NAV of Mutual Fund Scheme(s)/Plan(s).amount is ̀ 1 lac per folio per day. Please refer to the circulars issued
can
For more details please refer the FAQs given below:
Advantages:
• Easy One-click buy
• Convenient to transact
• No additional KYC required
• No need to fill application forms
• Sharebroking offices are also available in rural areas
PURCHASE our schemes through
STOCK EXCHANGES

level over the last quarter.The Road to Normal
Over the last quarter fixed income investors had gotten used to seeing a yield curve that is almost completely flat. The outstanding feature of March was that the yield curve began reforming. Liquidity is back in the market and the yield curve now actually reflects the apprehension of the market that inflation may pick up.
Unlike the middle of 2010 when the AAA rates in the fixed income market were rising faster than the increase in repo rates, the increase in repo rates is now being mirrored in the increase in AAA rates.
Inflation is not the issue that it was in 2010 for the RBI. The key issue facing us as fixed income investors is whether this moderation will continue or will the RBI take further action on the interest rate front?
There is good reason for this. The Reserve Bank, guided by the chart along side sees a Our belief is that going forward we are likely to see a slow increase in interest rates significant flattening in the WPI Index, the benchmark used to measure inflation. with the wild card being oil prices. If oil prices stay for a few months at current levels Where there is a year on year change, there has been hardly any change in the price the RBI could increase the pace of tightening.
Looking back at the last year it seems to be a tale of two halves. The first half of the Moving forward, the coming year begins with many “averages” – index valuations at year was a great time for equities but the second half was a very different picture. 15 times earnings are close to historical averages, anticipated earnings growth at
around 15%-20% is also close to average. When so many averages come together, the Over the first half he NIFTY rose nearly 15%, and the Mid Cap index by 19%. In the result is rarely an average year. second half of the year the NIFTY fell by 3.3.%, not a steep drop, but the Mid cap Index fell by nearly 12.3%, giving up two thirds of the year’s gains. It is worth noting that the The market is optimistic with earnings revisions still strongly positive as can be seen CNX Midcap index represents companies that rank between 100 and 200 by market from the chart below.capitalization in India. These are not small companies!
This divergence in performance is starker when one considers that fully 75% of the NIFTY market cap is the 20 largest companies in India. In other words if one was not in the top 25 companies by market cap in the second half, the markets were a lot less cheerier.
Such variations in performance are not uncommon, and the wider market now is cheaper than the NIFTY. Unless overall economic conditions turn a lot less favorable it is unlikely that mid sized companies will continue underperforming.
A few significant events in the macro environment that could have significant short term impact on the Indian equity market.
1. The first is the evolution of the price of oil. The numbers are fairly simple – every US$ 10 increase puts US$ 6 billion of pressure on the current and fiscal deficit of India. Oil above US 120 per barrel will pose a
Apart from the divergence in the performance of the largest companies and the rest challenge for the economy
of the market, the lack of volatility was remarkable last year. The table below shows 2. The last quantitative easing program will end in June and indications
the drawdowns ̂ over the last few years. 2010 stands out in terms of its resilience.are that it will not get extended or replaced.
3. Commodity prices, other than oil have been on a tear since September 2010 and we expect that these will begin impacting margins for many sectors.
All in all, we expect a volatile year, where buying into dips and sticking to high quality growing companies will play out well for investors.
DEBT MARKET OUTLOOK:
EQUITY MARKET OUTLOOK:
Markets & Beyond
2000 -35.3%2001 -39.7%2002 -22.7%2003 -16.0%2004 -29.9%2005 -13.0%2006 -29.9%2007 -15.3%2008 -59.9%2009 -17.6%2010 -10.7%
AAA 1 year CD rates 9.55 9.08
Repo Rates 6.75 6.25
Spread 2.80 2.83
31-Mar-11 31-Dec-10
Nifty 15.28 386.74
CNX Midcap 12.17 676.12
Estimated P/E Earnings Estimate
H1-FY2011 14.9% 18.9%
H2-FY2011 -3.3% -12.3%
Nifty CNX Midcap
Wholesale Price Index
135
137
139
141
143
145
147
149
Ap
r-1
0
May
-10
Jun
-10
Jul-
10
Au
g-1
0
Sep
-10
Oct
-10
No
v-1
0
De
c-1
0
Jan
-11
Feb
-11
Nifty EPS Estimates
300
305
310
315
320
325
330
335
340
345
350
01
-Ap
r-1
0
01
- M
ay
-10
01
-Ju
n-1
0
01
-Ju
l-1
0
01
-Au
g-1
0
01
-Se
p-1
0
01
-Oct
-10
01
-No
v-1
0
01
-De
c-1
0
01
-Ja
n-1
1
01
-Fe
b-1
1
01
-Ma
r-1
1
01
-Ap
r-1
1
^ Drawdown is defined as the peak-to-trough decline during a specific record period of an investment, fund or commodity. A drawdown is usually quoted as the percentage between the peak and the trough.
Source: Bloomberg
Source: Bloomberg
Source: Bloomberg
Source: Bloomberg
Source: Bloomberg
Source: NSE India data computed internally

Industry Allocation
As on March 31, 2011
Notes: • **Thinly traded/Non traded securities as defined in SEBI Regulations and Guidelines. • Fixed Deposit placed under margin : `300 (in Lakhs). Total Exposure to derivative instruments (excluding reversed positions) as on 31/03/2011 : ` 247.32 (in Lakhs).
• All corporate ratings are assigned by rating agencies like CRISIL; CARE; ICRA; FITCH.
ABSOLUTE RETURN Fund*
Fund Performance VS Benchmark Index
Portfolio
EQUITY & EQUITY RELATED 70.69Listed / awaiting listing on the stock exchangesAuto
Auto Ancillaries
Banks
Cement
Construction
Construction Project
Consumer Non Durables
Diversified
Ferrous Metals
Finance
Gas
Industrial Capital Goods
Industrial Products
Media & Entertainment
Minerals/Mining
Mahindra & Mahindra 2.18Hero Honda Motors 0.63Tata Motors 0.33
Bosch 1.46Motherson Sumi Systems 0.33
HDFC Bank 2.98ICICI Bank 2.48Axis Bank 1.75State Bank of India 1.07
ACC 0.55
Indiabulls Real Estate 0.49
Larsen & Toubro 1.18
ITC 2.24Titan Industries 0.98Nestle India 0.36Godrej Consumer Products 0.34Dabur India 0.34Asian Paints 0.34United Breweries 0.28
Aditya Birla Nuvo 0.30Hindustan Unilever 0.03
Tata Steel 0.53Jindal Steel & Power 0.45
Housing Development Finance Corporation 2.63Mahindra & Mahindra Financial Services 0.32
GAIL (India) 0.63Petronet LNG 0.31
Siemens 6.12Bharat Heavy Electricals 0.27
Bharat Forge 0.32
D. B. Corp 0.30
NMDC 0.91
Name of Instrument % to Net Assets Name of Instrument % to Net Assets Name of Instrument % to Net Assets
Non - Ferrous Metals
Oil
Petroleum Products
Pharmaceuticals
Power
Software
Telecom - Services
Transportation
Listed / awaiting listing on the stock exchanges: Reversed PositionsCement
Construction Project
Ferrous Metals
Industrial Capital Goods
Sterlite Industries ( India ) 0.44
Oil & Natural Gas Corpn 2.65Cairn India 1.04Oil India 0.46
Reliance Industries 1.43Bharat Petroleum Corpn. 1.02
Dr. Reddy's Laboratories 1.10Cadila Healthcare 0.49GlaxoSmithKline Pharmaceuticals 0.45Divi's Laboratories 0.31
Power Grid Corporation of India 1.47Tata Power Co. 1.12NTPC 0.68
Patni Computer Systems 2.99Tata Consultancy Services 2.30Infosys Technologies 2.21Wipro 1.11HCL Technologies 1.00Tech Mahindra 0.28
Bharti Airtel 1.31Idea Cellular 0.97
Mundra Port and Special Economic Zone 0.84Container Corporation of India 0.48The Great Eastern Shipping Co. 0.29
Jaiprakash Associates Apr 2011 -0.74Jaiprakash Associates 0.74
Lanco Infratech Apr 2011 -0.87Lanco Infratech 0.86
JSW Steel Apr 2011 -0.68JSW Steel 0.67
Siemens Apr 2011 -0.87Siemens May 2011 -0.78Siemens 1.75Suzlon Energy Apr 2011 -1.40Suzlon Energy 1.38
Media & Entertainment
Pharmaceuticals
Power
Retailing
Software
Transportation
DERIVATIVES
MONEY MARKET INSTRUMENT 16.56Certificate of Deposit** P1+
Commercial Paper** P1+
BONDS & NCDs 0.02Unlisted / awaiting listingLAA+
OTHERS 12.73Cash & Cash EquivalentsFixed DepositUnrated
GRAND TOTAL 100.00
Reliance Mediawork Apr 2011 -0.41Reliance Mediawork 0.41
Orchid Chemicals & Pharmaceuticals Apr 2011 -1.02Orchid Chemicals & Pharmaceuticals 1.01
PTC India Apr 2011 -1.06PTC India 1.05GVK Power & Infrastructure Apr 2011 -1.23GVK Power & Infrastructure 1.21
Pantaloon Retail (India) Apr 2011 -0.80Pantaloon Retail (India) 0.78
MphasiS Apr 2011 -0.09MphasiS 0.09Firstsource Solutions Apr 2011 -0.46Firstsource Solutions 0.45
Kingfisher Airlines Apr 2011 -0.44Kingfisher Airlines 0.43
Hindustan Unilever Apr 2011 1.24NIFTY 5700 Put Apr 2011 0.13NIFTY Index Future Apr 2011 -3.80
IDBI Bank 6.27
Kotak Mahindra Prime 10.29
Dr. Reddy's Laboratories 0.02
IDBI Bank 1.05The Federal Bank 3.14Corporation Bank 2.09CBLO / Reverse Repo Investments 4.06Net Receivable/Payable 2.39
Past performance may or may not be sustained in future.The above information is not necessarily indicative of future results and may not necessarily provide a basis for comparison with other investments.Inception Date is August 20, 2009. Since Inception returns are calculated on `10/- invested at InceptionReturns shown above are for Growth Option only Performance of the Dividend Option for the investor would be net of the dividend distribution tax, as applicable. Returns less than one year are absolute and returns equal to or greater than one year are compounded annualized (CAGR).
NAV As on March 31, 2011 ` Per UnitGrowth Option 11.20Dividend Option 11.04
* The Scheme is an equity - oriented scheme. Investors in the Scheme are not being offered any guaranteed / assured returns.
(Returns in %)
Edelweiss Absolute Return Fund - Growth
CRISIL MIP Blended Index
Dividend HistoryDividend is declared on the face value of Rs. 10/- per unit. Dividend is paid subject to availability of distributable surplus. After payment of dividend the NAV of the Dividend Option of the Scheme falls to the extent of the dividend pay out and statutory levy if any. Past Performance may or may not be sustained in the future. 0.165 per unit
Record Date Plan/ Option Name NAV on Record Date (`) Amount of Dividend (`)
28/01/2011 Dividend Plan 11.20
0.51%
0.53%
0.56%0.74%
0.81%
0.92%
1.52%
1.56%
1.63%
1.97%
2.68%2.99%
3.81%
3.92%
4.10%
4.92%
5.24%
5.46%
6.94%8.16%
10.68%
13.84%
16.52%
Media & EntertainmentIndustrial Products
Diversified
Non - Ferrous Metals
Construction
Cement
Minerals/Mining
Gas
Ferrous MetalsConstruction Project
Transportation
Auto Ancillaries
Telecom - Services
Pharmaceuticals
Petroleum Products
Finance
AutoPower
Oil
Consumer Non Durables
Industrial Capital Goods
Banks
Software
- 2.18
6.777.29
1.65
6.177.30
4
2
0
2
4
6
8
6 month 1 Year Since inception

Notes:• All corporate ratings are assigned by rating agencies like CRISIL; CARE; ICRA; FITCH. • Fixed Deposit placed under margin : `50 (in Lakhs). Total Exposure to derivative instruments as on 31/03/2011 : `207.98 (in Lakhs).
EQUITY & EQUITY RELATED 87.08
Listed / awaiting listing on the stock exchanges
Auto
Auto Ancillaries
Banks
Cement
Construction Project
Consumer Non Durables
Diversified
Ferrous Metals
Mahindra & Mahindra 3.57
Hero Honda Motors 0.89
Bosch 2.34
Motherson Sumi Systems 1.60
HDFC Bank 5.18
ICICI Bank 3.91
Axis Bank 2.63
State Bank of India 1.88
UCO Bank 0.70
ACC 0.91
Larsen & Toubro 1.48
ITC 2.76
Titan Industries 1.47
United Breweries 1.33
Nestle India 0.66
Dabur India 0.62
Godrej Consumer Products 0.61
Asian Paints 0.59
Hindustan Unilever 2.20
Aditya Birla Nuvo 1.43
Jindal Steel & Power 1.23
Tata Steel 1.14
Name of Instrument % to Net Assets Name of Instrument % to Net Assets Name of Instrument % to Net Assets
Finance
Gas
Industrial Products
Media & Entertainment
Minerals/Mining
Oil
Petroleum Products
Pharmaceuticals
Power
Software
Housing Development Finance Corporation 3.87
Mahindra & Mahindra Financial Services 1.54
Petronet LNG 1.44
GAIL (India) 0.87
Indraprastha Gas 0.69
Bharat Forge 1.53
D. B. Corp 1.48
NMDC 1.35
Oil & Natural Gas Corpn 3.53
Cairn India 1.39
Oil India 0.86
Reliance Industries 4.41
Bharat Petroleum Corpn. 1.08
Dr. Reddy's Laboratories 1.28
Divi's Laboratories 1.24
Cadila Healthcare 1.19
GlaxoSmithKline Pharmaceuticals 1.09
Power Grid Corporation of India 2.18
Tata Power Co. 1.32
NTPC 0.90
Tata Consultancy Services 3.79
Software
Telecom - Services
Transportation
DERIVATIVES
BONDS & NCDs 0.02
Unlisted / awaiting listing
LAA+
OTHERS 12.90
Cash & Cash Equivalents
Fixed Deposit
GRAND TOTAL 100.00
Infosys Technologies 1.61
Tech Mahindra 1.43
Wipro 1.40
HCL Technologies 1.29
Bharti Airtel 1.35
Idea Cellular 1.34
The Great Eastern Shipping Co. 1.29
Mundra Port and Special Economic Zone 1.18
NIFTY Index Future Apr 2011 12.24
Dr. Reddy's Laboratories 0.02
The Federal Bank 2.94CBLO / Reverse Repo Investments 10.96
Net Receivable/Payable -1.00
Portfolio
As on March 31, 2011
NAV As on March 31, 2011 ` Per Unit
Plan A - Growth
Plan B - Growth
Plan C - Growth
S & P CNX Nifty
Fund Performance VS Benchmark Index
Plan A - Growth OptionPlan A - Dividend Option 14.14 Plan B - Growth Option 14.20Plan B - Dividend Option 14.38 Plan C - Growth Option 14.24Plan C - Dividend Option 14.24
14.14
Industry Allocation
DIVERSIFIED GROWTH EQUITY TOP 100 (E.D.G.E. Top 100 ) Fund
(Returns in %)
Past performance may or may not be sustained in future.The above information is not necessarily indicative of future results and may not necessarily provide a basis for comparison with other investments.Inception Date is May 20, 2009. Since Inception returns are calculated on `10/- invested at InceptionReturns shown above are for Growth Option only.Performance of the Dividend Option for the investor would be net of the dividend distribution tax, as applicable.Returns less than one year are absolute and returns equal to or greater than one year are compounded annualized (CAGR).
1.04%
1.55%
1.70%
1.70%
1.76%
2.72%
2.84%
3.09%
3.44%
4.17%
4.53%
5.06%
5.13%
5.52%
6.21%
6.30%
6.64%
9.25%
10.93%
16.42%
Cement
Minerals/Mining
Construction Project
Media & Entertainment
Industrial Products
Ferrous Metals
Transportation
Telecom - Services
Gas
Diversified
Auto Ancillaries
Power
Auto
Pharmaceuticals
Finance
Petroleum Products
Oil
Consumer Non Durables
Software
Banks
-5.80
8.52
20.44
-5.77
8.73
20.71
-5.76
8.79
20.89
-3.25
11.14
18.23
- 10
- 5
0
5
10
15
20
25
6 month 1 Year Since inception

Edelweiss ELSS Fund - Growth
S & P CNX Nifty
Industry Allocation
NAV As on March 31, 2011 ` Per Unit
Fund Performance VS Benchmark Index
As on March 31, 2011
Past performance may or may not be sustained in future.The above information is not necessarily indicative of future results and may not necessarily provide a basis for comparison with other investments.Inception Date is December 30, 2008. Since Inception returns are calculated on ̀ 10/- invested at InceptionReturns shown above are for Growth Option onlyPerformance of the Dividend Option for the investor would be net of the dividend distribution tax, as applicable.Returns less than one year are absolute and returns equal to or greater than one year are compounded annualized (CAGR).
Growth Option 19.16 Dividend Option 13.14
ELSS Fund
EQUITY & EQUITY RELATED 89.61
Listed / awaiting listing on the stock exchanges
Auto
Auto Ancillaries
Banks
Cement
Construction Project
Consumer Non Durables
Mahindra & Mahindra 2.25
Hero Honda Motors 0.90
Bosch 3.22
Motherson Sumi Systems 1.78
HDFC Bank 4.50
ICICI Bank 4.06
Axis Bank 3.14
UCO Bank 2.23
ACC 0.90
Larsen & Toubro 1.77
ITC 2.25
Titan Industries 1.84
United Breweries 1.34
Godrej Consumer Products 0.90
Dabur India 0.89
Asian Paints 0.88
Nestle India 0.88
Goodlass Nerolac Paints 0.50
Britannia Industries 0.46
Emami 0.45
Name of Instrument % to Net Assets Name of Instrument % to Net Assets Name of Instrument % to Net Assets
Diversified
Ferrous Metals
Finance
Gas
Healthcare Services
Industrial Products
Media & Entertainment
Minerals/Mining
Oil
Petroleum Products
Pharmaceuticals
Hindustan Unilever 1.81
Aditya Birla Nuvo 0.90
Tata Steel 2.69
Housing Development Finance Corporation 2.26
Mahindra & Mahindra Financial Services 1.73
Petronet LNG 1.81
GAIL (India) 0.90
Indraprastha Gas 0.89
Apollo Hospitals Enterprise 0.88
Bharat Forge 1.81
D. B. Corp 1.76
NMDC 1.79
Oil & Natural Gas Corpn 3.17
Cairn India 1.77
Oil India 1.34
Reliance Industries 2.70
Sun Pharmaceuticals Industries 1.75
Cadila Healthcare 1.34
Pharmaceuticals
Power
Software
Telecom - Services
Transportation
OTHERS 10.39
Cash & Cash Equivalents
GRAND TOTAL 100.00
Dr. Reddy's Laboratories 1.33
GlaxoSmithKline Pharmaceuticals 1.29
Divi's Laboratories 0.91
Aurobindo Pharma 0.90
Power Grid Corporation of India 1.80
NTPC 0.91
Tata Power Co. 0.89
Tata Consultancy Services 2.72
Infosys Technologies 2.71
HCL Technologies 1.78
Tech Mahindra 1.70
Wipro 0.91
Idea Cellular 1.79
Bharti Airtel 1.35
The Great Eastern Shipping Co. 0.89
Mundra Port and Special Economic Zone 0.89
Container Corporation of India 0.45
CBLO / Reverse Repo Investments 3.87
Net Receivable/Payable 6.52
Portfolio
Dividend History
(Returns in %)
Dividend is declared on the face value of Rs. 10/- per unit. Dividend is paid subject to availability of distributable surplus. After payment of dividend the NAV of the Dividend Option of the Scheme falls to the extent of the dividend pay out and statutory levy if any. Past Performance may or may not be sustained in the future. 2.00 per unit
2.00 per unit
2.00 per unit
Record Date Plan/ Option Name NAV on Record Date (`) Amount of Dividend (`)
24/12/2010 Dividend Plan 20.19
21/01/2011 Dividend Plan 17.45
25/02/2011 Dividend Plan 14.20
0.98%
1.00%
1.97%
1.97%
2.00%
2.02%
2.48%
3.00%
3.01%
3.02%
3.50%
3.51%
4.01%
4.01%
4.46%
5.58%
7.00%
8.39%
10.97%
11.59%
15.54%
Healthcare Services
Cement
Media & Entertainment
Construction Project
Minerals/Mining
Industrial Products
Transportation
Ferrous Metals
Petroleum Products
Diversified
Telecom - Services
Auto
Gas
Power
Finance
Auto Ancillaries
Oil
Pharmaceuticals
Software
Consumer Non Durables
Banks
-7.88
9.17
33.52
-3.25
11.14
34.81
- 15
- 10
- 5
0
5
10
15
20
25
30
35
40
6 month 1 Year Since inception

Notes:• Fixed Deposit placed under margin : `0 (in Lakhs). Total Exposure to derivative instruments as on 31/03/2011 : `0(in Lakhs).
Portfolio
EQUITY & EQUITY RELATED 96.38
Listed / awaiting listing on the stock exchanges
Auto
Banks
Cement
Construction
Construction Project
Consumer Non Durables
Diversified
Ferrous Metals
Tata Motors 2.39Mahindra & Mahindra 1.83Bajaj Auto 1.09Maruti Suzuki India 0.92Hero Honda Motors 0.83
ICICI Bank 7.06HDFC Bank 4.60State Bank of India 3.89Axis Bank 1.98Kotak Mahindra Bank 0.88Punjab National Bank 0.88
Ambuja Cement 0.67Jaiprakash Associates 0.58ACC 0.58
DLF 0.53
Larsen & Toubro 4.86
ITC 5.31
Hindustan Unilever 1.65
Tata Steel 2.25Jindal Steel & Power 1.49Steel Authority of India 0.55
Name of Instrument % to Net Assets Name of Instrument % to Net Assets Name of Instrument % to Net Assets
Finance
Gas
Industrial Capital Goods
Minerals / Mining
Non - Ferrous Metals
Oil
Petroleum Products
Pharmaceuticals
Power
Housing Development Finance Corporation 5.00Infrastructure Development Finance Company 0.90Reliance Capital 0.37
GAIL (India) 1.15
Bharat Heavy Electricals 1.79Siemens 0.72
Sesa Goa 0.61
Hindalco Industries 1.47Sterlite Industries ( India ) 1.36
Oil & Natural Gas Corpn 2.16Cairn India 0.84
Reliance Industries 9.76Bharat Petroleum Corpn. 0.43
Dr. Reddy's Laboratories 1.14Sun Pharmaceuticals Industries 0.91Cipla 0.89Ranbaxy Laboratories 0.37
NTPC 1.35Tata Power Co. 1.18Power Grid Corporation of India 0.79Reliance Infrastructure 0.52Reliance Power 0.40
Software
Telecom - Services
Textiles - Synthetic
BONDS & NCDs 0.02Unlisted/ awaiting listing LAA+
OTHERS 3.61
Cash & Cash Equivalents
Grand Total 100.00
Infosys Technologies 8.56Tata Consultancy Services 3.30Wipro 1.34HCL Technologies 0.63
Bharti Airtel 2.37Reliance Communications 0.39
Grasim Industries 0.86
Dr. Reddy's Laboratories 0.02
CBLO / Reverse Repo Investments 9.96Net Receivable/Payable -6.35
As on March 31, 2011
NIFTY ENHANCER #Fund
Industry AllocationPlan A - Growth (Inception date August 12, 2009)
Plan B - Growth (Inception date June 16, 2009)
S & P CNX Nifty
Fund Performance VS Benchmark Index
NAV As on March 31, 2011 ` Per UnitPlan A - Growth Option 13.41Plan A - Dividend Option 12.23Plan B - Growth Option 13.23Plan B - Dividend Option 13.49
@Plan C - Growth Option - Plan C - Dividend Option 11.86
Past performance may or may not be sustained in future.The above information is not necessarily indicative of future results and may not necessarily provide a basis for comparison with other investments. Since Inception returns are calculated on ̀ 10/- invested at InceptionReturns shown above are for Growth Option only Performance of the Dividend Option for the investor would be net of the dividend distribution tax, as applicable.Returns less than one year are absolute and returns equal to or greater than one year are compounded annualized (CAGR).
@There are no investors under this option.
(Returns in %)
0.55%
0.63%
0.89%
1.19%
1.71%
1.90%
2.61%
2.87%
2.94%
3.11%
3.44%
4.41%
4.45%
5.04%
5.51%
6.51%
7.32%
10.57%
14.34%
20.02%
Construction
Minerals / Mining
Textiles - Synthetic
Gas
Diversified
Cement
Industrial Capital Goods
Telecom - Services
Non - Ferrous Metals
Oil
Pharmaceuticals
Power
Ferrous Metals
Construction Project
Consumer Non Durables
Finance
Auto
Petroleum Products
Software
Banks
-2.33
13.45
19.68
-2.93
12.69
16.94
-3.25
11.14
17.9115.36
-5.00
0.00
5.00
10.00
15.00
20.00
25.00
6 month 1 Year Since inception
# “S&P®” and “Standard and Poor's®” are trademarks of the McGraw-hill Companies, Inc. (“S&P”), and have been licensed for use by India Index Services & Products Limited in connection with the S&P CNX Nifty Index. “The Product is not sponsored, endorsed, sold or promoted by India Index Services & Products Limited ("IISL") or Standard & Poor's, a division of The McGraw-Hill Companies, Inc. ("S&P"). Neither IISL nor S&P makes any representation or warranty, express or implied, to the owners of the Product or any member of the public regarding the advisability of investing in securities generally or in the Product. Please read the full Disclaimers in relation to the S&P CNX Nifty Index in the Offer Document / Prospectus / Information Statement.

99.72% 0.28%
Portfolio
Name of Instrument % to Net Assets
As on March 31, 2011
Dividend is declared on the face value of Rs. 10/- per unit. Dividend is paid subject to availability of distributable surplus. After payment of dividend the NAV of the Dividend Option of the Scheme falls to the extent of the dividend pay out and statutory levy if any. Past Performance may or may not be sustained in the future.
LIQUID Fund
Dividend History
NAV As on March 31, 2011 ` Per Unit
^ There are no investors under this option
Past performance may or may not be sustained in future.The above information is not necessarily indicative of future results and may not necessarily provide a basis for comparison with other investments.Since Inception returns are calculated on ̀ 10/- invested at Inception.Returns shown above are for Growth Option only.Performance of the Dividend Option for the investor would be net of the dividend distribution tax, as applicable.Returns less than one year are absolute and returns equal to or greater than one year are compounded annualized (CAGR).^^^There are no investor under this Plan prior to February 2, 2011. Hence the returns for 3 months, 6 months & 1 year is not provided.
0.035974 per unit 0.035974 per unit
per unit
10.0599 0.048713 per unit 0.048713 per unit
Record Date Plan/ Option Name NAV on Amount of Amount of
Record Date (`) Dividend - Retail (`) Dividend - Corporate (`)
31/01/2011 Retail - Dividend 10.0444
(Monthly)
28/02/2011 Retail - Dividend 10.0500 0.040767 per unit 0.040767
(Monthly)
31/03/2011 Retail - Dividend
(Monthly)
Rated AAAf
@@by CRISIL
Retail Plan - Growth OptionRetail Plan - Dividend Daily Option 10.0000Retail Plan - Dividend Weekly Option^ -Retail Plan - Dividend Fortnightly Option^ -Retail Plan - Dividend Monthly OptionInstitutional Plan - Growth Option 10.1186Institutional Plan - Dividend Daily Option 10.0000Institutional Plan - Dividend Weekly Option^ -Institutional Plan - Dividend Fortnightly Option^ - Institutional Plan - Dividend Monthly Option^ -Super Institutional Plan - Growth Option^ -Super Institutional Plan - Dividend Daily Option^ -Super Institutional Plan - Dividend Weekly Option^ -Super Institutional Plan - Dividend Fortnightly Option^ - Super Institutional Plan - Dividend Monthly Option^ -
11.3597
10.0599
Rating ProfileSector / Rating PercentA1+ 68.68P1+ 31.04Cash & Cash Equivalent 0.28
Total 100.00
All corporate ratings are assigned by rating agencies like CRISIL, CARE, ICRA, FITCH.**Thinly traded/Non traded securities as defined in SEBI Regulations and Guidelines.
Asset Allocation
Money Market Instrument
MONEY MARKET INSTRUMENT 99.72Certificate of Deposit**A+ / P1+
OTHERS 0.28Cash & Cash Equivalents
GRAND TOTAL 100.00
The Federal Bank 38.73IDBI Bank 31.04Axis Bank 19.08HDFC Bank 10.86
CBLO / Reverse Repo Investments 0.40Net Receivable/Payable -0.11
Cash & Cash Equivalent
Fund Performance VS Benchmark Index
Retail Plan - Growth Crisil Liquid Fund Index
(Returns in %)
Institutional Plan - Growth ^^^
Since (Retail Plan- Sept 9, 08)
Inception Since (Institutional
Plan - Feb 2, 11)
Inception
@@AAAf:CRISIL AAAf Rating Methodology for Edelweiss Liquid FundAAAf The fund’s portfolio holdings provide very strong protection against losses from credit defaults. The credit quality ratings are based on an analysis of the fund’s investment philosophy, its management, investment strategies, operational policies and internal controls. Credit quality incorporates the credit risk of securities and the counterparty risk involved in transactions CRISIL has developed a Credit Quality Matrix to evaluate a bond fund’s overall level of protection against losses associated with credit default. The matrix is a set of credit factors & credit scores derived scientifically from CRISIL’s rating default and transition rates over past ten years. Ranking source: CRISIL FundServices, CRISIL Ltd.Disclaimer: A CRISIL credit quality rating on a bond fund reflects CRISIL's current opinion on the degree of protection offered by the rated instrument from losses related to credit default. It does not constitute an audit by CRISIL of the fund house, the scheme or companies in the scheme's portfolio. CRISIL does not guarantee the completeness or accuracy of information on which the rating is based. A CRISIL rating is not a recommendation to buy, sell or hold the rated scheme: it does not comment on the market price or suitability for a particular investor.Past performance may or may not be sustained in future
6.89 6.907.28
6.49 6.16
5.34 5.11
7.43 7.48 7.79 7.68
8.67 8.40 8.387.96
7.43
6.21 5.92
8.51
0%
1%
2%
3%
4%
5%
6%
7%
8%
9%
10%
7 days 15 days 30 days 3 months 6 months 1 Year
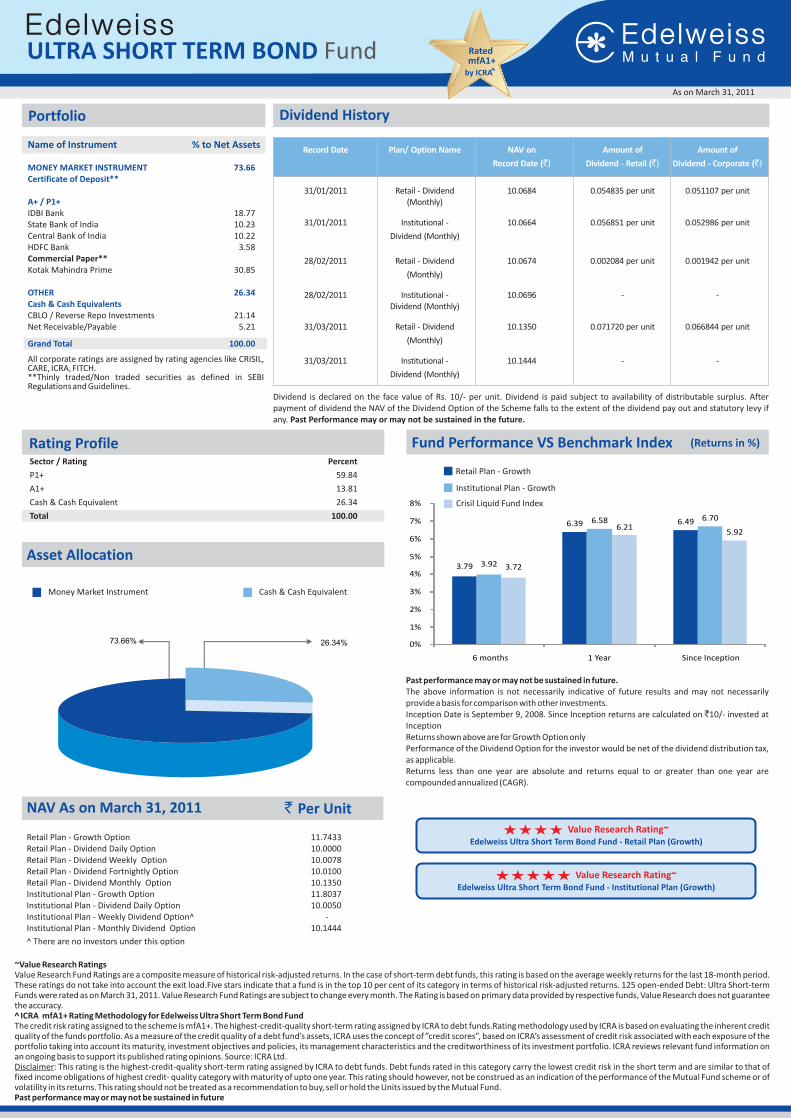
3.79
6.39 6.49
3.92
6.58 6.70
3.72
6.215.92
0%
1%
2%
3%
4%
5%
6%
7%
8%
6 months 1 Year Since Inception
All corporate ratings are assigned by rating agencies like CRISIL, CARE, ICRA, FITCH.**Thinly traded/Non traded securities as defined in SEBI Regulations and Guidelines.
Portfolio
Name of Instrument % to Net Assets
0.054835 per unit 0.051107 per unit
0.056851 per unit 0.052986 per unit
0.071720 per unit 0.066844 per unit
- -
Record Date Plan/ Option Name NAV on Amount of Amount of
Record Date (`) Dividend - Retail (`) Dividend - Corporate (`)
31/01/2011 Retail - Dividend 10.0684(Monthly)
31/01/2011 Institutional - 10.0664
Dividend (Monthly)
28/02/2011 Retail - Dividend 10.0674 0.002084 per unit 0.001942 per unit
(Monthly)
28/02/2011 Institutional - 10.0696 - -Dividend (Monthly)
31/03/2011 Retail - Dividend 10.1350
(Monthly)
31/03/2011 Institutional - 10.1444
Dividend (Monthly)
Dividend is declared on the face value of Rs. 10/- per unit. Dividend is paid subject to availability of distributable surplus. After payment of dividend the NAV of the Dividend Option of the Scheme falls to the extent of the dividend pay out and statutory levy if any. Past Performance may or may not be sustained in the future.
Dividend History
Asset Allocation
Money Market Instrument
As on March 31, 2011
ULTRA SHORT TERM BOND Fund
Sector / Rating Percent
P1+ 59.84
A1+ 13.81
Cash & Cash Equivalent 26.34
Total 100.00
Rating Profile
NAV As on March 31, 2011 ` Per Unit
Retail Plan - Growth Option 11.7433Retail Plan - Dividend Daily Option 10.0000Retail Plan - Dividend Weekly Option 10.0078 Retail Plan - Dividend Fortnightly Option 10.0100Retail Plan - Dividend Monthly Option 10.1350 Institutional Plan - Growth Option 11.8037 Institutional Plan - Dividend Daily Option 10.0050Institutional Plan - Weekly Dividend Option^ -Institutional Plan - Monthly Dividend Option 10.1444
Cash & Cash Equivalent
Fund Performance VS Benchmark Index
Past performance may or may not be sustained in future.The above information is not necessarily indicative of future results and may not necessarily provide a basis for comparison with other investments.Inception Date is September 9, 2008. Since Inception returns are calculated on `10/- invested at InceptionReturns shown above are for Growth Option onlyPerformance of the Dividend Option for the investor would be net of the dividend distribution tax, as applicable.Returns less than one year are absolute and returns equal to or greater than one year are compounded annualized (CAGR).
Retail Plan - Growth
Institutional Plan - Growth
Crisil Liquid Fund Index
(Returns in %)
Edelweiss Ultra Short Term Bond Fund - Institutional Plan (Growth)
Value Research Rating~
Edelweiss Ultra Short Term Bond Fund - Retail Plan (Growth)
Value Research Rating~
Rated mfA1+
^by ICRA
^ There are no investors under this option
MONEY MARKET INSTRUMENT 73.66Certificate of Deposit**
A+ / P1+
OTHER 26.34Cash & Cash Equivalents
Grand Total 100.00
IDBI Bank 18.77State Bank of India 10.23Central Bank of India 10.22HDFC Bank 3.58Commercial Paper**Kotak Mahindra Prime 30.85
CBLO / Reverse Repo Investments 21.14Net Receivable/Payable 5.21
73.66% 26.34%
~Value Research RatingsValue Research Fund Ratings are a composite measure of historical risk-adjusted returns. In the case of short-term debt funds, this rating is based on the average weekly returns for the last 18-month period. These ratings do not take into account the exit load.Five stars indicate that a fund is in the top 10 per cent of its category in terms of historical risk-adjusted returns. 125 open-ended Debt: Ultra Short-term Funds were rated as on March 31, 2011. Value Research Fund Ratings are subject to change every month. The Rating is based on primary data provided by respective funds, Value Research does not guarantee the accuracy. ^ ICRA mfA1+ Rating Methodology for Edelweiss Ultra Short Term Bond FundThe credit risk rating assigned to the scheme is mfA1+. The highest-credit-quality short-term rating assigned by ICRA to debt funds.Rating methodology used by ICRA is based on evaluating the inherent credit quality of the funds portfolio. As a measure of the credit quality of a debt fund’s assets, ICRA uses the concept of ”credit scores”, based on ICRA’s assessment of credit risk associated with each exposure of the portfolio taking into account its maturity, investment objectives and policies, its management characteristics and the creditworthiness of its investment portfolio. ICRA reviews relevant fund information on an ongoing basis to support its published rating opinions. Source: ICRA Ltd.Disclaimer: This rating is the highest-credit-quality short-term rating assigned by ICRA to debt funds. Debt funds rated in this category carry the lowest credit risk in the short term and are similar to that of fixed income obligations of highest credit- quality category with maturity of upto one year. This rating should however, not be construed as an indication of the performance of the Mutual Fund scheme or of volatility in its returns. This rating should not be treated as a recommendation to buy, sell or hold the Units issued by the Mutual Fund.Past performance may or may not be sustained in future

Portfolio
Name of Instrument % to Net Assets
As on March 31, 2011
GILT Fund
All corporate ratings are assigned by rating agencies like CRISIL, CARE, ICRA, FITCH.Notes: Exposure to Thinly traded/Non traded securities and illiquid securities as defined in SEBI Regulations and Guidelines, is Nil
CENTRAL GOVERNMENT SECURITIES
Sovereign Rated Securities 94.72
OTHERS 5.28
Cash & Cash Equivalents
GRAND TOTAL 100.00
07.17% CGL 2015 62.60
08.08% CGL 2022 32.12
CBLO / Reverse Repo Investments 3.21
Net Receivable/Payable 2.07
Sector / Rating Percent
Sovereign Rated Securities 94.72
Cash & Cash Equivalent 5.28
Total 100.00
Fund Performance VS Benchmark Index
Edelweiss Gilt Fund - Growth
I-Sec Composite Gilt Index
(Returns in %)
3.22
5.17
4.033.54
6.41
4.74
0%
1%
2%
3%
4%
5%
6%
7%
6 months 1 Year Since Inception
Cash & Cash EquivalentSovereign Rated Securities
Asset Allocation
94.72% 5.28%
Rating Profile
Growth Option 10.7089Dividend Option 10.7089
NAV As on March 31, 2011 ` Per Unit ` Per Unit
Past performance may or may not be sustained in future.The above information is not necessarily indicative of future results and may not necessarily provide a basis for comparison with other investments.Inception Date is July 6, 2009. Since Inception returns are calculated on ̀ 10/- invested at InceptionReturns shown above are for Growth Option onlyPerformance of the Dividend Option for the investor would be net of the dividend distribution tax, as applicable.Returns less than one year are absolute and returns equal to or greater than one year are compounded annualized (CAGR).
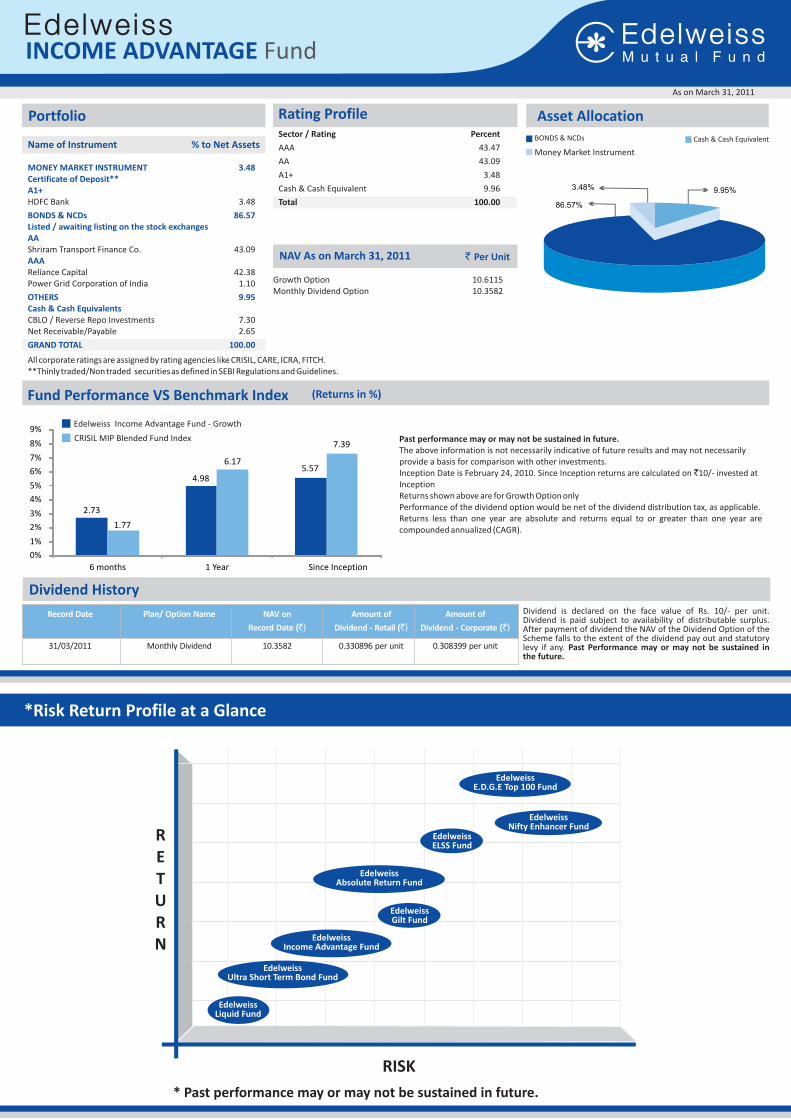
0.330896 per unit 0.308399 per unit
Record Date Plan/ Option Name NAV on Amount of Amount of
Record Date (`) Dividend - Retail (`) Dividend - Corporate (`)
31/03/2011 Monthly Dividend 10.3582
Fund Performance VS Benchmark Index (Returns in %)
Asset AllocationSector / Rating Percent
AAA 43.47
AA 43.09
A1+ 3.48
Cash & Cash Equivalent 9.96
Total 100.00
Rating Profile
NAV As on March 31, 2011 ` Per Unit
All corporate ratings are assigned by rating agencies like CRISIL, CARE, ICRA, FITCH.**Thinly traded/Non traded securities as defined in SEBI Regulations and Guidelines.
Portfolio
Name of Instrument % to Net Assets
Past performance may or may not be sustained in future.The above information is not necessarily indicative of future results and may not necessarily provide a basis for comparison with other investments.Inception Date is February 24, 2010. Since Inception returns are calculated on `10/- invested at InceptionReturns shown above are for Growth Option onlyPerformance of the dividend option would be net of the dividend distribution tax, as applicable.Returns less than one year are absolute and returns equal to or greater than one year are compounded annualized (CAGR).
Growth Option 10.6115Monthly Dividend Option 10.3582
As on March 31, 2011
INCOME ADVANTAGE Fund
Edelweiss Income Advantage Fund - Growth
CRISIL MIP Blended Fund Index
*Risk Return Profile at a Glance
RETURN
RISK
EdelweissLiquid Fund
NIFTY ENHANCER
EdelweissAbsolute Return Fund
EdelweissGilt Fund
EdelweissIncome Advantage Fund
EdelweissUltra Short Term Bond Fund
EdelweissELSS Fund
EdelweissE.D.G.E Top 100 Fund
EdelweissNifty Enhancer Fund
* Past performance may or may not be sustained in future.
MONEY MARKET INSTRUMENT 3.48Certificate of Deposit**A1+
BONDS & NCDs 86.57Listed / awaiting listing on the stock exchangesAA
AAA
OTHERS 9.95Cash & Cash Equivalents
GRAND TOTAL 100.00
HDFC Bank 3.48
Shriram Transport Finance Co. 43.09
Reliance Capital 42.38Power Grid Corporation of India 1.10
CBLO / Reverse Repo Investments 7.30Net Receivable/Payable 2.65
BONDS & NCDs Cash & Cash Equivalent
3.48%
86.57%
9.95%
Money Market Instrument
2.73
4.985.57
1.77
6.17
7.39
0%
1%
2%
3%
4%
5%
6%
7%
8%
9%
6 months 1 Year Since Inception
Dividend HistoryDividend is declared on the face value of Rs. 10/- per unit. Dividend is paid subject to availability of distributable surplus. After payment of dividend the NAV of the Dividend Option of the Scheme falls to the extent of the dividend pay out and statutory levy if any. Past Performance may or may not be sustained in the future.
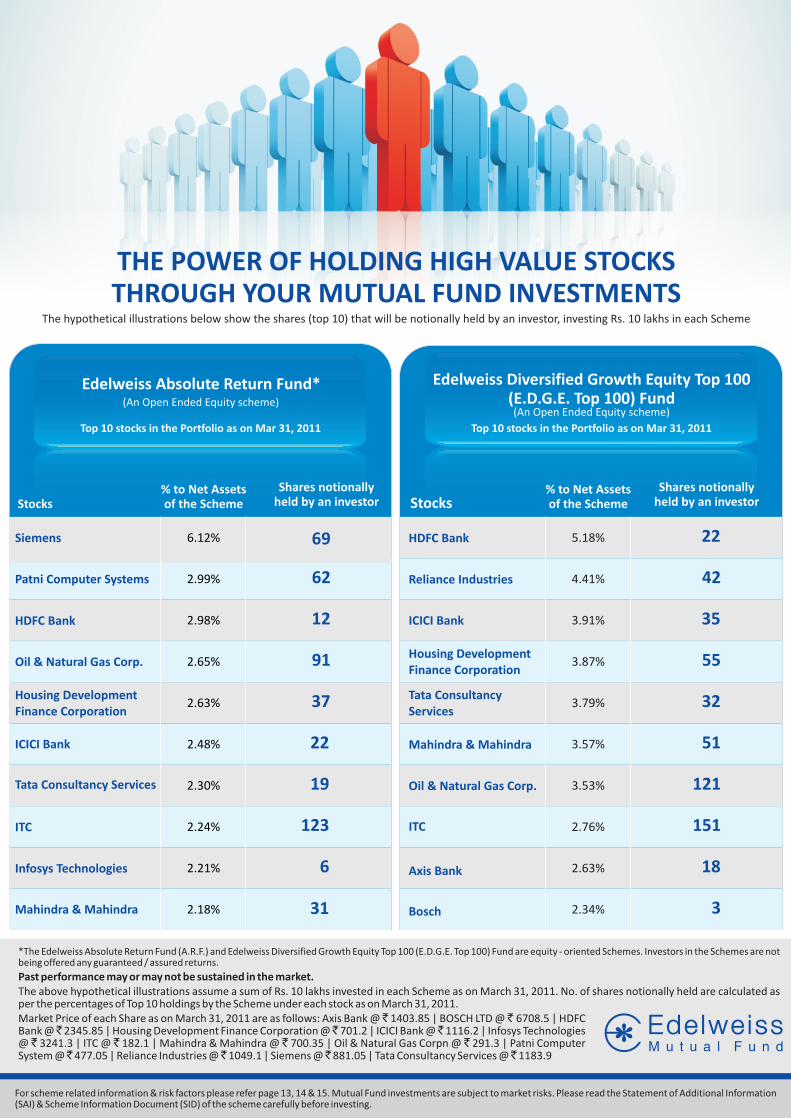
Stocks Stocks% to Net Assetsof the Scheme
Shares notionallyheld by an investor
Shares notionallyheld by an investor
HDFC Bank
Reliance Industries
Housing Development Finance Corporation
ICICI Bank
Tata Consultancy Services
Mahindra & Mahindra
Oil & Natural Gas Corp.
ITC
Axis Bank
Bosch
5.18%
4.41%
3.91%
3.87%
3.79%
3.57%
3.53%
2.76%
2.63%
2.34%
Edelweiss Diversified Growth Equity Top 100 (E.D.G.E. Top 100) Fund
Edelweiss Absolute Return Fund*
22
42
35
55
32
51
121
151
18
3
Top 10 stocks in the Portfolio as on Mar 31, 2011
(An Open Ended Equity scheme)(An Open Ended Equity scheme)
Top 10 stocks in the Portfolio as on Mar 31, 2011
% to Net Assetsof the Scheme
*The Edelweiss Absolute Return Fund (A.R.F.) and Edelweiss Diversified Growth Equity Top 100 (E.D.G.E. Top 100) Fund are equity - oriented Schemes. Investors in the Schemes are not being offered any guaranteed / assured returns.
Past performance may or may not be sustained in the market.The above hypothetical illustrations assume a sum of Rs. 10 lakhs invested in each Scheme as on March 31, 2011. No. of shares notionally held are calculated as per the percentages of Top 10 holdings by the Scheme under each stock as on March 31, 2011.Market Price of each Share as on March 31, 2011 are as follows: Axis Bank @ ̀ 1403.85 | BOSCH LTD @ ̀ 6708.5 | HDFC Bank @ ̀ 2345.85 | Housing Development Finance Corporation @ ̀ 701.2 | ICICI Bank @ ̀ 1116.2 | Infosys Technologies @ ` 3241.3 | ITC @ ` 182.1 | Mahindra & Mahindra @ ` 700.35 | Oil & Natural Gas Corpn @ ` 291.3 | Patni Computer System @ ̀ 477.05 | Reliance Industries @ ̀ 1049.1 | Siemens @ ̀ 881.05 | Tata Consultancy Services @ ̀ 1183.9
For scheme related information & risk factors please refer page 13, 14 & 15. Mutual Fund investments are subject to market risks. Please read the Statement of Additional Information (SAI) & Scheme Information Document (SID) of the scheme carefully before investing.
THE POWER OF HOLDING HIGH VALUE STOCKS THROUGH YOUR MUTUAL FUND INVESTMENTS
The hypothetical illustrations below show the shares (top 10) that will be notionally held by an investor, investing Rs. 10 lakhs in each Scheme
Siemens
Patni Computer Systems
HDFC Bank
Oil & Natural Gas Corp.
Housing Development Finance Corporation
ICICI Bank
Tata Consultancy Services
ITC
Infosys Technologies
Mahindra & Mahindra
6.12%
2.99%
2.98%
2.65%
2.63%
2.48%
2.30%
2.24%
2.21%
2.18%
69
62
12
91
37
22
19
123
6
31

Investment Objective
Type of the scheme
Fund Managers /Co-Fund Managers
Entry Load
Exit Load
Plans / Options
Minimum Investment
Minimum Redemption Amount
Benchmark
Ratios
NIL : In terms of SEBI circular no. SEBI/IMD/CIR No. 4/ 168230/09 dated June 30, 2009, no entry load will be charged by the Scheme to theinvestor effective August 1, 2009. Upfront commission shall be paid directly by the investor to the AMFI registered Distributors based on the investors' assessment of various factors including the service rendered by the distributor.
Plan A, Plan B and Plan CGrowth and Dividend option
•
• For Edelweiss ELSS Fund, redemption of unit can be made only after
`1/- or any number of units. For demat transactions, minimum redemption would be mandatorily 50 units.
3 years of lock-in period from the date of allotment of the Units
proposed to be redeemed.
However, there is no assurance that the investment objective of the scheme will be realized and the scheme does not assure or guarantee any returns.
Equity Schemes March 31, 2011
Risk Free Rate considered for the above = 7.982% pa. (7.8% 2020 GOI Bond) Please note: Standard deviation and Sharpe ratio are Annualized.^ Lower of sales or purchase divided by average AUM for last rolling 12 months. ##Current year to date ratio to average AUM. AMC reserves the right to change the expense ratio within the limits prescribed in the respective Scheme Information Document.
Default Option/Plan Default Plan : Plan ADefault Option : Growth
Minimum Additional Investment Amount
` `1,000/- and in multiples of 1/- thereafter.
For risk factors, please refer the last page
Date of Allotment
Average AUM (` in lakhs)
An open ended diversified equity scheme that seeks to generate capital appreciation, from a portfolio that is substantially constituted of equity securities and equity related securities of the 100 largest corporates by market capitalization, listed in India
Edelweiss Diversified Growth
Equity Top 100 (E.D.G.E. Top 100) Fund
Plan A - `1,000/- and multiples of `1/- thereafter Plan B - `1,00,000/- and multiples of `1/- thereafterPlan C - `10,00,000/- and multiples of `1/- thereafter
Standard deviation 17.07%Sharpe ratio 5.67Portfolio beta 0.85R squared 0.94Portfolio Turnover Ratio^ 4.10 times
##Total Expense Ratio Plan A 2.21% Plan B 2.11% Plan C 2.01%
An Open Ended Equity scheme
• On or before 365 days from date of allotment : 1%
• After 365 days from the date of allotment : Nil
May 20,2009
Mr. Paul Parampreet Experience: 5 years Managing the scheme since: February 4, 2010
Mr. Karthik VisvanathanExperience: Around 4 years Managing the scheme since : June 29, 2010
1642.41
An Open Ended Equity scheme
The primary objective of the Scheme will be to generate absolute returns with low volatility over a longer tenure of time. The Scheme will accordingly invest in arbitrage opportunities and debt and money market instruments on the one hand and in pure equity investments and equity derivative strategies on the other.
Edelweiss Absolute Return
Fund
Growth and Dividend option
Minimum of `5000/- per application & in multiples of `1/- thereafter
CRISIL MIP Blended Index
Standard deviation 4.24%Sharpe ratio 2.74Portfolio beta 0.09R squared 0.38Portfolio Turnover Ratio^ 3.67 times
##Total Expense Ratio 2.06%
Growth
Mr. Paul Parampreet Experience: 5 years Managing the scheme since: February 4, 2010
Mr. Karthik VisvanathanExperience: Around 4 years Managing the scheme since : January 18, 2011
August 20, 2009
4665.81
The primary objective of the scheme is to generate l o n g - t e r m c a p i t a l appreciation with an option of periodic payouts at the end of lock in periods from a portfolio that invests predominantly in equity and equity related instruments.
Edelweiss ELSS Fund
Growth and Dividend option
Minimum of `500/- per application & in multiples of `500/- thereafter
Standard deviation 14.07%Sharpe ratio 5.90Portfolio beta 0.69R squared 0.93
Portfolio Turnover Ratio^ 3.20 times
##Total Expense Ratio 2.50%
An Open Ended Equity Linked Savings scheme
NIL
`500/- per application & inmultiples of `500/-thereafter
December 30, 2008
Growth
Mr. Paul Parampreet Experience: 5 years. Managing the schemesince: February 4, 2010
Mr. Karthik VisvanathanExperience: Around 4 years Managing the scheme since : January 18, 2011
192.89
S&P CNX Nifty
An Open Ended Equity scheme
Edelweiss Nifty Enhancer
Fund
Plan A - `1,000/- and multiples of `1/- thereafter Plan B - `1,00,000/- and multiples of `1/- thereafterPlan C - `10,00,000/- and multiples of `1/- thereafter
Standard deviation 14.18%Sharpe ratio 5.32Portfolio beta 0.71R squared 0.95Portfolio Turnover Ratio^ 1.12 times
##Total Expense Ratio Plan A 1.60% Plan B 1.38% Plan C 1.59%
NIL
The primary objective of the Fund is to generate capital appreciation and income distribution by investing in a portfolio that endeavours to outperform the S & P CNX Nifty Index.
“Edelweiss Nifty Enhancer Fund” is only the name of the Fund. The scheme is not an Index Fund. T h e e q u i t y s t o c k s / weightages of the equity s to c ks i n t h e s c h e m e Portfolio may differ vis-à-vis the underlying stocks of Nifty Index.
Mr. Paul Parampreet Experience: 5 years Managing the schemesince: June 29, 2010
Mr. Karthik VisvanathanExperience: Around 4 years Managing the scheme since : January 18, 2011
Plan A (August 12, 2009)
Plan B (June 16, 2009)
546.75
Plan A, Plan B and Plan CGrowth and Dividend option
Default Plan : Plan ADefault Option : Growth
``1/- thereafter.
1,000/- and in multiples of
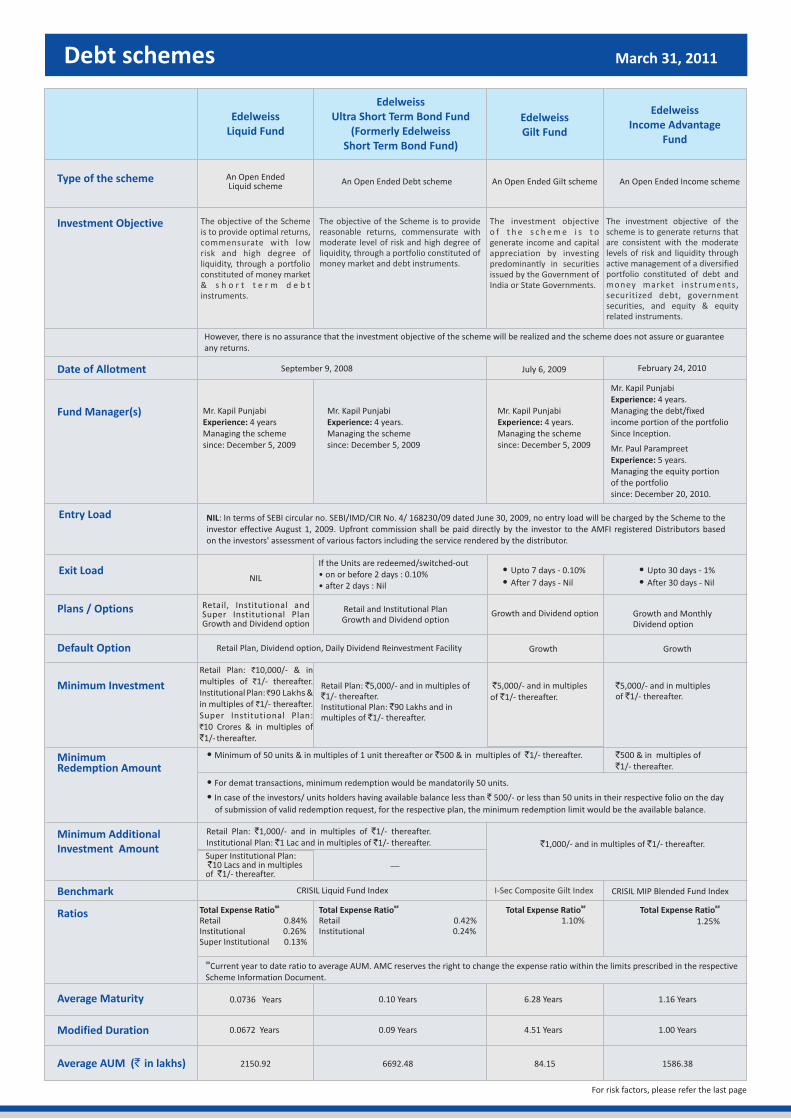
Debt schemes March 31, 2011
Investment Objective
Type of the scheme
Fund Manager(s)
Entry Load
Exit Load
Plans / Options
Minimum Investment
Minimum Redemption Amount
Benchmark
Ratios
Average Maturity
Modified Duration
An Open Ended Gilt scheme An Open Ended Income scheme
The objective of the Scheme is to providereasonable returns, commensurate with moderate level of risk and high degree of liquidity, through a portfolio constituted of money market and debt instruments.
The investment objective o f t h e s c h e m e i s t o generate income and capital appreciation by investing predominantly in securities issued by the Government ofIndia or State Governments.
Edelweiss Ultra Short Term Bond Fund
(Formerly Edelweiss Short Term Bond Fund)
Edelweiss Income Advantage
Fund
Edelweiss Gilt Fund
Edelweiss Liquid Fund
Mr. Kapil Punjabi Experience: 4 years.Managing the debt/fixed income portion of the portfolio Since Inception.
Mr. Paul Parampreet Experience: 5 years. Managing the equity portion of the portfoliosince: December 20, 2010.
Mr. Kapil Punjabi Experience: 4 years. Managing the scheme since: December 5, 2009
Mr. Kapil Punjabi Experience: 4 years Managing the scheme since: December 5, 2009
NIL: In terms of SEBI circular no. SEBI/IMD/CIR No. 4/ 168230/09 dated June 30, 2009, no entry load will be charged by the Scheme to theinvestor effective August 1, 2009. Upfront commission shall be paid directly by the investor to the AMFI registered Distributors based on the investors' assessment of various factors including the service rendered by the distributor.
If the Units are redeemed/switched-out • on or before 2 days : 0.10%• after 2 days : Nil
Retail, Institutional and Super Institutional PlanGrowth and Dividend option
Growth and Monthly Dividend option
Growth and Dividend option
Retail Plan: `10,000/- & in multiples of `1/- thereafter.Institutional Plan: ̀ 90 Lakhs & in multiples of `1/- thereafter. Super Institutional Plan: `10 Crores & in multiples of `1/- thereafter.
Retail Plan: `5,000/- and in multiples of `1/- thereafter.Institutional Plan: `90 Lakhs and inmultiples of `1/- thereafter.
`5,000/- and in multiples of `1/- thereafter.
• Minimum of 50 units & in multiples of 1 unit thereafter or `500 & in multiples of `1/- thereafter.
• For demat transactions, minimum redemption would be mandatorily 50 units.
• In case of the investors/ units holders having available balance less than ` 500/- or less than 50 units in their respective folio on the day
of submission of valid redemption request, for the respective plan, the minimum redemption limit would be the available balance.
I-Sec Composite Gilt Index
##Total Expense Ratio 1.25%
##Total Expense Ratio Retail 0.42%Institutional 0.24%
##Total Expense Ratio 1.10%
##Total Expense RatioRetail 0.84%Institutional 0.26%Super Institutional 0.13%
An Open Ended Debt scheme An Open Ended Liquid scheme
The objective of the Schemeis to provide optimal returns, commensurate with low risk and high degree of liquidity, through a portfolio constituted of money market& s h o r t t e r m d e b t instruments.
The investment objective of the scheme is to generate returns that are consistent with the moderate levels of risk and liquidity through active management of a diversified portfolio constituted of debt and money market instruments, securitized debt, governmentsecurities, and equity & equity related instruments.
Mr. Kapil Punjabi Experience: 4 years. Managing the scheme since: December 5, 2009
NIL• Upto 30 days - 1%
• After 30 days - Nil
Retail and Institutional PlanGrowth and Dividend option
`5,000/- and in multiples of `1/- thereafter.
CRISIL Liquid Fund Index CRISIL MIP Blended Fund Index
However, there is no assurance that the investment objective of the scheme will be realized and the scheme does not assure or guarantee any returns.
• Upto 7 days - 0.10%
• After 7 days - Nil
0.10 Years
0.09 Years
0.0736 Years
0.0672 Years
6.28 Years
4.51 Years
1.16 Years
1.00 Years
##Current year to date ratio to average AUM. AMC reserves the right to change the expense ratio within the limits prescribed in the respective Scheme Information Document.
Default Option Growth Growth
Minimum Additional Investment Amount ` `1,000/- and in multiples of 1/- thereafter.
Retail Plan: `1,000/- and in multiples of `1/- thereafter.Institutional Plan: `1 Lac and in multiples of `1/- thereafter.
Super Institutional Plan: `10 Lacs and in multiples of `1/- thereafter.
Date of Allotment September 9, 2008 February 24, 2010July 6, 2009
Retail Plan, Dividend option, Daily Dividend Reinvestment Facility
For risk factors, please refer the last page
`500 & in multiples of `1/- thereafter.
2150.92 6692.48 84.15 1586.38Average AUM (` in lakhs)

Investor Service Centers & Risk Factors
• Delhi- 603, 6th Floor, Mercantile House, 15 Kasturba Gandhi Marg, New Delhi – 110001 Tel - 011 - 4357 1105• Kolkata- Savitri Tower, 2nd Floor, 3A Upper Wood Street, Kolkatta - 700017 Tel - 033 - 4421 8800• Mumbai - 5th Floor, One Indiabulls Centre, Tower 1, 841, Senapati Bapat Marg, Elphinstone Road, Mumbai - 400 013 Tel - 022-40979821
Additional Edelweiss Mutual Fund Branches
All Mutual Fund and securities investments are subject to market risk and there can be no assurance that the schemes’ objectives will be achieved. As with any investment in securities, the NAV of the Units issued under the Scheme can go up or down depending on the factors and forces affecting the capital markets. The name of the schemes does not in any manner indicate either the quality of the scheme, its future prospects and return. Past performance of the Sponsor and their Affiliates/AMC/Mutual Fund & its Scheme(s) does not indicate the future performance of the Scheme and may not necessarily provide a basis of comparison with other investments. Investment in Mutual Fund Units involves investment risks such as trading volumes, settlement risk, liquidity risk, default risk including the possible loss of principal and uncertainty of dividend distribution. As the price / value / interest rates of the securities in which the scheme invests fluctuates, the value of your investment in the scheme may go up or down. Investors are not being offered any guaranteed / assured returns under any scheme of Edelweiss Mutual Fund.
Edelweiss Mutual Fund is set up as a Trust under the Indian Trusts Act, 1882 by Edelweiss Capital Limited. Sponsor: Edelweiss Capital Limited (ECL)(liability restricted to initial contribution of ̀ 1 Lac).Trustee: Edelweiss Trusteeship Company Limited (ETCL), a Company registered under the Companies Act, 1956 Investment Manager: Edelweiss Asset Management Limited (EAML), a Company registered under the Companies Act, 1956.Copy of the Statement of Additional Information (SAI) / Scheme Information Document (SID) and Key Information Memorandum (KIM) can be obtained from any of our Investor Services Centers as well as from our website www.edelweissmf.com. Mutual Fund investments are subject to market risks. Please read the Statement of Additional Information (SAI) & Scheme Information Document (SID) of the respective schemes carefully before investing.
: The view of the fund managers should not be construed as advice. Investors must make their own investment decisions based on their specific investment objectives and financial positions and using such AMFI qualified advisors as may be necessary. Opinions expressed in various articles are not necessarily those of Edelweiss Asset Management Limited (EAML) or any of its Directors, Officers, Employees and personnel. Consequently, the Edelweiss Asset Management Limited (EAML) or any of its Directors, Officers, Employees and personnel do not accept any responsibility for the editorial content or its accuracy, completeness or reliability and hereby disclaim any liability with regard to the same.
Statutory Details:
Disclaimer
Risk factors
Karvy Investor Service Centers
Agra - 0562-4000601 Ahmedabad - 079-26402967 / 079 -32997508 Ajmer - 0145-2628055 Aligarh - 0571-3200210 Allahabad - 0532-3240012 Ambala - 0171-
3200223 Amritsar - 0183-5053804 Anand - 02692 - 248980 Ankleshwar - 02646-227349 Asansol - 0341-2314624 Aurangabad - 0240-2363517 Balasore - 06782-
260503 Bangalore - 080 - 32008452 Bareilly - 0581-3200414 Baroda - 0265 - 6640870 Begusarai - 06243-243696 Belgaum - 0831-2402722 Behrampur (OR) - 0680 -
2208006 / 0680-3205010 Bhagalpur - 0641-3200584 Bharuch - 02642-2225022 Bhavnagar - 0278 - 3001004 Bhilai - 0788-3297477 Bhopal - 0755-4092706
Bhubaneswar - 0674 - 6534585 Bokaro - 06542 - 233330/32/30 Burdwan - 0342- 2550219 Calicut - 0495-3042083 Chandigarh - 0172-5071725 Chennai - 044
42028512 Cochin - 0484-4010273 Coimbatore - 9600930515 Cuttack - 0671-2613906 Dehradun - 0135 - 3205130 Dhanbad - 0326 - 6452027 Dharwad - 0836-2744207
Durgapur - 0343-3207052 Erode - 0424 2225615, 2225616 Faridabad - 0129-3213529 Gandhidham - 02836- 320585 Gaya - 0631-2220065 Ghaziabad - 0120-3100049
Goa - 0832 - 2426874 Gorakhpur - 0551-3200444 Guntur - 0863-2339094 Gurgaon - 0124-3210019 Guwahati - 0361 - 2203324 Gwalior - 0751-3201709 Haldwani -
05946-282635 Hissar - 01662-225845 Hubli - 0836-2232443 Hyderabad - 040 - 23312454 Indore - 0731 - 2553615 Jaipur - 0141- 2375039 Jalandhar - 0181-4634410
Jalgaon - 0257 - 2226761 Jalpaiguri - 03561-224207 Jammu - 9906296475 Jamnagar - 0288-2556260 Jamshedpur - 0657-2487045 Jhansi - 0510 - 2333685 Jodhpur -
0291-5103026 Jorhat - 0376 - 2301923 Kanpur - 0512-3209782 Karaikudi - 04565-237192 Karur - 04324-248871 / 04324-326048 Kharagpur - 03222- 242512/03222
253380 Kolhapur - 0231- 2653656 Kolkata - 033 - 24659297 Kota - 0744-2366145 Kottayam - 0481-2300868 Lucknow - 0522-3213115 Ludhiana - 0161-4648747
Malda - 03512-223190 Madurai - 0452-2600852 / 865 Mangalore - 0824 - 2494110 Margao - 0832-2734656 Mathura - 0565-3202615 Meerut - 0121-3202163
Mehsana - 02762 322559 Moradabad - 0591-3201272 Mumbai - 022 - 66235353 Muzaffarpur - 0621-3200474 Mysore - 0821 - 2438006 Nadiad - 0268-2563245
Nagpur - 0712 - 6619382 Nasik - 0253-6611395 Navsari - 02637-280367 New Delhi - 011- 43681700 Panipat - 0180-3200136 Patiala - 0175-5004349 Patna - 0612-
6453098 Pondicherry - 0413 - 4210640 Pune - 020-25533795 Raipur - 0771-2236696 Rajahmundry - 0883-2432076 Rajkot - 0281-3046532 Ranchi - 0651 - 2331320
Rohtak - 01262-318564 Rourkela - 0661-2510770 Saharanpur - 0132-3200125 Salem - 0427-2210835,2210983 Sambalpur - 0663-2522105 Shillong - 0364 - 2224186
Shimla - 0177-3206519 Shimoga - 08182-322577 Silchar - 03842-261229 Siliguri - 0353- 2526393 Surat - 0261-3042170 Tirunelveli - 0462-2335135 - 38 Tirupur - 0421-
2214221 Trichur - 0487 - 3246231 Trichy - 0431 - 4020227 Trivandrum - 0471 - 2725728 Udaipur - 0294-2429370 Valsad - 02632-258481 Vapi - 0260-3206404 Varanasi
- 0542-3204893 Vijayawada - 0866 2475126 Visakhapatnam - 0891- 2752917 Warangal - 0870-2553884
Karvy Computershare Private Limited
UNIT EMF ‘Madhura Estates’, Municipal No.1-9/13/C, Plot No.13 & 13 C, Survey No.74 & 75, Madhapur Village, Serilingampally Mandal & Municipality, Ranga Reddy District, Hyderabad – 500 081.Tel: 040-4030 8000
MUTUAL FUND:Edelweiss Mutual Fund Registered Office: 14th Floor Express Towers,Nariman Point, Mumbai - 400021Corporate Office: 5th Floor, One Indiabulls Centre, Tower 1, 841, Senapati Bapat Marg, Elphinstone Road, Mumbai – 400 013www.edelweissmf.com